
Cross-over from pyrene to acene optical and electronic properties: a theoretical investigation of a series of pyrene derivatives fused with N-, S, and O-containing heterocycles†
Hachem
Araji
a,
Maria
Nakhoul
 b,
Elio
Challita
c,
Nour
Barmo
a and
Brigitte
Wex
*a
b,
Elio
Challita
c,
Nour
Barmo
a and
Brigitte
Wex
*a
aLebanese American University, Department of Natural Sciences, Byblos, Lebanon. E-mail: brigitte.wex@lau.edu.lb
bLebanese American University, Department of Computer Science and Mathematics, Byblos, Lebanon
cLebanese American University, Department of Industrial and Mechanical Engineering, Byblos, Lebanon
First published on 25th June 2024
Abstract
Pyrene and acene derivatives are an important source of materials for optoelectronic device applications both as emitters and organic semiconductors. The mobility of major charge carriers is correlated with the coupling constants of the respective major charge carrier as well as the relaxation energies. Herein, we have applied range-separated density functionals for the estimation of said values. A series of five alkylated derivatives of pyrene laterally extended by heteroaromatic or phenyl groups were explored and contrasted to nascent pyrene, alkylated pyrene and tetracene. The ground state geometries along with absorption properties and relaxation energies are presented as well as a discussion of the suitability of the material toward hole and electron transport materials.
Introduction
Optoelectronic devices encompass photovoltaic cells for energy generation, light-emitting diodes for display applications in smart phones, computers, and televisions, as well as field-effect transistors, which are regulating units. Modern, light-weight, low cost and mass-produced consumer electronics require the use of organic materials based on carbon, hydrogen, oxygen, sulfur, nitrogen, etc. to serve as the needed semiconducting materials. In this context, specifically π-conjugated materials like polycyclic aromatics (pyrenes and acenes) as well as heterocyclic aromatics (thiophene, pyrrole, furan, and derivatives thereof) are important building blocks for the design of new organic semiconducting materials.1–5 Quantum calculations using Density Functional Theory (DFT) computations have become a vital component in the prediction and assessment of new materials to be used as semiconductors,6 light capturers, and light emitters.7 DFT calculations are widely used to understand and explain absorption and emission properties,8 charge-carrier mobilities9,10 and properties pertaining to electron and hole transfer.11 Thereby, transfer integral Hab and reorganizational energy (λ) have gained importance as a handle in data-mining approaches combined with machine-learning for material development.12,13Tetracene (TC) is a well-characterized material, which shows significant photosensitivity,14,15 and a bandgap of 2.4 eV.16TC is thus well-suited for solar energy conversion. The TC core serves as the donor building block and semiconductor. TC was utilized in field-effect transistors17,18 and was shown to have a field-effect mobility up to 0.4 cm2 V−1s−1.19 Substitutions on TC by electron-withdrawing groups was explored theoretically.20 By extension, the linear acene series of polycyclic aromatic hydrocarbons has been a vast arena for exploration of new materials.21 One approach, the stitching of 2, 3, 4, 5 or more benzene rings along a linear axis following the quest set-out by Clar22 and others, has culminated in the recent achievement of the synthesis of decacene.23 Prone to instabilities due to photochemical and oxidative stimuli, what remains challenging in this quest along these synthetic endeavors are approaches to stabilize these acene series by steric and electronic factors. Apart from extension along the linear axis by linear fusions,24 approaches into the 2nd and angular dimension,25–28 and the embellishment with substituents29,30 have resulted in stable semiconducting materials.26,31
Device performance then is apart from device geometry, preparation, and operational influences – fundamentally governed by the intrinsic mobility of charge carriers. Said carrier mobility in organic semiconductors in turn is determined by reorganization energies, and thereby the charge-transport rate (vide supra).32 Charge transfer is described by the Marcus electron transfer theory. Therein, the electron transfer rate is a function of Gibbs standard free energy for the reaction, electronic coupling, and reorganization energy.33,34
Reorganizational energies were used as a factor in the assessment of charge transfer rate in various optoelectronic materials, for example, azadipyrromethene-based metal complexes for solar cells,35 heteroatom-bridged benzothiazolyls for organic solar cells,36 high-performance host materials for phosphors in phosphorescent organic light-emitting diodes (PHOLEDs),37,38 and OLEDs.39
The two fundamental models to describe charge transport are hopping and band-like, the former increasing and the latter decreasing with temperature of the operating environment.40 Two materials with record-high charge-carrier mobility in single crystals are rubrene and pentacene. Both exhibit band-like transport when tested over a range of hundreds of Kelvin. Herein, we ondulated TC into the second dimension with alkyl groups and substitute both terminal phenyl rings along the linear backbone with either thiophene, furan, pyrrole, or thiazole. We apply DFT to shed light on the electronic and optical properties. Herein, we report on four heteroaryl-fused di-tert-butyl substituted materials (1a–d) as potential new materials for optoelectronic device applications, specifically 2,8-di-tert-butylpyreno[4,5-b:9,10-b′]dithiophene (1a),41 2,8-di-tert-butylpyreno[4,5-b:9,10-b′]difuran (1b), 2,8-di-tert-butyl-4,10-dihydropyrrolo[3′,2′:9,10]phenanthro[4,5-efg]indole (1c), 2,8-di-tert-butylpyreno[4,5-d:9,10-d′]bis(thiazole) (1d). Only compounds 1a, 1c, and 1d have previously been proposed or reported in patent applications.41,42 For compound 1b, only derivatives were reported.43 In addition, we report on the all hydrocarbon-derivative 2,9-di-tert-butyldibenzo[fg,op]tetracene (1e).44 Along with this series, pyrene (PY),45 2,7-di-tert-butylpyrene (2),46 and TC47 serve as benchmark hydrocarbons, Fig. 1.
 | ||
| Fig. 1 Overview of materials of interest, 1a–e along with reference compounds PY, 2, and TC. | ||
Based on the analysis of possible resonance structures, compound 1e can be referenced similar to anthracene with 2 moving Clar's sextet, or triphenylene-type with four localized Clar's sextets, Scheme 1.48,49
 | ||
| Scheme 1 Analysis for Clar's sextet in compound 1e. | ||
Results and discussion
The molecular geometries of target compounds 1a–1e, PY, 2, and TC were optimized using DFT under the application of the hybrid B3LYP50 functional and 6-31G(d,p)51 basis set. Then, the geometries were optimized using tuned, range-separated hybrid ωB97X-D functional52 and cc-pVTZ53 basis set, Table S2 and Table S3 (ESI†). The range-separation parameter (ω) was tuned using the ionization potential (IP) tuning procedure54 and yielded ω values in the order of approximately 0.16 for 1a, 1c, 1d, 1e and slightly higher for TC as shown by Bhatta for short, conjugated systems.16 Values closer and above the default value ω of 0.20052 were determined for 1b of 0.24 and PY of 0.3, Table 1.| Compound | 1a | 1b | 1c | 1d | 1e | PY | 2 | TC |
|---|---|---|---|---|---|---|---|---|
| Tuned ω value | 0.1564 | 0.2376 | 0.1564 | 0.1564 | 0.1564 | 0.3282 | 0.1564 | 0.1719 |
Gas phase photoelectron spectroscopy data revealed IP of 7.41 eV for PY22 and 6.97 eV (2Au) for TC55 indicating maximal deviation errors of 5% and below for PY and TC at this level of theory compared to experimental data. All compounds 1a–e have IPs in the range of TC rather than PY, whereby it is noted that the substitution of the 2,7-positions with tert-butyl groups on PY to obtain 2 most substantially effects the IP by 0.5 eV. This is a larger factor than the lateral fusion with phenyl groups when going from compound 2 to 1e. IPs of 1b, 1c, and TC are closest around 6.60 eV. The higher electronegativity of the heteroatom (O > N > S) in its role to stabilize the HOMO level56 and increasing the ionization potential shows herein a minuscule effect of 0.2–0.3 eV and no effect in the case of thiazole 1d compared to compound 1e, respectively. In other words, a modification of a phenyl unit to a thiophene, furan, or pyrrole lowers the IP by 0.2 to 0.4 eV, while the modification to a thiazole unit shows no effect on the IP.
In addition, the solid state ionization potential and the electron affinity are often approximated by cyclic voltammetry experiments.57 For example, the ionization potential of PY is determined at 1.3 V vs. SCE.58 Hansen reported the absolute potential for SCE as 4.698 eV.59 Therefore, the IP for PY converts to 6.0 eV. The IP of TC is reported as 0.72 V vs. SCE,60 which converts to 5.42 eV. Similarly, we report the oxidation potential of 2 to yield 5.5 eV based on cyclic voltammetry data, Fig. S1 (ESI†).
EA varies substantially ranging from 0.01 to 0.65 across compounds 1a–e, however, the values are not approaching the low value as TC. Thiophene and thiazole-fused pyrene units 1a and 1d have the lowest EA, not surprising since indole itself has an EA of 0.00351 eV.61 The substitution of PY with alkyl groups and then extension to four linearly fused phenyl ring backbone as observed in 1e has only a minimal effect on the EA level, Table 2. It is noted that for charged species, such as anions as well as for determining electron affinity, the inclusion of diffuse functionals in the level of theory is recommended to capture tail behavior of molecular orbitals62 as exemplified in other works characterizing the of acene series.63,64
| IPa [eV] | PESb [eV] | IPc | EA [eV] | EASd [eV] | E fund | |
|---|---|---|---|---|---|---|
| a IP and EA were computed by the difference of the total energy of the relaxed cation state and the relaxed ground state or the latter with relaxed anion state, respectively. b As determined by gas-phase photoelectron spectroscopy (PES). c Determined by cyclic voltammetry with conversion of Eabs(SCE) = 4.698 eV. d As determined by Electron attachment spectroscopy (EAS).61 e Difference between IP and EA. f As determined by cyclic voltammetry. | ||||||
| 1a | 6.74 | — | — | 0.52 | — | 6.22 |
| 1b | 6.63 | — | — | 0.29 | — | 6.34 |
| 1c | 6.52 | — | — | 0.01 | — | 6.51 |
| 1d | 6.91 | — | — | 0.65 | — | 6.26 |
| 1e | 6.92 | — | — | 0.36 | — | 6.56 |
| PY | 7.36 | 7.4122 | 6.058 | 0.44 | 0.5965 | 6.92 |
| 2 | 6.84 | — | 5.5f | 0.38 | — | 6.46 |
| TC | 6.60 | 6.9755 | 5.460 | 1.02 | 1.05866 | 5.58 |
Absorption properties
Time-dependent Density Functional Theory (TD-DFT) was carried out at tuned, range-separated hybrid ωB97X-D functional52 and cc-pVTZ53 basis set for level of theory. The first ten excited states in the series of compounds were computed. Data was analyzed using Gaussum and is presented in Fig. 2. For brevity and relevance, only excitations to S1 and S2 are shown below, Table 3. The complete data for all ten excited states of the compound series is presented in Tables S4–S8 (ESI†). While ωB97X-D is known to overestimate the exited state energy level S1 (1Lb) in PY67,68 leading to a narrow albeit correct ordering of the first two excited states, the modeled oscillator strengths match experimental observations.69 Particularly for PY the ordering of excited states is often observed as wrong, particularly when using TD-DFT. This observation was investigated by Graef and Martins utilizing a large range of functionals with the Def-2svp basis set. When utilizing the functional ωB97X-D, a correlation between changes in geometry and band ordering was drawn utlizing the value of Ω as a function of ω. The parameter Ω is defined as the ratio between the average length of bonds transversal to the central bond in pyrene and the average length of the bonds parallel to the central bond in pyrene, Table S1 (ESI†). In this limited case, the long-range correction along with the optimized geometry had an impact on the band ordering. Thus, correct ordering of the first two states was observed when the value of Ω > 1.020 as verfied using CCSD and MP2 computations. However, an underestimation of the absorption wavelength was observed with the functional ωB97X-D70 since PY exhibits an absorption maximum at 370 nm (extinction coefficient 1.2 × 10² M−1cm−1),71 compound 2 absorbs at 339 nm (dichloromethane),72 and TC (denoted as naphthacene in literature) absorbs at 471 nm (benzene, extinction coefficient 1.0 × 10⁴ M−1cm−1)71 in comparison to the computed values of 293 nm, 317 nm, and 440 nm (this study). Thus, the error ranged from 0.9 eV for PY to 0.3 eV for 2 and 0.2 eV for TC when comparing solution to gas phase data. | ||
| Fig. 2 Oscillator strength and absorption for 1a–e, PY, 2, TC modeled with ωB97X-D functional52 and cc-pVTZ53 basis set for level of theory in gas phase. | ||
| Transition | E vert | λ vert | f | μ ge | |||
|---|---|---|---|---|---|---|---|
| 1a | S0 | → | S1 | 3.81 | 326 | 0.153 | 1.642 |
| S0 | → | S2 | 3.86 | 321 | 0.117 | 1.235 | |
| 1b | S0 | → | S1 | 3.88 | 320 | 0.004 | 0.042 |
| S0 | → | S2 | 3.90 | 318 | 0.293 | 3.064 | |
| 1c | S0 | → | S1 | 4.04 | 307 | 0.006 | 0.056 |
| S0 | → | S2 | 4.13 | 300 | 0.255 | 2.519 | |
| 1d | S0 | → | S1 | 3.84 | 323 | 0.253 | 2.688 |
| S0 | → | S2 | 3.87 | 320 | 0.013 | 0.139 | |
| 1e | S0 | → | S1 | 3.93 | 315 | 0.012 | 0.129 |
| S0 | → | S2 | 4.10 | 302 | 0.099 | 0.989 | |
| PY | S0 | → | S1 | 4.24 | 293 | 0.0003 | 0.003 |
| S0 | → | S2 | 4.32 | 287 | 0.325 | 3.065 | |
| 2 | S0 | → | S1 | 3.91 | 317 | 0.004 | 0.045 |
| S0 | → | S2 | 3.92 | 316 | 0.378 | 3.927 | |
| TC | S0 | → | S1 | 2.82 | 440 | 0.07 | 1.016 |
| S0 | → | S2 | 3.72 | 333 | 0.004 | 0.039 | |
The quantum-mechanical transition dipole moment bridges the gap to the oscillator strength in classical observation.73 When considering the transition dipole moment, two absorber-types are distinguished herein, the pyrene-type (PY-type) and tetracene-type (TC-type). Characteristically for PY-type, the S2 ← S0 absorption band has a transition dipole moment significantly larger than for the S1 ← S0.67,69 Characteristic is the 1![[thin space (1/6-em)]](https://www.rsc.org/images/entities/char_2009.gif) :1 weighted configurational interaction between H−1 → LUMO and H → LUMO-1 for the lowest energy transition, while configurational interactions between HOMO → LUMO dominate in the higher energy component.74 For TC-type, the S1 ← S0 absorption band has a transition dipole moment significantly larger for than S2 ← S0. According to our calculation results obtained at the ωB97X-D52/cc-pVTZ53 level of theory, compounds 1b, 1c, 1e along with PY and 2 represent PY-type absorbers. For all these cases, the HOMO–LUMO (HL) transition accounts for >75%. Compounds 1a–d have transition dipole moments significantly larger than TC. Compounds 1a and 1d exhibit TC-type absorption character. However, only 1d shows the signatory absorption band with HOMO–LUMO contribution of >80%.
:1 weighted configurational interaction between H−1 → LUMO and H → LUMO-1 for the lowest energy transition, while configurational interactions between HOMO → LUMO dominate in the higher energy component.74 For TC-type, the S1 ← S0 absorption band has a transition dipole moment significantly larger for than S2 ← S0. According to our calculation results obtained at the ωB97X-D52/cc-pVTZ53 level of theory, compounds 1b, 1c, 1e along with PY and 2 represent PY-type absorbers. For all these cases, the HOMO–LUMO (HL) transition accounts for >75%. Compounds 1a–d have transition dipole moments significantly larger than TC. Compounds 1a and 1d exhibit TC-type absorption character. However, only 1d shows the signatory absorption band with HOMO–LUMO contribution of >80%.
Natural transition orbitals (NTOs)75,76 of compounds 1a–e, PY, 2, and TC were carried out in an effort to identify if just a single occupied (hole) and unoccupied (particle) NTO pair characterizes the nature of the first and second optically active singlet excited states. The eigenvalues for these transitions are listed in Table 4 and representative NTO pairs are shown in Tables S9–S11 (ESI†). This analysis revealed that only the TC S1 ← S0 transition is completely described by a single NTO pair with eigenvalue of 0.99 while 1a and 1d have eigenvalues for this transition of ≥0.8. The dominating particle for PY type transition in S2 ← S0 is observed for 1b, 1c, 1e, PY, and 2 with eigenvalues of ≥0.76. All frontier highest occupied transition orbital (HOTO) and lowest unoccupied transition orbital (LUTO) molecular orbital pictures of relevant transitions for S1 ← S0 and S2 ← S0 transitions were analyzed and are shown in Fig. S11–S13 (ESI†). Therein it becomes apparent that the TD-DFT results for this group of compounds are dominated by more than one relevant NTO pair. Elevating the level of theory to describe these polycyclic aromatic hydrocarbons, particularly acenes77–81 and higher acenes69 with a combined DFT multireference configurational interaction (DFT/MRCI) method exemplifies the complexity of these systems with multireference character and remains to be explored for the presented series.
| Hole | Particle | Hole | Particle | |
|---|---|---|---|---|
| S0 → S1 | S0 → S2 | |||
| H = occupied NTO, L = virtual NTO wherein H and L have the same eigenvalue. | ||||
| 1a | H−1 (0.16) | L + 1 (0.16) | H−1 (0.22) | L + 1 (0.22) |
| H (0.82) | L (0.82) | H (0.76) | L (0.76) | |
| 1b | H−1 (0.40) | L + 1 (0.40) | H−1 (0.11) | L + 1 (0.11) |
| H (0.58) | L (0.58) | H (0.89) | L (0.89) | |
| 1c | H−1 (0.39) | L + 1 (0f.39) | H−1 (0.15) | L + 1 (0.15) |
| H (0.58) | L (0.58) | H (0.82) | L (0.82) | |
| 1d | H−1 (0.10) | L + 1 (0.10) | H−1 (0.38) | L + 1 (0.38) |
| H (0.89) | L (0.89) | H (0.6) | L (0.6) | |
| 1e | H−1 (0.36) | L + 1 (0.36) | H−1 (0.21) | L + 1 (0.21) |
| H (0.60) | L (0.60) | H (0.74) | L (0.74) | |
| PY | H−1 (0.44) | L + 1 (0.44) | H−1 (0.13) | L + 1 (0.13) |
| H (0.53) | L (0.53) | H (0.85) | L (0.85) | |
| 2 | H−1 (0.42) | L + 1 (0.42) | H−1 (0.10) | L + 1 (0.10) |
| H (0.57) | L (0.57) | H (0.90) | L (0.90) | |
| TC | H (0.99) | L (0.99) | H−1 (0.45) | L + 1 (0.45) |
| — | — | H (0.52) | L (0.52) | |
According to the potential energy surface, the reorganizational energy of going from a neutral ground state to a charged ionic state (cation, anion) requires geometry relaxations.82 The sum of said terms add up to the total reorganizational energy, which among other factors ultimately has an impact on charge carrier mobility and thus device performance. Using DFT and the Dushin program by Reimers,83 we have assessed the reorganizational energies of compounds 1a–e, PY, 2, and TC at the ω-tuned ωB97X-D52/cc-pVTZ53 level of theory in this series, Tables 5 and 6.
| Compound | λ (1) rel meV | λ (2) rel meV | λ Tot meV | λ Tot meV |
|---|---|---|---|---|
| Neutrl to ANION | — | |||
| λ Reorganizational energies.a λTot meV for TC reported at B3LYP/6-31G(d,p) level of theory. | ||||
| 1a | 124 | 123 | 247 | — |
| 1b | 137 | 137 | 274 | — |
| 1c | 154 | 152 | 306 | — |
| 1d | 119 | 118 | 237 | — |
| 1e | 98 | 121 | 219 | — |
| PY | 192 | 191 | 383 | — |
| 2 | 142 | 142 | 284 | — |
| TC | 106 | 109 | 215 | 15120a |
| 16084a |
||||
| Compound | λ (1) rel meV | λ (2) rel meV | λ Tot meV | λ Tot meV |
|---|---|---|---|---|
| Neutral to CATION | — | |||
| λ Reorganizational energies.a λTot meV for TC reported at B3LYP/6-31G(d,p) level of theory. | ||||
| 1a | 97 | 97 | 194 | — |
| 1b | 92 | 92 | 185 | — |
| 1c | 107 | 106 | 213 | — |
| 1d | 100 | 100 | 200 | — |
| 1e | 99 | 98 | 198 | — |
| PY | 154 | 153 | 307 | — |
| 2 | 112 | 112 | 223 | — |
| TC | 83 | 85 | 167 | 10720a |
| 11384a |
||||
The calculations completed to assess reorganizational energies upon going from the neutral ground state to the anionic state showed that all five compounds exhibit reorganizational energies ranging from 0.2 to 0.3 eV. The highest value was observed for the compound containing the electronegative atom nitrogen, 1c with a value closest to pyrene. The remaining are around ∼100 meV lower in reorganizational energy compared to pyrene, Table 5. In comparison to TC, the reorganizational energies are on average 24% higher and for 1a–d all higher than the benzofused derivative 1e. Therefore, in this series, 1e is the most suitable candidate with only 2% higher reorganizational energy compared to TC.
The calculations completed to assess reorganizational energies upon going from the neutral ground state to the cationic state showed that all five compounds 1a–e exhibit similar values of reorganizational energies. All compounds showed a significantly lower reorganizational energy compared to PY, Table 6. In comparison to TC, the reorganizational energies are on average 19% higher. Interestingly here, though, is the fact that the reorganizational energies of 1a and 1b are 2% and 7% lower compared to 1e, respectively. This allows the hypothesis that replacing a benzene unit with a heterocyclic aromatic thiophene or furan, allows lowering the reorganizational energies in these types of compounds. Specifically, we have replaced an aromatic C![[double bond, length as m-dash]](https://www.rsc.org/images/entities/char_e001.gif) C bond with a –S– (1a) or –O– (1b). It was previously shown using photoelectron spectroscopy, that sulfur atom therein behaves like the CC bond and donates the necessary two electrons to the aromatic system,85 rendering 1a and 1b isoelectronic to 1e. Due to the lowest value, 1b is most suitable system from a reorganizational energy point of view.
C bond with a –S– (1a) or –O– (1b). It was previously shown using photoelectron spectroscopy, that sulfur atom therein behaves like the CC bond and donates the necessary two electrons to the aromatic system,85 rendering 1a and 1b isoelectronic to 1e. Due to the lowest value, 1b is most suitable system from a reorganizational energy point of view.
While there is a survey of omega values applied to TC in literature, no tuning of omega is reported on the functional ωB97X-D.16 The reorganizational energy of TC at the B3LYP/6-31G(d,p) level of theory is 107 meV by summing up the reorganization energies from the individual normal modes. Rossi reported reorganizational energies of the former type as 117 meV for TC using B3LYP/6-31G(d,p) level of theory.86
It is noted that the global hybrid functional B3LYP with a fixed, 20% amount of Hartree–Fock (HF) component is known to introduce a many-electron self-interaction error.87,88
The minimization of this error is mitigated by the use of range-separated hybrid functionals (LRC) such as ωB97X,89 and the revised version ωB97X-D, which includes empirical atom–atom dispersion corrections90 leading to the observed differences in reorganizational energies at these different levels of theory.
Normal mode analysis was completed to elucidate how individual normal modes are contributing to the total reorganization energy. Both the cation and anion relaxational energies were thus dispersed into the individual components under the application of the Dushin program by Reimers.83TC was previously characterized by the absence of frequencies below 1000 cm−1 toward the reorganizational energy.82
For the anionic relaxation energy all tabulated results are presented in Tables S12–S19 (ESI†). Specifically, one dominant vibrational mode is located above 1600 cm−1 for 1a–e, PY, and 2. This frequency mode is attributed to the CC stretching vibration of the aromatic core as visualized by GaussView. Only 1e is characterized by a low contribution and only TC is characterized again by absence of this mode, Fig. 3.
 | ||
| Fig. 3 Vibrational modes observed for the anionic relaxation energy for 1a–d (up) and 1e, PY, 2, and TC (down). Calculations were completed at the ωB97X-D52/cc-pVTZ53 level of theory. | ||
For the cationic relaxation energy all tabulated results are presented in Tables S20–S27 (ESI†). It is noted that the dominant vibrational modes are again located above 1600 cm−1 for all compounds except TC. As previously observed at the B3LYP/6-31G(d,p) level of theory, only few modes are active in TC rending the prediction of mobility to 0.67 cm2 V−1s−1 in a band-like transport mechanism.40 Specifically for TC single crystal, hole mobility reaches values close to μ ≃ 1cm2 V−1s−1 at room temperature from both, time of flight and I–V measurements.91 This high frequency mode is attributed to the CC bond stretching vibration, Fig. 4, of the aromatic core attributed to bandlike behavior for the mobility.40
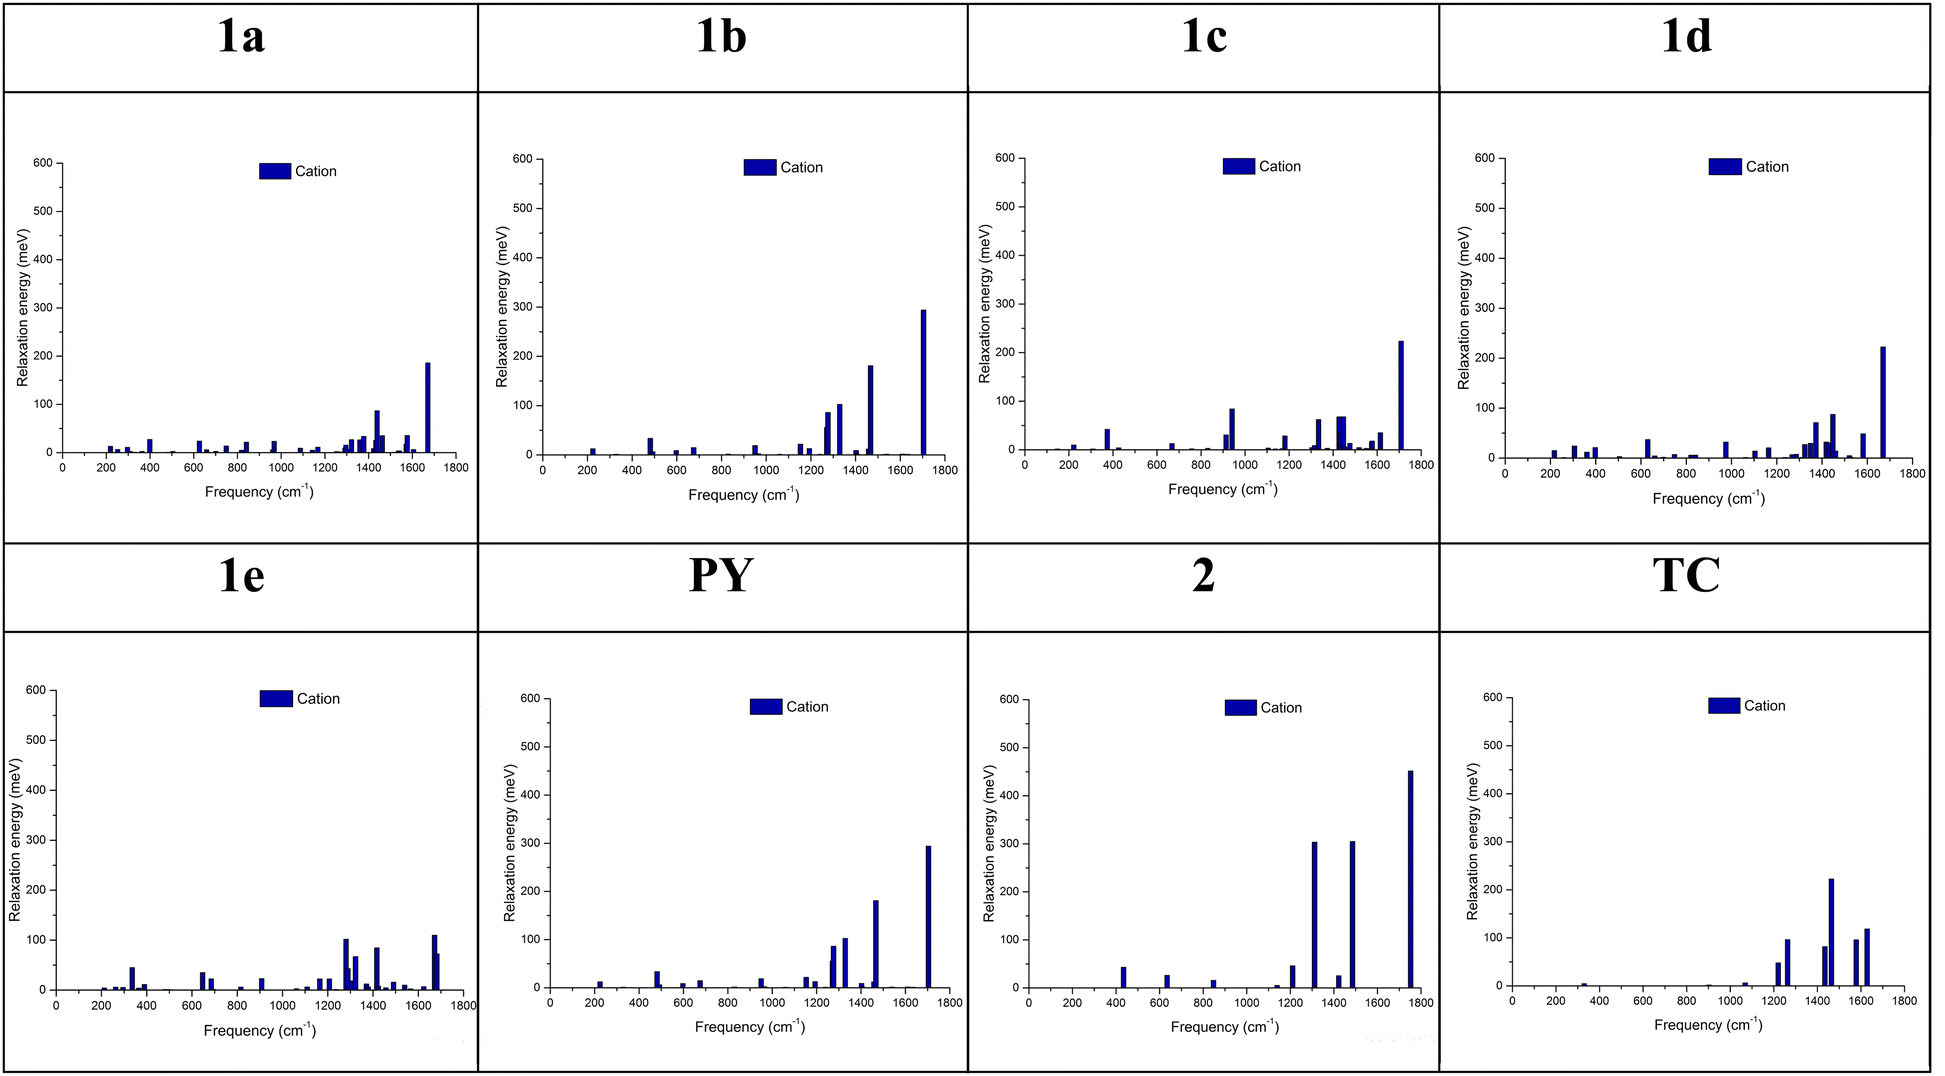 | ||
| Fig. 4 Vibrational modes observed for the cationic relaxation energy for 1a–d (up) and 1e, PY, 2, and TC (down). Calculations were completed at the ωB97X-D52/cc-pVTZ53 level of theory. | ||
In contrast to the others, 1e is characterized by the smaller contribution of this high-frequency band and a higher number of modes across the entire energy range of 200–1700 cm−1.
Conclusions
The modulation of the lateral chain of aromatics into heterocycles has a smaller effect on the IP when compared to substitution by alkyl groups. The EA is vastly influenced by the type of heterocyclic aromatic core used. The computational assessment of cationic reorganizational energies showed that the lateral fusion of heterocycles on pyrene narrowed the material's properties to the related tetracene compound. This effect was only mildly observed for anionic reorganizational energies. Normal-mode analysis using Dushin program revealed CC stretching to be the major contributor to large reorganizational energies for all except 1e.
Materials and methods
Quantum chemical calculations
All calculations were carried out using Gaussian09 (Revision D.01) and visualized using GaussView (Version 5.0.9).92 Compound structures were drawn in 2D using ChemDraw, converted to 3D using Chem3D module and energy was minimized using MM2 Chem3D (15.0). The geometries were distorted from planarity with ∼2–5° dihedral angles using GaussView and geometries were optimizations in the gas phase at the B3LYP/6-31G(d,p) level of theory. The achieved minima were verified by analysis of harmonic vibrational frequencies and verified by the absence of imaginary frequencies. Range-separated functional ωB97X-D52 was utilized along with the cc-pVTZ53 basis set with a tuned range-separation parameter ω. This parameter was tuned with the ionization potential (IP) tuning procedure54 as listed in Table 1 and was utilized for optimization and frequency analysis. The absence of negative frequencies was confirmed.TD-DFT calculations were carried out and reported at the tuned ωB97X-D52/cc-pVTZ53 level of theory and processed using GAUSSUM3.0.93
Electrochemistry
Non-aqueous reference silver wire electrode along with platinum wire counter electrode and glassy carbon working electrode were used in a solution of tetra-n-butylammonium hexafluorophosphate (0.1 M) in dichloromethane. Ferrocene (Fc) was used as internal standard. A scan rate of 0.1 V−1 s−1 with 1 × 10⁻⁵ A V−1 sensitivity was used.Reorganizational energies
Total reorganizational energies are the sum of the individual reorganizational energies for going from the neutral geometry to the cation or anion, respectively. Details for the procedure are outlined elsewhere.34,82,94 In short, the reorganization energy λ is computed as per eqn (1):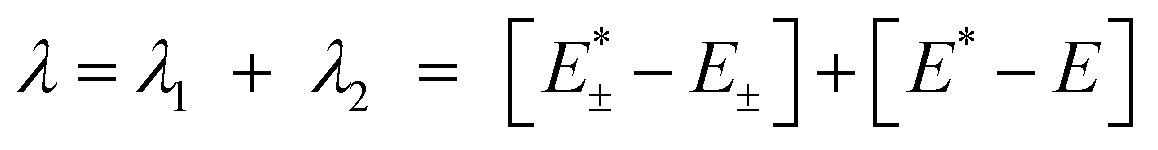 | (1) |
Relaxational energies
Relaxational energy λ82,84,95 and Huang–Rhys factors Sj were computed along a scan across the vibrational modes ωi under the application of the Dushin program provided by Reimers.83 The reorganizational energy is thus the sum of each vibrational mode as outlined in eqn (2) and this was carefully reviewed by Hsu.34| λ = Σλi = ΣSiħωi | (2) |
Since the analysis herein explores trends rather than absolute values, no scaling was done. Shall a scaling be desired, the computational data is recorded in the ESI† and a scaling of harmonic frequencies with a factor of 0.956 ± 0.002 for ωB97X-D52/cc-pVTZ53 as reported by the Computational Chemistry Comparison and Benchmark DataBase may be applied.96
Data availability
Codes Gaussian09 Revision D.01 and GaussView (Version 5.0.9) were purchased from Gaussian and used as received. Gaussum was downloaded from the website.93 Dushin code83 was provided by Prof. Reimers following email communication.Conflicts of interest
There are no conflicts to declare.Acknowledgements
B.W. is grateful for helpful discussions with Prof. Jean-Luc Brédas, Dr. Slava Coropceanu, Dr. Alexandr Fonari and Dr. Zilong Zheng. We thank Dr. Jean Takchi and Mr. Gaby El-Alam for writing scripts assisting data processing, as well as Mr. Jalal Possik and Mr. Elie Akoury for help in software installations. We acknowledge the PACE Cluster at Georgia Institute of Technology and the LAU Academic Computing Center Server. Financial support from Arab Fund for Economic and Social Development, National Council for Scientific Research (CNRS), the Royal Society of Chemistry (RSC) Research Fund and LAU School of Arts and Sciences Research and Development Fund for the PI are greatly appreciated.References
- N. Nicolaus, P. T. Franke and M. Lautens, Org. Lett., 2011, 13, 4236–4239 CrossRef CAS PubMed.
- I. Osaka, T. Abe, S. Shinamura and K. Takimiya, J. Am. Chem. Soc., 2011, 133, 6852–6860 CrossRef CAS PubMed.
- K. Niimi, S. Shinamura, I. Osaka, E. Miyazaki and K. Takimiya, J. Am. Chem. Soc., 2011, 133, 8732–8739 CrossRef CAS PubMed.
- G. D. Lilly, A. C. Whalley, S. Grunder, C. Valente, M. T. Frederick, J. F. Stoddart and E. A. Weiss, J. Mater. Chem., 2011, 21, 11492–11497 RSC.
- S. Shinamura, I. Osaka, E. Miyazaki, A. Nakao, M. Yamagishi, J. Takeya and K. Takimiya, J. Am. Chem. Soc., 2011, 133, 5024–5035 CrossRef CAS PubMed.
- G. Gryn'ova, K.-H. Lin and C. Corminboeuf, J. Am. Chem. Soc., 2018, 140, 16370–16386 CrossRef PubMed.
- A. P. Bella, R. V. Solomon, S. A. Vedha and J. P. Merlin, Theor. Chem. Acc., 2019, 138, 53 Search PubMed.
- J. Casado, M. Z. Zgierski, M. C. R. Delgado, J. T. L. Navarrete, M. Mas-Torrent and C. Rovira, J. Phys. Chem. C, 2007, 111, 10110–10118 CrossRef CAS.
- H. X. Li, R. H. Zheng and Q. Shi, J. Phys. Chem. C, 2012, 116, 11886–11894 CrossRef CAS.
- P. Prins, F. C. Grozema and L. D. A. Siebbeles, J. Phys. Chem. B, 2006, 110, 14659–14666 CrossRef CAS PubMed.
- F. L. Liu, E. Proynov, J. G. Yu, T. R. Furlani and J. Kong, J. Chem. Phys., 2012, 137, 114104 CrossRef PubMed.
- C. Kunkel, C. Schober, J. T. Margraf, K. Reuter and H. Oberhofer, Chem. Mater., 2019, 31, 969–978 CrossRef CAS.
- C. Schober, K. Reuter and H. Oberhofer, J. Phys. Chem. Lett., 2016, 7, 3973–3977 CrossRef CAS PubMed.
- J. Gundlach, L. Zhou, J. A. Nichols, J.-R. Huang and T. J. Jackson, Proc. IEEE, 2001, 34, 743 Search PubMed.
- R. Signerski and J. Kalinowski, Thin Solid Films, 1984, 121, 175–199 CrossRef CAS.
- R. S. Bhatta, G. Pellicane and M. Tsige, Comput. Theor. Chem., 2015, 1070, 14–20 CrossRef CAS.
- J. Gundlach, J. A. Nichols, L. Zhou and T. N. Jackson, Appl. Phys. Lett., 2002, 80 Search PubMed.
- L. A. Morrison, D. Stanfield, M. Jenkins, A. A. Baronov, D. L. Patrick and J. M. Leger, Org. Electron., 2016, 33, 269–273 CrossRef CAS.
- R. W. I. de Boer, T. M. Klapwijk and A. F. Morpurgo, Appl. Phys. Lett., 2003, 83, 4345–4347 CrossRef CAS.
- R. Oshi, S. Abdalla and M. Springborg, Comput. Theor. Chem., 2018, 1128, 60–69 CrossRef CAS.
- M. Stępień, E. Gońka, M. Żyła and N. Sprutta, Chem. Rev., 2017, 117, 3479–3716 CrossRef PubMed.
- E. Clar and W. Schmidt, Tetrahedron, 1976, 32, 2563–2566 CrossRef CAS.
- J. Kruger, F. Garcia, F. Eisenhut, D. Skidin, J. M. Alonso, E. Guitian, D. Perez, G. Cuniberti, F. Moresco and D. Pena, Angew. Chem., Int. Ed., 2017, 56, 11945–11948 CrossRef PubMed.
- P. Hu, J. Ye and H. Jiang, J. Mater. Chem. C, 2019, 7, 5858–5873 RSC.
- Y. Cao, Y. Liang, L. Zhang, S. Osuna, A. L. M. Hoyt, A. L. Briseno and K. N. Houk, J. Am. Chem. Soc., 2014, 136, 10743–10751 CrossRef CAS PubMed.
- L. Zhang, A. Fonari, Y. Liu, A. L. M. Hoyt, H. Lee, D. Granger, S. Parkin, T. P. Russell, J. E. Anthony, J. L. Brédas, V. Coropceanu and A. L. Briseno, J. Am. Chem. Soc., 2014, 136, 9248–9251 CrossRef CAS PubMed.
- E. K. Burnett, J. Ly, M. R. Niazi, L. Zhang, S. R. McCuskey, A. Amassian, D.-M. Smilgies, S. C. B. Mannsfeld and A. L. Briseno, Adv. Mater. Interfaces, 2018, 5, 170161–170168 Search PubMed.
- M. Rosenkranz, L. Graf, B. Büchner, M. Knupfer and A. A. Popov, J. Mater. Chem. C, 2023, 11, 12714–12729 RSC.
- X. Zhang, L. Jiang, H. Dong, X. Lu, H. Geng, R. Li and W. Hu, J. Photochem. Photobio. A, 2018, 355, 131–135 CrossRef CAS.
- G.-Y. Qin, X.-Q. Sun, P.-P. Lin, X. Wei, J.-F. Guo, W.-B. Cui, J.-X. Fan, H. Li, L.-Y. Zou and A.-M. Ren, J. Mater. Chem. C, 2023, 11, 13018–13029 RSC.
- L. Zhang, Y. Cao, N. S. Colella, Y. Liang, J. L. Brédas, K. N. Houk and A. L. Briseno, Acc. Chem. Res., 2015, 48, 500–509 CrossRef CAS PubMed.
- J. M. Granadino-Roldan, A. S. Garzon, G. Garcia, M. N. Moral, A. Navarro, M. P. Fernandez-Liencres, T. S. Pena-Ruiz and M. Fernandez-Gomez, J. Phys. Chem. C, 2011, 115, 2865–2873 CrossRef CAS.
- R. A. Marcus, J. Chem. Phys., 1956, 24, 966–978 CrossRef CAS.
- C.-P. Hsu, Phys. Chem. Chem. Phys., 2020, 22, 21630–21641 RSC.
- W. Senevirathna, C. M. Daddario and G. Sauvé, J. Phys. Chem. Lett., 2014, 5, 935–941 CrossRef CAS PubMed.
- R. Chen, Y. Wang, T. Chen, H. Li, C. Zheng, K. Yuan, Z. Wang, Y. Tao, C. Zheng and W. Huang, J. Phys. Chem. B, 2015, 119, 583–591 CrossRef CAS PubMed.
- M.-K. Yan, Y. Tao, R.-F. Chen, C. Zheng, Z.-F. An and W. Huang, RSC Adv., 2012, 2, 7860–7867 RSC.
- J. Li, Z. Nie, H. Li, Y. Peng, Z. Wang, Z. Mai and W. Zheng, J. Mater. Chem. C, 2015, 3, 4859–4867 RSC.
- G. Velmurugan, S. Angeline Vedha and P. Venuvanalingam, RSC Adv., 2014, 4, 53060–53071 RSC.
- G. Nan, X. Yang, L. Wang, Z. Shuai and Y. Zhao, Phys. Rev. B: Condens. Matter Mater. Phys., 2009, 79, 115203–115209 CrossRef.
- J.-I. Park, B. L. Lee and J. W. Chung, Organic semiconductor compound, and transistor and electronic device including the same, US 20120168726 A1, 2012.
- WO2007004799, 2007.
- T. Kojima, R. Yokota, C. Kitamura, H. Kurata, M. Tanaka, H. Ikeda and T. Kawase, Chem. Lett., 2014, 43, 696–698 CrossRef CAS.
- K. Y. Cheung, K. Watanabe, Y. Segawa and K. Itami, Nat. Chem., 2021, 13, 255–259 CrossRef CAS PubMed.
- C. S. Frampton, K. S. Knight, N. Shankland and K. Shankland, J. Mol. Struct., 2000, 520, 29–32 CrossRef CAS.
- J. Hu, D. Zhang and F. W. Harris, J. Org. Chem., 2005, 70, 707–708 CrossRef CAS PubMed.
- R. B. Campbell, J. M. Robertson and J. Trotter, Acta Crystallogr., 1962, 15, 289–290 CrossRef CAS.
- M. Sola, Front. Chem., 2013, 1, 22 Search PubMed.
- E. Clar, The aromatic sextet, Wiley-Interscience, London, 1972 Search PubMed.
- A. D. Becke, J. Chem. Phys., 1993, 98, 5648–5652 CrossRef CAS.
- R. Ditchfield, W. J. Hehre and J. A. Pople, J. Chem. Phys., 1971, 54, 724–728 CrossRef CAS.
- J. D. Chai and M. Head-Gordon, Phys. Chem. Chem. Phys., 2008, 10, 6615–6620 RSC.
- R. A. Kendall, T. H. Dunning and R. J. Harrison, J. Chem. Phys., 1992, 96, 6796–6806 CrossRef CAS.
- T. Stein, H. Eisenberg, L. Kronik and R. Baer, Phys. Rev. Lett., 2010, 105, 266802 CrossRef PubMed.
- W. Schmidt, J. Chem. Phys., 1977, 66, 828–845 CrossRef CAS.
- J. V. Metzger, in Comprehensive Heterocyclic Chemistry, ed. A. R. Katritzky and C. W. Rees, Pergamon, Oxford, 1984, pp. 235–331 Search PubMed.
- J. L. Brédas, Mater. Horiz., 2014, 1, 17–19 RSC.
- M. Gingras, V. Placide, J. M. Raimundo, G. Bergamini, P. Ceroni and V. Balzani, Chem. – Eur. J., 2008, 14, 10357–10363 CrossRef CAS PubMed.
- W. N. Hansen and G. J. Hansen, Phys Rev A, 1987, 36, 1396–1402 CrossRef CAS PubMed.
- S. A. Odom, S. R. Parkin and J. E. Anthony, Org. Lett., 2003, 5, 4245–4248 CrossRef CAS PubMed.
- National Institute of Standards and Technology, NIST, https://webbook.nist.gov.
- J. Chandrasekhar, J. G. Andrade and P. V. R. Schleyer, J. Am. Chem. Soc., 1981, 103, 5609–5612 CrossRef CAS.
- G. Malloci, G. Cappellini, G. Mulas and A. Mattoni, Chem. Phys., 2011, 384, 19–27 CrossRef CAS.
- G. Malloci, G. Mulas, G. Cappellini and C. Joblin, Chem. Phys., 2007, check, check.
- G. Chen and R. G. Cooks, J. Mass Spectrom., 1995, 30, 1167–1173 CrossRef CAS.
- E. S. Chen and E. C. M. Chen, Rapid Commun. Mass Spectrom., 2018, 32, 230–234 CrossRef CAS PubMed.
- J. R. Platt, J. Chem. Phys., 1949, 17, 484–495 CrossRef CAS.
- Pyrene shows absorption maxima at 273 nm (log e = 4.77), 306 nm (log e = 5.07), 320 nm (log e = 4.51), 335 (log e = 4.78) in cyclohexane.
- S. Shirai and S. Inagaki, RSC Adv., 2020, 10, 12988–12998 RSC.
- E. L. Graef and J. B. L. Martins, J. Mol. Model., 2019, 25, 183 CrossRef PubMed.
- R. A. Freidel and M. Orchin,Ultraviolet Spectra of Aromatic Compounds, John Wiley & Sons, Inc., New York, 1951 Search PubMed.
- J. Y. Hu, A. Paudel, N. Seto, X. Feng, M. Era, T. Matsumoto, J. Tanaka, M. R. Elsegood, C. Redshaw and T. Yamato, Org. Biomol. Chem., 2013, 11, 2186–2197 RSC.
- N. J. Turro, V. Ramamurthy and J. C. Scaiano, Modern Molecular Photochemistry of Organic Molecules, University Science Books 2010.
- J. Merz, J. Fink, A. Friedrich, I. Krummenacher, H. H. Al Mamari, S. Lorenzen, M. Haehnel, A. Eichhorn, M. Moos, M. Holzapfel, H. Braunschweig, C. Lambert, A. Steffen, L. Ji and T. B. Marder, Chem. – Eur. J., 2017, 23, 13164–13180 CrossRef CAS PubMed.
- R. L. Martin, J. Chem. Phys., 2003, 118, 4775–4777 CrossRef CAS.
- P. Kimber and F. Plasser, Phys. Chem. Chem. Phys., 2020, 22, 6058–6080 RSC.
- H. F. Bettinger, C. Tönshoff, M. Doerr and E. Sanchez-Garcia, J. Chem. Theory Comput., 2016, 12, 305–312 CrossRef CAS PubMed.
- M. Pinheiro, L. F. A. Ferrão, F. Bettanin, A. J. A. Aquino, F. B. C. Machado and H. Lischka, Phys. Chem. Chem. Phys., 2017, 19, 19225–19233 RSC.
- M. Pinheiro, Jr., A. Das, A. J. A. Aquino, H. Lischka and F. B. C. Machado, J. Phys. Chem. A, 2018, 122, 9464–9473 CrossRef PubMed.
- Y. Yang, E. R. Davidson and W. Yang, Proc. Natl. Acad. Sci. U. S. A., 2016, 113, E5098–E5107 CAS.
- M. Pinheiro, F. B. C. Machado, F. Plasser, A. J. A. Aquino and H. Lischka, J. Mater. Chem. C, 2020, 8, 7793–7804 RSC.
- M. Malagoli, V. Coropceanu, D. A. da Silva and J. L. Brédas, J. Chem. Phys., 2004, 120, 7490–7496 CrossRef CAS PubMed.
- J. R. Reimers, J. Chem. Phys., 2001, 115, 9103–9109 CrossRef CAS.
- V. Coropceanu, O. Kwon, B. Wex, B. R. Kaafarani, N. E. Gruhn, J. C. Durivage, D. C. Neckers and J.-L. Brédas, Chem. – Eur. J., 2006, 12, 2073–2080 CrossRef CAS PubMed.
- R. A. W. Johnstone and F. A. Mellon, J. Chem. Soc., Faraday Trans. 2, 1973, 69, 1155–1163 RSC.
- M. Rossi and K. Sohlberg, J. Phys. Chem. C, 2009, 113, 6821–6831 CrossRef CAS.
- A. Ruzsinszky, J. P. Perdew, G. I. Csonka, O. A. Vydrov and G. E. Scuseria, J. Chem. Phys., 2006, 125, 194112 CrossRef PubMed.
- P. Mori-Sánchez, A. J. Cohen and W. Yang, J. Chem. Phys., 2006, 125, 201102 CrossRef PubMed.
- R. Baer, E. Livshits and U. Salzner, Annu. Rev. Phys. Chem., 2010, 61, 85–109 CrossRef CAS PubMed.
- J. D. Chai and M. Head-Gordon, Phys. Chem. Chem. Phys., 2008, 10, 6615–6620 RSC.
- R. W. I. de Boer, M. Jochemsen, T. M. Klapwijk, A. F. Morpurgo, J. Niemax, A. K. Tripathi and J. Pflaum, J. Appl. Phys., 2004, 95, 1196–1202 CrossRef CAS.
- M. J. Frisch, G. W. Trucks, H. B. Schlegel, G. E. Scuseria, M. A. Robb, J. R. Cheeseman, G. Scalmani, V. Barone, B. Mennucci, G. A. Petersson, H. Nakatsuji, M. Caricato, X. Li, H. P. Hratchian, A. F. Izmaylov, J. Bloino, G. Zheng, J. L. Sonnenberg, M. Hada, M. Ehara, K. Toyota, R. Fukuda, J. Hasegawa, M. Ishida, T. Nakajima, Y. Honda, O. Kitao, H. Nakai, T. Vreven, J. A. MontgomeryJr, J. E. Peralta, F. Ogliaro, M. J. Bearpark, J. Heyd, E. N. Brothers, K. N. Kudin, V. N. Staroverov, R. Kobayashi, J. Normand, K. Raghavachari, A. P. Rendell, J. C. Burant, S. S. Iyengar, J. Tomasi, M. Cossi, N. Rega, N. J. Millam, M. Klene, J. E. Knox, J. B. Cross, V. Bakken, C. Adamo, J. Jaramillo, R. Gomperts, R. E. Stratmann, O. Yazyev, A. J. Austin, R. Cammi, C. Pomelli, J. W. Ochterski, R. L. Martin, K. Morokuma, V. G. Zakrzewski, G. A. Voth, P. Salvador, J. J. Dannenberg, S. Dapprich, A. D. Daniels, Ö. Farkas, J. B. Foresman, J. V. Ortiz, J. Cioslowski and D. J. Fox, Gaussian, Inc., Wallingford, CT, USA, 2009 Search PubMed.
- N. M. O'Boyle, A. L. Tenderholt and K. M. Langner, J. Comput. Chem., 2008, 29, 839–845 CrossRef PubMed.
- H. Ma, N. Liu and J.-D. Huang, Sci. Rep., 2017, 7, 331 CrossRef PubMed.
- C.-R. Zhang, V. Coropceanu, J. S. Sears and J.-L. Brédas, J. Phys. Chem. C, 2014, 118, 154–158 CrossRef CAS.
- NIST Computational Chemistry Comparison and Benchmark Database, NIST Standard Reference Database Number 101 Release 22, https://cccbdb.nist.gov/, Accessed April 2024, 2024.
Footnote |
| † Electronic supplementary information (ESI) available: Data supporting this article have been included as part of the ESI.† The xyz files of DFT-optimized compounds 1a–e, PY, 2, and TC are available in the SI. See DOI: https://doi.org/10.1039/d4cp01625d |
| This journal is © the Owner Societies 2024 |