 Open Access Article
Probing the modulation in facilitated diffusion guided by DNA–protein interactions in target search processes†
Diljith
Thonnekottu
 a and
Debarati
Chatterjee
 *ba
*ba
aDepartment of Physics, Indian Institute of Technology Palakkad, Kerala 678623, India
bDepartment of Chemistry, Indian Institute of Technology Palakkad, Kerala 678623, India. E-mail: debarati@iitpkd.ac.in
First published on 18th June 2024
Abstract
Many fundamental biophysical processes involving gene regulation and gene editing rely, at the molecular level, on an intricate methodology of searching and locating the precise target base pair sequence on the genome by specific binding proteins. A unique mechanism, known as ‘facilitated diffusion’, which is a combination of 1D sliding along with 3D movement, is considered to be the key step for such events. This also explains the relatively much shorter timescale of the target searching process, compared to other diffusion-controlled biophysical processes. In this work, we aim to probe the modulation of target search dynamics of a protein moiety by estimating the rate of the target search process, and the statistics of the search rounds and timescales accomplished by the 1D and 3D motions, based on first passage time (FPT) calculations. This is studied with its characteristics getting influenced by various given conditions such as, when the DNA is rigid or flexible, and when the target is placed at different locations on the DNA. The current theoretical framework includes a Brownian dynamics simulation setup adopting a straightforward coarse-grained model for a diffusing protein on DNA. Moreover, this theoretical analysis provides insights into the complex target search dynamics by highlighting the significance of the chain dynamics in the mechanistic details of the facilitated diffusion process.
1 Introduction
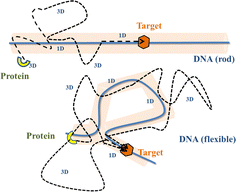
Precise binding of a protein complex at a specific target site on the genome, out of millions of available base-pair sequences, is a salient feature governing many fundamental biophysical events such as translation, transcription, and genetic regulation.1–10 A careful analysis into all these processes, can pinpoint a common key step, which is, finding the correct location or a specific target sequence on the DNA or genome by a protein complex while executing random movements in the cellular media. Thus, a strategy involving an efficient target search mechanism5,11–16 governed by several non-specific as well as specific interactions finally leads to the protein binding at the target location, in spite of the random thermal movement at the molecular level. Manipulating the target search process thus obviously provides a preliminary tool to control the overall dynamics of many fundamental life processes such as genetic regulations, protein synthesis, and many other biophysical events linked to the mechanistic details of these. Even though a large number of experimental and theoretical studies3,8,17–35 have been performed to capture the microscopic details of this process, often, the target-searching process in vivo is found to be more complex. Also, the outcomes are largely guided by the modulation of the mechanistic details and the target searching process getting influenced by the specific nature of the cellular environment or media for a given condition of the concerned systems.20,25,27,36–43 As a whole, thus, a unified description and a generalized analysis of the molecular details of target searching still remains an unresolved yet important question to address in biophysics.12,13,25,37–40,44–47 Theoretically, the target searching events and their associated dynamics, similar to many other biophysical processes at the molecular level, can be well rationalized with a ‘Reaction–Diffusion’ formalism48–50 where the reaction kinetics is governed by the slower rate-determining step, i.e., the diffusive motion of the reactive species. Likewise, the target searching process, which is typically observed for transcription or gene regulation, is found to be mainly guided by diffusive dynamics at the microscopic level. However, as a simple diffusive formalism fails to capture its physically reliable fast timescale for the same, a facilitated diffusive mechanistic pathway (Fig. 1) involving 1D motion along with a 3D diffusion has been theoretically conceptualized to explain the mechanism successfully.5,11–14,24,28–30,51–56 The search strategy based on facilitated diffusion thus enables to capture the faster and more efficient target search method and hence seems to provide a reliable general technique for the target search process. Following the analytical model for the facilitated diffusion and expressing the 1D and 3D diffusion timescales with simple scaling arguments based on dimensional analysis, the target search time, τtst can be derived as,12,57–61 | (1) |
 is the 1D diffusional search time,
  is the 3D diffusional search time with V as the volume for the overall searched space or the cellular volume, D1D and D3D are the diffusion constants related to the 1D and 3D diffusive phases respectively, and
  defines the number of search rounds i.e., the number of transitions that have been made by the protein complex, from 3D to 1D phase, having L as the overall contour length of the DNA and ls as the sliding length on DNA. The second set of expressions above simply connects τtst with other explicit and relevant parameters, revealing microscopic details, which, in turn, also provide the tools to probe the target search dynamics at the molecular level.
The recent in vivo study by Knight et al.62 on genome interrogation by the CRISPR-Cas9 protein complex includes the mechanistic details of the target search process by the Cas9 protein complex. Motivated by the key features observed in the target search process via diffusion through the complex and crowded chromatin network, we suggested an exact analytical theory63 on the basis of facilitated sub-diffusive dynamics in the context of genome interrogation and gene editing. The analytical expressions of survival probability, intensity correlation function, and mean square displacements of the protein complex which were obtained from our theory seem to agree well with the data recorded experimentally.63 Nevertheless, it is important to note here that our previous work provides a coarse-grained analytical model, where the target search process is investigated considering the target on a rigid rod-like DNA, which contemplates that the chain dynamics of DNA is ignored while accounting for the dynamics of the target search process, for the sake of simplicity. Recent theoretical works by Brackley et al.,57,58 provide detailed Brownian dynamics simulations involving a protein modeled as a spherical particle and a target located on polymeric DNA. These studies provide a clear picture of the mechanistic details of the target search process that mimics cellular events on the microscopic length scale. Moreover, another recent study by Tyagi and Cherayil64 provides a detailed calculation where the enhancement in the target search process has been predicted with an analytical framework based on the dynamically disordered Brownian motion of the protein, highlighting the importance of the chain dynamics synchronous with this stochastic target search event. Thus, motivated by these studies and with a view to tackling the limitations of our previous study, and also with a background of the simulation tools that have been implemented in Brackley et al.'s work,57,58 we construct an MD simulation set up of the coarse-grained models for the target search process in the current work, to decode complexities in the mechanistic details, and to develop a physical intuition of the search events at the molecular level. Thus, we aim to revisit the target search process with a computational design while focusing on quantifying the dynamics at various given conditions that have been incorporated as constraints in the simulation set-up and present a comparative study at these conditions. In order to gain insights into the mechanistic details, we focus on parameters such as target search rate, 1D and 3D diffusive time scales, and the number of search rounds in each 1D or 3D phase, which were obtained directly from our simulation trajectories following the (FTP) first passage time analysis method.65,66 Thus, implementing this analysis, the current work probes the modulation of the target search process in a quantified manner. The alteration in the characteristic features of the target search rate profiles is recorded by inducing flexibility in the polymeric backbone of DNA. The contrasting features observed in the rate profiles, accounting for the DNA chain behaving as a rigid rod or as a flexible chain, were drawn in a quantified manner. Moreover, alterations in the rate profiles were also recorded by placing the target at different locations (mainly at the end or at the center) for both rigid and flexible DNA chains. The modulation in the nature of the rate profiles, highlights the modulation in the underlying molecular dynamics of the target search process. Thus, the current study successfully captures the complex dynamical features of the target search process at the microscopic level.
In this paper, the following section on the theoretical background introduces the key equations and formal methodology to mathematically interpret the physical picture of the target searching process via MD simulation while also summarizing the methods to compute the target search rates for various interactions at different given conditions. The subsequent section on results provides the immediate quantified output of the theoretical framework, where we support our results with an analysis of various contrasting realistic scenarios. Finally, the significance of this work and future directions are presented in the Discussion and conclusions section.
2 Theoretical background
Prior to binding at the target site on a DNA molecule, the protein molecule executes a random search for the target site. As mentioned earlier, the combined dynamics involving intermittent three-dimensional (3D) bulk diffusion and one-dimensional (1D) sliding along the DNA, known as ‘Facilitated Diffusion’ (Fig. 1) leads to an optimal and efficient search technique which also leads to the well-suited physiological timescales for this fundamental biophysical process.3,7,54 Here, we probe this mechanism of facilitated diffusion by a coarse-grained simulation framework and present a quantitative estimation to capture the modulation of the target search dynamics for varying target locations allied with different flexibility in the DNA backbone. The current theoretical model focuses on the target search process via a coarse-grained Brownian dynamics simulation set up in LAMMPS.67 The search process of a single protein in DNA has been visualized by the diffusive search dynamics of a spherical colloidal particle for a target located on a bead-spring model of a polymeric chain as DNA (behaving either as a rigid rod or a flexible chain). In the current work, all parameters are expressed in (reduced) Lennard-Jones (LJ) units where we consider ε = 1, σ = 1.68The time evolution of the position q = [x, y, z] of any coarse-grained particle (either a protein or a monomeric bead in DNA), is obtained by solving the Langevin equation69–71 of the form,
m![[q with combining umlaut]](https://www.rsc.org/images/entities/b_i_char_0071_0308.gif) = −∇Uint − γ = −∇Uint − γ![[q with combining dot above]](https://www.rsc.org/images/entities/b_i_char_0071_0307.gif) + ξ(t), + ξ(t), | (2) |
 | (3) |
 | (4) |
 | (5) |
 | (6) |
As the current work focuses on probing the mechanistic details of the search technique by facilitated diffusion governed by the various interactions, this was ensured in the simulation by suitably designing specific and nonspecific interactions that closely resemble and mimic realistic biophysical events at the microscopic level. It is also important to note here that interactions between the DNA chain and the protein particle, whether specific or nonspecific, are determined by eqn (4), and remain consistent regardless of the rigid or flexible case. Thus, any such target search events start with the random movement of the coarse-grained protein particle, while the end of the event is marked by the binding at the target site on the DNA. In general, the non-specific interactions among the protein and all the monomeric beads (except the target bead) have been incorporated by ε = εns value in ULJ (eqn (4)), varying from 1.0 to 8.0(kBT) in steps of 0.5(kBT) and modulation in dynamics has been estimated. However, the binding interaction or the specific interaction has been ensured in the simulation, where the interaction between only the specific target bead and protein has been kept at a much higher value, i.e., ε = εs = 100(kBT) (eqn (4)). The relevance of this special choice of non-specific binding interaction energies, εns and specific interaction energy, εs are explained here in detail:
(a) Non-specific interaction: by construction, this interaction, εns = 1 to 8(kBT) is acting between the coarse-grained protein particle, and all the beads on the DNA (except the target bead) and is prevalent up to its LJ cut-off length, rc = 2.5σ (a specified radius around each DNA bead). In this study, each DNA bead has the same cut-off radius for εns, generating a cylindrical interaction volume around the chain Fig. 3 and 4. The nonspecific interaction is designed with a range of values such that we can probe a search strategy by varying the interactions arising from all the beads, but at the same time, the interaction energy is not so high that it can perturb the essential nature of the facilitated diffusion-driven random search. For example, the non-specific interaction value should not be so high that the coarse grain particle becomes sticky to the DNA, and at the same time, it should not be so low that the particle only shows bulk diffusion. Thus, non-specific interaction is chosen to have a range of optimized values in which the modulation in the rate profiles can be captured for rigid as well as flexible DNA. Moreover, these optimized values are chosen to reproduce the target search as a facilitated diffusion process driven by a combined 1D and 3D search strategy.
(b) Specific interactions: by construction, this interaction, εs = 100(kBT) acts only between the target site bead and the coarse-grained protein particle and is prevalent only up to its LJ cut-off length, rc = 2.5σ (a specified radius around that target site bead Fig. 3 and 4). Thus, during a typical search process, if the coarse-grained particle comes inside this cutoff radius around the target site bead, it spontaneously gets driven to the target site and continues to remain close to the target bead (which is the minima of this 100kBT energy well, according to the εs construction), indicating irreversible binding at the target site. Thus, the interaction arising from the specific target site or the specific binding energy has been kept sufficiently high (almost 10 times higher than the nonspecific interactions) to ensure, (i) the irreversible binding of the protein at the target site which is distinctly different from the nonspecific interactions, εns and (ii) that the end of all such target search trajectories is enforced by the irreversible binding at the specific site.
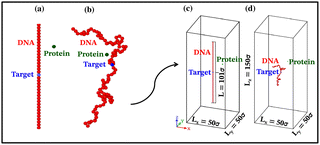
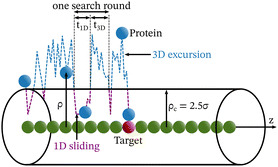
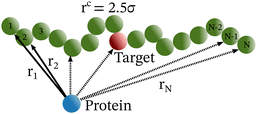
Each simulation is run until the protein binds to the target bead on the DNA for the first time, and the target search time, which is determined using first passage time analysis,65,66 and the trajectory of the protein is recorded. A time step of δt = 0.001τ was used in all simulations, where τ = (mσ2/ε)1/2, and we have taken m = 1 for all the particles. All the post-processing of the trajectories, as well as the generation of graphical representations, have been done using Python72 scripts. For each simulation, the protein's initial position is chosen at a random location inside the simulation box. We considered a DNA molecule of length L = 101σ, and used a rectangular simulation box (Lx = Ly = 50σ, Lz = 150σ) with periodic boundary conditions (Fig. 2). Eqn (2) is integrated numerically using the velocity-Verlet algorithm,73 for the cases in which the DNA is either rigid or flexible.67 We have also varied the target location from the center to one end of the DNA to see the effect of the target location on the target search dynamics. The variation of mean target search time,τmtst including the mean 1D and 3D search timescales per search round such as 〈τ1D〉, 〈τ3D〉, the profile of average number of search rounds, 〈Ns〉, and target search rate k, are recorded for various non-specific interaction strengths from 1000 independent simulations including rigid and flexible backbones of DNA. To characterize the 1D and 3D diffusion time scales and the number of search rounds Ns associated with each of these 1D and 3D phases from the simulation trajectory, we defined a suitable cutoff length scale. In the case of rigid DNA, we considered a cylindrical volume around the DNA having a radius of ρc = 2.5σ (Fig. 3) which is practically the cut-off for the non-specific interaction. At each time, we monitored the protein's axial distance, ρ, from the DNA. If ρ < ρc, i.e. the protein is inside the cylindrical volume, we consider that the protein is executing one-dimensional diffusion, being close to the DNA backbone. On the other hand, if ρ > ρc, i.e. the protein is outside the cylindrical volume, we consider that the protein is executing three-dimensional or bulk diffusion. Similarly, in the case of a flexible DNA during the target search process, at any instant of time, if the distance of the protein from any of the beads is found to be less than rc = 2.5σ, it is considered as 1D diffusion, being close to the DNA contour, whereas, if the distance of the protein from all of the beads is found to be more than rc = 2.5σ, it is considered as bulk or 3D diffusion (Fig. 4). Thus, this construction of the cutoff length scale is crucial, as it allows us to characterize and differentiate the 1D and 3D phases and their associated timescales. The protein's motion between successive 1D or 3D diffusional motions has been counted as one search round. For example, if a protein executes 1D diffusion and consecutively joins to 3D diffusion and then returns to 1D diffusive phase again, that will be counted as one search round. The protein executes multiple search rounds before finding and then binding with its target. Thus, for every such whole target search run, the average time taken per search round for 1D and 3D motions were recorded along with the number of search rounds, Ns. All the measurements were computed by averaging over 1000 simulation trajectories.
3 Results
The complex dynamics of the target search process, which are regulated by a multitude of interactions, have been investigated in several prior theoretical and experimental studies15,16,56,74 through the characterization of the target search timescale (τtst) or rate (k). Specifically, these studies indicated that increased salt concentrations shield electrostatic interactions between proteins and DNA, favoring a dominant 3D diffusion search mode, whereas, conversely, lower salt concentrations promote a 1D sliding motion of the protein along the DNA contour. This phenomenon has been replicated by adjusting the strength of non-specific interactions, εns in this simulation framework with the coarse-grained model. This primarily, enables us to observe the impact of non-specific interactions on the 3D or 1D diffusive timescales, giving us a better understanding of the complex search dynamics in a quantified manner. Moreover, the modulation in rate profiles by manipulating these interactions reflects the change in the dynamical features of the target search process, highlighting the intricate characteristics of the target search process relevant to realistic biophysical scenarios.In the current study, we analyze the dynamics of the target search process by implementing the above-described MD simulation scheme and also probe the mechanistic details of facilitated diffusion by estimating the target search rate (k) and the parameters that majorly contribute to the quantification of k, such as τ1D (1D diffusive time per search round), τ3D (3D diffusive time per search round), and the profile of the number of search rounds (Ns) with the variation in the εns. This approach also highlights the modulation in the target search dynamics for different target locations and with different flexibility in the DNA backbone and hence, provides physical insights into the mechanistic details of the target search dynamics at various given conditions at the microscopic level.
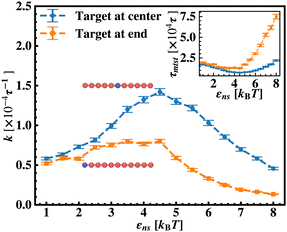
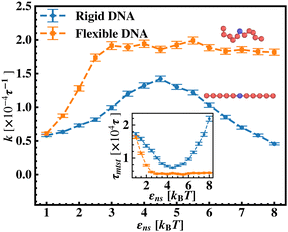
To probe into the different factors that might influence or alter the target search dynamics, firstly, we focus on the impact of different locations of the target on the DNA, as shown in Fig. 5. With a simplified coarse-grained framework of a rigid rod-like DNA, the rate of target search (k) by the diffusing protein moiety is calculated for various εns, acting between the diffusing protein and the DNA. Considering two different target locations, such as, (a) in the middle and (b) at the end of a rigid coarse-grained conformation of DNA, the trends in the target rate profiles (k) were calculated and are depicted in Fig. 5. The overall trends in both cases remain qualitatively the same with common characteristics: (i) at the lower value of εns (εns < 4.5), k initially increases with εns, (ii) at an intermediate value of εns, k reaches a maximum, and, (iii) on further increase in the value of εns (εns > 5), k decreases. As k varies inversely to the mean target search time, i.e. k has been estimated by quantifying τmtst from the simulation trajectories. Thus the graphical representation in the inset of Fig. 5 represents the variation in the mean target search time τmtst, with the variation of εns for two target locations on the rigid DNA. As we have mentioned earlier, following the concepts from the facilitated diffusive dynamics, the mean target search time (τmtst) is computed as,
 | (7) |
The above equation shows that τmtst is proportional to a combination of two terms where the second term is the summation of τ1D, and τ3D, and the first term is the number of rounds (Ns) associated with each of the diffusing phases of 1D or 3D. Hence, we pose a question here: how does the relative proportion of τ1D, τ3D and Ns get adjusted at the microscopic level at different interaction strengths to maintain an efficient search strategy for two different target locations?
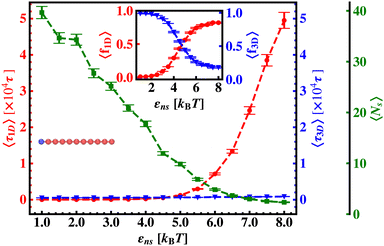
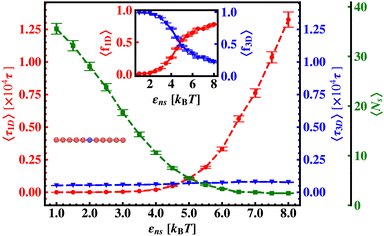
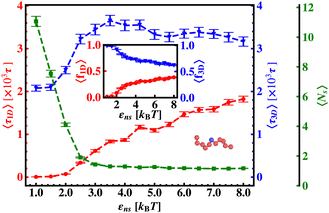
Thus, next, we move on to estimate τ1D, τ3D and Ns from the MD simulation trajectory while varying εns to rationalize the rate profiles obtained in the above-mentioned cases. The estimated variations of averaged τ1D, τ3D and Ns with εns have been represented in Fig. 6, for the target located at the end, and in Fig. 7 for the target located in the middle of a rigid DNA, respectively. In both cases, irrespective of the two different target locations, the profiles of 〈τ1D〉, 〈τ3D〉 and 〈Ns〉 show, qualitatively, a similar trend. Thus in Fig. 6 and in Fig. 7, on increasing εns, 〈τ1D〉 (red ‘–•–’ line) and 〈τ3D〉 (blue ‘–▼–’ line) the plots show overlapping trends, signifying equal contributions with similar variations up to around εns = 4.5 while 〈τ1D〉 shows a monotonic increase for εns > 4 and 〈τ3D〉 remains almost unaffected on further increase in the value of εns. Additionally, 〈Ns〉 (green ‘–■–’ line) shows a gradual decrease on increasing εns up to εns = 6 and decays to very close to 1 after a further increase in εns. Moreover, the insets in Fig. 6 and 7 show the variation of the average of the fractions of one dimensional search time, 〈f1D〉 = 〈τ1D/(τ1D + τ3D)〉 (red ‘–•–’ line, inset) and three dimensional search time, 〈f3D〉 = 〈τ3D/(τ1D + τ3D)〉 (blue ‘–▼–’ line, inset) with εns, depicting the the dominant search mode with the variation of εns in both the cases. Thus, these graphical representations show that for the target location at the end or the middle of the rigid DNA, τmtst is dominated by 〈Ns〉 up to around εns = 4.5 while, τmtst is dominated by 〈τ1D〉, in the range of εns > 4.5. This justifies the trend in k in Fig. 5 as k shows an initial increase up to around εns = 4.5 due to the decrease in τmtst having 〈Ns〉 (or 〈f3D〉) as the determining factor that goes down sharply with the increase in εns. Whereas, after εns = 4.5, k decreases due to the increase in τmtst having 〈τ1D〉 (or 〈f3D〉) as the major contributing factor governing the overall target search timescale at this range due to the monotonic increase in 〈τ1D〉 with εns.
The significance of the above-observed trend is physically intuitive. It is important to note that, the lower values of εns signify a weakly held diffusing protein executing a predominantly 3D bulk-diffusive search along with an intermittent 1D motion along the contour, and higher values of the εns, on the other hand, correspond to a strongly held diffusing protein close to the DNA contour, implying a dominant 1D search. As a consequence, search dynamics with the lower εns, is realized with intermittent 3D diffusion, which in turn enhances the overall target search rate. On the contrary, a low value of the number of search rounds is caused by higher εns, suppressing the chances of intermittent 3D bulk diffusion, and the target search mechanism in that case is driven by the slower and rate-limiting 1D diffusing dynamics. Thus, the trend of the rate of target search with the variation in εns in Fig. 5 probes the variation of the target search rate with a change-over in the search strategy at the microscopic level from an intermittent 1D-cum-3D diffusive motion to a predominant 1D diffusive motion. Also, it is important to note here that, the rate of target search is found to be always higher when the target is placed at the center. When the target site is spatially close to the starting position of the diffusing protein, the probability of hitting the target site by the random effects (majorly by sliding) becomes higher. This, as a whole, reflects on the higher target search rate for a protein searching for a centrally located target than the case of a target located at the end of the DNA. In addition, the observation that the rate profiles for the center and the end-located targets are similar, indeed confirms the optimized target strategy as a combination of 3D and 1D search, (known as ‘Facilitated Diffusion’) irrespective of the spatial location of the target on DNA.
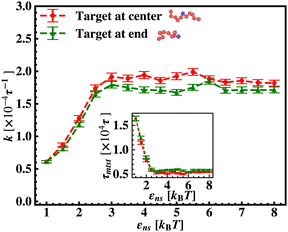
After these above studies, we move on to our investigations on the flexible DNA cases. Similar to the rigid DNA situation observed before, in Fig. 8, we estimate k with εns for flexible DNA with two different placements of the targets, one at the center and the other at the end. Although the overall k profile with εns is qualitatively different for the flexible case, the higher rate profile due to the better accessibility during the 1D motion, when the target is placed at center position is evident here as well. However, the flexibility of the backbone, allowing the intersegmental transfers or other complex search strategies involving facilitated diffusion, tends to mask the impact of the proximity effect in locating the target, unlike in the rigid DNA case. Furthermore, to analyze the rate profile with the flexible DNA case in detail, in Fig. 9 the target search rate (k) has been quantified with various interactions εns when the target site is located at the middle of the flexible DNA (orange ‘–■–’ line). The rate profile for the centrally located target on a rigid DNA (blue ‘–•–’ line) has been also shown as a function of εns in the same graph, for the sake of comparison. The trend of k with the target on flexible DNA in Fig. 9 is found to have higher values for any εns than that of the rigid DNA case. Hence, the graphical representation clearly indicates that k can be further manipulated to have a higher value by inducing flexibility in the DNA backbone in the same range of the εns without altering any other system parameters. In addition, this graph also depicts that, in the initial and low range of εns, k in both the cases, having the target on a rigid and on a flexible DNA respectively, shows an increase with εns. In particular, for the flexible DNA case, k reaches a maximum at εns = 3 while for the rigid case, k reaches a maximum at εns = 4.5. Thus, the threshold value of εns at which the maxima of k is achieved is lower for the flexible DNA case than for the rigid DNA case. Moreover, k for the flexible DNA case is found to saturate at that maximum k value even for a further increase in εns, unlike, the case of rigid DNA where k decreases for further increase in εns after attaining the maxima. Thus, these observations confirm that the flexibility in the backbone plays a significant role in modulating the search strategy driven by facilitated diffusion.
In continuation of our effort to probe the mechanistic details for the flexible DNA case, we estimate average τ1D, τ3D and Ns with εns, involving a protein and a target placed on a flexible coarse-grained configuration of DNA in Fig. 10. Similar to what has been observed previously for a rigid DNA case, here, when the DNA has a flexible backbone, it is found that the average number of search rounds, 〈Ns〉 decreases with εns. However, 〈Ns〉 saturates to the minimum value, i.e. close to 1 when εns = 2.5 which clearly corresponds to a lower value of εns than that for a rigid DNA case. Also, unlike in the rigid DNA case, 〈τ1D〉 and 〈τ3D〉 profiles no longer contribute equally at early εns values, and apparently, they vary following two independent trends, with the variation of εns. While 〈τ3D〉 saturates to a value after εns = 2.5, following an initial increase, the low lying 〈τ1D〉 shows a monotonic increase with εns in the given range of εns. In addition, the inset of Fig. 10, shows the variation of the average of the fractions of one dimensional search time, 〈f1D〉 = 〈τ1D/(τ1D + τ3D)〉 (red ‘–•–’ line, inset) and three dimensional search time, 〈f3D〉 = 〈τ3D/(τ1D + τ3D)〉 (blue ‘–▼–’ line, inset) with εns, depicting the the dominant search mode with the variation of εns for the centrally located target on a flexible DNA case. It is important to note that, unlike in the case of a rigid backbone, in the case of a flexible backbone, the profile of 〈τ3D〉 makes the higher contribution to τmtst, remaining always above the 〈τ1D〉 profile and hence contributing predominantly to the measurements of k as the rate-limiting slower step. These observations also summarize that the overall target search rate (k) for a flexible backbone increases as τmtst initially decreases (with 〈Ns〉) as the most dominant term with a decreasing trend up to (εns = 2.5), and then saturates to the maxima value with 〈τ3D〉 remaining as the most contributing term at the range of εns > 2.5.
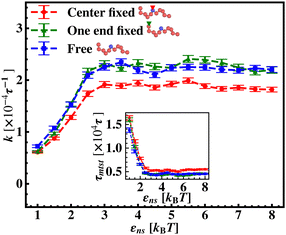
To further reconfirm these special characteristics of k that are attributed to the flexibility in the backbone, having originated solely from the overall chain dynamics and not from the position evolution of the target bead alone, we further look into the details of the simulation by designing three special cases to study. These are (i) the target position on the backbone is spatially fixed at a certain location, however, the other beads follow chain-dynamics (ii) the end-located bead of the flexible DNA is fixed spatially and the target bead follows the usual chain dynamics and (iii) where none of the beads including the target are spatially fixed and hence all the beads including the target beads are allowed to evolve spatially following the polymeric dynamical equation. In all three cases (Fig. 11) the nature and the trend of the rate profiles look very similar, which implies that the overall target search process is immensely impacted by a common feature i.e. the overall chain-dynamics in the flexible DNA case, and a similar underlying strategy for the target search process is operative by non-specific interactions in all these above cases.
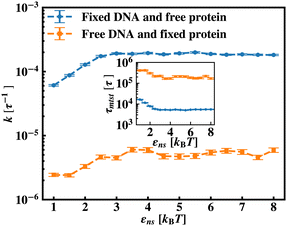
Continuing on a similar background, we design another study to provide evidence for this unique characteristic of the target search profile arising due to the flexibility of the backbone. In Fig. 12 we compute k with εns, obtained by conducting a comparative study in two situations where, (a) we keep only the central target bead spatially fixed, allowing the remaining beads of the DNA chain to spatially evolve as per the flexible chain dynamics and the protein particle diffuses freely and searches for the target, and (b) the coarse-grained protein particle remains spatially fixed, allowing all the DNA beads including the target to diffuse following the chain dynamics. The plots signify that the rate profile is lower when the DNA chain is allowed to evolve spatially keeping the protein particle spatially fixed, indicating the slower dynamics of the DNA chain to a protein coarse-grained particle, as expected. This study depicts the individual and explicit impact of the different relative dynamics of the protein and the DNA chain on the target search dynamics for a flexible DNA scenario, while confirming the commonality in the k profile, and hence, in the microscopic target search strategy arising due to flexibility.
Along with these quantified results, the snapshots (created using OVITO visualization software75) obtained from the current simulation trajectories also highlight the modulation in the mechanistic steps of the target search process at various given conditions. The snapshots obtained from our coarse-grained simulation at a specified εns (=4.5), indicate that the target search process involving flexible DNA also shows a contrasting feature from the target search process involving rigid DNA. Thus, the time-series snapshots in Fig. 13 during the target search process involving the coarse-grained protein and flexible DNA conformation, report a dynamically evolving loop or trapped structure of the flexible chain of DNA around the protein once the protein comes close to the DNA contour unlike the target search process involving rigid DNA (Fig. 14). Moreover, these snapshots also reveal that this 1D diffusive motion of the protein along the DNA contour continues until it merges with the target, being trapped and hence evolving in the looped structure with the DNA backbone chain dynamics (Fig. 13).
Therefore, this investigation reveals an optimized target search strategy for each εns, where, unlike in the case of rigid DNA where 3D diffusion is predominant only at lower values of εns and 1D diffusion is at higher values of εns, for the flexible DNA case, 3D diffusion prevails as a dominant feature across the entire given range of εns. It is also noteworthy, that the 1D diffusion timescale of flexible DNA is on one hand impeded by its confinement within the looped structure of the chain, while on the other hand, when entrapped within the dynamically evolving looped structure, the 1D diffusion timescale becomes faster by intertwining with the chain dynamics and getting facilitated via the intersegmental transfer or other complex flexible chain property. Thus, the observed phenomenon can be explained as a dynamic disorder-driven stochastic resonance64 amplification, specifically involving both the timescales such as one-dimensional movement of protein and chain dynamics, simultaneously in an intricate way.
4 Discussion and conclusions
The current work presents an extensive study of the microscopic details of the target search process with a theoretical analysis based on Brownian dynamics simulation. With a straightforward coarse-grained model of a protein and a polymeric model of DNA, the molecular insights of the target search events governed by facilitated diffusion are probed here. In reality, the molecular interaction originating due to the electrostatic interaction between the negatively charged DNA and the positively charged amino acids of proteins is the major governing factor for this facilitated diffusion-driven target search mechanism. Replicating that feature, a typical target search event has been conceptualized by the elementary event as starting with the diffusive motion driven by the non-specific interactions on the DNA chain, by the searcher protein particle, while the end of the event is marked with the binding at a specific target site placed on the DNA. In addition, following the previous relevant studies, where a dominant 3D diffusion search mode has been enhanced by shielding the electrostatic attraction at higher salt concentrations,15,16,36,56,74 and on the other hand, the protein's 1D sliding motion along the DNA contour has been amplified by lowering salt concentrations, this probing technique has been theoretically reproduced in our coarse-grained model by manipulating the non-specific interaction strength, εns, and monitoring the impact on the search rate k. Thus, (Fig. 6 and 7) the target search process involving the rigid DNA depicts the dominant search modes as the 3D diffusive phase at lower εns and 1D diffusive phase, as the dominant search modes at higher εns, which validates and remain consistent with the previous studies. To faithfully reproduce this nature the interaction between DNA beads and protein we have used, ULJ, represented by Lennard-Jones potential (eqn (3) and (4)), where, the ε term is characterized by two main different types of interactions, such as εns (acting between protein and all DNA beads, except the target bead) and εs (acting between protein and specific target bead on DNA). This very fact signifies that εns, even though is represented here by a short-range potential,58 can replicate the effect of the long-range electrostatic potential,15,16,41,56 and hence can successfully capture the essential observation and impact on the facilitated diffusion due to the electrostatic interaction. Hence by varying non-specific interactions, we manipulate the facilitated diffusion or the search mode and probe the target search event by quantifying the k profile with this εns.Thus, the search technique, influenced by facilitated diffusion was ensured in the simulation by suitably designing the specific and nonspecific interactions that closely resemble the physical realization and intuition at the microscopic level. Moreover, to capture the realistic details of the facilitated diffusion by identifying the 3D and 1D phases explicitly, we consider a cutoff distance from each bead on DNA (rigid, Fig. 3 or flexible, Fig. 4). This construction of the cutoff length scale, which in turn naturally follows from the specific construction of the nature of the potential, is the unique and crucial feature of the current work and hence, it can be concluded that the quantification of the search strategy obtained following this framework is a direct method to analyze the protein's motion under the effect of various nonspecific and specific interactions. This cutoff value is implemented in such a way that it can serve as a distinctive boundary between the 3D diffusive bulk phase and 1D diffusive sliding phase close to the DNA contour. In the main, therefore, this allows us to see how various interactions affect the 3D or 1D diffusive timeframe, which improves our comprehension of the intricate dynamics of the search in a quantitative way. Thus, during the search process, the location of the protein moiety and also the distance from the cutoff length, obtained from the simulation trajectory can be used to characterize the 3D or 1D diffusive phases of the protein. After characterizing the diffusive motion and its associated timescales in these two phases, the overall modulation in the rate of target search due to the change of locations of the targets was computed. Moreover, the overall study was substantiated by carrying out a comparative analysis by considering two cases, when the target is placed on a rigid DNA and on a flexible DNA, respectively. Fig. 15 shows the graphical representations of the modulation in the 〈Ns〉 and 〈lS〉 of the protein moiety for a rigid and flexible DNA, which have been measured separately from the simulation trajectories recalling the cutoff length scale design and the 1D diffusive motion statistics. The inverse relation of 〈Ns〉 and 〈lS〉58 is observed in the figure as well, confirming the robustness of the measurements and hence, once again encompassing the reliability of the current approach that has been adopted in this theoretical framework.
To capture the target search dynamics, in the current work, the dynamics of both, the coarse-grained protein particle and the beads of the DNA polymeric chain have been ensured by employing the theoretical dynamical model based on the Langevin equation (eqn (2) and (3)). Thus, it is important to note here that, even though, due to the common dynamical form in both cases, the dynamical evolution of the protein particle and the polymeric chain of DNA might appear similar (recalling the effect of individual dynamics of the protein and DNA as has been captured in Fig. 12), the relative dynamics of the protein and the monomeric beads of the DNA chain are characterized by the different form of Uint (eqn (4)–(6)), distinguishing the different dynamics for DNA and protein. The studies revealing the impact of the different dynamics of the protein and the DNA on the k profile, have been discussed in detail in the ESI,† available with this article, SI-A. Moreover, the average persistence length of DNA is found to be approximately 150 bp (base pairs) (in 0.1 M aqueous NaCl) and the protein binding site spans approximately 10 bp. In the current theoretical framework, where DNA is considered to be a polymeric chain consisting of 100 monomeric beads with a single bead representing the target, we can crudely map a coarse-grained quantification with the realistic situation considering each bead in the current model as equivalent to 10 bp of the realistic situation of DNA. In addition, in the current model, considering the persistence length as approximately 1 to 2 monomers, a polymeric chain consisting of 100 monomeric beads represents a fully flexible chain. Thus, comparing with the realistic biophysical context, we can infer that if the overall DNA length is much higher (approximately 10 times) than this 150 bp of DNA, the overall chain behaves as a fully flexible chain. On the contrary, if the overall DNA length is less then or similar to the length of 150 bp, the overall chain would behave as a rigid rod. Thus, in this current study, as we are interested in highlighting the modulation in the mechanistic details of the searcher protein for the process of target search, we have mainly focused on these two extreme situations considering when DNA is rigid and in another case where it is fully flexible. Moreover, here, the coarse-grained flexible DNA has been considered following a real Kremer–Grest polymeric chain model68 where the persistence length is approximately equal to the diameter of individual monomeric beads, which is approximately 1σ. This ensures the fully flexible characteristics of the DNA backbone which is a deliberate choice to capture and highlight the contrasting features in the target search rate profile, concerning a rigid DNA chain. Studies of the target search rate profile including DNA as a semiflexible chain has also been touched upon in the ESI,† available with this article, SI-B.
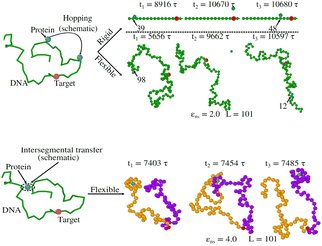
Thus, the main inference that can be drawn from the current study is that the timescale of facilitated diffusion of the protein is altered by the additional timescale introduced by the conformational transition caused by the flexibility of the DNA chain. The current theoretical approach captures the significant molecular details of facilitated diffusion involved in the target search process, by emphasizing the effect of DNA chain flexibility on the rate of the target search process. Moreover, it is noteworthy that, the complex mechanistic features of the target search are not artificially implemented as ad hoc conditions in the simulation. Based on this current theoretical framework, we can recognize and characterize any complex molecular event involving these 1D and 3D phases and their associated timescales, that are central to the overall target search mechanistic steps. The statistics of the timescales in each phase are measured following the first passage analysis methods.65,66 Here, all the characteristic search events such as hopping, sliding, or intersegmental transfers38,56 have been visualized based on a unified description of 3D and 1D diffusive motions of the protein. Thus, in this work, a typical search trajectory involves a pure 1D (sliding), and a pure 3D (bulk) diffusion, while any other kind of complex search technique such as hopping is mapped by combining these two types (1D and 3D) of diffusive motions while intersegmental transfers are captured as a pure 1D motion, as depicted in the time series snapshots of Fig. 16. Thus, for a hopping motion which is observed for flexible as well rigid DNA, the trajectory is captured as, where the protein starts from the 1D phase near the DNA contour, then goes to 3D bulk, and subsequently again comes back to 1D phase near DNA contour, but at a different location on the DNA. The same has been explained in the schematics and snapshots, obtained from the current simulation trajectory in the representative Fig. 16 highlighting the rigid and flexible DNA scenario. Furthermore, intersegmental transfer, a unique property, owing specifically to the flexible nature of the backbone, can be defined by an event where a searcher moves from one DNA strand directly to another, which is close in space, but may be distant along the contour, by transiently binding with both. Moreover, even though it is mediated by the complex chain dynamics of the DNA chain, from the point of the searcher protein, it is just a sliding motion and is associated with its sliding timescale (τ1D) along the DNA contour. Thus, in Fig. 16, we illustrate the features relevant to intersegmental transfer which is realized from the current simulation time-series snapshots.
Continuing on a similar observation as above, it can be concluded that the observations obtained from the current theory, provide a quantified prediction on how the 1D and 3D diffusion are explicitly adjusted, leading to an optimized target search strategy. The contrasting features observed in the dynamics of the search process reveal the underlying microscopic picture at various given conditions. Thus, this study identifies that with the target placed on a rigid backbone of DNA for a given variation of εns, 1D diffusion acts as the rate-limiting step at higher εns, while combined and intermittent 3D diffusion becomes the dominant feature at a lower εns, which enables the protein to achieve an efficient and optimized facilitated diffusive target search strategy (Fig. 7 and 8). On the contrary, for the flexible DNA case, for the entire scanned range of εns, 3D motion or bulk diffusion remains as the rate-limiting step and also, τ3D values quickly saturate to a maximum value after initial increase with εns. Thus, 3D motion or bulk diffusion, afterward continues to remain at that value without being affected by a further increase in the non-specific interaction strength (Fig. 10). At the same time, 〈τ1D〉 even though being low lying and hence, not being the dominant phase, shows a gradual increase with εns due to the searcher protein getting trapped by the loop-like configurations which are formed spontaneously by the flexible chain-dynamics. Hence, the 1D motion or motion along the contour for the protein, in this case, is especially noteworthy when the DNA has a flexible backbone. A stronger association between protein and DNA due to elevated εns can lead to a more collapsed state for he DNA, hindering effective diffusion of the protein along the DNA contour. A somewhat similar logic holds for the rigid DNA case as well where a stronger association εns between protein and DNA, due to elevated εns leads to a better alignment of the searcher protein to the DNA contour, increasing the residing time at each bead of DNA and hence slowing down the 1D diffusion (although without the formation of any looped or trapped structure for protein), and consequently, enabling that as the dominant diffusive mode or the rate limiting phase. However, for flexible cases, despite its apparent impact as a hindrance to 1D diffusion in the looped structure, it is important to note that this collapsed state is not a static feature but is dynamically evolving with the chain dynamics, leading to events like intersegmental transfer which indirectly helps the protein moiety to reach near the target location in a faster manner, making the 1D diffusion timescale less. These two opposite effects for the flexible DNA case create differential ranges for τ3D and τ1D where τ3D has a higher contribution being a slower timescale than τ1D in the entire varied range of εns. Thus τ3D as the governing term in the target search timescale, dictates the shape of the profile of k at the higher values of εns. This intricate interplay of flexibility and molecular interactions, as it has been visualized in the current work, have been also captured in many recent intriguing studies. The rapid long-distance migration of protein on single-stranded DNA occurring through intersegmental transfer along with multivalent interactions mediated by the flexibility of the DNA strand has been investigated with a single molecule experiment combined with a coarse-grained model in a recent study.76 A coarse-grained molecular dynamics simulation there has been implemented to measure the size of the intersegmental transfer and the frequency of such jumps to gain insights into these complex dynamics. The interplay of electrostatic interactions and intrinsic disorder in configurational characteristics modulating target search processes has been illustrated in another recent all atom simulation study.77 The importance of the breathing dynamics by nucleosomes has been highlighted in migrating the protein to the target site in another recent study by Mondal et al.78 where it has been shown that DNA forms bulges that diffuse stochastically and may regulate the target search dynamics of a protein by nonspecifically interacting with it. Also, it is noteworthy to mention here that many other theoretical frameworks15,35,38,41,54,79 including detailed atomistic simulations also reveals the importance of configurational characteristics of the DNA, as it has been visualized with the current theoretical framework. Thus, the significance of the current work is also in the fact that the importance of the flexibility of the DNA chain in the target search strategy, is captured by adopting a highly coarse-grained minimal model with a Brownian dynamics simulation setup here. Thus, as our simulation snapshots depict (Fig. 13 and 14) that the protein 1D diffusion, in that case, gets synchronized with the chain dynamics, being trapped in a dynamic looped structure. With the increase in the specific strength, the protein gets trapped more effectively in the dynamic looped structure, which enhances the 1D diffusion rate of the protein by reducing the tendency to escape further in various directions and hence moves it effectively towards the target along with the loop structure as a whole, following the chain-dynamics. A similar conclusion was also made in a recent theoretical study by Tyagi and Cherayil64 where the analytical calculation based on the Brownian motion of the protein on a flexible chain estimated an enhancement of target location rate reminiscing the phenomena of stochastic resonance. The stochastic resonance stems from the stochasticity in the conformational flexibility in the DNA along with the stochastic motion of the protein involved in the target search process. Moreover, Brackley et al.57 also monitored the characteristics of the facilitated diffusion by the protein, creating the configurational trap as a static rosette-like looped structure along the flexible DNA. The facilitated diffusion of the protein with sticky interactions was captured being trapped in the loop, along the DNA flexible chain. It is important to note that the significance of the chain dynamics in the target search dynamics has been also indicated and captured via a different theoretical approach that includes discrete-state stochastic methods involving the master equation approach in other theoretical studies involving facilitated diffusion.21,27,28
Despite the fact that the current minimal coarse-grained model could effectively map the realistic nature of facilitated diffusion and can also replicate the insight into the molecular origin of the salt effect as observed in real biophysical systems, the current approach suffers from certain limitations that lead us to future avenues of exploration following a similar theoretical approach. The existing challenges from the analysis of the data could be addressed in the future by suitably modifying the current set to overcome the shortcomings and hence provide a better understanding. Primarily, the initial increase in τ3D with εns in this current work for the flexible case is puzzling and can be anticipated to originate due to the somewhat mean-field form of the potential in terms of LJ which, as a whole, wraps up information regarding any attractive or repulsive interaction from the environment and hence, in some sense captures the essential details of the electrostatic potential36,46 in a crude way. Thus, in the future, it will be interesting to reproduce a similar computation with a more realistic potential. In addition to that, a calculation based on gradually changing the flexibility of the backbone will not only confirm the contrasting features observed in a fully flexible and rigid case but also provide the impact of the semiflexible DNA chain resembling the realistic features of DNA, with better clarity. The impact of the sequence-specific target search process will also be an interesting issue to model via this highly coarse-grained model based on colloidal and polymer dynamics.
In the current theoretical model, the quantified results on the modulation in the target search rates provide an easy handle to gain a deeper insight into the process. The study is found to be suitable to provide a convenient methodology to capture the modulation in the target search rate even in a complex situation such as, in the presence of blocking agents28,30,39,57 or in a crowded and rearranging disordered media. A natural extension of this work will be the application of a similar theoretical framework to extract testable and quantified predictions to manipulate the target search technique in a more complicated scenario.
Author contributions
Diljith Thonnekottu: investigation, visualization. Debarati Chatterjee: conceptualization, formal analysis, methodology, project administration, supervision, writing – original draft.Data availability
The data supporting this article have been included as part of the ESI.†Conflicts of interest
There are no conflicts to declare.Acknowledgements
We acknowledge the funding from IIT Palakkad, and the use of the Chandra computational cluster at IIT Palakkad for the simulation and numerical calculations involved in this work. We thank Prof. Anand T N C, IITPkd for reviewing the manuscript. We also acknowledge the anonymous reviewers who guided us to improve the manuscript.References
- O. G. Berg, R. B. Winter and P. H. Von Hippel, Biochemistry, 1981, 20, 6929–6948 CrossRef CAS PubMed.
- A. D. Riggs, S. Bourgeois and M. Cohn, J. Mol. Biol., 1970, 53, 401–417 CrossRef CAS PubMed.
- J. Elf, G.-W. Li and X. S. Xie, Science, 2007, 316, 1191–1194 CrossRef CAS PubMed.
- P. H. von Hippel, Annu. Rev. Biophys. Biomol. Struct., 2007, 36, 79–105 CrossRef CAS PubMed.
- L. Mirny, M. Slutsky, Z. Wunderlich, A. Tafvizi, J. Leith and A. Kosmrlj, J. Phys. A: Math. Theor., 2009, 42, 434013 CrossRef.
- A. Tafvizi, L. A. Mirny and A. M. van Oijen, ChemPhysChem, 2011, 12, 1481–1489 CrossRef CAS PubMed.
- J. Yu, J. Xiao, X. Ren, K. Lao and X. S. Xie, Science, 2006, 311, 1600–1603 CrossRef CAS PubMed.
- R. B. Winter and P. H. Von Hippel, Biochemistry, 1981, 20, 6948–6960 CrossRef CAS PubMed.
- G. Kolesov, Z. Wunderlich, O. N. Laikova, M. S. Gelfand and L. A. Mirny, Proc. Natl. Acad. Sci U. S. A., 2007, 104, 13948–13953 CrossRef CAS PubMed.
- M. Woringer, X. Darzacq and I. Izeddin, Curr. Opin. Chem. Biol., 2014, 20, 112–119 CrossRef CAS PubMed.
- P. H. von Hippel and O. G. Berg, J. Biol. Chem., 1989, 264, 675–678 CrossRef CAS PubMed.
- A. B. Kolomeisky, Phys. Chem. Chem. Phys., 2011, 13, 2088–2095 RSC.
- A. A. Shvets, M. P. Kochugaeva and A. B. Kolomeisky, Molecules, 2018, 23, 2106 CrossRef PubMed.
- Z. Wunderlich and L. A. Mirny, Nucleic Acids Res., 2008, 36, 3570–3578 CrossRef CAS PubMed.
- A. Bhattacherjee and Y. Levy, Nucleic Acids Res., 2014, 42, 12404–12414 CrossRef CAS PubMed.
- A. Bhattacherjee and Y. Levy, Nucleic Acids Res., 2014, 42, 12415–12424 CrossRef CAS PubMed.
- A. J. Pollak, A. T. Chin and N. O. Reich, Biochemistry, 2014, 53, 7028–7037 CrossRef CAS PubMed.
- P. Hammar, P. Leroy, A. Mahmutovic, E. G. Marklund, O. G. Berg and J. Elf, Science, 2012, 336, 1595–1598 CrossRef CAS PubMed.
- Y. Wang, R. H. Austin and E. C. Cox, Phys. Rev. Lett., 2006, 97, 048302 CrossRef CAS PubMed.
- J. Gorman, A. J. Plys, M.-L. Visnapuu, E. Alani and E. C. Greene, Nat. Struct. Mol. Biol., 2010, 17, 932–938 CrossRef CAS PubMed.
- J. Iwahara and A. B. Kolomeisky, Biophys. Chem., 2021, 269, 106521 CrossRef CAS PubMed.
- I. Izeddin, V. Récamier, L. Bosanac, I. I. Cissé, L. Boudarene, C. Dugast-Darzacq, F. Proux, O. Bénichou, R. Voituriez and O. Bensaude, et al. , eLife, 2014, 3, e02230 CrossRef PubMed.
- V. Dahirel, F. Paillusson, M. Jardat, M. Barbi and J.-M. Victor, Phys. Rev. Lett., 2009, 102, 228101 CrossRef PubMed.
- L. Liu, A. G. Cherstvy and R. Metzler, J. Phys. Chem. B, 2017, 121, 1284–1289 CrossRef CAS PubMed.
- E. F. Koslover, M. A. D. de la Rosa and A. J. Spakowitz, Biophys. J., 2011, 101, 856–865 CrossRef CAS PubMed.
- T. Ando and J. Skolnick, PLoS Comput. Biol., 2014, 10, e1003990 CrossRef PubMed.
- C. Felipe, J. Shin and A. B. Kolomeisky, J. Phys. Chem. B, 2021, 125, 1727–1734 CrossRef CAS PubMed.
- C. Felipe, J. Shin, Y. Loginova and A. B. Kolomeisky, J. Chem. Phys., 2020, 152, 025101 CrossRef CAS PubMed.
- K. Mondal and S. Chaudhury, J. Stat. Mech.: Theory Exp., 2020, 2020, 093204 CrossRef.
- B. Punia and S. Chaudhury, J. Phys. Chem. B, 2022, 126, 3037–3047 CrossRef CAS PubMed.
- D. Normanno, L. Boudarène, C. Dugast-Darzacq, J. Chen, C. Richter, F. Proux, O. Bénichou, R. Voituriez, X. Darzacq and M. Dahan, Nat. Commun., 2015, 6, 7357 CrossRef PubMed.
- A. S. Hansen, A. Amitai, C. Cattoglio, R. Tjian and X. Darzacq, Nat. Chem. Biol., 2020, 16, 257–266 CrossRef CAS PubMed.
- T. E. Kuhlman and E. C. Cox, Mol. Syst. Biol., 2012, 8, 610 CrossRef PubMed.
- N. Hao, K. E. Shearwin and I. B. Dodd, Nat. Commun., 2017, 8, 1628 CrossRef PubMed.
- D. Vuzman and Y. Levy, Proc. Natl. Acad. Sci U. S. A., 2010, 107, 21004–21009 CrossRef CAS PubMed.
- Y. Levy, J. N. Onuchic and P. G. Wolynes, J. Am. Chem. Soc., 2007, 129, 738–739 CrossRef CAS PubMed.
- B. van den Broek, M. A. Lomholt, S.-M. Kalisch, R. Metzler and G. J. Wuite, Proc. Natl. Acad. Sci U. S. A., 2008, 105, 15738–15742 CrossRef CAS PubMed.
- A. Mondal and A. Bhattacherjee, Nucleic Acids Res., 2015, 43, 9176–9186 CrossRef CAS PubMed.
- P. Dey and A. Bhattacherjee, Soft Matter, 2019, 15, 1960–1969 RSC.
- O. Pulkkinen and R. Metzler, Phys. Rev. Lett., 2013, 110, 198101 CrossRef PubMed.
- A. Marcovitz and Y. Levy, Proc. Natl. Acad. Sci. U. S. A., 2011, 108, 17957–17962 CrossRef CAS PubMed.
- G.-W. Li, O. G. Berg and J. Elf, Nat. Phys., 2009, 5, 294–297 Search PubMed.
- L. Liu and K. Luo, J. Chem. Phys., 2015, 142, 03B613_1 Search PubMed.
- S. E. Halford, Biochem. Soc. Trans., 2009, 37, 343–348 CrossRef CAS PubMed.
- A. Cherstvy, A. Kolomeisky and A. Kornyshev, J. Phys. Chem. B, 2008, 112, 4741–4750 CrossRef CAS PubMed.
- L. S. Bigman, H. M. Greenblatt and Y. Levy, J. Phys. Chem. B, 2021, 125, 3119–3131 CrossRef CAS PubMed.
- A. Veksler and A. B. Kolomeisky, J. Phys. Chem. B, 2013, 117, 12695–12701 CrossRef CAS PubMed.
- O. Bénichou, M. Moreau and G. Oshanin, Phys. Rev. E: Stat., Nonlinear, Soft Matter Phys., 2000, 61, 3388 CrossRef PubMed.
- D. Shoup, G. Lipari and A. Szabo, Biophys. J., 1981, 36, 697–714 CrossRef CAS PubMed.
- S. Park, O.-C. Lee, X. Durang and J.-H. Jeon, J. Korean Phys. Soc., 2021, 78, 408–426 CrossRef.
- C. Bustamante, M. Guthold, X. Zhu and G. Yang, J. Biol. Chem., 1999, 274, 16665–16668 CrossRef CAS PubMed.
- C. Loverdo, O. Benichou, R. Voituriez, A. Biebricher, I. Bonnet and P. Desbiolles, Phys. Rev. Lett., 2009, 102, 188101 CrossRef CAS PubMed.
- R. K. Das and A. B. Kolomeisky, Phys. Chem. Chem. Phys., 2010, 12, 2999–3004 RSC.
- P. Kar, A. G. Cherstvy and R. Metzler, Phys. Chem. Chem. Phys., 2018, 20, 7931–7946 RSC.
- E. Chow and J. Skolnick, Biophys. J., 2017, 112, 2261–2270 CrossRef CAS PubMed.
- O. Givaty and Y. Levy, J. Mol. Biol., 2009, 385, 1087–1097 CrossRef CAS PubMed.
- C. A. Brackley, M. E. Cates and D. Marenduzzo, Phys. Rev. Lett., 2013, 111, 108101 CrossRef CAS PubMed.
- C. A. Brackley, M. E. Cates and D. Marenduzzo, Phys. Rev. Lett., 2012, 109, 168103 CrossRef CAS PubMed.
- M. B. Elowitz, M. G. Surette, P.-E. Wolf, J. B. Stock and S. Leibler, J. Bacteriol., 1999, 181, 197–203 CrossRef CAS PubMed.
- O. Bénichou, Y. Kafri, M. Sheinman and R. Voituriez, Phys. Rev. Lett., 2009, 103, 138102 CrossRef PubMed.
- S. E. Halford and J. F. Marko, Nucleic Acids Res., 2004, 32, 3040–3052 CrossRef CAS PubMed.
- S. C. Knight, L. Xie, W. Deng, B. Guglielmi, L. B. Witkowsky, L. Bosanac, E. T. Zhang, M. El Beheiry, J.-B. Masson and M. Dahan, et al. , Science, 2015, 350, 823–826 CrossRef CAS PubMed.
- D. Thonnekottu and D. Chatterjee, J. Phys. Chem. B, 2020, 124, 3271–3282 CrossRef CAS PubMed.
- N. Tyagi and B. J. Cherayil, J. Stat. Mech.: Theory Exp., 2018, 2018, 063208 CrossRef.
- S. Redner, A Guide to First-Passage Processes, Cambridge University Press, 2001 Search PubMed.
- R. Metzler, S. Redner and G. Oshanin, First-passage Phenomena And Their Applications, World Scientific, 2014, vol. 35 Search PubMed.
- A. P. Thompson, H. M. Aktulga, R. Berger, D. S. Bolintineanu, W. M. Brown, P. S. Crozier, P. J. in't Veld, A. Kohlmeyer, S. G. Moore and T. D. Nguyen, et al., LAMMPS-a flexible simulation tool for particle-based materials modeling at the atomic, meso, and continuum scales, Comput. Phys. Commun., 2022, 271, 108171 CrossRef CAS.
- K. Kremer and G. S. Grest, J. Chem. Phys., 1990, 92, 5057–5086 CrossRef CAS.
- R. Zwanzig, Nonequilibrium Statistical Mechanics, Oxford University Press, 2001 Search PubMed.
- C. W. Gardiner, Handbook of Stochastic Methods for Physics, Chemistry and the Natural Sciences, Springer, Berlin, 1983 Search PubMed.
- D. A. McQuarrie, Statistical Mechanics, Harper & Row, New York, 1976 Search PubMed.
- G. van Rossum and J. de Boer, Interactively Testing Remote Servers Using the Python Programming Language, 1991, 4, pp. 283–304, https://www.python.org Search PubMed.
- L. Verlet, Phys. Rev., 1967, 159, 98 CrossRef CAS.
- S. C. Piatt, J. J. Loparo and A. C. Price, Biophys. J., 2019, 116, 2367–2377 CrossRef CAS PubMed.
- A. Stukowski, Visualization and analysis of atomistic simulation data with OVITO-the Open Visualization Tool, Modell. Simul. Mater. Sci. Eng., 2010, 18, 015012 CrossRef.
- S. Pangeni, G. Biswas, V. Kaushik, S. Kuppa, O. Yang, C.-T. Lin, G. Mishra, Y. Levy, E. Antony and T. Ha, J. Mol. Biol., 2024, 436, 168491 CrossRef CAS PubMed.
- L. S. Bigman and Y. Levy, Annu. Rev. Biophys., 2023, 52, 463–486 CrossRef CAS PubMed.
- A. Mondal, S. K. Mishra and A. Bhattacherjee, Biophys. J., 2022, 121, 4526–4542 CrossRef CAS PubMed.
- G. Naiya, P. Raha, M. K. Mondal, U. Pal, R. Saha, S. Chaudhuri, S. Batabyal, S. Kumar Pal, D. Bhattacharyya, N. C. Maiti and S. Roy, Phys. Chem. Chem. Phys., 2016, 18, 21618–21628 RSC.
Footnote |
| † Electronic supplementary information (ESI) available. See DOI: https://doi.org/10.1039/d4cp01580k |
| This journal is © the Owner Societies 2024 |

