
Local force constants and charges of the nitrosyl ligand in photoinduced NO linkage isomers in a prototypical ruthenium nitrosyl complex†
Artem A.
Mikhailov
*a,
Axel
Gansmüller
a,
Krzysztof A.
Konieczny
ab,
Sébastien
Pillet
a,
Gennadiy
Kostin
 c,
Peter
Klüfers
d,
Theo
Woike
a and
Dominik
Schaniel
*a
c,
Peter
Klüfers
d,
Theo
Woike
a and
Dominik
Schaniel
*a
aUniversité de Lorraine, CNRS, CRM2, 54000 Nancy, France. E-mail: artem.mikhailov@univ-lorraine.fr; dominik.schaniel@univ-lorraine.fr
bFaculty of Chemistry, Wroclaw University of Science and Technology, Wybrzeze Wyspianskiego 27, 50-370 Wroclaw, Poland
cNikolaev Institute of Inorganic Chemistry, Siberian Branch of the Russian Academy of Science, Novosibirsk 630090, Russia
dDepartment of Chemistry, Ludwig-Maximilians-Universität, Butenandtstrasse 5–13, München 81377, Germany
First published on 6th May 2024
Abstract
Photoinduced linkage isomers (PLI) of the NO ligand in transition-metal nitrosyl compounds can be identified by vibrational spectroscopy due to the large shifts of the ![[small nu, Greek, tilde]](https://www.rsc.org/images/entities/i_char_e0e1.gif) (NO) stretching vibration. We present a detailed experimental and theoretical study of the prototypical compound K2[RuCl5NO], where (NO) shifts by ≈150 cm−1 when going from the N-bound (κN) ground state (GS) to the oxygen-bound (κO) metastable linkage isomer MS1, and by ≈360 cm−1 when going to the side-on (κ2N,O) metastable linkage isomer MS2. We show that the experimentally observed N–O stretching modes of the GS, MS1, and MS2 exhibit strong coupling with the Ru–N and Ru–O stretching modes, which can be decoupled using the local mode vibrational theory formalism. From the resulting decoupled pure two-atomic harmonic oscillators the local force constants are determined, which all follow the same quadratic behavior on the wavenumber. A Bader charge analysis shows that the total charge on the NO ligand is not correlated to the observed frequency shift of (NO).
(NO) stretching vibration. We present a detailed experimental and theoretical study of the prototypical compound K2[RuCl5NO], where (NO) shifts by ≈150 cm−1 when going from the N-bound (κN) ground state (GS) to the oxygen-bound (κO) metastable linkage isomer MS1, and by ≈360 cm−1 when going to the side-on (κ2N,O) metastable linkage isomer MS2. We show that the experimentally observed N–O stretching modes of the GS, MS1, and MS2 exhibit strong coupling with the Ru–N and Ru–O stretching modes, which can be decoupled using the local mode vibrational theory formalism. From the resulting decoupled pure two-atomic harmonic oscillators the local force constants are determined, which all follow the same quadratic behavior on the wavenumber. A Bader charge analysis shows that the total charge on the NO ligand is not correlated to the observed frequency shift of (NO).
1. Introduction
Photo-induced linkage isomers (PLI) have been reported both in the crystalline phase and in solution for a large number of metal–nitrosyl complexes with varying chemical composition.1–6 These materials are of importance in medicine and biology because, e.g., NO acts as a signaling molecule in the nervous system7,8 but might also find applications in optical technologies due to the photochromic and photorefractive changes induced by the PLI generation.9,10 Upon irradiation with appropriate wavelengths, the NO ligand changes its bonding configuration with the transition metal, and can thus adopt different structural geometries. For mono- and dinitrosyl complexes {M(NO)m}n (in the Enemark–Feltham notation with m = 1, 2 and n = number of metal d electrons if NO+ is considered the ligand) with different transition metals M, various geometries of the MNO group have been reported, exhibiting linear or bent configurations of the NO ligand depending on the number of metal d electrons, n = 6–10 (see Scheme 1 and corresponding discussion in ref. 11). For the {MNO}6 octahedrally sixfold coordinated complexes three such structural configurations have been reported, the linear nitrogen bound (κN) ground state (GS), and two metastable states (MS), a side-on bound M–NO configuration (κ2N,O; MS2) where the M–N–O angle is of the order of 80°–90° and an inverted linear oxygen-bound isonitrosyl configuration M–O–N (κO, MS1). The reorganization of the NO ligand from GS to MS1 can thus be pictured as the rotation along a polar angle by 180° with MS2 as an intermediate step. The thermal stability of the photoinduced NO configurations MS1 and MS2 depends notably on the nature of the ligand in position trans to NO.12,13 The complex trans-[Ru(py)4(NO)F]2+ shows one of the most long-lived MS1 isomers,14 with a decay temperature of Td = 290 K, while the highest Td of 313 K was found in trans-[Ru(NH3)4(NO)F](ClO4)Cl15 (Td is defined as the temperature where the decay constant is k = 10−3 s−1). In paramagnetic complexes of the type [FeCl3(NO)]−, the PLI exhibit a much lower thermal stability (Td < 50 K).16 The concentration of PLI that can be induced varies from 1–100%, depending on the chemical composition of the complex or crystal. The origin of this large variation lies in the absorption properties of the different PLI, most of the time the absorption bands of GS and MS1,2 overlap and thus a photostationary state is built up equilibrating forward and backward processes at the given irradiation wavelength, depending on the ratio of the corresponding cross sections.17,18 Inspecting the dynamics of the PLI generation, it was reported that MS2 is reached within approximately 300 fs,19 followed by vibrational relaxation into its minimum within a few picoseconds.20 TD-DFT calculations indicate that two channels contribute to the PLI formation, a combination of fast intersystem crossings to a triplet state within 80–160 fs followed by internal conversions through the conical intersections at the transition states resulting in the relaxation into the singlet MS potentials or, alternatively, a purely internal conversion via the singlet states and the corresponding transition states.21In most of the nitrosyl complexes, the ν(NO) stretching vibration shifts to lower wavenumbers when going from GS to MS1 and MS2.2 The only reported exception to this observation for sixfold coordination are the {PtNO}8 complexes [Pt(NH3)4Cl(NO)]Cl2, [Pt(NH3)4(NO3)NO](NO3)2 and [Pt(NH3)4(SO4)NO]HSO4·CH3CN, for which a shift to higher wavenumbers was observed upon generation of PLI.22,23 Note, however, that for these PtNO complexes, the nitrogen-bound GS is already in a bent configuration with Pt–N–O angles of the order of 110–120°, and only one PLI has been detected, an oxygen bound bent configuration with slightly larger (calculated) Pt–O–N angles of the order of 120–130°. In most cases the generation of the PLI is triggered by a metal-to-ligand charge transfer (MLCT) excitation from the occupied metal-d orbitals to the empty antibonding π*(NO) orbitals.18 Therefore, sometimes, the downshift of the ν(NO) stretching vibration has been interpreted as due to an increase of the charge on the NO ligand,24 resulting in a change of the formally NO+ towards NO0 in the MS, an interpretation that would be in line with the known ν(NO) stretching vibrations of free NO, 2387 cm−1 for NO+ and 1876 cm−1 for NO0.25 This simplified picture is sometimes applied as a shortcut to the deduction of the NO angle and its formal charge from the observed frequency of the stretching vibration. This should be however handled with precaution as already Enemark and Feltham pointed out in their seminal 1974 review that “it is very tenuous to infer M–N–O angles from ν(NO)”.26 Fundamental insight into these questions and, especially, also with respect to the oxidation state of the “non-innocent” ligand NO, has been given in the recent work by Klüfers and co-workers.27,28 Through detailed structure analysis combined with DFT calculations and the determination of the charges on the NO, it was shown that the M–N–O angle is not a reliable indicator to derive bond strengths or ligand charges.
In the framework of this fundamental discussion we present a detailed experimental and theoretical study of the PLI in K2[RuCl5NO], which already earlier has served as a prototypical {MNO}6 complex for DFT calculations.29,30 Starting from an accurate single-crystal structure determination of GS we use infrared spectroscopy, including 15N isotope substitution, to unambiguously identify the ν(RuN) and ν(NO) stretching and δ(RuNO) deformation vibrations for GS, MS1 and MS2. A solid-state DFT calculation is performed and its quality is assessed by comparison with the experimental structural, infrared as well as NMR data of the GS. Since MS1 and MS2 populations are too low to allow for experimental structure determination, their structures are calculated and the corresponding calculated vibrational spectra are compared to the experimental results. A Bader31 analysis is performed in order to determine the charges on the relevant atoms and atom groups for GS, MS1, and MS2. Finally, we use the local mode vibrational theory as developed by Konkoli, Cremer and Kraka32 in order to calculate the decoupled ν(RuN) and ν(NO) stretching vibrations and determine the corresponding local force constants. The implications of these results on the interpretation of the downshift of the ν(NO) stretching vibration upon PLI generation are discussed.
2. Material and methods
2.1. Synthesis
K2[RuCl5NO] was synthesized according to a previously reported procedure.33 The 15NO labelled complex was synthesized by using Na15NO2. Single crystals suitable for XRD were obtained by slow evaporation of a water solution of the complex.2.2. Single crystal X-ray diffraction
Single crystal X-ray diffraction (XRD) data for K2[RuCl5NO] were collected on a Bruker Apex Duo diffractometer with CCDs using graphite-monochromated MoKα radiation (λ = 0.71073 Å) via 0.5° ω- and φ-scan techniques. Reduction of the experimental data was performed using the APEX2 suite. The structure was solved using SHELXT and refined by the full-matrix least-squares technique SHELXL34 assisted by Olex2 GUI.35 The atomic displacement parameters of the atoms were refined using an anisotropic approximation. The crystallographic characteristics, experimental data, and structure refinements are listed in Table S1 (ESI†). The structure of K2[RuCl5NO] has been deposited with the CCDC with deposition number 2336093.†2.3. NMR
15N NMR analysis was performed on a high-field Bruker NMR AVANCE III spectrometer operating at 14 T (1H NMR frequency, 600 MHz) with a Bruker 2.5 mm MAS HX probe. The signal was acquired at 10 kHz MAS frequency using a single pulse excitation optimized at 6.5 μs. Interscan recovery time was set to 50 s and 512 scans were accumulated. The 15N chemical shifts have been referenced with respect to CH3NO2.2.4. UV-Vis spectroscopy
UV-Vis measurements were performed using a Cary 4000 spectrometer with a resolution of 2 nm at room temperature. Polycrystalline samples were either prepared as KBr pellets like for IR spectroscopy for measuring solid-state spectra in transmission mode, or solved in water in different concentrations for the solution spectra. In accordance with previously published solution spectra36,37 (in acidic solutions) a broad absorption band is detected in the visible range, which can be deconvoluted into two bands at 480 nm (20![[thin space (1/6-em)]](https://www.rsc.org/images/entities/char_2009.gif) 800 cm−1) and 525 nm (19050 cm−1), which we assign to the transitions dxy → π*(NO) and dxz,yz → π*(NO). The occupied d-orbitals are thus separated by less than 2000 cm−1. Consequently, we used irradiation wavelengths in the spectral range 450–590 nm for the generation of the PLI in the IR experiments.
800 cm−1) and 525 nm (19050 cm−1), which we assign to the transitions dxy → π*(NO) and dxz,yz → π*(NO). The occupied d-orbitals are thus separated by less than 2000 cm−1. Consequently, we used irradiation wavelengths in the spectral range 450–590 nm for the generation of the PLI in the IR experiments.
2.5. Infrared spectroscopy
IR measurements were performed using a Nicolet 5700 FT-IR spectrometer with a resolution of 2 cm−1 and 1 cm−1 at temperature T = 10 K. Samples were ground, mixed with KBr and pressed into pellets. The KBr pellets were bonded onto the cold finger of the Oxford Optistat cryostat using silver paste, and irradiated through KBr windows with LED light and diode-lasers in the wavelength range of 450–1310 nm. Specifically, in a first step the generation of the PLI was performed at 10 K using 455 nm (LED), 505 nm (LED), 520 nm (LED), 526.5 nm (LASER), 530 nm (LED), 556 nm (LASER), 586 nm (LASER). In this manner both MS1 and MS2 (in smaller amounts) can be produced with a maximum for MS1 using 520 nm. In an effort to unambiguously identify the Ru–N stretching vibration related to MS2, the sample in the MS1 state was irradiated using wavelengths in the infrared spectrum, in particular using a LASER diode at 1310 nm. Using 660 nm (LED), both MS1 and MS2 can be transferred back to GS.2.6. Raman spectroscopy
Raman spectra were recorded on a LabRAM Horiba (Japan) single-stage spectrometer with a CCD Symphony detector (Jobin Yvon, France) having 2048 horizontal pixels. The laser power at the sample surface was typically 1 mW for the 633 nm line of a He–Ne laser and 0.1 mW for the 514 nm line of an Ar+ laser. A spectral resolution was 3.0 cm−1. The spectra were measured in 180° backscattering collection geometry with a Raman microscope. For low-temperature measurements (5 K), the crystals were wrapped in indium foil for better thermal contact and fixed on the cold finger of the He cryostat.2.7. DFT
The crystal structure, NMR parameters, charge density, as well as infrared spectra were calculated using density functional theory with the first principle quantum mechanical code CASTEP19.1138,39 and using the Perdew–Burke–Ernzerhof generalized gradient approximation (PBE),40 with ZORA relativistic treatment.41 The structures were described as extended solids using periodic boundary conditions. The wavefunctions were expanded using a planewave (PW) basis set with a kinetic energy cutoff and Brillouin zone k-point spacing chosen to produce converged results. In a first step, geometry optimization of all atoms was performed, as already successfully applied in a previous paper.42 For geometry optimization, IR spectra, and charge density calculations, the Norm Conserving pseudopotentials CASTEP 19.0 (NCP19) were used to describe the interaction of the valence electrons with the nuclei and core electrons. The wavefunctions were expanded using a PW basis set with a kinetic energy cutoff of 900 eV and integration over the Brillouin zone with k-point spacing <0.04 Å−1 on the Monkhorst–Pack (MP) mesh.43 The sizes of the standard and fine grids were set to 2 and 3 respectively. The self-consistent field calculations were considered to be converged when the total energy of the system was stable within 10−10 eV. Geometry optimization was performed with semi-empirical dispersion correction using the Tkatchenko–Scheffler scheme.44 The geometry optimization was performed with strict convergence tolerance criteria (10−7 eV per atom total energy convergence; 5 × 10⁻³ eV per Å max ionic force; and 5 × 10⁻⁴ Å max ionic displacement). Coordinates of optimized structures are listed in Tables S2–S5 (ESI†). The IR spectra were simulated using the PDielec package45 applied to the output of CASTEP calculations, for a powder of spherical particles diluted in KBr and applying a Lorentzian width of 0.5 cm−1. In order to obtain the decoupled force constants from the DFT calculated vibrational spectra, the verbosity of the CASTEP output was set to 3, and the Cremer–Kraka transformation, as provided by the PyMOL plugin LmodeA-nano,46 was used. For the charge density calculations, spin–orbit couplings were included in the calculations. After applying the den2vasp utility to convert the CASTEP charge density to the VASP CHGCAR format, the Bader analysis program was used to perform Bader charge analysis.47 NMR calculations were performed with “on the fly” generated pseudopotentials (OTFG C19). In order to compare the GIPAW-calculated 15N shielding values directly with the experimentally measured isotropic chemical shift values, the following expression was used δcalciso = σref − σiso where σref = −178.9 ppm as in our previously published study.483. Results
3.1. Ground state (GS)
The first structure analysis of K2[RuCl5NO] had been performed by Khodashova and Bokii49 in 1960 and reexamined by the same authors in 1964.50 The structure was refined in the orthorhombic space group Pnma with Z = 4, yielding atomic distances of d(N–O) = 1.25(5) Å, d(Ru–N) = 1.70(4) Å, and d(Ru–Cl) = 2.35(1) Å. In 1972 Veal and Hodgson reinvestigated the compound,51 based on additional reflections they refined the structure in the non-centrosymmetric space group P212121 with atomic distances according to the labelling given in Fig. 1a: d(N–O) = 1.112(7) Å, d(Ru–N) = 1.747(6) Å, d(Ru–Cl1) = 2.363(7) Å, d(Ru–Cl2) = 2.371(2)/2.377(2) Å, d(Ru–Cl3) = 2.375(8) Å and d(Ru–Cl4) = 2.359(2) Å. This study resulted thus in an improved determination of the N–O distance and revealed a trans influence, at the origin of the shorter Ru–CI bond trans to the nitrosyl group compared to the average Ru–Cl1 bond cis to the nitrosyl. However, the space group determination was not unambiguous, so that Zarhloul et al.52 proceeded to a structural reinvestigation within the whole series of K2Ru(NO)X5 complexes, with X = Cl, Br, I, concluding that Pnma should be considered the correct space group, based on a comparative analysis of the resulting refined bond lengths and overall better agreement statistics. Contrary to Veal and Hodgson, these authors interpreted the fact that the trans-to-NO Ru–Cl bond is longer than the average equatorial Ru–Cl bond as in fact being an elongation indicating a weaker σ bonding for Cl− than for NO when compared in a larger series of complexes with differing axial ligands. A temperature dependent neutron powder diffraction study of Rüdlinger et al.53 in 1993 confirmed the Pnma space group and reported on a significant dependence of the bond lengths on the temperature. Since we aim for a detailed analysis of charges on the RuNO group, we need very accurate information on the structure. We therefore redetermined the structure of K2[RuCl5NO] at T = 100 K using MoKα radiation, on a single crystal exhibiting grown faces, allowing for a precise absorption correction. The refinement is performed in the Pnma space group, and the resulting atomic distances are given in Table 1 and Fig. 1a. The Ru–Cl4 bond length is about 0.010(1) Å shorter than the equatorial Ru–Cl bond lengths. The polar Ru–N–O angle amounts to θ = 175.0(1)°, whereby the oxygen is bent towards the Cl1 atom.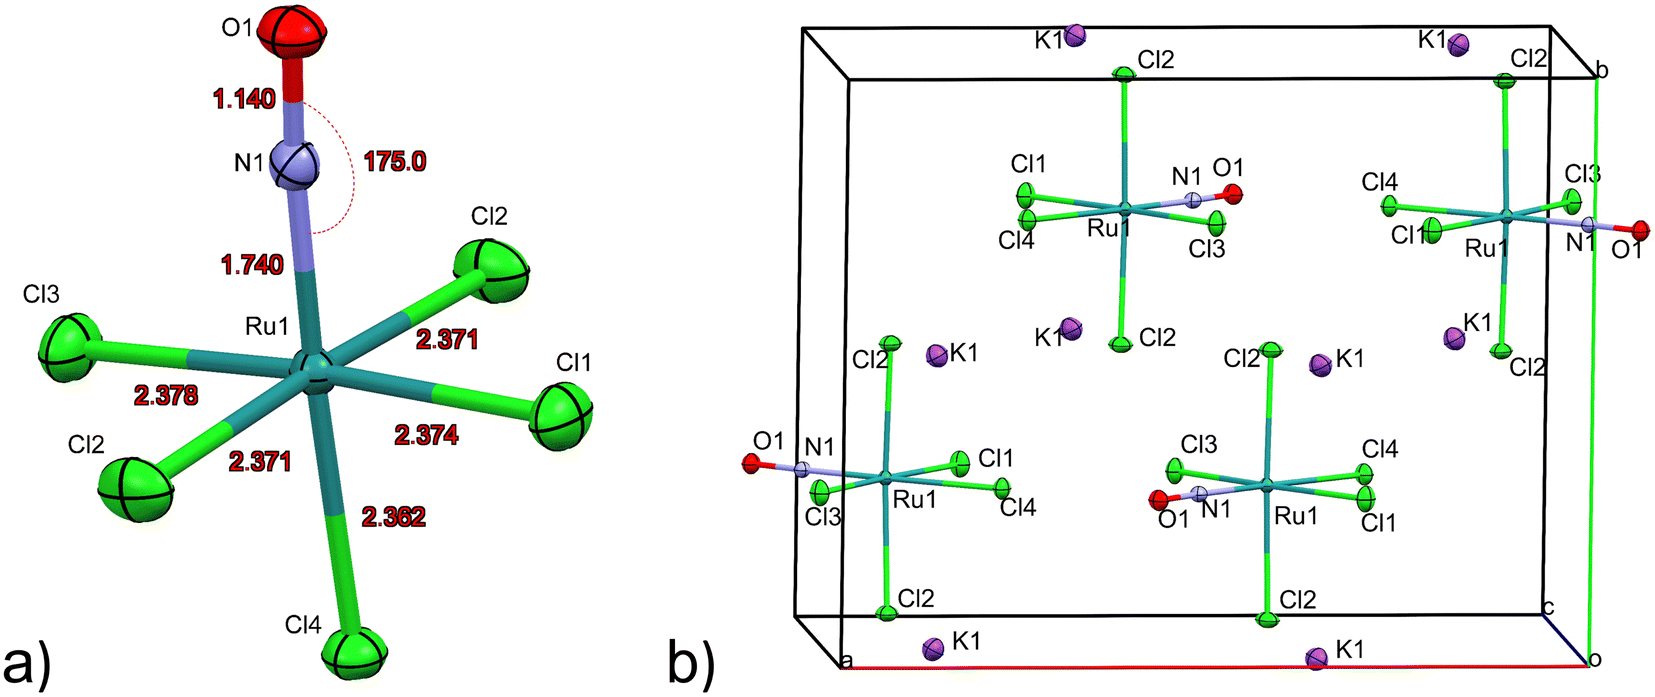 | ||
| Fig. 1 (a) [RuCl5NO]2− anion and bond lengths in the Ru–N–O ground state (GS) structure. (b) Unit cell view along the c-axis depicting layers of K+ cations and antiparallel alignment of Ru–NO groups. Atomic displacement ellipsoids are given at the 80% probability level. | ||
| Distances/angles | XRD | DFT | Δ(exp − calc) |
|---|---|---|---|
| N–O | 1.140(1) | 1.152 | −0.012 |
| Ru–N | 1.740(1) | 1.727 | +0.013 |
| Ru–Cl4trans | 2.362(1) | 2.355 | +0.007 |
| Ru–Cl1 | 2.374(1) | 2.384 | −0.010 |
| Ru–Cl2 | 2.371(1) | 2.380 | −0.009 |
| Ru–Cl3 | 2.378(1) | 2.369 | +0.009 |
| K–Cl4trans | 3.327(1)/3.455(1) | 3.246/3.478 | +0.081/−0.023 |
| K–Cl1 | 3.283(1)/3.527(1) | 3.178/3.562 | +0.105/−0.035 |
| K–Cl2 | 3.206(1)/3.240(1) | 3.087/3.133 | +0.119/+0.107 |
| 3.581(1)/3.666(1) | 3.465/3.572 | +0.116/+0.094 | |
| K–Cl3 | 3.307(1)/3.448(1) | 3.253/3.349 | +0.054/+0.099 |
| K–O | 4.015(1)/4.279(1) | 3.953/4.385 | +0.062/−0.106 |
| K–N | 3.987(1)/4.042(1) | 3.932/4.054 | +0.055/−0.012 |
| O–Cl2 | 2.929(1) | 2.890 | +0.039 |
| N–Cl1 | 2.929(1) | 2.902 | +0.027 |
| ∠Ru–N–O | 175.0(1) | 172.5 | +2.5 |
As illustrated in Fig. 1b, the mirror plane m perpendicular to the b-axis contains the Cl4–Ru–N–O axis of the molecule as well as the ligands Cl1 and Cl3, and therefore also the polar angle θ describing the Ru–N–O bending. Notably, we observe a rectangular arrangement of four K+ cations around each Cl ligand (Fig. 2). The corresponding distances are listed in Table 1. This peculiar embedding of the [RuCl5NO]2− anions in the K+ cation lattice, with d(K–Cl) distances of 3.2 to 3.7 Å, and the resulting strong coupling is the reason for the temperature dependence of the bond lengths reported in ref. 53. The excellent quality of our structure determination can be assessed from the residual Fourier-difference maps, where the empty eg and the filled t2g-orbitals of the Ru central atom are clearly visible as electron deficient and enriched zones (see Fig. S1 in ESI†).
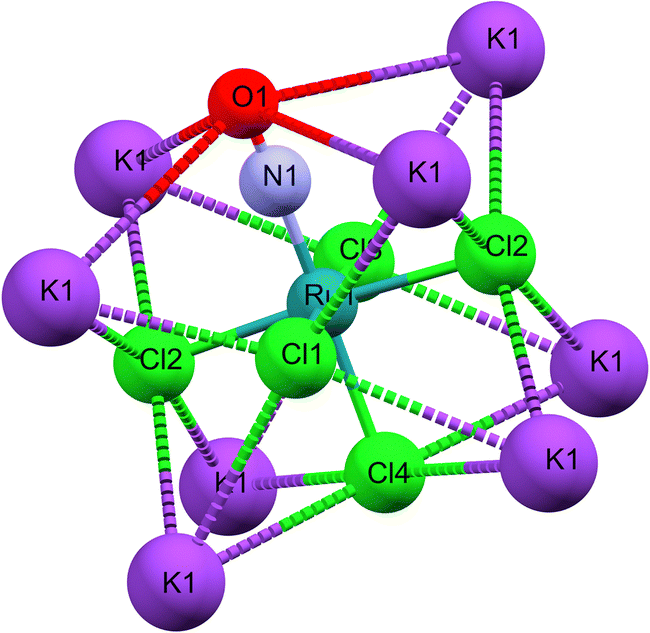 | ||
| Fig. 2 Cationic K+ environment for the [RuCl5NO]2− anion. | ||
Table 1 lists also the bond lengths obtained with geometry optimization in the solid state using the CASTEP DFT code, along with the resulting differences compared to the experimentally obtained values. The intramolecular distances agree very well, the largest difference of 0.013 Å is found for the Ru–N bond. Contrary to that, the cation–anion distances match far less, one of the K–Cl1 distances is overestimated by 0.035 Å and one of the K–Cl2 distances is underestimated by 0.119 Å in the calculation. The Ru–N–O angle is underestimated by 2.5° in the calculation, but the oxygen atom is bent towards the Cl1 atom in the mirror plane, as found experimentally.
In a first step, in order to evaluate the quality of the solid-state DFT calculations based on the XRD structure, we measured the 15N chemical shift tensor and compared the results with our calculations. Table 2 presents the results for GS. Consistently with XRD measurements, only one 15N site is observed with an experimental isotropic chemical shift of δiso = −38.6 ppm with respect to CH3NO2 (see Fig. S2, ESI†). When referencing the DFT calculations to σref = −178.9 ppm, the value used in our precedent NMR study of [Ru(15NO)(py)419F](ClO4)2,48 we find a difference of −5.9 ppm in the range of what was found in our earlier study. These values of the 15N chemical shift are in the range of known values for linear Ru–N–O geometries33,54–56 considering the corresponding reference. Regarding chemical shift anisotropy, the difference between experimental and calculated value are small since the values of the asymmetry parameter η match within experimental error margin, and the reduced anisotropy Δδ (expressed using the Haeberlen convention) shows a deviation of 6%. Due to the polar Ru–N–O angle of θ = 172.5° the calculation yields a small value of η = 0.03, which however could not be detected experimentally, as it is probably too small.
| Experiment | DFT | |
|---|---|---|
| δ iso | −38.6 | −32.7 |
| η | 0.00 | 0.03 |
| Δ δ | −393 | −368.7 |
Infrared and Raman spectroscopy allow for the detection of changes in bonding due to excitation of PLI even at low populations. Despite the high sensitivity of Raman spectroscopy, only the GS and MS1 configurations were studied by this method since there is no irradiation wavelength for which MS2 is stable with sufficient population (see ref. 57 and Fig. S3, ESI†). Nevertheless, these two methods enable the investigation of local changes both in the molecular ion and the crystal. Using isotopic substitution of 14N for 15N, an unambiguous assignment of the detected vibrational bands is possible. For this reason, IR- and Raman spectroscopy have been applied from the early days for the characterization of NO complexes and their linkage isomers.57–64 Infrared and Raman spectra were collected for GS by Tosi63 and for MS1 and MS2 by Güida et al.64 The latter have also performed DFT calculations for the quasi-free molecule in order to assign the measured vibrational bands. In (idealized) 4m symmetry 18 vibrations are expected for the [RuCl5NO]2− anion, which distribute according to Γ = 5A1 + 2B1 + B2 + 5E. Fig. 3 shows the measured and calculated infrared spectra of GS in the range 1950–1500 cm−1.
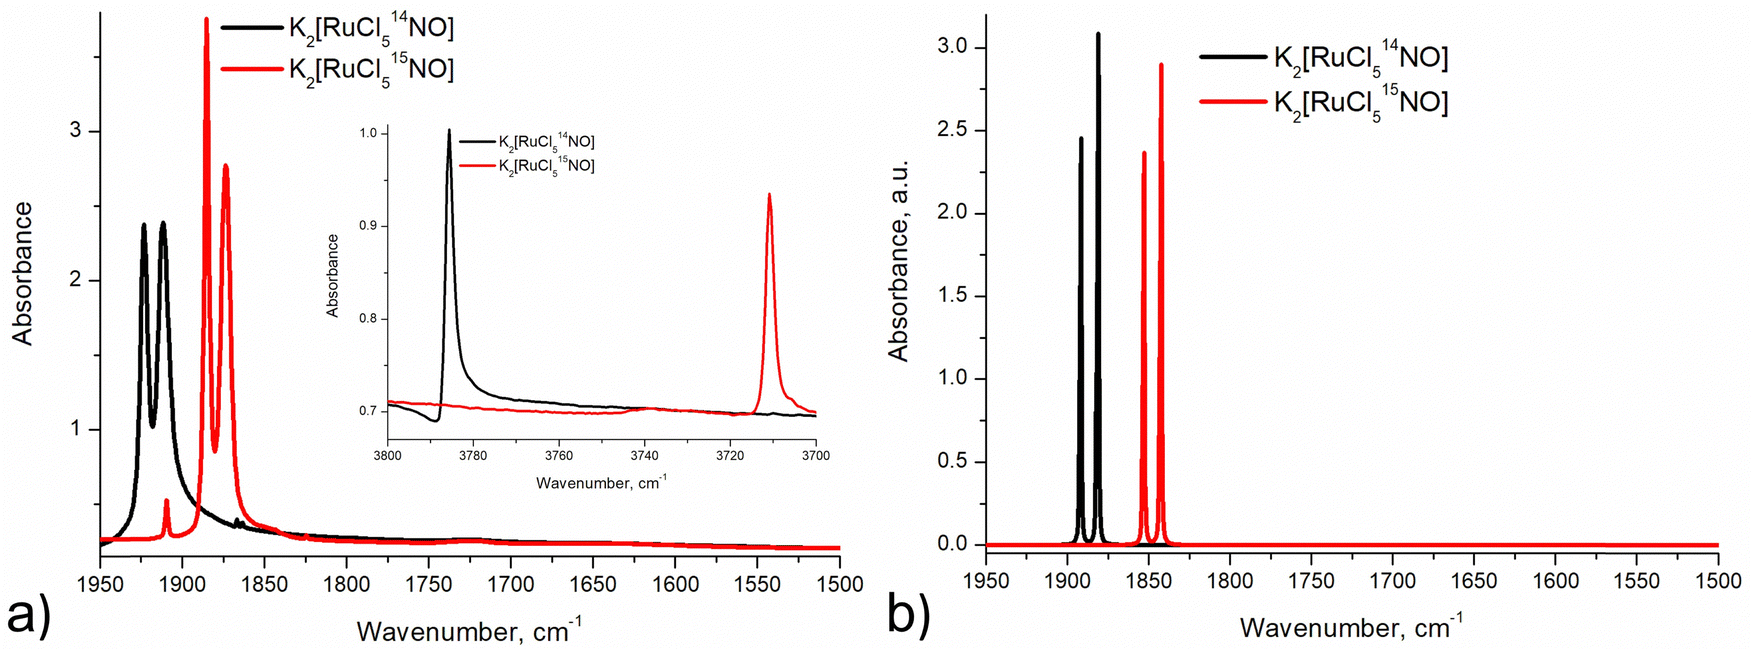 | ||
| Fig. 3 Infrared spectra: (a) experimental spectra (KBr pellet at 10 K) of 14NO (black line) and 15NO (red line) samples in GS in the range 1950–1500 cm−1 with an insert showing overtones of (NO) vibrations; (b) calculated (CASTEP) spectra of 14NO (black line) and 15NO (red line) complexes in GS in the range 1950–1500 cm−1. | ||
In GS, (NO) is split by 11 cm−1 into two bands at 1923 cm−1 and 1912 cm−1. Upon cooling from 296 K to 10 K these two bands shift by 8/9 cm−1 to higher wavenumbers. The first overtone at 3786 cm−1 shows no splitting. Since for the transition 0 → 2 there is only a small concentration in the n = 2 level, this splitting might thus depend on the concentration. For a sample with 96% isotopic substitution of 15N the splitting remains and both (NO) bands shift by 38 cm−1. We note however, that for the remaining 4% of 14N there is no observable splitting. There is no observable splitting either in the 15N band (0.38% natural abundance (NA)) of the original 14N spectrum. The two low-concentration bands without splitting are found at (14N16O) = 1910 cm−1 and (15N16O) = 1867 cm−1, respectively. Upon decreasing concentrations, the bands thus shift by 2 cm−1 and 7 cm−1 to lower wavenumbers, respectively. Hence, the band at 1923 cm−1 appears due to correlation through concentration, and is thus clearly a solid-state effect. Moreover, the vibrations involving 18O (NA of 0.205%) could be detected at (14N18O) = 1863 cm−1 and (15N18O) = 1825 cm−1, their difference being 38 cm−1 as expected, and again, no split can be observed. This type of splitting of the ν(NO) stretching mode into two bands was already measured and discussed by Piro et al.65 in Na2[Fe(CN)5NO]·2H2O (SNP) single crystals using reflectance spectroscopy. As a matter of fact, when considering the vibrational modes in the space group Pnnm of SNP and Pnma for the K2[RuCl5NO] crystal structure, the ν(NO) correlates into the two infrared active optic modes B2u and B3u so that two bands can be expected for a crystalline material.
The anharmonicity of the NO potential with respect to the fundamental 1912 cm−1 is 38 cm−1 for the first and 95 cm−1 for the second overtone. Furthermore, the isotopic substitution with 15N allows to unambiguously assign the ν(RuN) stretching and δ(RuNO) deformation vibrations (see Fig. S3, ESI†). For (RuN) the isotopic shift is only 8 cm−1 (from 609 to 601 cm−1) while for δ(RuNO) it is 16/14 cm−1 (from 590/585 to 574/571 cm−1), so that the larger shift can be used to assign the deformation vibration also for MS1 and MS2. For GS this technique was already used by Miki59–61 through application of a linear three-body model for Ru–N–O. Table 3 summarizes the experimental data and DFT-calculated vibrations for the solid state, along with the differences between experiment and calculation. Overall the agreement between experiment and calculation is good, the largest deviation is found for the (NO) with 41/43 cm−1 for 14N. Note however, that in relative terms the deviation for the (RuN) is with −33/32 cm−1 much higher. The splitting of the deformation mode can be observed also in the first overtone at 1179/1165 cm−1, indicating an influence of the local environment, supported by the fact that the lower energy band is broad.
| Mode | GS-14N | GS-15N | Δ(Iso) | DFT-14N | DFT-15N | Δ(Isoto) | Δ 14N(exp − calc) |
|---|---|---|---|---|---|---|---|
| 3 × (NO) |
5641 | 5527 | 114 | — | — | — | — |
| 2 × (NO) |
3786 | 3711 | 75 | — | — | — | — |
|
(NO) |
1923 | 1885 | 38 | 1882 | 1844 | 38 | 41 |
| 1912 | 1874 | 38 | 1869 | 1831 | 38 | 43 | |
| 2 × (RuN) |
1213 | 1196 | 17 | — | — | — | — |
| 2 × δ(RuNO) | 1179 | 1147 | 32 | — | — | — | — |
| 2 × δ(RuNO) | 1165 | 1139 | 26 | — | — | — | — |
|
(RuN) |
609 | 601 | 8 | 642/641 | 635/633 | 7/8 | −33/−32 |
| δ(RuNO) | 590 | 574 | 16 | 577 | 561 | 16 | 13 |
| 585 br | 571 br | 14 | 573/569 | 558/554 | 15/15 | 12/16 | |
|
(RuCl) |
349 | 349 | 0 | 339 | 339 | 0 | 10 |
|
(RuCl) |
343 | 343 | 0 | 335/334 | 335/333 | 0/1 | 8/9 |
|
(RuCl) |
332 | 332 | 0 | 330 | 330 | 0 | 2 |
|
(RuCl) |
324 | 324 | 0 | 328 | 328 | 0 | −4 |
3.2. Metastable state MS2
Due to the space group Pnma in GS the Cl4-Ru–N–O axis lies in the mirror plane m. Since DFT geometry optimization provides local energy minima, different positions of the NO ligand are chosen as a starting point for the energy minimization, in order to find out whether the mirror plane is conserved in MS2. For the calculation of the structural model of MS2, we used as starting position the polar Ru–N–O angle θ as 90° and chose an azimuthal position of φ = 90°, i.e. the NO ligand is oriented along the direction of Ru–Cl2 bonds, the so-called eclipsed geometry of MS266 (see Fig. 4a, top). DFT Geometry optimization was then performed and in the course of the convergence of the calculation, the NO ligand did rotate stepwise so that in the end this azimuthal angle φ amounts to 0°, i.e. the O atom of N-O ligand is oriented in direction to the Ru–Cl1 and Ru-Cl3 bonds. Another projection of the converged structure is shown in Fig. 4a, bottom. | ||
| Fig. 4 Calculated structural model of [RuCl5NO]2− in MS2: (a) Initial and converged structure of MS2 converging O atom of NO towards Cl1 ligand; (b) initial and converged structure of MS2 converging O atom of NO towards Cl3 ligand. | ||
In order to verify the azimuthal position of the NO in MS2, we performed calculations with several starting geometries of the NO group, choosing the azimuthal position of φ = 45°, i.e. the NO ligand is oriented along the direction between Ru–Cl1 and Ru–Cl2 bonds, the so-called staggered geometry of MS2 (Fig. 4b, top). For the latter, the converged position of the O atom is pointing towards the Cl3 ligand (see Fig. 4b, top). The energy of the NO position where O is closer to Cl3 is 0.12 eV higher than that for the direction towards Cl1, so that the latter corresponds to the global minimum of MS2 (Fig. 4a). In GS the symmetry related distances Ru–Cl2 and Ru–Cl2′ are identical with 2.371(1) Å. According to the calculations the NO remains in the mirror plane and the Ru–Cl2 and Ru–Cl2′ distances are identical (see Fig. 4), independent whether the final position of the O atom is towards Cl1 or Cl3. These two configurations lead to different Ru–Cl1 distances. When the oxygen atom of NO is in the direction of Cl1, the bond lengths of Ru–Cl1 is shorter than that of Ru–Cl3. The calculations were performed in space groups with lower symmetry (P21/c and P1) in order to avoid symmetry-induced preferential orientations for NO, especially due to the mentioned mirror plane. Table 4 summarizes the calculated structural data for GS and MS2 and the corresponding differences. The pairs of values correspond to the two configurations where the O atom is in direction of Ru–Cl3/Ru–Cl1.
| Distances/angles | MS2 (DFT) | GS (DFT) | Δ(MS2-GS) |
|---|---|---|---|
| Ru–N | 1.900/1.908 | 1.727 | +0.173/+0.181 |
| Ru–O | 2.137/2.131 | — | — |
| N–O | 1.207/1.210 | 1.152 | +0.055/+0.058 |
| Ru–Cl4trans | 2.324/2.327 | 2.355 | −0.031/−0.028 |
| Ru–Cl1 | 2.446/2.356 | 2.384 | +0.062/−0.028 |
| Ru–Cl2 | 2.376/2.373 | 2.380 | −0.004/−0.007 |
| Ru–Cl3 | 2.342/2.425 | 2.369 | −0.027/+0.056 |
| ∠Ru–N–O | 83.8/83.0 | 172.5 | −88.7/−89.5 |
Due to the fact that experimentally achievable populations of MS2 and MS1 in K2[RuCl5NO] are rather low, infrared spectroscopy is the best tool to obtain structural information on these linkage isomers. The side-on geometry of MS2 leads to a pronounced downshift of (NO) by 369/362 cm−1 with respect to GS. The observed splitting in MS2 is three times smaller than the one observed in GS. Since the population of MS2 is very low (only 2–3%), the origin of the splitting in MS2 is most probably due to the local environment and not a consequence of a coupling to the lattice.
As for GS, we performed solid-state DFT calculations of the IR vibrations on the structural model obtained in 4a, which corresponds to the minimum-energy configuration. As listed in Table 5, the difference between calculated and experimental (NO) values are 63/66 cm−1 and thus about 20 cm−1 larger than in GS. Fig. 5 and Fig. S4, S5 (ESI†) illustrate the experimental and solid-state DFT-calculated infrared spectra, respectively. Surprisingly, we observe a shift by 18 cm−1 to higher wavenumbers for the δ(Ru–O–N) deformation mode, even though atomic distances increase in MS2 with respect to GS. The assignment of the band to the deformation mode is based on the larger isotopic shift compared to the (Ru–N) stretching mode. The latter is hidden by the Ru–Cl vibrational modes, and the calculation shows that it has a small cross section. Possibly, the detected intensity changes in the band at 349 cm−1 after transferring MS1 to MS2 through 1310 nm irradiation, are due to the appearance of the ν(Ru–N) stretching mode of MS2, but the change is too small to unambiguously assign it. For all the other bands, the agreement between calculated and experimentally observed isotope shift is excellent, so that their assignment is unambiguous, even though the absolute value of the upshift of the δ(Ru–O–N) deformation mode is largely overestimated by the calculation (+99 cm−1) compared to the observed +18 cm−1. The calculated downshift of (Ru–N) is -219 cm−1, possibly much to large. However, the direction of the shift of these two bands is opposite and in agreement with experiment. Similar trends were reported earlier.29,30
| Mode | MS2-14N | MS2-15N | Δ(Iso) | DFT-14N | DFT-15N | Δ(Iso) | Δ(14N) |
|---|---|---|---|---|---|---|---|
|
(NO) |
1554/1550 | 1527/1522 | 27/28 | 1491/1484 | 1464/1457 | 27/27 | +63/+66 |
| δ(RuNO) | 608/603 | 593/588 | 15/15 | 676/673 | 658/654 | 18/19 | −68/−70 |
|
(RuN) |
— | — | — | 423/422 | 421/419 | 2/3 | — |
|
(RuCl) |
349 | 349 | 0 | 342 | 342 | 0 | 7 |
|
(RuCl) |
343 | 343 | 0 | 340 | 340 | 0 | 3 |
|
(RuCl) |
338 | 338 | 0 | 328 | 328 | 0 | 10 |
|
(RuCl) |
332 | 332 | 0 | 325/324 | 325/324 | 0 | 7 |
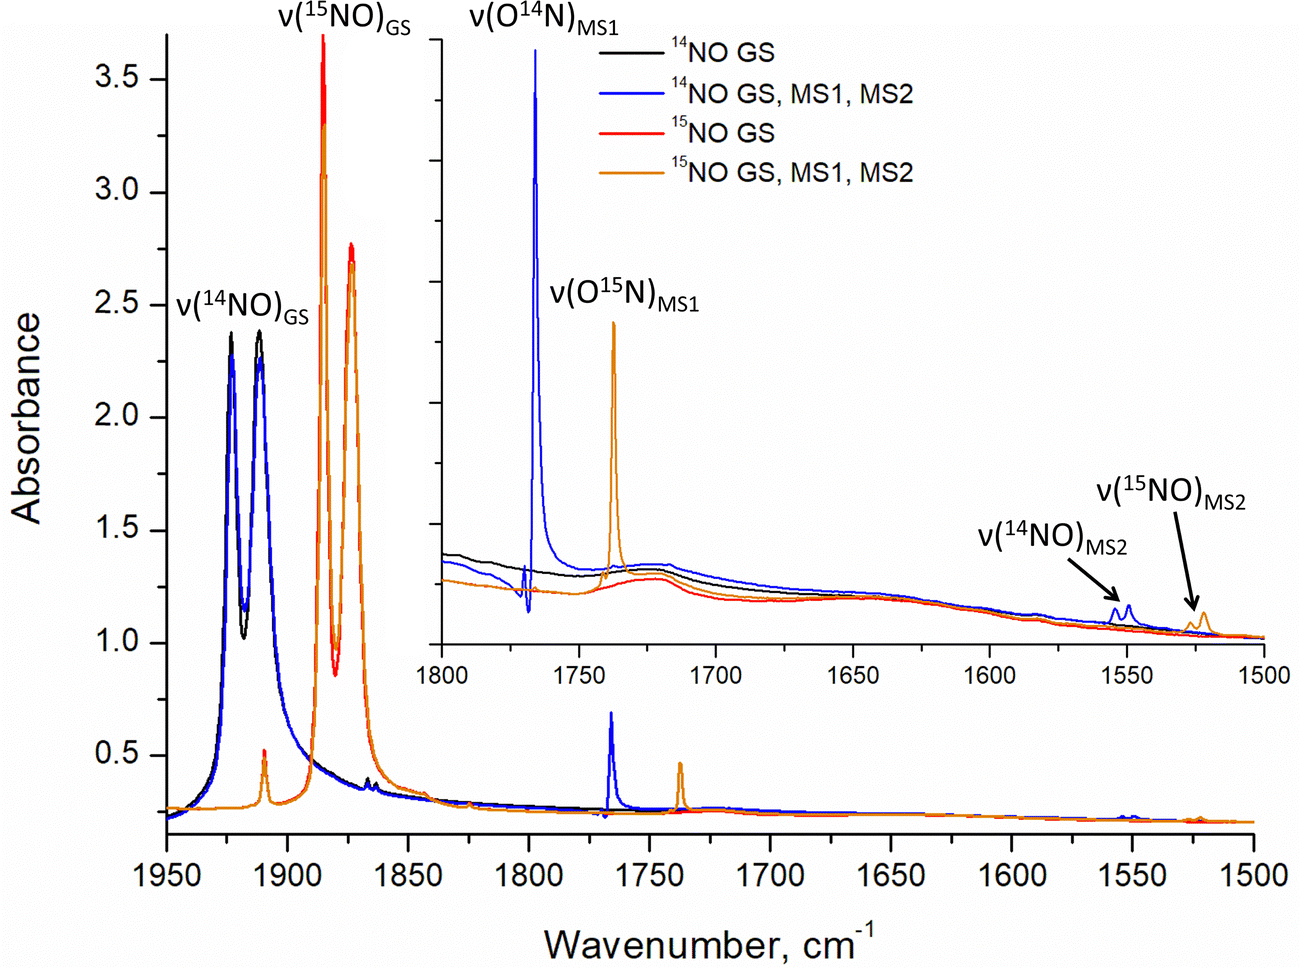 | ||
| Fig. 5 Comparison of the experimentally observed vibrations of GS, MS1 and MS2 in the spectral range of 1950–1500 cm−1. The spectra were measured at 10 K, MS1 and MS2 were photogenerated by irradiation at 520 nm. | ||
3.3. Metastable state MS1
As for MS2, the experimentally achievable population of MS1 is too low to perform X-ray crystallography. Hence, we present the geometry-optimized model where we used as a starting point the structure of GS where O and N have been interchanged. The resulting DFT-calculated structural model is shown in Fig. 6.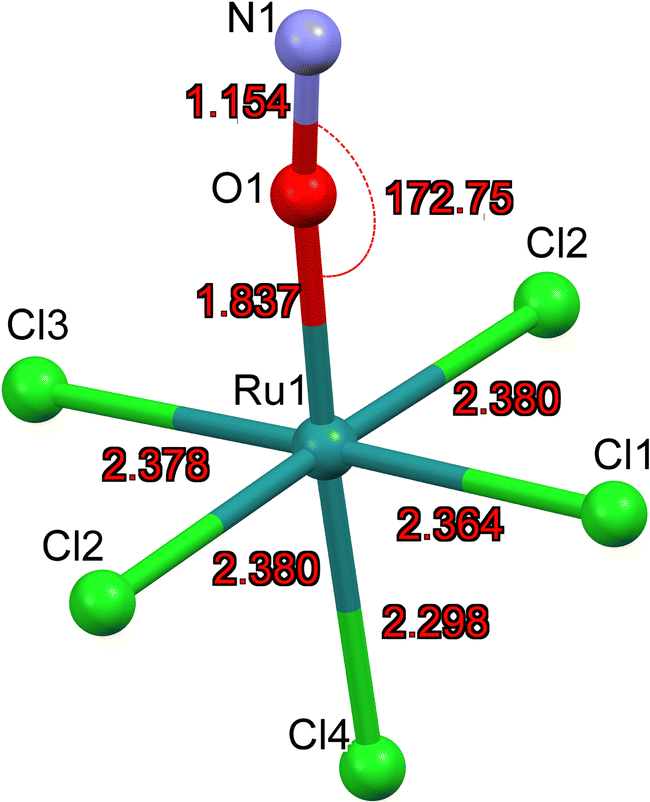 | ||
| Fig. 6 DFT calculated structural model of [RuCl5(ON)]2− in MS1. | ||
Table 6 summarizes the most important structural changes between GS and MS1, notably the increased Ru–O distance of 1.837 Å compared to GS Ru–N distance of 1.727 Å and the significantly shortened Ru–Cl4 bond (Cl4 = trans to NO) of 2.298 Å compared to 2.355 Å in GS. The N–O distance remains almost the same in the inverted MS1 geometry and the polar Ru–O–N angle points again toward Cl1. The Ru–Cl1 distance decreases by 0.02 Å.
| Distances/angles | MS1(DFT) | GS(DFT) | Δ(MS1-GS) |
|---|---|---|---|
| Ru–O/N | 1.837 | 1.727 | +0.110 |
| N–O | 1.154 | 1.152 | +0.002 |
| Ru–Cl4trans | 2.298 | 2.355 | −0.057 |
| Ru–Cl1 | 2.364 | 2.384 | −0.020 |
| Ru–Cl2 | 2.380 | 2.380 | 0 |
| Ru–Cl3 | 2.378 | 2.369 | +0.009 |
| ∠Ru–O–N/Ru–N–O | 172.8 | 172.5 | +0.3 |
With respect to the vibrational bands, the increase or decrease of atomic distances is expected to lead to a corresponding decrease or increase of the vibrational frequency. We note immediately that especially for the case of the (NO) stretching vibration the large downshift of 153/146 cm−1 in MS1 with respect to GS cannot be explained in this manner.
As for the other isomers, we performed solid-state DFT calculations of the IR vibrations. Table 7 lists the experimental and calculated vibrations for 14N and 15N in MS1, and the corresponding spectra are shown in Fig. 5. The (Ru–Cl) vibrations do not exhibit any change when going from GS to MS1. For (NO) we observe again a splitting as in GS, for the NA sample the two 14N bands are found at 1770/1766 cm−1 and for the 96% 15N the two bands at 1741/1737 cm−1, thus an isotopic shift of 29 cm−1. The 14N band (4%) in the 15N sample is found as a single band at 1766 cm−1, analogous to the GS case we interpret thus the splitting as due to coupling to the lattice, and the correlation-free band is the one found for low concentrations at 1766 cm−1. The assignment of the (RuO) band at 467 (465) cm−1 and δ(RuON) band at 454 (449) cm−1 can be made by the smaller/larger isotope shift. We note that the (RuO) band remains the higher frequency band in MS1 as in GS, even after rotation of the NO ligand. The rather important downshift for (RuO) and δ(RuON) of 142 and 136 cm−1, respectively, is compatible with the significant change in Ru–O bond length of +0.11 Å compared to the Ru–N GS configuration, which is in line with the previous report.42 While the (NO) in MS1 are well reproduced by the calculations, the (RuO) and δ(RuON) are overestimated and hence the downshift with respect to GS is underestimated. Moreover, the calculation indicates a splitting of 1 cm−1 for the δ(RuON), which was not detected experimentally (resolution of 1 cm−1), since these bands are weak and broad.
| Mode | MS1-14N | MS1-15N | Δ(Iso) | DFT-14N | DFT-15N | Δ(Iso) | Δ(14N) |
|---|---|---|---|---|---|---|---|
| 2 × (NO) |
3499 | 3443 | 56 | — | — | — | — |
|
(NO) |
1770/1766 | 1741/1737 | 29/29 | 1778/1772 | 1749/1743 | 29/29 | 8/6 |
|
(RuO) |
467 | 465 | 2 | 486/484/482 | 485/480/479 | 1/4/3 | −19/−17/−15 |
| δ(RuON) | 454 | 449 | 5 | 506/505 | 500/499 | 6/6 | −52/−45 |
|
(RuCl) |
349 | 349 | 0 | 346 | 346 | 0 | 3 |
|
(RuCl) |
343 | 343 | 0 | 344 | 344 | 0 | 1 |
|
(RuCl) |
332 | 332 | 0 | 325 | 325 | 0 | 7 |
|
(RuCl) |
324 | 324 | 0 | 318/316 | 318/316 | 0 | 6/8 |
4. Discussion
Due to the strong coupling between the [RuCl5NO]2− anion and the K+ cation sublattices, a solid-state calculation is necessary to assess correctly the structures of GS, MS2 and MS1. Since the performed solid-state CASTEP calculations show good agreement with all atomic distances, the positions of the vibrational bands and the chemical shifts in GS, we used this calculation to perform a Bader analysis to determine the charges on the atoms (see Table 8). In this manner the charge redistribution upon generation of the two PLI MS1 and MS2 with respect to GS can be investigated.| GS | MS2 | MS1 | ||||||
|---|---|---|---|---|---|---|---|---|
| Total | charge q | Total | charge q | Δq | Total | charge q | Δq | |
| O | 6.32 | −0.32 | 6.37 | −0.37 | +0.05 | 6.46 | −0.46 | +0.14 |
| N | 4.83 | +0.17 | 4.88 | +0.12 | +0.05 | 4.62 | +0.38 | −0.21 |
| Ru | 14.73 | +1.27 | 14.78 | +1.22 | +0.05 | 14.78 | +1.22 | +0.05 |
| Cl1 | 7.55 | −0.55 | 7.55 | −0.55 | ±0.00 | 7.56 | −0.56 | +0.01 |
| Cl2 | 7.57 | −0.57 | 7.56 | −0.56 | −0.01 | 7.59 | −0.59 | +0.02 |
| Cl3 | 7.56 | −0.56 | 7.50 | −0.50 | −0.06 | 7.57 | −0.57 | +0.01 |
| Cl4trans | 7.57 | −0.57 | 7.50 | −0.50 | −0.07 | 7.52 | −0.52 | −0.05 |
| K | 8.15 | +0.85 | 8.15 | +0.85 | ±0.00 | 8.15 | +0.85 | ±0.00 |
| ∑(RuNO) | 25.88 | +1.12 | 26.03 | +0.97 | +0.15 | 25.86 | +1.14 | −0.02 |
| ∑(Cl) | 37.82 | −2.82 | 37.67 | −2.67 | −0.15 | 37.83 | −2.83 | +0.01 |
| [RuCl5NO] | −1.70 | −1.70 | −1.69 | |||||
The total charges on the atoms are calculated with respect to the charge enclosed in the Bader volume defined by the surface of minimal charge density between atoms; the resulting charge q on the atom is given by the difference with respect to the neutral atom. In GS the NO is negative (−0.15e), in MS2 it gets even more negative (−0.25e) while in MS1 it is almost neutral (−0.08e). Hence, the downshift of (NO) cannot be explained by a pure charge redistribution effect. The simple rule that the more negative the NO the lower the ν(NO) stretching vibration, does not apply to the present case, and we have to search for further mechanisms.
In MS1 we observe a charge redistribution between N, O and Ru upon NO inversion. The negative charge on the oxygen atom increases by 0.14e, that on the nitrogen decreases by 0.21e and that of the ruthenium atom increases by 0.05e. Moreover, 0.05e are redistributed from the trans-to-NO ligand Cl4trans to the equatorial Cl-ligands, which also receive the minimal excess charge from RuNO. The decisive charge redistribution occurs thus, as might be expected, on the N and O atoms. In MS2 the negative charge on the Ru, N, O atoms is equally increased by 0.05e. This charge stems from the Cl ligands, in particular from Cl4trans and Cl3, so that in MS2 the Cl-ligands contribute much more charge for the stabilization of this structural configuration.
Such a charge redistribution when going from GS to MS1 was also calculated for the complex trans-[Ru(py)4(NO)F](ClO4)2,48 for which the NO has a Bader charge of −0.13e in the GS, which reduces to -0.03e in the MS1. The frequency of the (NO) stretching vibration changes from GS(NO) = 1909 cm−1 to MS1(NO) = 1761 cm−1, i.e. by 148 cm−1, which compares well with the observations of the shift of 146/153 cm−1 in K2[RuCl5NO]. Hence, also for this second ruthenium-nitrosyl complex (cation instead of anion) the downshift of (NO) cannot be explained by a simple increase of the total charge on the NO.
Overall one could thus potentially explain the downshift of the ν(NO) stretching vibration, and hence the reduced force constant, for MS2 by the increase in charge of 0.10e and in bond length of 0.058 Å (in case of O–Cl1 geometry). But for MS1 this argument no longer holds, since the charge on the NO ligand is reduced by 0.07e with respect to GS and the change in bond length amounts to only 0.002 Å. Already Sizova and co-workers30 discussed this discrepancy between the calculated and experimental results for the vibrational frequencies, which occur especially for MS1. They investigated the influence of the environment by applying a polarizable continuum model (PCM), which nevertheless did not resolve the issue for MS1. In such a simple picture, the contribution of the coupling between (RuN) and (NO) to the experimentally observed values is neglected. As a matter of fact, Sizova et al.30 indicated the contributions of the internal coordinates to the NO and RuNO vibrations for the [RuCl5NO]2− complex, which amounts up to 11% of (RuN) to 89% (NO) in GS using a valence force model, but without proceeding to a detailed analysis including further calculations of local force constants. Such a complete decoupling for the solid state by the transformation of all vibrations into a pure two-atomic behavior can be obtained by using the local vibrational mode theory formalism.32 Using the PyMol plugin, named LModeA-nano, implementing the local vibrational mode theory for periodic systems,46 we obtain the decoupled wavenumbers and force constants kdc. The coupled force constants kc, which are given in Table 9, can then be obtained from the equation kc/kdc = (c/dc)2 with the calculated wavenumbers.
) and force constants (k) as well as corresponding differences Δ
|
, k |
Decoupled (dc, kdc) |
Coupled (c, kc) |
Δ(coupled–decoupled) | ||||||
|---|---|---|---|---|---|---|---|---|---|
| cm−1, N cm−1 | GS | MS2 | MS1 | GS | MS2 | MS1 | GS | MS2 | MS1 |
|
(NO) calc. |
1799 | 1408 | 1741 | 1869 | 1484 | 1772 | +70 | +76 | +31 |
|
(NO) exp. |
1912 | 1550 | 1766 | +113 | +142 | +25 | |||
|
(RuN,O) calc. |
884 | 636 | 643 | 641 | 422 | 482 | −243 | −214 | −161 |
|
(RuN,O) exp. |
609 | — | 467 | −275 | — | −176 | |||
| k(NO) | 14.239 | 8.72 | 13.334 | 15.369 | 9.687 | 13.813 | 1.130 | 0.967 | 0.479 |
| k(RuN,O) | 5.658 | 2.930 | 3.368 | 2.975 | 1.290 | 1.893 | −2.683 | −1.640 | −1.475 |
The most important result of the decoupling is the blueshift of the dc(RuN), dc(RuO) vibrations and the redshift of dc(NO) with respect to the coupled c values, which demonstrates together with the resulting force constants the strong coupling of the corresponding atomic movements. Since the transformation into local modes is a linear operation, the resulting decoupled parameters still reflect the same physical properties. So, if there would be an unusual behavior of the vibrations in the metastable states it should remain visible in the uncoupled parameters. Due to the fact that these local modes are harmonic oscillators, the force constants depend on the wavenumbers as k = 4π2c2μ2 in which c is the light velocity, μ is the reduced mass of the corresponding atoms and is the wavenumber. The pre-factor 4π2c2μ is then exactly the same for GS, MS2 and MS1, so that the decoupled wavenumbers of these three states need all follow the same quadratic dependence k ∼ 2. Additionally, the fitted pre-factor must be identical with the calculated one, which is indeed the case for the NO, since the calculated pre-factor is 4.399096 × 10⁻⁴ cm2 kg s−2 and the fitted one is 4.3992(4) × 10−4 cm2 kg s−2 (Fig. 7). This quadratic dependence of the local force constants on the calculated decoupled vibrations shows the pure functional dependence of the harmonic oscillator, e.g., the two-atomic system NO, which then should be true, independent of the system in which the NO is integrated. This can be clearly seen when inserting the calculated decoupled values from the study of Popp & Kluefers28 for different metal-nitrosyl complexes, as shown in Fig. 7.
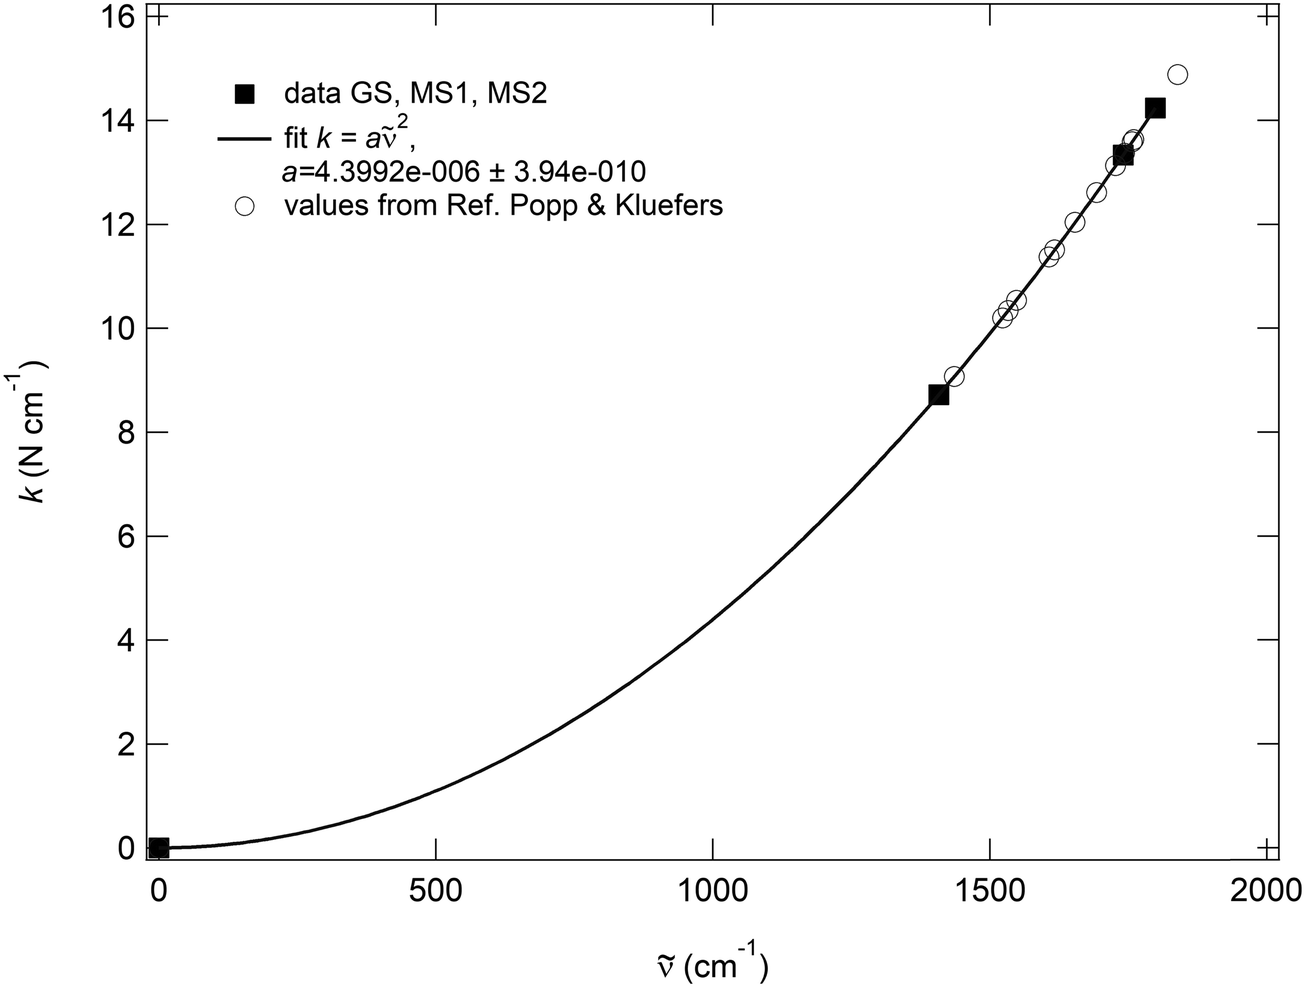 | ||
| Fig. 7 Quadratic dependence kdc = a(dc)2, (a = 4π2c2μ) for the NO stretching vibration of GS, MS1, and MS2 in K2[RuCl5NO], resulting from the decoupling into two-atomic harmonic oscillators. For the fit, the point k = = 0 has been added. | ||
An immediate consequence of these findings is that the experimentally measured red- or blueshifts for the vibrations of an atomic group (pair) cannot be used as a direct measure of possible underlying distance changes or charge redistributions, since the experimentally observed vibrations are always the result of coupled motions. However, the calculated decoupled force constants, being local force constants, confirm the softening of the N–O and Ru–N, Ru–O bonds, which is more pronounced for the side-on geometry. In order to properly interpret the observations, we might estimate the coupling of the modes, in particular between the (NO) and (RuN) and (RuO). Comparing the coupled and uncoupled values, we can see from Table 9 that for NO all coupled force constants, kc, are higher than their uncoupled counterparts, kdc. For Ru–N/O the coupled force constants are lower than the uncoupled ones. Thus, there is transfer of bond strength from the Ru–N/O to the N–O. This transfer varies significantly between the three states as we can estimate using the ratios Δ(coupled–decoupled)/kc for the gain in NO bond strength and Δ(coupled–decoupled)/kdc for the loss in Ru–N and Ru–O bond strength. While for GS the N–O receives 7.35% bond strength at a cost of 47.42% loss of bond strength in Ru–N, for MS1 the N–O receives only 3.47% with a loss of 43.79% for the Ru–O. Thus, the seemingly unusually large redshift of (NO) observed in MS1 is actually largely due to the fact that there is less transfer from the Ru–O bond to the N–O bond than in the GS (Ru–N to N–O). For MS2, the N–O receives 9.98% at a loss of 55.97% for Ru-N. Note that these are all calculated values as we have no means to access experimentally the uncoupled parameters. Furthermore, we have to keep in mind that the calculated coupled vibrational frequencies are underestimated compared to the experimental values (Table 9) except for MS1.
Still, one problem remains unresolved by the local vibrational mode transformation: the anharmonicity of the measured values. The strong change of the dipole moment allows to measure the first and second overtones, which show the anharmonicity of the NO potential. This is not considered in the local mode calculation. Nevertheless, the quadratic dependence k ∼ 2 of all vibrations after the local mode transformation clearly shows that all photoinduced linkage isomers behave as expected and that the observed, seemingly atypical, large shift of the (NO) stretching vibration is due to a significant change in the coupling of the N–O and Ru–N/O modes, and thus does not properly reflect the intrinsic changes in bond strength. One should therefore refrain from interpreting this observed shift directly into changes of bond length or even redistribution of charge on the NO group. In view of the fact that we can now treat the decoupled vibrations of NO in the framework of a two-atomic harmonic oscillator, the observed redshift of the (NO) vibration when going from GS to MS1 and MS2 might be explained by the influence of an external lateral charge-ligand interaction, as proposed by Popp & Klufers28 for diatomic ligands like NO or CO. Additionally, an internal contribution due to modified occupations of the N(2s), N(2p), O(2s), O(2p) and Ru(4d) orbitals, as can be seen from a Mulliken population analysis (see discussion in Supplementary material and Table S6), might also contribute to this shift. Further calculations are necessary to shine light on these potential external and internal contributions.
5. Conclusion
The solid-state DFT calculations reproduce with good accuracy the structures and vibrational frequencies in the three linkage isomers GS, MS1 and MS2 of K2[RuCl5NO], such that the calculated Bader charges represent an excellent model for the real charges on the atoms. Based on this Bader charge analysis we show that the downshift of the(NO) stretching vibration in MS1 and MS2 cannot be explained by an increase of the charge on the NO. The local mode transformations of (NO), (RuN) and (RuO) decouples these vibrations into two-atomic harmonic oscillators, revealing a significant change in coupling between ν(NO) and ν(RuN) in GS compared to ν(NO) and ν(RuO) in MS1. Hence, the experimentally observed redshift of the ν(NO) stretching vibration should not be directly used for a physical interpretation of possible photoinduced changes of the NO bond strength.
Conflicts of interest
There are no conflicts to declare.Acknowledgements
We thank B. A. Kolesov for measurement of Raman spectra. The work has been financially supported by RSF (22-43-09001) in the part of synthesis and spectroscopy and ANR (grant no. ANR-21-CE30-0045-01). We thank the PMD2X platform of Université de Lorraine for granting access to XRD diffractometers. High Performance Computing resources were partially provided by the EXPLOR centre hosted by the Université de Lorraine.References
- D. Awasabisah and G. B. Richter-Addo, Advances in Inorganic Chemistry, Elsevier, 2015, vol. 67, pp. 1–86 Search PubMed.
- T. E. Bitterwolf, Photochemical nitrosyl linkage isomerism/metastable states, Coord. Chem. Rev., 2006, 250, 1196–1207 CrossRef CAS.
- P. Coppens, I. Novozhilova and A. Kovalevsky, Photoinduced Linkage Isomers of Transition-Metal Nitrosyl Compounds and Related Complexes, Chem. Rev., 2002, 102, 861–884 CrossRef CAS PubMed.
- C. Daniel and C. Gourlaouen, Chemical bonding alteration upon electronic excitation in transition metal complexes, Coord. Chem. Rev., 2017, 344, 131–149 CrossRef CAS.
- P. Gütlich, Y. Garcia and T. Woike, Photoswitchable coordination compounds, Coord. Chem. Rev., 2001, 219–221, 839–879 CrossRef.
- I. Stepanenko, M. Zalibera, D. Schaniel, J. Telser and V. B. Arion, Ruthenium-nitrosyl complexes as NO-releasing molecules, potential anticancer drugs, and photoswitches based on linkage isomerism, Dalton Trans., 2022, 51, 5367–5393 RSC.
- J. V. Esplugues, NO as a signalling molecule in the nervous system: NO in the nervous system, Br. J. Pharmacol., 2002, 135, 1079–1095 CrossRef CAS PubMed.
- P. Picón-Pagès, J. Garcia-Buendia and F. J. Muñoz, Functions and dysfunctions of nitric oxide in brain, Biochim. Biophys. Acta, Mol. Basis Dis., 2019, 1865, 1949–1967 CrossRef PubMed.
- D. Schaniel, M. Imlau, T. Weisemoeller, T. Woike, K. W. Krämer and H.-U. Güdel, Photoinduced Nitrosyl Linkage Isomers Uncover a Variety of Unconventional Photorefractive Media, Adv. Mater., 2007, 19, 723–726 CrossRef CAS.
- M. Goulkov, D. Schaniel and T. Woike, Pulse recording of thermal and linkage isomer gratings in nitrosyl compounds, J. Opt. Soc. Am. B, 2010, 27, 927 CrossRef CAS.
- A. Hasil, D. Beck, D. Schröder, S. Pillet, E. Wenger, T. Woike, P. Klüfers and D. Schaniel, Pas de Deux of an NO Couple: Synchronous Photoswitching from a Double-Linear to a Double-Bent Ru(NO)2 Core under Nitrosyl Charge Conservation, Angew. Chem., Int. Ed., 2022, 61(42), e202210671 CrossRef CAS PubMed.
- R. D. Yamaletdinov and I. L. Zilberberg, The Effect of trans Ligands in the NO-Linkage Reverse Isomerization for Ruthenium–Nitrosyl–Tetraammine Complexes: A DFT Study, Eur. J. Inorg. Chem., 2017, 2951–2954 CrossRef CAS.
- A. A. Mikhailov, G. A. Kostin and D. Schaniel, The influence of the trans-ligand to NO on the thermal stability of the photoinduced side-bond coordinated linkage isomer, New J. Chem., 2022, 46, 12641–12650 RSC.
- A. A. Mikhailov, E. Wenger, G. A. Kostin and D. Schaniel, Room-Temperature Photogeneration of Nitrosyl Linkage Isomers in Ruthenium Nitrosyl Complexes, Chem. – Eur. J., 2019, 25, 7569–7574 CrossRef CAS PubMed.
- A. A. Mikhailov, T. S. Sukhikh, N. V. Kuratieva, D. P. Pishchur and G. A. Kostin, Remarkable thermal stability of light-induced Ru–ON linkage isomers in mixed salts of a ruthenium amine complex with a trans -ON–Ru–F coordinate, Dalton Trans., 2021, 50, 2864–2871 RSC.
- A. In-Iam, M. Wolf, C. Wilfer, D. Schaniel, T. Woike and P. Klüfers, {FeNO}7-Type Halogenido Nitrosyl Ferrates: Syntheses, Bonding, and Photoinduced Linkage Isomerism, Chem. – Eur. J., 2019, 25, 1304–1325 CrossRef CAS PubMed.
- D. Schaniel, J. Schefer, B. Delley, M. Imlau and T. Woike, Light-induced absorption changes by excitation of metastable states in Na2[Fe(CN)5NO]2H2O single crystals, Phys. Rev. B: Condens. Matter Mater. Phys., 2002, 66, 085103 CrossRef.
- D. Schaniel and T. Woike, Necessary conditions for the photogeneration of nitrosyl linkage isomers, Phys. Chem. Chem. Phys., 2009, 11, 4391 RSC.
- D. Schaniel, M. Nicoul and T. Woike, Ultrafast reversible ligand isomerisation in Na2[Fe(CN)5NO]·2H2O single crystals, Phys. Chem. Chem. Phys., 2010, 12, 9029 RSC.
- G. Gallé, M. Nicoul, T. Woike, D. Schaniel and E. Freysz, Unraveling the mechanism of NO ligand photoisomerism by time-resolved infrared spectroscopy, Chem. Phys. Lett., 2012, 552, 64–68 CrossRef.
- F. Talotta, M. Boggio-Pasqua and L. González, Early Relaxation Dynamics in the Photoswitchable Complex trans-[RuCl(NO)(py)4]2+, Chem. – Eur. J., 2020, 26, 11522–11528 CrossRef CAS PubMed.
- D. Schaniel, T. Woike, B. Delley, D. Biner, K. W. Krämer and H.-U. Güdel, Generation of one light-induced metastable nitrosyl linkage isomer in [Pt(NH3)4Cl(NO)]Cl2 in the red spectral range, Phys. Chem. Chem. Phys., 2007, 9, 5149 RSC.
- D. Schaniel, T. Woike, N.-R. Behrnd, J. Hauser, K. W. Krämer, T. Todorova and B. Delley, Photogeneration of Nitrosyl Linkage Isomers in Octahedrally Coordinated Platinum Complexes in the Red Spectral Range, Inorg. Chem., 2009, 48, 11399–11406 CrossRef CAS PubMed.
- Y. Divó-Matos, Y. Avila, R. Mojica and E. Reguera, Nature of the observed ν(NO) band shift and splitting during the 3D to 2D structural change in transition metal nitroprussides, Spectrochim. Acta, Part A, 2022, 276, 121210 CrossRef PubMed.
- M. E. Jacox and W. E. Thompson, The vibrational spectra of molecular ions isolated in solid neon. IV. NO+, NO−, ONNO+, and ONNO−, J. Chem. Phys., 1990, 93, 7609–7621 CrossRef CAS.
- J. H. Enemark and R. D. Feltham, Principles of structure, bonding, and reactivity for metal nitrosyl complexes, Coord. Chem. Rev., 1974, 13, 339–406 CrossRef CAS.
- J. Popp, T. Riggenmann, D. Schröder, T. Ampßler, P. Salvador and P. Klüfers, Bent and Linear {CoNO}8 Entities: Structure and Bonding in a Prototypic Class of Nitrosyls, Inorg. Chem., 2021, 60, 15980–15996 CrossRef CAS PubMed.
- J. Popp and P. Klüfers, Bond Strength of a Diatomic Acceptor Ligand: A Reliable Measure of Its Antibond Occupation and Its Charge?, Eur. J. Inorg. Chem., 2022,(32), e202200374 CrossRef CAS.
- B. Delley, DFT study of crystalline nitrosyl compounds, Z. Kristallogr. – Cryst. Mater., 2008, 223, 329–333 CrossRef CAS.
- O. V. Sizova, O. O. Lubimova, V. V. Sizov and N. V. Ivanova, DFT study of metastable linkage isomers of six-coordinate ruthenium nitrosyl complexes, Z. Kristallogr. – Cryst. Mater., 2008, 223, 343–355 CrossRef CAS.
- R. F. W. Bader, A quantum theory of molecular structure and its applications, Chem. Rev., 1991, 91, 893–928 CrossRef CAS.
- Y. Tao, W. Zou, D. Sethio, N. Verma, Y. Qiu, C. Tian, D. Cremer and E. Kraka, In Situ Measure of Intrinsic Bond Strength in Crystalline Structures: Local Vibrational Mode Theory for Periodic Systems, J. Chem. Theory Comput., 2019, 15, 1761–1776 CrossRef CAS PubMed.
- V. A. Emel’yanov, M. A. Fedotov, A. V. Belyaev and S. V. Tkachev, A multinuclear magnetic resonance study of transformations of ruthenium(II) nitrosyl chloride complexes in aqueous solutions, Russ. J. Inorg. Chem., 2013, 58, 956–963 CrossRef.
- G. M. Sheldrick, SHELXT – Integrated space-group and crystal-structure determination, Acta Crystallogr., Sect. A: Found. Adv., 2015, 71, 3–8 CrossRef PubMed.
- O. V. Dolomanov, L. J. Bourhis, R. J. Gildea, J. A. K. Howard and H. Puschmann, OLEX2: a complete structure solution, refinement and analysis program, J. Appl. Crystallogr., 2009, 42, 339–341 CrossRef CAS.
- E. E. Mercer, W. M. Campbell and R. M. Wallace, Chloro Complexes of Nitrosylruthenium, Inorg. Chem., 1964, 3, 1018–1024 CrossRef CAS.
- D. Guenzburger, A. Garnier and J. Danon, Electronic structure, electronic spectra and Mössbauer hyperfine interactions in ruthenium complexes, Inorg. Chim. Acta, 1977, 21, 119–131 CrossRef CAS.
- S. J. Clark, M. D. Segall, C. J. Pickard, P. J. Hasnip, M. I. J. Probert, K. Refson and M. C. Payne, First principles methods using CASTEP, Z. Kristallogr. – Cryst. Mater., 2005, 220, 567–570 CrossRef CAS.
- C. J. Pickard and F. Mauri, All-electron magnetic response with pseudopotentials: NMR chemical shifts, Phys. Rev. B: Condens. Matter Mater. Phys., 2001, 63, 245101 CrossRef.
- J. P. Perdew, K. Burke and M. Ernzerhof, Generalized Gradient Approximation Made Simple, Phys. Rev. Lett., 1996, 77, 3865–3868 CrossRef CAS PubMed.
- E. V. Lenthe, E. J. Baerends and J. G. Snijders, Relativistic regular two-component Hamiltonians, J. Chem. Phys., 1993, 99, 4597–4610 CrossRef.
- A. A. Mikhailov, T. Woike, A. Gansmüller, D. Schaniel and G. A. Kostin, Photoinduced linkage isomers in a model ruthenium nitrosyl complex: Identification and assignment of vibrational modes, Spectrochim. Acta, Part A, 2021, 263, 120217 CrossRef CAS PubMed.
- H. J. Monkhorst and J. D. Pack, Special points for Brillouin-zone integrations, Phys. Rev. B: Solid State, 1976, 13, 5188–5192 CrossRef.
- A. Tkatchenko and M. Scheffler, Accurate Molecular van der Waals Interactions from Ground-State Electron Density and Free-Atom Reference Data, Phys. Rev. Lett., 2009, 102, 073005 CrossRef PubMed.
- J. Kendrick and A. D. Burnett, PDielec: The calculation of infrared and terahertz absorption for powdered crystals, J. Comput. Chem., 2016, 37, 1491–1504 CrossRef CAS PubMed.
- Y. Tao, W. Zou, S. Nanayakkara and E. Kraka, LModeA-nano: A PyMOL Plugin for Calculating Bond Strength in Solids, Surfaces, and Molecules via Local Vibrational Mode Analysis, J. Chem. Theory Comput., 2022, 18, 1821–1837 CrossRef CAS PubMed.
- M. Yu and D. R. Trinkle, Accurate and efficient algorithm for Bader charge integration, J. Chem. Phys., 2011, 134, 064111 CrossRef PubMed.
- A. Gansmüller, A. A. Mikhailov, G. A. Kostin, J. Raya, C. Palin, T. Woike and D. Schaniel, Solid-State Photo-NMR Study on Light-Induced Nitrosyl Linkage Isomers Uncovers Their Structural, Electronic, and Diamagnetic Nature, Anal. Chem., 2022, 94, 4474–4483 CrossRef PubMed.
- T. S. Khodashova and B. Bokii, Structure of potassium nitroso-pentachlororuthenate, J. Struct. Chem., 1960, 1, 138–145 CrossRef.
- T. S. Khodashova and G. B. Bokii, Refinement of the structure of potassium nitrosopentachlororu thenate, J. Struct. Chem., 1964, 5, 130–131 CrossRef.
- J. T. Veal and D. J. Hodgson, The crystal and molecular structure of potassium pentachloronitrosylruthenate(II), K2[Ru(NO)Cl5], Acta Crystallogr., Sect. B: Struct. Crystallogr. Cryst. Chem., 1972, 28, 3525–3529 CrossRef CAS.
- R. Zarhloul, R. Faure and J.-P. Deloume, Structural study of bonding in halogeno ruthenium complexes: Application to ruthenium nitrosyls, J. Crystallogr. Spectrosc. Res., 1992, 22, 601–606 CrossRef CAS.
- M. Rüdlinger, J. Schefer, P. Fischer, N. Furer and H. U. Güdel, Temperature-Dependence of the Crystal Structure of K2[RuCl5NO]: A Powder Neutron Diffraction Study, J. Solid State Chem., 1993, 103, 170–175 CrossRef.
- L. K. Bell, J. Mason, D. M. P. Mingos and D. G. Tew, Nitrogen-15 NMR studies of nitrosyl (bent and linear), nitro, and nitrito ligands in 4-, 5-, and 6-coordinate complexes of the platinum metals, Inorg. Chem., 1983, 22, 3497–3502 CrossRef CAS.
- J. Mason, D. M. P. Mingos, J. Schaefer, D. Sherman and E. O. Stejskal, Nitrogen-15 n.m.r. characterization of bent and linear nitrosyl ligands in the solid state by cross-polarisation magic-angle-spinning spectroscopy of complexes of ruthenium, J. Chem. Soc., Chem. Commun., 1985, 444 RSC.
- J. Mason, L. F. Larkworthy and E. A. Moore, Nitrogen NMR Spectroscopy of Metal Nitrosyls and Related Compounds, Chem. Rev., 2002, 102, 913–934 CrossRef CAS PubMed.
- T. Woike, H. Zöllner, W. Krasser and S. Haussühl, Raman-spectroscopic and differential scanning calorimetric studies of the light induced metastable states in K2[RuCl5NO], Solid State Commun., 1990, 73, 149–152 CrossRef CAS.
- J. R. Durig, W. A. McAllister, J. N. Willis and E. E. Mercer, Far infrared spectra of potassium and ammonium pentahalonitrosylruthenates, Spectrochim. Acta, 1966, 22, 1091–1100 CrossRef CAS.
- E. Miki, Infrared Studies of Transition-Metal Nitrosyl (14NO and 15NO) Complexes—Nitrosylruthenium(III), Nitrosylchromium(II) and Nitrosylcobalt(II) Complexes, Bull. Chem. Soc. Jpn., 1968, 41, 1835–1844 CrossRef CAS.
- E. Miki, T. Ishimori, H. Yamatera and H. Okuno, The Effects of Outer Sphere Cations and Halide Ions on Infrared Spectra of Pentahalogenonitrosylruthenium(III) Complexes, Bull. Chem. Soc. Jpn., 1969, 42, 3007–3008 CrossRef CAS.
- E. Miki, K. Mizumachi, T. Ishimori and H. Okuno, Infrared Spectra of Some Transition-metal (Fe, Co, Ru, and Ir) Nitrosyl (14NO and 15NO) Complexes, Bull. Chem. Soc. Jpn., 1973, 46, 3779–3784 CrossRef CAS.
- M. J. Cleare, H. P. Fritz and W. P. Griffith, Vibrational spectra of nitrosyl and carbonyl complexes—I, Spectrochim. Acta, Part A, 1972, 28, 2013–2018 CrossRef CAS.
- L. Tosi, The polarized Raman and infrared spectra of K2[RuCl5NO], J. Raman Spectrosc., 1977, 6, 20–25 CrossRef CAS.
- J. A. Güida, M. A. Ramos, O. E. Piro and P. J. Aymonino, Infrared spectra of K2[RuCl5NO] in two excited metastable states and the evidence for the NO linkage photoisomerization of metastable state I (MSI) in [RuX5NO]2−(X = Cl, CN), J. Mol. Struct., 2002, 609, 39–46 CrossRef.
- O. E. Piro, E. E. Castellano, J. A. Güida and P. J. Aymonino, Kramers-Kronig dispersive analysis and optical properties in the infrared, and revised vibrational behavior of orthorhombic Na2[Fe(CN)5NO]·2H2O, Phys. Rev. B: Condens. Matter Mater. Phys., 1989, 39, 1919–1926 CrossRef CAS PubMed.
- S. I. Gorelsky and A. B. P. Lever, Metastable states of ruthenium (II) nitrosyl complexes and comparison with [Fe(CN)5NO]2−, Int. J. Quantum Chem., 2000, 80, 636–645 CrossRef CAS.
Footnote |
| † Electronic supplementary information (ESI) available. CCDC 2336093. For ESI and crystallographic data in CIF or other electronic format see DOI: https://doi.org/10.1039/d4cp01374c |
| This journal is © the Owner Societies 2024 |