Investigation on acceptor–donor co-doped SnO2 nanoparticles enriched with oxygen vacancies: a capacitive humidity sensor for respiration detection
Received
18th March 2024
, Accepted 27th April 2024
First published on 30th April 2024
Abstract
In this work, we develop a novel capacitive humidity sensor based on Al–Si acceptor–donor co-doped SnO2 for real-time monitoring of ambient humidity and human respiration. XRD measurements reveal that all samples exhibit a tetragonal rutile phase and the crystallite size of SnO2 decreases with increasing Al–Si content. The high intensity of the Raman peak at 762 cm−1 confirms the presence of bridging mode oxygen vacancies in (Al + Si)0.02Sn0.98O2. The EPR results show that the amount of singly ionized oxygen vacancies increases after the introduction of Al–Si. Both types and amounts of oxygen vacancy defects are particularly sensitive to the adsorption of water molecules. Moreover, according to DFT calculations, the contribution of the Si 3s orbital and Al 3s orbital to the band edge verifies the formation of acceptor–donor complexes in Al–Si co-doped SnO2. The humidity sensing results reveal that the (Al + Si)0.02Sn0.98O2 humidity sensor shows high sensitivity (S = 839), low hysteresis (1.94%) and fast response/recovery times (25 s/5 s). The respiratory intervals during shallow, medium and deep breathing states of (Al + Si)0.02Sn0.98O2 were measured at 2.8 s, 3.8 s and 4.5 s, respectively. The chemical mechanism for the enhancement of humidity sensing performance corresponding to the oxygen vacancy defects induced by Al–Si interplay is proposed.
1. Introduction
Nowadays, humidity sensors are indispensable information-gathering equipment in the age of artificial intelligence, which plays an important role in the field of detecting ambient humidity, controlling various industrial production and monitoring the human respiratory rate.1–3 To meet the needs of high performance such as linearity, fast response/recovery ability, low hysteresis and pronounced sensitivity, a wide range of humidity sensors, including capacitance, impedance, frequency, and other types, have been developed using sensing materials such as ceramics, polymers, and carbon-based materials.4,5 The utilization of nanoparticles from metal oxide semiconductors (SnO2, Al2O3, TiO2, etc.) as building humidity sensing materials is advantageous due to mechanical flexibility and excellent electrical/sensing properties.6–8
Tin oxide (SnO2), a kind of wide band-gap (3.6 eV) n-type semiconductor which has the advantages of high chemical stability, simple manufacturing and a favorable adsorption capacity for water molecules, remains the focus of attention in the outline and advancement of high sensitivity humidity sensors.9 However, the intrinsic SnO2-based humidity sensor suffers from long response and recovery times, as well as high hysteresis. In order to further enhance the sensing performance, such as the linearity and sensitivity, a number of elements including Zn,10 Cd,11 Al,12 Sb,13 N14 and P14 have been selected as dopants in SnO2-based sensors. Among these doping elements, Al and Si have an edge on being resourceful, inexpensive, non-toxic and environmentally friendly. In addition, the radii of Al3+ (0.51 Å) and Si4+ (0.4 Å) are considerably smaller than Sn4+ (0.69 Å), which can lead to lattice distortion and trigger the formation of substitutional or interstitial defects. Generally, due to the fact that the Al acceptor has one less valence electron compared to the Si donor, the crystalline structure inherently introduces an electronic hole in the SiO2 energy band.15,16 The interplay of Al and Si ions can generate a significant number of positive charges and create a local electric field within the crystal, thereby facilitating the efficient separation of electron–hole pairs. Previous studies have reported that the incorporation of an Al acceptor and a Si donor into metal oxides is responsible for increasing the oxygen vacancy and electron content.17,18 Si behaves as a well-behaved shallow donor within the range of conducting oxides, while Al acts as an acceptor to facilitate p-type conductivity. Both the high activity of the oxygen vacancy and the significant contribution of electrons are considered to be responsible for enhancing sensing performance. The oxygen vacancy defects provide additional active surface adsorption sites for water molecules on the SnO2 surface, which plays a crucial role in promoting the humidity sensitivity of the material.19 Therefore, the incorporation of Al–Si into SnO2 can enhance the humidity sensitivity by increasing the number of oxygen vacancy defects.
In this study, we present a successful fabrication of a novel capacitive humidity sensor based on Al–Si acceptor–donor co-doped SnO2 nanoparticles, enriched with oxygen vacancy defects. To explore the interactions between the Al–Si acceptor–donor complex and water molecules, as well as understand their impact on the sensing properties, the oxygen vacancy defects and the electronic structure were investigated by EPR and DFT. The capacitive humidity sensor based on the acceptor–donor complex demonstrates the potential for simultaneous detection of ambient humidity and human breath rate.
2. Experimental
2.1 Synthesis of Al–Si co-doped SnO2
All the starting materials used in the experiment were of analytical grade and used directly without further purification. Fig. 1 depicts the synthesis of pure and Al–Si co-doped SnO2 nanoparticles via a simple sol–gel method. In a typical procedure, 0.05 mol SnCl2·2H2O was dissolved in the solution mixed with 100 mL ethanol and 100 mL deionized water. Thereafter, (C2H5O)4Si and Al(NO3)3·9H2O were incorporated into Sn precursor solutions to prepare (Al + Si)xSn1−xO2 (x = 0, 0.5, 1, 1.5, 2 mol%) and then stirred at 300 K for 6 h on a magnetic stirrer. (C2H5O)4Si and Al(NO3)3·9H2O were added into the solutions in a 1![[thin space (1/6-em)]](https://www.rsc.org/images/entities/char_2009.gif) :
:![[thin space (1/6-em)]](https://www.rsc.org/images/entities/char_2009.gif) 1 ratio to ensure the doping concentration of Al and Si. Then, a certain amount of ammonia water was dropped into the resultant solutions to regulate the pH to 8, until white turbid precipitates appeared at the bottom of solution. The reaction products were aged, filtered, and washed 3 times before drying for 1 hour in an oven at 100 °C. Moreover, the prepared samples were kept in a furnace and annealed at 500 °C for 60 min. Finally, Al–Si co-doped SnO2 nanoparticles with different dopant contents were synthesized, respectively.
1 ratio to ensure the doping concentration of Al and Si. Then, a certain amount of ammonia water was dropped into the resultant solutions to regulate the pH to 8, until white turbid precipitates appeared at the bottom of solution. The reaction products were aged, filtered, and washed 3 times before drying for 1 hour in an oven at 100 °C. Moreover, the prepared samples were kept in a furnace and annealed at 500 °C for 60 min. Finally, Al–Si co-doped SnO2 nanoparticles with different dopant contents were synthesized, respectively.
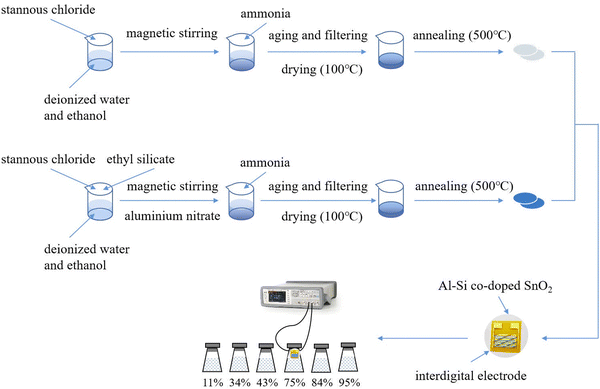 |
| | Fig. 1 Preparation of the pure and Al–Si co-doped SnO2 and procedure for testing humidity sensing performance. | |
2.2 Characterization and calculation methods
The lattice structure of the SnO2 sample was determined using an X-ray diffractometer (Ultima IV, Rigaku, Japan). The test range of 2θ was 20°–80°. The λ was 0.15406 nm and the scan rate was 5° min−1. The morphology and structure of the prepared sample were observed by employing the SUPRA55 field emission scanning electron microscope, which was operated at 15 kV. Raman spectroscopy measurements were performed using a LabRAM UV-VIS-NIR system with an excitation wavelength of λ = 590 nm. The investigation of oxygen vacancies in the samples was carried out using electro paramagnetic resonance (EPR) spectroscopy with a Bruker A300-10/12 spectrometer operating at a field modulation frequency of 100 kHz under ambient conditions. By employing the density functional theory (DFT) module offered by Q-flow (Lonxun Quantum), we performed electronic structure calculations of SnO2 within the DFT framework. The exchange–correlation functional was modeled using the Perdew–Burke–Ernzerhof potential within the GGA+U scheme. To conduct the calculations, we employed energy cutoffs of 120 Ry for the plane-wave expansion of the wave functions and the charge density. For Brillouin zone sampling, we utilized a 2 × 2 × 6 Monkhorst–Pack k-point grid. In order to account for the modeling of different impurities in oxides, we considered not only substitution (S) impurities but also interstitial (I) impurities, as well as their combinations with oxygen vacancies.
2.3 Humidity sensing performance testing and respiratory detection
The testing procedure for the pristine and Al–Si co-doped SnO2 humidity sensors is shown in Fig. 2. In the testing procedures, a polyimide substrate (10 mm × 10 mm) with 15 pairs of interdigital electrodes was used to measure the humidity sensing performance. Then pure and Al–Si co-doped SnO2 nanoparticles (2 mg) were mixed with ethanol (20 μL) to form a paste and coated on the surface of the electrode. Then, the electrodes were placed in the oven with a drying temperature of 70 °C for 10 min. After that, all prepared electrodes were sequentially placed in different air tight glass humidity chambers, which were added with saturated aqueous solution of LiCl, MgCl2, K2CO3, NaCl, KCl and KNO3. The above saturated salt solutions have 11%, 34%, 43%, 75%, 84% and 95% RH, respectively. The corresponding variations in the capacitance of sensing materials were recorded using an LCR digital instrument at room temperature with a working voltage of 1 V and a frequency range of 120 Hz–10 kHz. Fig. 2 shows the circuit and the physical diagram of the humidity sensor designed to enable respiratory monitoring across various states of human respiration. When the humidity sensor is exposed to different relative humidity (RH) levels, significant variations in the brightness of the LED can be observed. When a person breathes onto the humidity sensor, the presence of moisture influences the capacitance of the sensor, leading to an increase in the current within the circuit. Consequently, the LED reaches the breakover voltage and turns on.
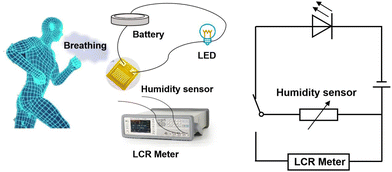 |
| | Fig. 2 Circuit diagram for the humidity sensor system for monitoring breathing (LED) and ambient humidity (LCR). | |
3. Results and discussion
3.1 Structural and morphological properties
As shown in Fig. 3(a), the crystalline structure and phase purity of pure and Al–Si co-doped SnO2 were determined by X-ray diffraction patterns. All the diffraction peaks observed are in agreement with the standard tetragonal rutile SnO2 phase (JCPDS#41-1445). The strong diffraction peaks located at 2θ of 26.6°, 33.9° and 51.8° are respectively assigned to (110), (101) and (211) planes. There is no phase related to Al–Si oxides in the diffraction pattern, which confirms that the Al–Si ions are homogeneously incorporated into SnO2 lattice. The intensity of diffraction peak (101) exhibits a sharp increase with increasing Al–Si content, which shows the reduction of crystallinity for Al–Si co-doped samples.20 This evidence suggests the substitution of dopants ions for Sn ions in the SnO2 lattice.
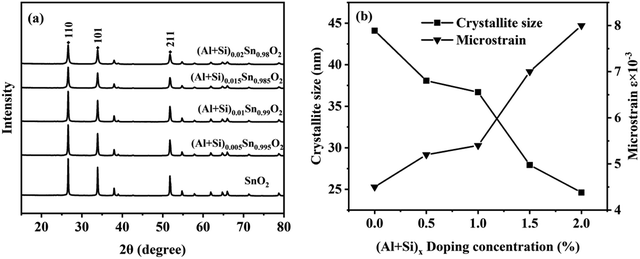 |
| | Fig. 3 (a) X-ray diffraction patterns of pure and Al–Si co-doped SnO2. (b) Plots of crystallite size and microstrain versus doping concentrations of (Al + Si)xSn(1−x)O2. | |
We calculated the crystallite size D and micro strain ε using the following relations:18
| |  | (1) |
| |  | (2) |
where
λ is the wavelength of X-ray radiation and
β is the full width at half maximum (FWHM) of the peaks at the diffracting angle
θ. From
Fig. 3(b), it is evident that the crystallite size decreases from 44 to 25 nm with an increase in the doping rate. Simultaneously, the microstrain increases from 4.5 × 10
−2 to 8.0 × 10
−2. This can be interpreted by the fact that the smaller Al
3+/Si
4+ ions can induce the interstitial or substitutional defects in the SnO
2 lattice.
21 During the annealing process of Al–Si co-doped SnO
2 nanoparticles, the smaller ionic radii of Al
3+ and Si
4+ ions allow them to occupy the octahedral sites of Sn
4+. This substitution of dopant ions in the octahedral sites leads to an increase in compression stresses and lattice distortion. Therefore, the crystalline structural properties of SnO
2 have been tuned by incorporating the Al–Si with different concentrations.
Fig. 4(a)–(f) presents the FESEM images and elemental mapping of the (Al + Si)0.02Sn0.98O2 nanoparticles. The surface morphology of the nanoparticles shows the spherical grain with a size ranging from 21.5 to 39.2 nm. The elemental compositions of (Al + Si)0.02Sn0.98O2 nanoparticles are studied by elemental mapping. The results show that the materials are composed of Al, Si, Sn and O, and the four elements are distributed homogeneously in (Al + Si)0.02Sn0.98O2, which further confirms the introduction of dopants.
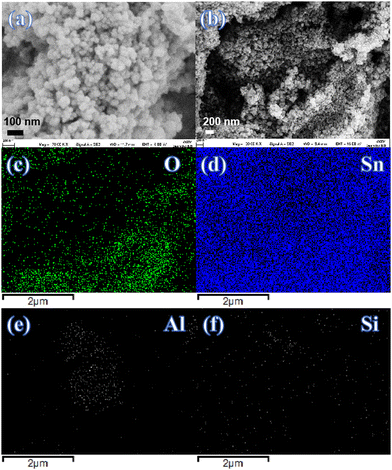 |
| | Fig. 4 (a) and (b) FESEM images of (Al + Si)0.02Sn0.98O2 nanoparticles and (c)–(f) (Al + Si) elemental mapping images. | |
3.2 Oxygen vacancy defect analysis
Raman spectroscopy was used to investigate the structural defects and crystalline disorder induced by dopant ions in the SnO2 lattice. Fig. 5 shows the Raman spectra of (Al + Si)xSn1−xO2 (x = 0, 0.01 and 0.02) samples measured in the range of 200–900 nm and the corresponding plots of these Raman peak fitting by the Gaussian function. The typical lattice vibration mode at the Γ point of the Brillouin zone of SnO2 are described as A1g + A2g + A2u + B1g + B2g + 2B1u + Eg + 3Eu.22 Among these modes A1g, B1g, B2g and Eg are Raman active modes, A2u and Eu are IR active modes, while A2g and B1u are inactive in both IR and Raman regions. Fig. 5(b) shows the B1u (238 cm−1), Eg (503 cm−1), A1g (627 cm−1), A2u (688 cm−1) and B2g (762 cm−1) bands in the pure SnO2. But in (Al + Si)0.01Sn0.99O2 and (Al + Si)0.02Sn0.98O2, the A1g band exhibits a shift towards the higher wavenumber side, which is due to the incorporation of Al–Si ions into the SnO2 lattice, as shown in Fig. 5(c) and (d). This observed blue shift of the A1g modes from 627 cm−1 to 634 cm−1 can be attributed to the substitution of Sn4+ with smaller Al3+ and Si4+ ions, as well as the decreased crystallite size resulting from phonon confinement.23 In Fig. 5(d), the Raman peak at 507 cm−1 in (Al + Si)0.02Sn0.98O2 is observed to shift to a lower wavenumber compared to pure SnO2 due to the rearrangement of the internal defect equilibrium. Moreover, in the Raman modes of (Al + Si)0.01Sn0.99O2 and (Al + Si)0.02Sn0.98O2, here a small peak appearing at 324 cm−1 and 363 cm−1 represents Eu transverse optical (TO) vibration and that in pure SnO2 was absent.24 This is due to interstitial Si (Sii) in the tin oxide lattice, and the high disordering and low crystallinity of the Al–Si co-doped SnO2 samples. In the Al–Si addition the following equations may apply.25| |  | (3) |
| |  | (4) |
| |  | (5) |
| |  | (6) |
In the case of substituting Al3+ ions for Sn4+ and Si4+ ions, more oxygen vacancy defects  are formed in the (Al + Si)0.02Sn0.98O2 lattice. Fig. 6 shows the distribution of different kinds of oxygen vacancies like bridging, sub-bridging or in-plane oxygen vacancy of SnO2 on the surface layer. For different types of oxygen vacancy defects, the Raman mode shows different positions and intensities due to the external strain on the rutile structure. Generally, the peak of SnO2 around 762 cm−1 is attributed to the presence of bridging or sub-bridging mode of vacancy, while the peak at around 688 cm−1 of the A2u mode is corresponding to the presence of in-plane oxygen vacancy.24 The bridging and sub-bridging modes of oxygen vacancies are sensitive to the adsorption of the water molecules and the conduction of charge carriers.26 As shown in Fig. 5(b) and (c), the Raman peak at 762 cm−1 of pure SnO2 and (Al + Si)0.02Sn0.98O2 indicates the presence of a similar concentration of bridging or sub-bridging oxygen vacancies in both materials. However, in Fig. 5(d), there is a notable increase in the intensity of the Raman peak around 762 cm−1 of (Al + Si)0.02Sn0.98O2, which suggests that the bridging or sub-bridging oxygen vacancy content is enhanced significantly. Hence, the incorporation of Al3+ and Si4+ into the SnO2 lattice can potentially increase the presence of bridging oxygen vacancies and enhance the adsorption ability towards water molecules. Besides, other fitting small peaks including the Eg mode at 503 cm−1 in the Raman spectra may imply the presence of defects like tin interstitials (Sni) or substitutional defects (AlSi). It can be concluded that the structural defects have been introduced by doping Al–Si ions in the SnO2 lattice structure.
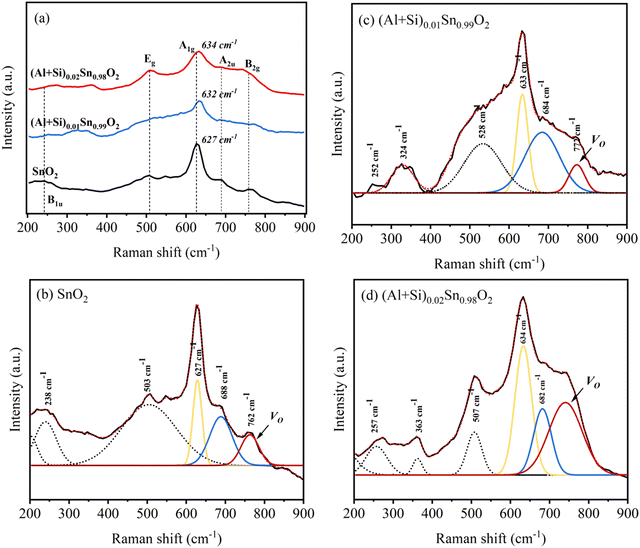 |
| | Fig. 5 Raman spectra of pure and Al–Si co-doped SnO2 (a) general survey spectrum, (b)–(d) deconvolution of the Raman spectrum. | |
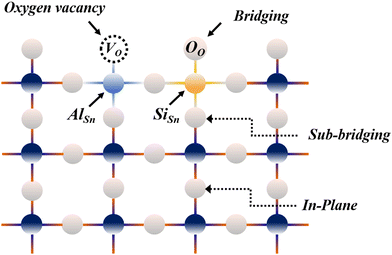 |
| | Fig. 6 The illustration of different modes of oxygen atoms on the SnO2 surface. | |
Electron paramagnetic resonance (EPR) is a highly sensitive technique used to investigate the spin dynamics of paramagnetic centers, including those originating from Al and Si ion incorporated into SnO2 and oxygen vacancies defects. The EPR patterns of pure SnO2 and (Al + Si)0.02Sn0.98O2 are shown in Fig. 7(a). The g factor (EPR parameter) can be calculated to determine the type of defects in the SnO2 particles. The following equation is commonly used to calculate the g factor:27
| |  | (7) |
where
h = 4.135 × 10
−15 eVs is the Planck constant,
υ = 9.48 GHz is the microwave frequency (Hz),
β = 5.788 × 10
−5 eV T
−1 is the electron Bohr magnetron and H is the applied magnetic field. The strong symmetrical EPR signal observed at 3514 G (
g = 2.003) in pure SnO
2 and (Al + Si)
0.02Sn
0.98O
2 can be ascribed to unpaired electrons originating from the presence of oxygen vacancies. As demonstrated in
Fig. 7(b), the concentration of paramagnetic centers is the primary factor influencing the EPR signal intensity and the intensity of the EPR signal increases with the doping of Al and Si. This can be attributed to the increase in the number of oxygen vacancies in (Al + Si)
0.02Sn
0.98O
2. The number of the spins corresponding to oxygen vacancies was estimated by using the following formula
28where
I represents the peak-to-peak height of the EPR signal (in arbitrary units), and Δ
H represents the line width of the signal (in mT). The calculated
Nspins of pure SnO
2 and (Al + Si)
0.02Sn
0.98O
2 are 86.5 and 132.9, respectively. As Al and Si are incorporated into SnO
2, the calculated
Nspins of (Al + Si)
0.02Sn
0.98O
2 increase significantly, which is closely related to a 53.6% increase in oxygen vacancies.
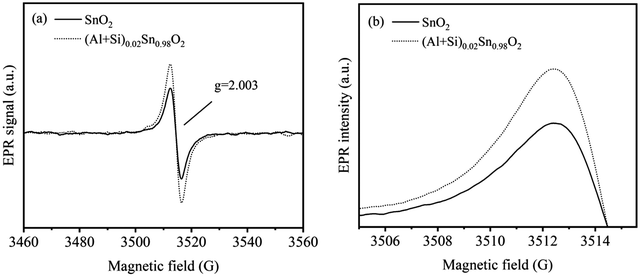 |
| | Fig. 7 (a) and (b) EPR spectrum and intensity comparison of pure SnO2 and (Al + Si)0.02Sn0.98O2. | |
3.3 DFT calculations
In order to determine the correlation between the theoretical results and the experimental findings, we performed DFT modeling to investigate the electronic structure of Al–Si co-doped SnO2. Fig. 8(a)–(d) shows the schematic representation of the optimized atomic structure of the (100) surface of (a) pure SnO2 (b) with a single substitutional Al and one oxygen vacancy (AlSn + VO) (c) with one interstitial Si (Sii) and (d) substitutional Al, substitutional Si and one oxygen vacancy (AlSn + SiSn + VO). In Table 1, the presence of various combinations of substitutional and interstitial defects results in the variations in Fermi energy, band gap and lattice parameters. In the case of the pure SnO2, the band gap (0.7046 eV) estimated from PBE was an underestimate compared to the experimental values due to its lack of consideration of the discontinuity in the exchange–correlation potential.29 However, this shortcoming has no bearing on our study as we focus on the relative changes in the electronic structure when Al and Si are introduced into SnO2.
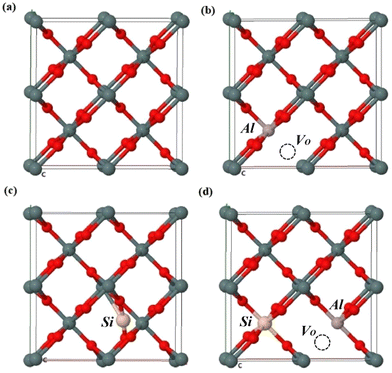 |
| | Fig. 8 The schematic representation of the optimized atomic structure of (a) pure SnO2, (b) AlSn + VO, (c) Sii and (d) AlSn + SiSn + VO. | |
Table 1 Fermi energy, band gap and lattice parameters for pure and defective SnO2
|
|
Fermi energy (eV) |
Band gap (eV) |
a (Å) |
b (Å) |
c (Å) |
| Pure SnO2 |
4.9084 |
0.7046 |
9.637 |
9.637 |
3.233 |
| AlSn + VO |
5.0725 |
0.2344 |
9.407 |
9.407 |
3.203 |
| Sii |
7.6627 |
1.3455 |
8.629 |
9.243 |
3.266 |
| AlSn + Sisub + VO |
5.9109 |
1.0208 |
9.241 |
9.209 |
3.140 |
To better understand the formation of oxygen vacancy defects upon the incorporation of Al–Si ions in SnO2, we investigate the DOS and PDOS corresponding to the pure and defective SnO2. As shown in Fig. 9(a), the density of partial wave states analysis indicates that the conduction band is primarily contributed by O 2p orbitals and the valence band is mainly composed of Sn 5s and Sn 5p orbitals. It is worth noting that the energy band gap of SnO2 (0.2344 eV) narrowed significantly for the contributions of Al 3s orbitals to the valence band (Fig. 9b). Therefore the introduction of Al into the system plays the key role in the formation of oxygen vacancies and enhances the carrier transfer between the energy band. Fig. 9(c) shows the contributions of Si 3s orbitals to the electronic structure where the band gap of Si doped SnO2 (1.3455 eV) has been broadened. This is due to the presence of excess electrons in the system. As seen in Fig. 9(d), the Sn atoms in the SnO2 crystalline lattice were simultaneously substituted by an Al and a Si atom and oxygen vacancy was introduced, leading to a decrease of band gap to 1.0208 eV.
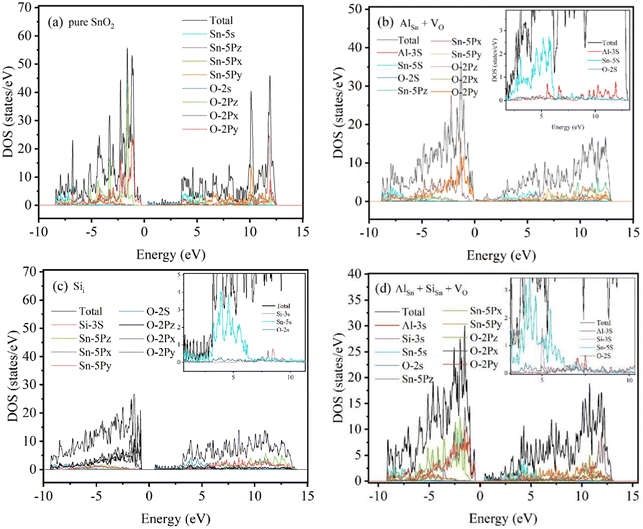 |
| | Fig. 9 TDOS and PDOS for (a) pure SnO2, (b) AlSn + VO, (c) Sii and (d) AlSn + SiSn + VO. | |
In general, Al defects and Si defects can act as acceptors and donors, respectively, and they interact with each other through complex mechanisms.30 Li et al. reported that co-doping Mo and C can effectively shift the valence band edge while leaving the conduction band edge nearly unaffected.31 As shown in Fig. 10, the substitution of Al3+ for Sn4+ ions was consistently accompanied by the introduction of oxygen vacancies, where Al3+ ions played an acceptor role and the Si dopants state functions as temporary trap centers.32 The Si 3s orbitals and Al 3s orbitals have important contributions to the valence band which indicates that the crystalline and electronic structure has been changed with Al–Si co-doping in the SnO2. In the case of isovalent doping, the introduction of Si into SnO2 is favorable for generating additional electrons and forming stable donor-like defects (SiSn) in the SnO2 structure. The substitution of Sn4+ ions with dopant ions induces the disruption of the original electronic structure, which subsequently leads to the rearrangement of the internal defect equilibrium. Therefore, the contribution of Si 3s orbital and Al 3s orbital to the band edge verifies the presence of acceptor–donor complexes in Al–Si co-doped SnO2.
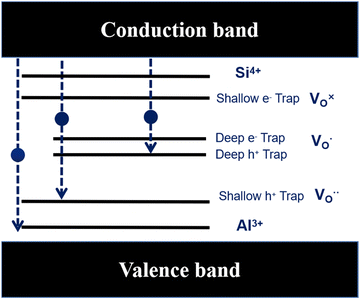 |
| | Fig. 10 A schematic band diagram with defect states. | |
3.4 Humidity sensing properties and respiration detection
The sensing properties can be associated with the change in the capacitance of humidity sensors exposed to humidity at different levels. Fig. 11(a) shows the capacitance variation of the pure and Al–Si co-doped SnO2 humidity sensors in different RH at a testing frequency of 1 kHz. It can be observed that the capacitance of all the humidity sensors increases with increasing humidity level, which means water molecules are gradually adsorbed on the SnO2 surface. The sensitivity of the humidity sensor can be calculated using the following formula:33| |  | (9) |
where C1 and C2 represent the capacitance values at 95% RH and 11% RH, respectively. The calculated sensitivity of pure and Al–Si co-doped SnO2 humidity sensors corresponds to 27, 40, 38, 77 and 839, respectively. It can be found that the sensitivity of the humidity sensor is enhanced as the Al–Si co-doping concentration increases. In these samples (Al + Si)0.02Sn0.98O2 (S = 839) exhibits better linearity and sensing performance due to the 31 times sensitivity of the pure SnO2 sensor (S = 27). This phenomenon can be attributed to more oxygen vacancies formed on the surface of the doped sample where the interplay of Al and Si ions play a significant role. Fig. 11(b) reveals the effect of different frequencies on the capacitance of (Al + Si)0.02Sn0.98O2 in the range from 11% RH to 95% RH. It can be observed that the capacitance of all the samples decreases as the frequency increases. This phenomenon occurs because the polarization speed of water molecules struggles to keep up with rapid changes in the electric field direction at high working frequencies. As a result, the capacitance decreases and its dependence on relative humidity (RH) diminishes. It can be clearly seen that the variations in the capacitance were clearly distinguishable at low frequencies while it became ambiguous at higher frequencies. The capacitance of the sensor increases with higher relative humidity (RH). In the case of (Al + Si)0.02Sn0.98O2, an increased number of oxygen vacancies on the surface allows for more adsorption of water molecules. This leads to the formation of effective ionic conduction, ultimately resulting in an increase in capacitance. As verified above in EPR and Raman analysis, the presence of oxygen vacancies was associated with the Raman peaks at 688 cm−1 and 762 cm−1 and higher intensity of the EPR signal. Furthermore, the electronic structure has been tuned by the contribution of Si 3s orbitals and Al 3s orbitals to the valence band after Al–Si co-doping, which has noticeable implications on the humidity sensing properties. As a result, the capacitance of the humidity sensor increases with rising humidity levels, leading to a humidity sensing response.
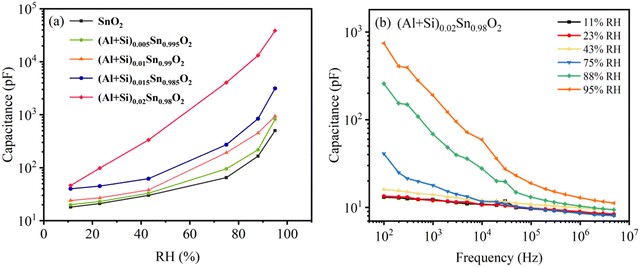 |
| | Fig. 11 (a) Capacitance relative humidity curves of pure and Al–Si co-doped SnO2 humidity sensors. (b) Capacitance frequency curves of (Al + Si)0.02Sn0.98O2 in different RH. | |
Humidity hysteresis is a key aspect to evaluate the dependability and stability of a humidity sensor. Fig. 12(a) and (b) reveals the humidity hysteresis for pure SnO2 and (Al + Si)0.02Sn0.98O2 sensors in the adsorption and desorption cycle. During the desorption cycle, the capacitance of the humidity sensor is higher compared to the adsorption process. This is due to the delayed separation of water molecules from the SnO2 surface, resulting in a prolonged desorption process.34 The equation for the calculated hysteresis of the humidity sensor is as follows:
| |  | (10) |
where
CA and
CD are the capacitance values obtained at the same RH in the desorption and adsorption process, respectively, and
S is the sensitivity of the sensor. The maximum humidity hysteresis for pure SnO
2 and (Al + Si)
0.02Sn
0.98O
2 are 4.47% and 1.94% RH, respectively. The (Al + Si)
0.02Sn
0.98O
2 sensor exhibits a significantly reduced hysteresis compared to pure SnO
2, which indicates that the addition of Al
3+ and Si
4+ ions accelerates the desorption process on the SnO
2 surface. However, it is important to note that the fabricated SnO
2 humidity sensor may encounter challenges related to variations in environmental humidity and temperature, which can impact the response and decay time of the device, leading to less than optimal results.
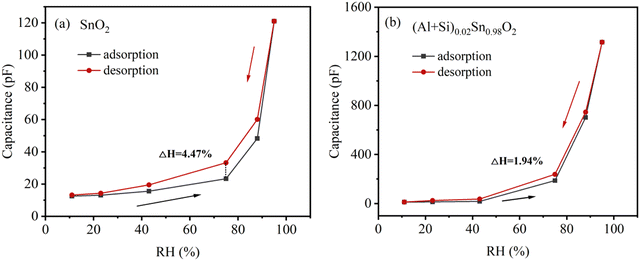 |
| | Fig. 12 Humidity hysteresis characteristics of (a) pure SnO2 and (b) (Al + Si)0.02Sn0.98O2 humidity sensors. | |
Fig. 13 illustrates the response/recovery time of the humidity sensors based on pure and Al–Si co-doped SnO2, covering a humidity range from 11% RH to 95% RH. The response/recovery time of the humidity sensor are defined as the duration required for sensor's capacitance variation to reach 90% of its total capacitance change. The (Al + Si)0.02Sn0.98O2 sensor exhibits a rapid response time of 25 s and a recovery time 5 s while the corresponding response/recovery times of (Al + Si)0.01Sn0.99O2 and pure SnO2 are 37 s/6 s and 54 s/14 s. The fast response/recovery times of (Al + Si)0.02Sn0.98O2 are mainly due to the fact that the substitution of Al3+ and Si4+ into SnO2 can enhance the adsorption activity of SnO2. It can be concluded that the recovery capability of the SnO2 sensor depends on Al and Si doping concentrations. Table 2 presents a comparison of the sensing performance for the humidity sensors based on different sensing materials. The results highlight that the (Al + Si)0.02Sn0.98O2 humidity sensor exhibits several advantages, including faster response and recovery times, as well as lower hysteresis. These findings suggest that the inclusion of Al–Si dopants plays a crucial role in enhancing the adsorption of water molecules on the SnO2 surface, thus improving the overall performance of the sensor.
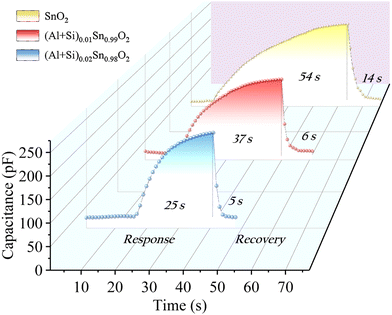 |
| | Fig. 13 Response/recovery time of pure and Al–Si co-doped SnO2 humidity sensors at the humidity ranging from 11% to 95% RH. | |
Table 2 A comparison of humidity sensing performance in previously reported work
| Material |
Response time (s) |
Recovery time (s) |
Hysteresis (%) |
Ref. |
| SnO2/SiO2 |
14 |
16 |
2 |
35
|
| ZrP |
57 |
9 |
5.2 |
36
|
| Al/SnO2 |
100 |
88 |
— |
37
|
| Na1/3Sr1/3Tb1/3Cu3Ti4O12 |
179 |
220 |
10.3 |
38
|
| (Al + Si)0.02Sn0.98O2 |
25 |
5 |
1.94 |
This work |
Respiratory detection plays a crucial role in the prevention of respiratory diseases and fitness tracking. Fig. 14(a)–(d) shows the response testing of pure SnO2 and Al–Si co-doped SnO2 sensors towards different breathing rates. The instantaneous capacitance of the humidity sensor was measured using the LCR testing instrument. The changes in capacitance were highly variable when the person breathed in different rates or depths and then according to it, the breathing was distinguished into shallow, medium and deep respiration. As seen from Fig. 14(b)–(d), the capacitance values of the Al–Si co-doped samples change more quickly than that of SnO2 under different respiratory rates. For pure SnO2, the respiratory intervals for response/recovery time at shallow (20–250 pF), medium (250–400 pF) and deep (400–650 pF) breathing states were 4.7 s, 5.5 s and 6.3 s respectively. After increasing the content of Al–Si (as shown in Fig. 14(b)–(d)), the average response intervals decreased by approximately 1.8 seconds in different breathing states compared to pure SnO2. In the case of the (Al + Si)0.02Sn0.98O2 sensor, it was observed that the average response time in the shallow breathing state was shorter, indicating a quicker response. This suggests that the introduction of Al3+ and Si4+ into SnO2 can enhance the response and recovery ability of the material. This finding demonstrates the promising potential of Al–Si co-doped SnO2 for promptly monitoring breathing rates and depths. Consequently, the (Al + Si)0.02Sn0.98O2 sensor exhibited outstanding humidity sensing performance, further establishing its potential as an advanced respiratory sensor.
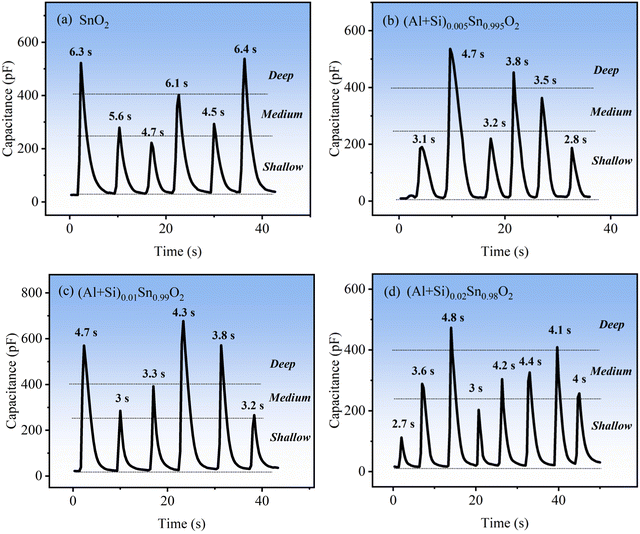 |
| | Fig. 14 The respiratory intervals of (a) pure and (b–d) Al–Si co-doped SnO2 for response/recovery time at shallow, medium and deep breathing states. | |
3.5 Humidity sensing mechanism
The chemical mechanisms for the enhancement in the humidity sensitivity induced by structural defects such as oxygen vacancies were proposed. As shown in Fig. 15, the introduction of dopant ions induces the formation of substitutional defects AlSn, SiSn and the oxygen vacancies in the crystalline structure of SnO2. The introduction of the Al–Si dopant ions leads to the generation of oxygen vacancies. This increased the presence of oxygen vacancy defects provides additional active surface adsorption sites for water molecules on the surface of Al–Si co-doped SnO2. The oxygen vacancies accelerate water adsorption and desorption reactions, which is beneficial for hopping transportation of protons on the SnO2 surface.39 The water molecules adsorption/desorption reaction formula on the surface of SnO2 are as follows:40| |  | (11) |
| |  | (12) |
where O−αS represents a surface adsorbed oxygen species with = 1 indicating singly ionized oxygen species or 2 for doubly ionized oxygen species; e− represents an electron in the conduction band surface; and S represents a surface adsorption site. In the case of Al–Si co-doping, the oxygen vacancies originating from Al and Si ions incorporated into SnO2 can consume excess electrons, and since then, the oxygen vacancies with one trapped electron increased significantly. Both the oxygen vacancies and the electrons can serve as charge carriers to facilitate electronic conduction and enhance the capacitance. As a result, the oxygen vacancies can accelerate the ionisation of water molecules into conductive H+ and bind the water molecules near oxygen vacancies into H3O+ (H2O → H+ + OH−, H+ + H2O → H3O+), thereby enhancing the sensors sensitivity at different humidity levels and rapidly increasing its capacitance.41 Hence, the introduction of Al and Si ions is responsible for the enhancement of the sensitivity and linearity of the sensor.
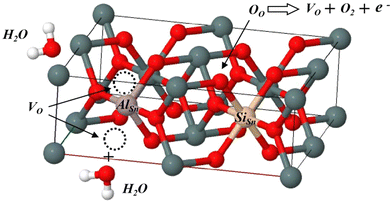 |
| | Fig. 15 Structure diagram of the defects AlSn + SiSn + VO reacting with water molecules. | |
4. Conclusions
In this study, we successfully synthesized a novel capacitive humidity sensor utilizing acceptor–donor co-doped SnO2 nanoparticles for the detection of ambient humidity and human respiration. The Raman spectra reveal an increased presence of bridging mode oxygen vacancies in (Al + Si)0.02Sn0.98O2. Additionally, the EPR results demonstrate a higher concentration of singly ionized oxygen vacancies following the introduction of Al–Si. Furthermore, DFT calculations provide evidence that Si 3s orbital and Al 3s orbital contribute to the band edge, confirming the formation of acceptor–donor complexes in Al–Si co-doped SnO2. The humidity sensing experiment showed that the (Al + Si)0.02Sn0.98O2 humidity sensor exhibited high sensitivity (S = 839), low hysteresis (1.94%), fast response/recovery times (25 s/5 s) and quick respiratory intervals at three breathing states. We also discussed the chemical mechanisms for the enhancement in the humidity sensitivity induced by oxygen vacancies in (Al + Si)0.02Sn0.98O2. Hence, the (Al + Si)0.02Sn0.98O2 sensor exhibits excellent humidity sensing characteristics for detecting ambient humidity and human respiratory rate.
Research data policy and data availability statements
All data generated or analysed during this study are included in this published article.
Author contributions
All authors contributed to the study conception and design. Yuchuan Ding performed material preparation, data collection, analysis, and the creation of new software used in the work. Yong Chen made substantial contributions to the conception and design of the work, and Mao-Hua Wang revised the work critically for important intellectual content. The first draft of the manuscript was written by Yuchuan Ding and all authors commented on the previous versions of the manuscript.
Conflicts of interest
The authors declare that they have no conflict of interest.
Acknowledgements
This research was partially supported by the grant from Changzhou University with KYCX20-2566.
References
- Y. Su, C. Li, M. Li, H. Li, S. Xu and L. Qian,
et al., Surface acoustic wave humidity sensor based on three-dimensional architecture graphene/PVA/SiO2 and its application for respiration monitoring, Sens. Actuators, B, 2020, 308(0925–4005), 127693 CrossRef CAS.
- S. Kano, K. Kim and M. Fujii, Fast-Response and Flexible Nanocrystal-Based Humidity Sensor for Monitoring Human Respiration and Water Evaporation on Skin, ACS Sens., 2017, 2(6), 828–833 CrossRef CAS PubMed.
- H. Jin, T. P. Huynh and H. Haick, Self-Healable Sensors Based Nanoparticles for Detecting Physiological Markers via Skin and Breath: Toward Disease Prevention via Wearable Devices, Nano Lett., 2016, 16(7), 4194–4202 CrossRef CAS PubMed.
- H. Zhang, S. Yu, C. Chu, J. Zhang, J. Liu and P. Li, Effects on structure, surface oxygen defects and humidity performance of Au modified ZnO via hydrothermal method, Appl. Surf. Sci., 2019, 486(0169–4332), 482–489 CrossRef CAS.
- Q. Zhu, Y. Jin, W. Wang, G. Sun and D. Wang, Bioinspired Smart Moisture Actuators Based on Nanoscale Cellulose Materials and Porous, Hydrophilic EVOH Nanofibrous Membranes, ACS Appl. Mater. Interfaces, 2018, 11(1), 1440–1448 CrossRef CAS PubMed.
- T. Y. Li, R. J. Si, J. Sun, S. T. Wang, J. Wang and R. Ahmed,
et al., Giant and controllable humidity sensitivity achieved in (Na + Nb) co-doped rutile TiO2, Sens. Actuators, B, 2019, 293(0925–4005), 151–158 CrossRef CAS.
- J. Wang, Y. M. Guo, S. T. Wang, L. Tong, J. Sun and G. B. Zhu,
et al., The effect of humidity on the dielectric properties of (In + Nb) co-doped SnO2 ceramics, J. Eur. Ceram. Soc., 2019, 39(2–3), 323–329 CrossRef CAS.
- I. Paulowicz, V. Hrkac, S. Kaps, V. Cretu, O. Lupan and T. Braniste,
et al., Three-Dimensional SnO2 Nanowire Networks for Multifunctional Applications: From High-Temperature Stretchable Ceramics to Ultraresponsive Sensors, Adv. Electron. Mater., 2015, 1(8), 1500081 CrossRef.
- M. Eslamian, A. Salehi and E. Nadimi, The role of oxygen vacancies on SnO2 surface in reducing cross-sensitivity between ambient humidity and CO: a first principles investigation, Surf. Sci., 2021, 708(0039–6028), 121817 CrossRef CAS.
- Q. Zhou, W. Chen, L. Xu, R. Kumar, Y. Gui and Z. Zhao,
et al., Highly sensitive carbon monoxide (CO) gas sensors based on Ni and Zn doped SnO2 nanomaterials, Ceram. Int., 2018, 44(4), 4392–4399 CrossRef CAS.
- W. Zeng, T. Liu, Z. Wang, S. Tsukimoto, M. Saito and Y. Ikuhara, Selective Detection of Formaldehyde Gas Using a Cd-Doped TiO2–SnO2 Sensor, Sensors, 2009, 9(11), 9029–9038 CrossRef CAS PubMed.
- M. Sik Choi, J. H. Ahn, M. Young Kim, A. Mirzaei, S. M. Choi and D. Won Chun,
et al., Changes in the crystal structure of SnO2 nanoparticles and improved H2S gas-sensing characteristics by Al doping, Appl. Surf. Sci., 2021, 565(0169–4332), 150493 CrossRef CAS.
- K. Suematsu, M. Sasaki, N. Ma, M. Yuasa and K. Shimanoe, Antimony-Doped Tin Dioxide Gas Sensors Exhibiting High Stability in the Sensitivity to Humidity Changes, ACS Sens., 2016, 1(7), 913–920 CrossRef CAS.
- Y. N. Sun, M. Goktas, L. Zhao, P. Adelhelm and B. H. Han, Ultrafine SnO2 nanoparticles anchored on N,P-doped porous carbon as anodes for high performance lithium-ion and sodium-ion batteries, J. Colloid Interface Sci., 2020, 572(0021–9797), 122–132 CrossRef CAS PubMed.
- F. Mao, C. Z. Gao, F. Wang, C. Zhang and F. S. Zhang, Ab Initio Study of Ferromagnetism Induced by Electronic Hole Localization in Al-Doped α-SiO2, J. Phys. Chem. C, 2017, 121(41), 23055–23061 CrossRef CAS.
- D. Li, Y. Jiang, P. Zhang, D. Shan, J. Xu and W. Li,
et al., The phosphorus and boron co-doping behaviors at nanoscale in Si nanocrystals/SiO2 multilayers, Appl. Phys. Lett., 2017, 110(23), 233105 CrossRef.
- T. Zheng, W. He, L. Wang, J. Li and S. Zheng, Effect of different substrates on Si and Ta co-doped Ga2O3 films prepared by pulsed laser deposition, J. Cryst. Grow., 2020, 533, 125455 CrossRef CAS.
- T. Boucherka, M. Touati, A. Berbadj and N. Brihi, Al3+ doping induced changes of structural, morphology, photoluminescence, optical and electrical properties of SnO2 thin films as alternative TCO for optoelectronic applications, Ceram. Int., 2023, 49(4), 5728–5737 CrossRef CAS.
- Z. Duan, J. Li, Z. Yuan, Y. Jiang and H. Tai, Capacitive humidity sensor based on zirconium phosphate nanoplates film with wide sensing range and high response, Sens. Actuators, B, 2023, 394(0925–4005), 134445 CrossRef CAS.
- C. Belkhaoui, N. Mzabi and H. Smaoui., Investigations on structural, optical and dielectric properties of Mn doped ZnO nanoparticles synthesized by co-precipitation method, Mater. Res. Bull., 2019, 111(0025–5408), 70–79 CrossRef CAS.
- N. S. Ramgir, Y. Kyu Hwang, I. S. Mulla and J. S. Chang, Effect of particle size and strain in nanocrystalline SnO2 according to doping concentration of ruthenium, Solid State Sci., 2006, 8(3–4), 359–362 CrossRef CAS.
- N. Ahmad, S. Khan and M. M. Nizam Ansari, Exploration of Raman spectroscopy, dielectric and magnetic properties of (Mn,Co) co-doped SnO2 nanoparticles, Phys. B, 2019, 558(0921–4526), 131–141 CrossRef CAS.
- L. Z. Liu, T. H. Li, X. L. Wu, J. C. Shen and P. K. Chu, Identification of oxygen vacancy types from Raman spectra of SnO2 nanocrystals, J. Raman Spectrosc., 2012, 43(10), 1423–1426 CrossRef CAS.
- L. Z. Liu, X. L. Wu, F. Gao, J. C. Shen, T. H. Li and P. K. Chu, Determination of surface oxygen vacancy position in SnO2 nanocrystals by Raman spectroscopy, Solid State Commun., 2011, 151(11), 811–814 CrossRef CAS.
- G. Zhang, C. Xie, S. Zhang, S. Zhang and Y. Xiong, Defect Chemistry of the Metal Cation Defects in the p- and n-Doped SnO2 Nanocrystalline Films, J. Phys. Chem. C, 2014, 118(31), 18097–18109 CrossRef CAS.
- K. Pavithra and S. Murugesan, Embedding oxygen vacancies at SnO2-CNT surfaces via a microwave polyol strategy towards effective electrocatalytic reduction of carbon-dioxide to formate, Catal. Sci. Technol., 2020, 10(5), 1311–1322 RSC.
- M. A. Paulin, G. Alejandro, D. G. Lamas, M. Quintero, R. O. Fuentes and J. E. Gayone,
et al., Oxygen vacancies and their role on the magnetic character of polycrystalline CeO2, Ceram. Int., 2023, 49(3), 5146–5153 CrossRef CAS.
- K. Thiyagarajan and K. Sivakumar, Oxygen vacancy-induced room temperature ferromagnetism in graphene-SnO2 nanocomposites, J. Mater. Sci., 2017, 52(13), 8084–8096 CrossRef CAS.
- L. Villamagua, R. Rivera, D. Castillo and M. Carini, A quantum chemical analysis of Zn and Sb doping and co-doping in SnO2, AIP Adv., 2017, 7(10), 105010 CrossRef.
- J. Zhang, F. Xie, L. Yang, S. Guo, Y. Xiong and S. Zhang, Effect of Co doping on chemosorbed oxygen accumulation and gas response of SnO2 under dynamic program cooling, Sens. Actuators, B, 2021, 340(0925–4005), 129810 CrossRef CAS.
- Y. Li, R. Deng, Y. Tian, B. Yao and T. Wu, Role of donor-acceptor complexes and impurity band in stabilizing ferromagnetic order in Cu-doped SnO2 thin films, Appl. Phys. Lett., 2012, 100(17), 172402 CrossRef.
- Y. Ding, Y. Chen and M. Wang, Effects of Al incorporation on structural and humidity-sensing properties of SnO2 sensor, J. Mater. Sci.: Mater.
Electron., 2024, 35(2), 172 CrossRef CAS.
- F. Li, P. Li and H. Zhang, Preparation and Research of a High-Performance ZnO/SnO2 Humidity Sensor, Sensors, 2021, 22(1), 293 CrossRef PubMed.
- M. Panday, G. K. Upadhyay and L. P. Purohit, Sb incorporated SnO2 nanostructured thin films for CO2 gas sensing and humidity sensing applications, J. Alloys Compd., 2022, 904(0925–8388), 164053 CrossRef CAS.
- M. Parthibavarman, V. Hariharan and C. Sekar, High-sensitivity humidity sensor based on SnO2 nanoparticles synthesized by microwave irradiation method, Mater. Sci. Eng., C, 2011, 31(5), 840–844 CrossRef CAS.
- Y. Zhu, J. Chen, H. Li, Y. Zhu and J. Xu, Synthesis of mesoporous SnO2–SiO2 composites and their application as quartz crystal microbalance humidity sensor, Sens. Actuators, B, 2014, 193(0925–4005), 320–325 CrossRef CAS.
- P. Pascariu, A. Airinei, N. Olaru, I. Petrila, V. Nica and L. Sacarescu,
et al., Microstructure, electrical and humidity sensor properties of electrospun NiO–SnO2 nanofibers, Sens. Actuators, B, 2016, 222(0925–4005), 1024–1031 CrossRef CAS.
- S. Srilarueang, B. Putasaeng, K. Sreejivungsa, N. Thanamoon and P. Thongbai, Giant dielectric response, nonlinear characteristics, and humidity sensing properties of a novel perovskite: Na1/3Sr1/3Tb1/3Cu3Ti4O12, RSC Adv., 2023, 13(42), 29706–29720 RSC.
- H. Zhang, H. Zhang, J. Man and C. Chen, Preparation of high performance Fe-doped SnO2 humidity sensor and its application in respiration detection, Sens. Actuators, A, 2023, 362(0924–4247), 114644 CrossRef CAS.
- K. Grossmann, R. G. Pavelko, N. Barsan and U. Weimar, Interplay of H2, water vapor and oxygenat the surface of SnO2 based gas sensors – An operando investigation utilizing deuterated gases, Sens. Actuators, B, 2012, 166–167(0925–4005), 787–793 CrossRef CAS.
- J. Wu, Q. Huang, D. Zeng, S. Zhang, L. Yang and D. Xia,
et al., Al-doping induced formation of oxygen-vacancy for enhancing gas-sensing properties of SnO2 NTs by electrospinning, Sens. Actuators, B, 2014, 198(0925–4005), 62–69 CAS.
|
| This journal is © the Owner Societies 2024 |
 *a
*a
![[thin space (1/6-em)]](https://www.rsc.org/images/entities/char_2009.gif) :
:![[thin space (1/6-em)]](https://www.rsc.org/images/entities/char_2009.gif) 1 ratio to ensure the doping concentration of Al and Si. Then, a certain amount of ammonia water was dropped into the resultant solutions to regulate the pH to 8, until white turbid precipitates appeared at the bottom of solution. The reaction products were aged, filtered, and washed 3 times before drying for 1 hour in an oven at 100 °C. Moreover, the prepared samples were kept in a furnace and annealed at 500 °C for 60 min. Finally, Al–Si co-doped SnO2 nanoparticles with different dopant contents were synthesized, respectively.
1 ratio to ensure the doping concentration of Al and Si. Then, a certain amount of ammonia water was dropped into the resultant solutions to regulate the pH to 8, until white turbid precipitates appeared at the bottom of solution. The reaction products were aged, filtered, and washed 3 times before drying for 1 hour in an oven at 100 °C. Moreover, the prepared samples were kept in a furnace and annealed at 500 °C for 60 min. Finally, Al–Si co-doped SnO2 nanoparticles with different dopant contents were synthesized, respectively.


 are formed in the (Al + Si)0.02Sn0.98O2 lattice. Fig. 6 shows the distribution of different kinds of oxygen vacancies like bridging, sub-bridging or in-plane oxygen vacancy of SnO2 on the surface layer. For different types of oxygen vacancy defects, the Raman mode shows different positions and intensities due to the external strain on the rutile structure. Generally, the peak of SnO2 around 762 cm−1 is attributed to the presence of bridging or sub-bridging mode of vacancy, while the peak at around 688 cm−1 of the A2u mode is corresponding to the presence of in-plane oxygen vacancy.24 The bridging and sub-bridging modes of oxygen vacancies are sensitive to the adsorption of the water molecules and the conduction of charge carriers.26 As shown in Fig. 5(b) and (c), the Raman peak at 762 cm−1 of pure SnO2 and (Al + Si)0.02Sn0.98O2 indicates the presence of a similar concentration of bridging or sub-bridging oxygen vacancies in both materials. However, in Fig. 5(d), there is a notable increase in the intensity of the Raman peak around 762 cm−1 of (Al + Si)0.02Sn0.98O2, which suggests that the bridging or sub-bridging oxygen vacancy content is enhanced significantly. Hence, the incorporation of Al3+ and Si4+ into the SnO2 lattice can potentially increase the presence of bridging oxygen vacancies and enhance the adsorption ability towards water molecules. Besides, other fitting small peaks including the Eg mode at 503 cm−1 in the Raman spectra may imply the presence of defects like tin interstitials (Sni) or substitutional defects (AlSi). It can be concluded that the structural defects have been introduced by doping Al–Si ions in the SnO2 lattice structure.


