 Open Access Article
Creative Commons Attribution 3.0 Unported Licence
Theoretical search for characteristic atoms in supported gold nanoparticles: a large-scale DFT study†
Shengzhou
Li
 ab,
Tsuyoshi
Miyazaki
 b and
Ayako
Nakata
 *abc
*abc
aDepartment of Computer Science, University of Tsukuba, Tsukuba, Ibaraki 305-8573, Japan
bResearch Center for Materials Nanoarchitectonics (MANA), National Institute for Materials Science (NIMS), Tsukuba, Ibaraki 305-0044, Japan. E-mail: NAKATA.Ayako@nims.go.jp
cPrecursory Research for Embryonic Science and Technology (PRESTO), Japan Science and Technology Agency (JST), Kawaguchi, Saitama 332-0012, Japan
First published on 21st June 2024
Abstract
The size and site dependences of atomic and electronic structures in isolated and supported gold nanoparticles have been investigated using large-scale density functional theory (DFT) calculations using multi-site support functions. The effects of the substrate on nanoparticles with diameters of 2 nm and several different shapes have been examined. First, isolated gold nanoparticles with diameters of 0.6 nm (13 atoms) to 4.5 nm (2057 atoms), which have comparable sizes to nanoparticles used in experiments, were considered. To analyse huge amounts of data obtained from large-scale DFT calculations, we performed principal component analysis (PCA), which helps systematically and efficiently clarify the electronic structures of large nanoparticles. The PCA results reveal the site dependence of the electronic structures. Notably, the atoms in the surface and subsurface have different electronic structures to those located in the inner layers, especially at the vertexes of the particles. The convergence of local electronic structures with respect to the particle size has also been demonstrated. For supported nanoparticles, PCA helps indicate which atoms are affected, and how much, by the substrate. The correlation between the PCA results and site dependence of reaction activity is also discussed herein.
1. Introduction
Numerous metallic nanoparticle catalysts have been developed for different types of reactions. For example, gold nanoparticles can be used for CO oxidation and hydrogen generation.1 The reactivity of nanoparticles is different from both bulk materials and small clusters and significantly depends on the particle size and the combination of nanoparticles and substrates. Oxide materials, such as MgO, TiO2, and CeO2, are commonly used as substrates.1 Vertexes of nanoparticles and interfaces between nanoparticles and substrates are considered to be the active sites in various reactions. The atomic-scale investigation of isolated and supported nanoparticles has been conducted both experimentally2–5 and theoretically.6–16 First-principles density functional theory (DFT) calculations are a powerful tool to investigate the atomic and electronic structures of materials and have been widely applied to analyse catalytic reactions. However, the target system size of DFT calculations has been limited to less than a thousand atoms in most cases because the computational cost is high, scaling cubically with the number of atoms (Natom). Even nanoparticles with diameters of 3 nm, which are relatively small among the nanoparticles in practical use, consist of approximately one thousand atoms, and larger numbers of atoms are required to include substrates in the models. Therefore, DFT calculations have been applied mainly to clusters consisting of tens of atoms or periodic models representing the edge of nanoparticles, and there are few DFT studies on metallic particles with diameters of several nanometers.14–16In the present study, we investigated the size and site dependences of the atomic and electronic structures of gold nanoparticles of several nanometers in diameter using our large-scale DFT code, CONQUEST.17–19 Using the multi-site support function method implemented in CONQUEST, we can consider large metallic systems consisting of several thousand atoms.20–23 We also investigated the interaction between 2 nm gold nanoparticles and the substrate, namely MgO(100). The models contain approximately three thousand atoms. To systematically and efficiently analyse the electronic structures of the three thousand atoms, we applied statistical analysis to an atom-projected density of states (DOS). Several studies have used statistics and machine learning to analyse the DOS, either using descriptors based on domain knowledge, such as d-band centres,24,25 or raw DOS values.26–29 We performed principal component analysis (PCA) with raw DOS data to directly compare the electronic structures of nanoparticles with different sizes, with and without substrates, without relying on domain knowledge.
In the next section, we provide the computational details. Then, the atomic and electronic structures of isolated and supported gold nanoparticles are discussed in the third section, based on the large-scale DFT calculation and PCA results. The final section contains the conclusions of the present study.
2. Computational details
DFT calculations with periodic boundary conditions were performed using a large-scale DFT code, CONQUEST.17–19 The Perdew–Burke–Ernzerhof generalised gradient approximation, an exchange–correlation functional,30 was used. Core electrons were described by Hamman's norm-conserving pseudopotential,31 and valence electrons were described by real-space local orbital functions, which are pseudo atomic orbital (PAO) functions32,33 for the double-ζ polarisation (DZP) level. The radii of the PAO functions of Au, Mg, and O atoms are given in Table S1 in the ESI.† For supported Au nanoparticles, we used the multi-site support function method20–22 to reduce the number of local orbital functions while maintaining accuracy. The multi-site functions are constructed for each atom in the system as the linear combinations of PAOs that belong to the atom and its neighbouring atoms in a given cutoff region, | (1) |
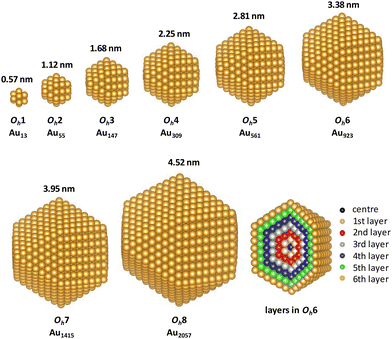
The stabilised quasi-Newton method was used for geometry optimisation with a threshold of 0.05 eV Å−1. We first optimised the structure of a bulk fcc gold crystal with a four-atom cubic simulation cell using 8 × 8 × 8 Monkhorst–Pack k-point meshes and obtained the Au–Au bond length as 2.949 Å. Then, the initial structures of cuboctahedral (Oh) nanoparticles were constructed based on the optimised Au–Au bond length of bulk fcc gold. We investigated the Oh gold nanoparticles with eight magic numbers,40 namely Natom = 13 (Oh1), 55 (Oh2), 147 (Oh3), 309 (Oh4), 561 (Oh5), 923 (Oh6), 1415 (Oh7), and 2057 (Oh8) atoms, which consisted of 1, 2, 3, 4, 5, 6, 7 and 8 shells, respectively (as shown in Fig. 1). For the MgO(100) surface, we first optimised the structure of the eight-layered clean surface model consisting of 32 atoms (∼15 Å thick) using 3 × 3 × 1 k-points and then constructed a large surface model with an area of 38.5 Å × 38.5 Å. The vacuum gap was set to 15 Å. For the calculations of supported gold nanoparticles, we placed gold nanoparticles with a diameter of 2.25 nm on the MgO surface. Several shapes of the supported nanoparticles were considered; these were constructed by removing the bottom layers of Oh4. Because the calculated Au–Au distance in the (100) plane in bulk Au (2.95 Å) and the O–O distance in the clean MgO(100) surface (3.02 Å) only had a 2.3% mismatch, the interfacial gold atoms in the bottom layer of the nanoparticle were initially placed approximately above the O atoms in the MgO surface, which was reported to be a stable configuration,8 although the orientation of the nanoparticles on the substrate was not fully investigated in the present study. The initial distances between the bottom layer of the nanoparticles and the MgO surface were set to 2 Å. The structures of the nanoparticles and the upper two layers of the MgO substrate were optimised by Γ-point sampling.
The cohesive energy (Ec) was calculated as follows:
| Ec = Enanoparticle/Natom − EAu atom | (2) |
The interaction energy between the nanoparticle and the substrate (Eint) and the adsorption energy of a molecule (or an atom) (Ead) were calculated as the energy differences before and after adsorption:
| Eint = −(Enanoparticle−substrate − (Enanoparticle + Esubstrate)) | (3) |
| Ead = −(Enanoparticle−substrate−molecule − (Enanoparticle−substrate + Emolecule)) | (4) |
The DOS was calculated using the Gaussian smearing function with σ = 0.005 Hartree for each eigenstate of the electronic Hamiltonian. Local DOS (LDOS) was calculated by the projection of DOS for atom i was performed using the weight w:
 | (5) |
To analyse the LDOS, PCA was performed using scikit-learn41 to reduce the dimensionality of the LDOS without losing important information in the raw LDOS.4,42 In the present study, the LDOS was expressed as a high-dimension vector using the values on the grid points with the interval of 0.225 mHartree for the energy region of −11.3 to 12.8 eV around the Fermi level (EF), resulting in high dimensional (3543) raw LDOS data. Then, the input data for PCA was constructed as a matrix X3543,Natom consisting of the LDOS of Natom atoms. The PCA components were obtained as the eigenvectors of the covariance matrix of X, and the components with the first and second largest proportions of variance were used to reduce the original dimension to two dimensions (2D). We performed PCA for the isolated nanoparticles Oh1–Oh8. Then, we applied the PCA components of the isolated Oh4 nanoparticle to the supported nanoparticles, to project the LDOS of the atoms in the supported nanoparticles directly to the 2D-PCA map that had already been obtained for Oh4.
3. Results and discussion
3.1 Size and site dependences in isolated nanoparticles
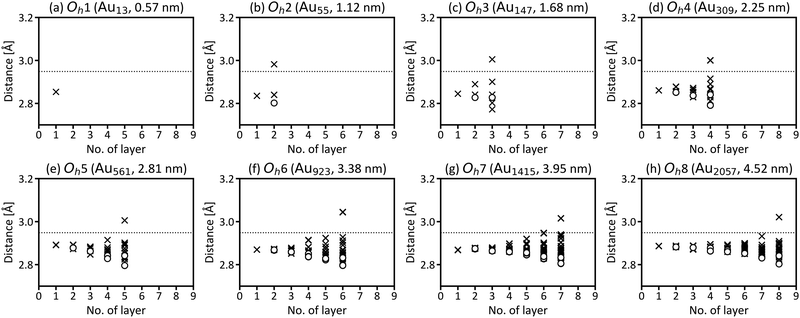
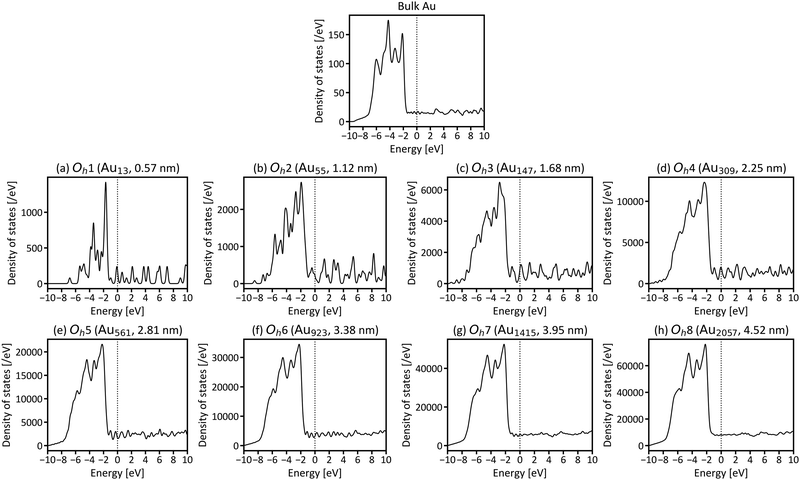
First, we investigated the site and size dependences of the atomic and electronic structures of isolated gold nanoparticles. It has been shown that gold nanoparticles consisting of specific numbers (i.e., magic numbers) of atoms are relatively more stable. We investigated Oh gold nanoparticles with eight magic numbers from 13 atoms (Oh1) to 2057 atoms (Oh8), as explained in the previous section. The diameters (rd) of the eight nanoparticles in the optimised structures are 0.57, 1.12, 1.68, 2.25, 2.81, 3.38, 3.95, and 4.52 nm, respectively. The calculated cohesive energies for Oh1–Oh8 are 2.24, 2.91, 3.17, 3.32, 3.43, 3.49, 3.54, and 3.58 eV per atom, respectively. Here, the cohesive energy of the nanoparticle becomes closer to that of bulk fcc gold, 3.83 eV per atom (3.81 eV per atom by experiment43). The tendency of larger particles to have larger cohesive energies is similar to the results reported in the previous studies.4,5Fig. 2 shows the intra-shell Au–Au bond lengths in the optimised structures, in which more outer shells have wider bond-length distributions. The maximum differences of the bond lengths in the particle surface (i.e., the outermost layer) are 0.186, 0.216, 0.217, 0.212, 0.250, 0.212, and 0.219 Å for Oh2–Oh8, respectively. This means that the site dependence of the bond length is larger in the outer shell. The Au–Au bond lengths in faces are longer than those in edges in all particles, which means that the particle surface is not flat but slightly round.Next, the size dependence of the electronic structures of the gold nanoparticles was investigated. Fig. 3 shows the total DOS of Oh1–Oh8. The band in the range from −6 to −2 eV originates mainly from d electrons (d-band). Compared with the d-band for bulk fcc gold, the shapes of the d-bands for the nanoparticles are sharper, and the centres of the d-bands are shifted closer to Fermi level (EF). Additionally, the electronic structures of small nanoparticles, such as Oh1–Oh3, are still discrete, especially in the unoccupied states, whereas larger nanoparticles have more continuous (i.e., metallic) electronic structures and do not change much depending on size. This result is consistent with the experimental reports demonstrating that the electronic structure changes around the diameter of 2 nm.1,44
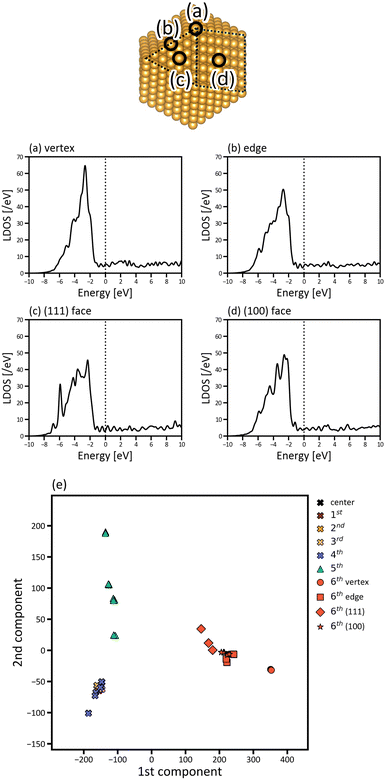
The site dependence of the electronic structures of the nanoparticles was investigated by projecting the DOS to each atom in the nanoparticles. The LDOS of the atoms at the vertex, in the edge, and the (100) and (111) faces of Oh6 are presented in Fig. 4. The vertex atom has a characteristic electronic structure; that is, the d-band of the vertex atom is much sharper and the d-band centre is closer to EF compared with those of the atoms in the edge and faces. This suggests that the vertex atom is an active site in the nanoparticle, based on d-band centre theory.45,46 It's also reported experimentally by Feng et al. that Au vertex sites are the dominant Au active sites.47
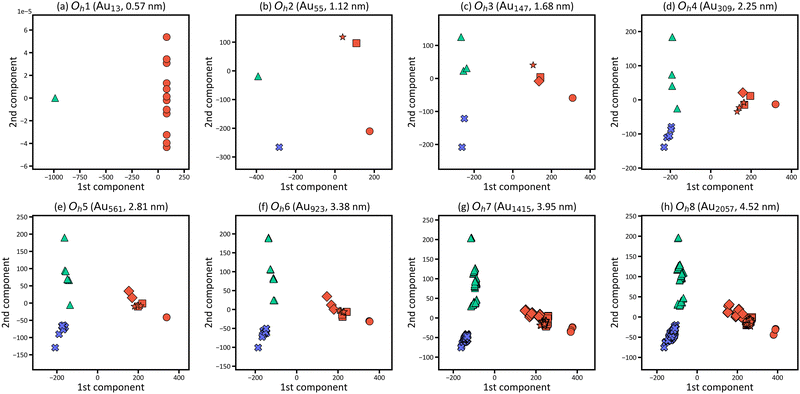
Fig. 4(a)–(d) focusses on the atoms at the representative positions, although there are many more atoms in the nanoparticles. To systematically and efficiently investigate the electronic structures of all atoms in the large systems and determine the characteristic atoms among them, we applied PCA to the raw LDOS data. Fig. 4(e) shows the PCA result for Oh6 with 923 atoms, in which the LDOS data with ∼3543 dimensions were reduced to 2D. There are 923 points that correspond to the electronic structures of the 923 atoms in the figure, plotted according to the principal component scores for the first and second components as a 2D map. The difference of LDOS is quantified as the position difference of the data points in the PCA map. The proportions of variance of the first and second PCA components are 0.810 and 0.100, which means that the two components include most of the information for the raw data in high dimensions.
In Fig. 4(e), the data points are roughly distributed into three areas, namely the right, upper left, and lower left areas, and the points in these three areas correspond to the atoms in the surface (6th layer), subsurface (5th layer), and the inner layers (1st to 4th layers), respectively. The first PCA component divides the atoms in the surface from the other layers, and the second PCA component divides the atoms in the subsurface from the others. This indicates that the surface and subsurface have characteristic electronic structures, whereas the electronic structures of the inner layers are more similar to each other, almost converging. Thus, by simultaneously analysing the electronic structures of all atoms, we can demonstrate how deeply the electronic structure is affected by forming a nanoparticle. Considering the right area in Fig. 4(e), the points of the vertex atoms are separated from those of the other atoms on the surface, suggesting that the electronic structures of vertex atoms are different from the other atoms.
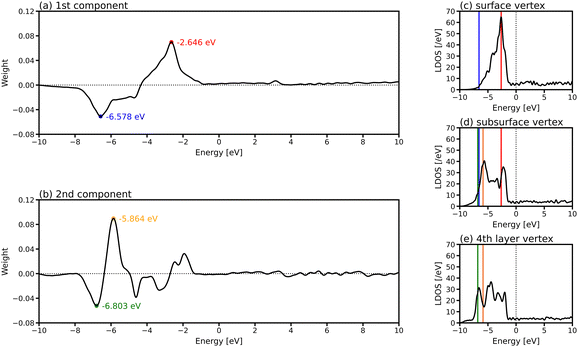
To investigate which parts of LDOS is found to be different by PCA, the weights of the two PCA components in Fig. 4(e) are provided in Fig. 5(a) and (b), which represent the parts of the LDOS with significant differences. The first PCA component has a large positive peak at −2.646 eV and a large negative peak at −6.578 eV. Comparing the LDOS of the atoms at the vertex position in the surface (Fig. 5(c)) and the subsurface (Fig. 5(d)), the LDOS of the surface atom is higher around −2.646 eV and lower around −6.578 eV than that of the subsurface atom. For the second component, there are large peaks around −5.864 and −6.803 eV. The differences around these energy regions are clearly observed when comparing the LDOS of the atoms in the subsurface (Fig. 5(d)) and the 4th layer (Fig. 5(e)).
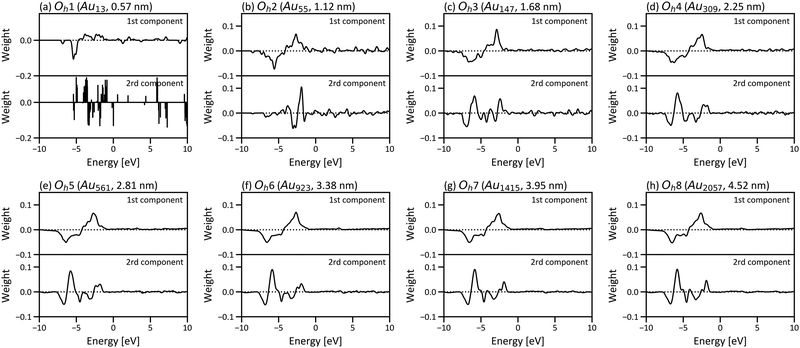
Fig. 6 shows the PCA results for Oh1–Oh8 and corresponds to the size dependence of “local” electronic structures, whereas Fig. 3 corresponds to the size dependence of the global electronic structure for whole nanoparticles. In Fig. 6, the points are categorised in the three areas for all eight nanoparticles, and the distribution of the points in the three areas starts converging roughly from Oh4. The results indicate that the electronic structure change by forming nanoparticles occurs only in the surface and subsurface for any size of nanoparticles and that not only the electronic structure of the whole nanoparticle but also the local electronic structures start converging from the particle size of ∼2 nm. Furthermore, the points are distributed more widely in Oh8 than in Oh4, indicating that the site dependence of the electronic structure is larger in larger nanoparticles. The weights of the PCA components in Fig. 6 are provided in Fig. 7. Since the PCAs were performed separately, we obtained different PCA components for Oh1–Oh8. The PCA components in Fig. 7 also become similar from Oh4 since the LDOS is almost converged. For Oh1 in which there are only 2 kinds of atomic positions, only the first component is useful for the classification. Note that we did not use descriptors based on domain knowledge, such as the d-band centre, but still distinguished the atoms with different electronic structures.
3.2 Atomic and electronic structures of supported nanoparticles
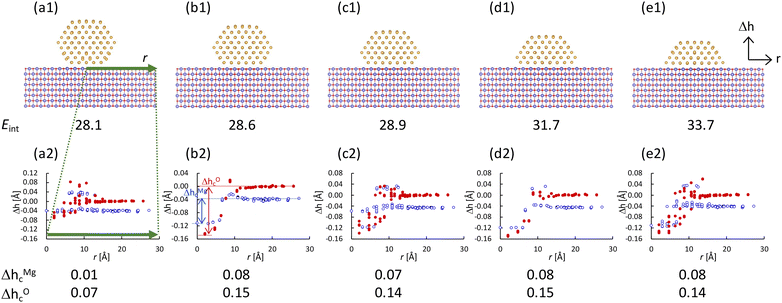
Next, we investigated the atomic and electronic structures of gold nanoparticles supported by the MgO(100) substrate. In the present study, we chose Oh4 as the model of the gold nanoparticle on the MgO substrate because the electronic structure of Oh4 can be considered “metallic”, based on the discussion in the previous section. It has been observed experimentally that the lower part of the gold nanoparticle near the substrate is missing.1,48 Therefore, in the present study, we investigated nanoparticles with several shapes, in which the lower layers of the nanoparticle are missing, as shown in Fig. 8(a1)–(e1). The interfacial area between the nanoparticle and the substrate becomes wider when more of the lower part of the nanoparticle is missing, and the interaction energies (Eint) between the nanoparticles and the substrates gradually increase as the interfacial areas increase. The heights of the Mg and O atoms in the MgO surface (Δh) are also provided in Fig. 8(a2)–(e2). The horizontal axis in Fig. 8(a2)–(e2) corresponds to the distance from the centre of the nanoparticle to Mg or O atom in xy-plane. Note that O is higher than Mg in the surface far from the nanoparticle, which is consistent with the previous studies for the clean MgO(100) surface.49 It is found that the heights of the surface atoms near the nanoparticles are lower than those of the other surface atoms, indicating that the MgO surfaces are concave under the nanoparticle. In the figure, the magnitude of the concave Δhc is defined as the height difference between the lowest atom and the atom furthest from the nanoparticle for each of Mg and O. The concaves around the nanoparticles whose lower layers are missing (Fig. 8(b2)–(e2)) are larger than that around the perfect nanoparticle (Fig. 8(a2)).Then, we investigated the electronic structures of supported gold nanoparticles. The LDOS of the atoms in the supported nanoparticles was calculated. Using the first and second components obtained for isolated Oh4 nanoparticles, the LDOS of the supported nanoparticles was projected directly onto the PCA map of the isolated Oh4 nanoparticle, as shown in Fig. 9. Owing to the direct projection, we can compare the differences in the position of the points between the isolated and supported nanoparticles in a PCA map, which corresponds to the electronic structure change induced by the MgO substrate. When a point of the supported nanoparticle is shifted from that of the isolated nanoparticle, it means that the electronic structure of the corresponding atom is changed by the MgO substrate. In the centre areas of the PCA maps, there are several points for the supported nanoparticles but no point for the isolated nanoparticle. The centre points correspond to the electronic structures of the gold atoms at the interface between the nanoparticle and the substrate. Thus, the PCA map reveals the large electronic structure changes in the gold atoms at the interface. Fig. 9(a′) shows the PCA results of the supported nanoparticle, in which the particle shape is the same as that in Fig. 9(a) but the position of the nanoparticle is different (i.e., the gold atoms in the interface are located above the Mg atoms of the surface). Comparing Fig. 9(a) and (a′), the distributions of the points in the centre areas differ, but the positions of the other points are more similar. This means that the electronic structures of the interface atoms largely depend on the particle positions, whereas those of the other atoms depend less on the positions. Moreover, there are two points corresponding to the vertex atoms v1 and v2 in Fig. 9(a2)–(d2), which are not located at the interface, although v2 is closer than v1 to the substrate. The point of v2 is further than that of v1 from the point of the vertex atom in the isolated nanoparticle v0, especially in the nanoparticles whose lower layers are missing, as shown in Fig. 9(b2)–(d2). These point distributions indicate that the electronic structures of the atoms that are not directly located at but, rather, near the interface are also slightly affected by the substrate, whereas the atoms far from the interface are barely affected.
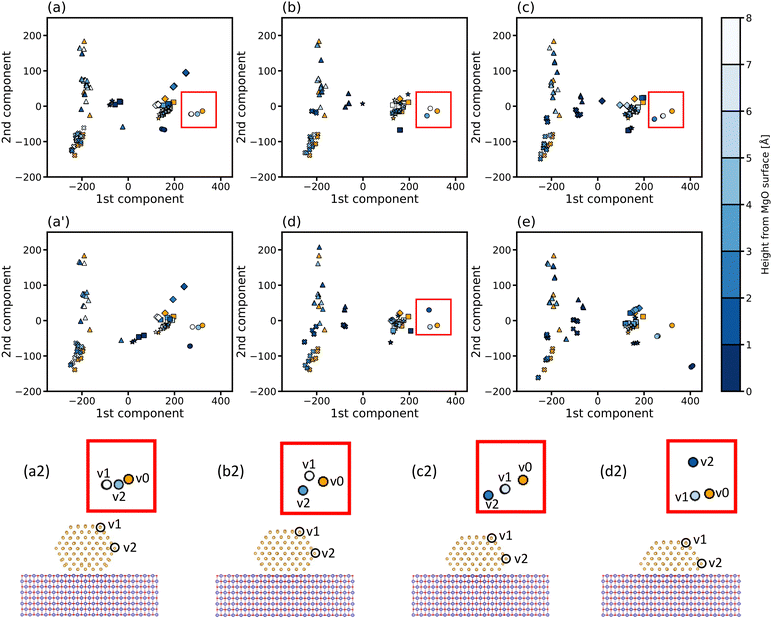 | ||
| Fig. 9 (a)–(e) Two-dimensional PCA map of the supported nanoparticles with the shapes in Fig. 9(a1)–(d1). The PCA results of the supported nanoparticles are presented with blue points. The colour depth of the blue points corresponds to the distance of the gold atoms from the MgO substrate surface. The PCA result of the isolated nanoparticle is presented with yellow points for comparison. (a2)–(d2) Enlarged figures of the squarely-surrounding areas in (a)–(d) with the corresponding atomic sites (v1 and v2). v0 in (a2)–(d2) correspond to the points of the vertex atom in the isolated nanoparticle. Cross, triangle, circle, square, diamond and star symbols corresponds to the atomic positions, inside layers, subsurface and surface vertex, edge, (111) and (100) faces in Oh4, respectively. | ||
To investigate the relationship between the PCA result and the reactivity, we calculated the adsorption energies Ead of a hydrogen atom (H) and an O2 molecule at the vertex atoms of the isolated nanoparticle (v0) and the vertex atoms at the v1 and v2 sites of the supported nanoparticles. As shown in Table 1, the Ead of v2 is larger than that of v1 for all supported nanoparticles. The O–O bond elongation is also larger in v2 than in v1, which indicates that adsorption with larger Ead leads to larger bond elongation. These results suggest that the vertex atoms near the substrate, whose points are shifted significantly in the PCA map, are activated more than those far from the substrate because of the substrate effect, even if they are not located directly at the interface. Comparing the particles with different shapes, the order of Ead and O–O bond elongation at the v2 site is sNP-a ≲ sNP-b < sNP-c < sNP-d, which suggests that the vertex nearer to the substrate is more active. For sNP-d, the adsorbed O2 molecule is close to the surface and the molecule interacts not only with the vertex atom but also with the surface. Although it is difficult to make rigorous conclusions because the absolute differences between the Ead and the O–O bond elongation are subtle in the present calculation, the results suggest that conducting the PCA of the LDOS data is useful for identifying the potential active sites.
| Isolated nanoparticle | Supported nanoparticle | |||||||||
|---|---|---|---|---|---|---|---|---|---|---|
| Particle shape | O h 4 | sNP-a | sNP-b | sNP-c | sNP-d | |||||
| Adsorption site | v0 | v1 | v2 | v1 | v2 | v1 | v2 | v1 | v2 | |
| Adsorbate | ||||||||||
| H | E ad | 75.6 | 76.3 | 77.0 | 75.0 | 76.3 | 74.5 | 75.7 | 76.0 | 80.2 |
| O2 | E ad | 27.6 | 22.5 | 23.0 | 22.2 | 22.5 | 22.6 | 23.9 | 22.9 | 37.4 |
| ΔrO–O | 0.043 | 0.047 | 0.047 | 0.048 | 0.048 | 0.049 | 0.051 | 0.050 | 0.098 | |
4. Conclusions
The present study has proposed a method to analyse the difference of the local electronic structure in large systems systematically and quantitatively by the combination of large-scale DFT calculations and PCA. The size and site dependences of the atomic and electronic structures of isolated and supported gold nanoparticles were investigated by the combination of large-scale DFT calculations and statistical analysis. The large-scale DFT calculations with the CONQUEST code for isolated gold nanoparticles with several diameters ranging from 0.55 nm to 4.52 nm revealed that the DOS of the nanoparticle converges according to its size, and the nanoparticles with diameters of ∼2 nm or larger have continuous (i.e., metallic) electronic structures. To investigate the site dependence of the electronic structures, the LDOS was calculated for all atoms. Because we used large simulation models containing several thousand atoms, it was not straightforward to investigate the LDOS for all atoms and identify atoms that have characteristic electronic structures. To overcome this problem and systematically and efficiently analyse the LDOS of several thousand atoms in the nanoparticles, we performed PCA. For the nanoparticles of ∼2 nm or larger in diameter, the PCA results of the LDOS were categorised into three groups: the atoms in the surface, subsurface, and inner layers. Differences in the electronic structure were only found in the surface and subsurface, whereas the electronic structures of the inner layers almost converged. Conventionally, it has been assumed that several outer layers of the nanoparticle have different electronic structures from the bulk system because of surface effects, but our large-scale DFT calculation combined with PCA provides insight into how deeply the change in the electronic structure extends into the nanoparticles.We have also investigated the effect of the substrate on the electronic structure of the nanoparticles. The DFT calculations of gold nanoparticles on the MgO(100) substrate, consisting of approximately three thousand atoms in total, were performed using multi-site support functions. Notably, the optimised structures of the MgO surface were concave near the nanoparticle. The LDOS of the gold atoms in the supported nanoparticles were investigated by projecting their DOS with the PCA components obtained for the isolated nanoparticle, which enabled the direct comparison of the LDOS for the isolated and supported nanoparticles in a 2D-PCA map. By comparing the positions of the points for the isolated and supported nanoparticles in the PCA map, we determined the atoms that are largely affected by the MgO substrate. Most of the largely affected atoms are located at the interface between the nanoparticle and the substrate, and several atoms are affected even though they are not located directly at the interface. The comparison of the adsorption for a hydrogen atom and an O2 molecule to the vertex atoms in the isolated and supported nanoparticles shows that the vertex atom, which is found to be more strongly affected by the substrate has larger adsorption energy and O–O bond elongation, indicative of the correlation between the electronic structure and the reactivity. This result is encouraging, suggesting that we can predict active sites in large systems from the information on local electronic structures in future work. Moreover, the large-scale DFT calculation combined with PCA in the present study is not limited to the present systems but applicable to many kinds of problems, for example, the effect of the combinations of other nanoparticles and substrates, the effect of defects and dopants and so on. The present method can be also applied to various materials, not only to catalysts. Managing huge amounts of data has been one of the long-standing problems in large-scale calculations, and the present method may help to overcome the problem.
Data availability
The CONQUEST code for large-scale first-principles density functional theory calculations can be found at https://github.com/OrderN/CONQUEST-release with DOI: 10.5281/zenodo.3943720. The version of the code employed for this study is version 1.0.5.Conflicts of interest
There are no conflicts to declare.Acknowledgements
The authors appreciate Prof. Yoshitada Morikawa and Prof. Takato Mitsudome at Osaka University for their valuable discussion. This work is supported by the World Premier International Research Centre Initiative (WPI Initiative) on Materials Nanoarchitectonics (MANA), JST PRESTO (Grant No. JPMJPR20T4), JSPS Grant-in-Aid for Transformative Research Areas (A) “Hyper-Ordered Structures Science” (Grant No. JP20H05883 and JP20H05878), JSPS Grant-in-Aid for Scientific Research (Grant No. JP18H01143), and MEXT “Program for Promoting Research on the Supercomputer Fugaku” (Grant No. JPMXP1020230325). Calculations were performed using the Numerical Materials Simulator at NIMS. We thank Robert Ireland, PhD, from Edanz (https://jp.edanz.com/ac) for editing a draft of this manuscript.References
- T. Ishida, T. Murayama, A. Taketoshi and M. Haruta, Chem. Rev., 2020, 120, 464–525 CrossRef CAS PubMed.
- H. Yoshida, Y. Kuwauchi, J. R. Jinschek, K. Sun, S. Tanaka, M. Kohyama, S. Shimada, M. Haruta and S. Takeda, Science, 2012, 335, 317–319 CrossRef CAS PubMed.
- B. N. Reinecke, K. P. Kuhl, H. Ogasawara, L. Li, J. Voss, F. Abild-Pedersen, A. Nilsson and T. F. Jaramillo, Surf. Sci., 2016, 650, 24–33 CrossRef CAS.
- S. Peredkov, S. Peters, M. Al-Hada, A. Erko, M. Neeb and W. Eberhardt, Catal. Sci. Technol., 2016, 6, 6942–6952 RSC.
- T. Ohgi and D. Fujita, Phys. Rev. B: Condens. Matter Mater. Phys., 2002, 66, 1–5 CrossRef.
- A. S. Barnard, Rep. Prog. Phys., 2010, 73, 086502 CrossRef.
- R. Ferrando, G. Rossi, A. C. Levi, Z. Kuntová, F. Nita, A. Jelea, C. Mottet, G. Barcaro, A. Fortunelli and J. Goniakowski, J. Chem. Phys., 2009, 130, 174702 CrossRef PubMed.
- L. M. Molina and B. Hammer, Phys. Rev. Lett., 2003, 90, 206102 CrossRef CAS PubMed.
- B. Mercedes and C. Avelino, Dalton Trans., 2010, 39, 8538–8546 RSC.
- H. A. Hussein, J. B. A. Davis and R. L. Johnston, Phys. Chem. Chem. Phys., 2016, 18, 26133–26143 RSC.
- T. Whittaker, K. B. S. Kumar, C. Peterson, M. N. Pollock, L. C. Grabow and B. D. Chandler, J. Am. Chem. Soc., 2018, 140, 16469–16487 CrossRef CAS PubMed.
- Y. He, J. C. Liu, L. Luo, Y. G. Wang, J. Zhu, Y. Du, J. Li, S. X. Mao and C. Wang, Proc. Natl. Acad. Sci. U. S. A., 2018, 115, 7700–7705 CrossRef CAS PubMed.
- J. M. Rahm and P. Erhart, Nano Lett., 2017, 17, 5775–5781 CrossRef CAS PubMed.
- H. Li, L. Li, A. Pedersen, Y. Gao, N. Khetrapal, H. Jónsson and X. C. Zeng, Nano Lett., 2015, 15, 682–688 CrossRef CAS PubMed.
- D. S. Rivera Rocabado, T. Ishimoto and M. Koyama, SN Appl. Sci., 2019, 1, 1485 CrossRef.
- J. E. M. Cardona, A. Salichon, N. Tarrat, E. Gaudry and D. Loffreda, J. Phys. Chem. C, 2023, 127, 18043–18057 CrossRef CAS.
- Conquest website, https://www.order-n.org, (accessed February 2024).
- E. Hernández and M. J. Gillan, Phys. Rev. B: Condens. Matter Mater. Phys., 1995, 51, 10157–10160 CrossRef PubMed.
- A. Nakata, J. S. Baker, S. Y. Mujahed, J. T. L. Poulton, S. Arapan, J. Lin, Z. Raza, S. Yadav, L. Truflandier, T. Miyazaki and D. R. Bowler, J. Chem. Phys., 2020, 152, 164112 CrossRef CAS PubMed.
- A. Nakata, D. R. Bowler and T. Miyazaki, J. Chem. Theory Comput., 2014, 10, 4813–4822 CrossRef CAS PubMed.
- A. Nakata, D. R. Bowler and T. Miyazaki, Phys. Chem. Chem. Phys., 2015, 17, 31427–31433 RSC.
- A. Nakata, D. R. Bowler and T. Miyazaki, J. Phys. Soc. Jpn., 2022, 91, 091011 CrossRef.
- C. Romero-Muñiz, A. Nakata, P. Pou, D. R. Bowler, T. Miyazaki and R. Pérez, J. Phys.: Condens. Matter, 2018, 30, 505901 CrossRef PubMed.
- T. Toyao, Z. Maeno, S. Takakusagi, T. Kamachi, I. Takigawa and K. I. Shimizu, ACS Catal., 2020, 10, 2260–2297 CrossRef CAS.
- I. Takigawa, K. I. Shimizu, K. Tsuda and S. Takakusagi, RSC Adv., 2016, 6, 52587–52595 RSC.
- S. R. Broderick and K. Rajan, EPL, 2011, 95, 57005 CrossRef.
- C. Ben Mahmoud, A. Anelli, G. Csányi and M. Ceriotti, Phys. Rev. B, 2020, 102, 235130 CrossRef CAS.
- K. Bang, B. C. Yeo, D. Kim, S. S. Han and H. M. Lee, Sci. Rep., 2021, 11, 11604 CrossRef CAS PubMed.
- S. Kong, F. Ricci, D. Guevarra, J. B. Neaton, C. P. Gomes and J. M. Gregoire, Nat. Commun., 2022, 13, 949 CrossRef CAS PubMed.
- J. P. Perdew, K. Burke and M. Ernzerhof, Phys. Rev. Lett., 1996, 77, 3865–3868 CrossRef CAS PubMed.
- D. R. Hamann, Phys. Rev. B: Condens. Matter Mater. Phys., 2013, 88, 085117 CrossRef.
- D. R. Bowler, J. S. Baker, J. T. L. Poulton, S. Y. Mujahed, J. Lin, S. Yadav, Z. Raza and T. Miyazaki, Jpn. J. Appl. Phys., 2019, 58, 100503 CrossRef CAS.
- A. S. Torralba, M. Todorović, V. Brázdová, R. Choudhury, T. Miyazaki, M. J. Gillan and D. R. Bowler, J. Phys.: Condens. Matter, 2008, 20, 294206 CrossRef.
- D. R. Småbråten, A. Nakata, D. Meier, T. Miyazaki and S. M. Selbach, Phys. Rev. B, 2020, 102, 144103 CrossRef.
- Y. Yamamoto, T. Miura, M. Suzuki, N. Kawamura, H. Miyagawa, T. Nakamura, K. Kobayashi, T. Teranishi and H. Hori, Phys. Rev. Lett., 2004, 93, 116801 CrossRef CAS PubMed.
- X. Wang, Y. Bai, X. Du, J. Han and Y. Yang, Chem. Phys. Lett., 2023, 830, 140792 CrossRef CAS.
- R. J. Magyar, V. Mujica, M. Marquez and C. Gonzalez, Phys. Rev. B: Condens. Matter Mater. Phys., 2007, 75, 144421 CrossRef.
- W. Luo, S. J. Pennycook and S. T. Pantelides, Nano Lett., 2007, 7, 3134–3137 CrossRef CAS PubMed.
- S. Grimme, J. Comp. Chem, 2006, 27, 1787–1799 CrossRef CAS PubMed.
- B. K. Teo and N. J. A. Sloane, Inorg. Chem., 1985, 24, 4545–4558 CrossRef CAS.
- F. Pedregosa, G. Varoquaux, A. Gramfort, V. Michel, B. Thirion, O. Grisel, M. Blondel, P. Prettenhofer, R. Weiss, V. Dubourg, J. Vanderplas, A. Passos, D. Cournapeau, M. Brucher, M. Perrot and E. Duchesnay, J. Mach. Learn. Res., 2011, 12, 2825–2830 Search PubMed.
- I. T. Jolliffe and J. Cadima, Phil. Trans. R. Soc. A, 2016, 374, 20150202 CrossRef PubMed.
- C. Kittel, Introduction to Solid State Physics, John Wiley & Sons, United States, 2005, pp. 50 Search PubMed.
- A. Visikovskiy, H. Matsumoto, K. Mitsuhara, T. Nakada, T. Akita and Y. Kido, Phys. Rev. B, 2011, 83, 165428 CrossRef.
- B. Hammer and J. K. Norskov, Nature, 1995, 376, 238–240 CrossRef CAS.
- W. A. E. Prabowo, N. Khoiroh, S. Wibisono and A. Supardi, J. Phys.: Conf. Ser., 2020, 1445, 012011 CrossRef CAS.
- X. Feng, X. Duan, G. Qian, X. Zhou, D. Chen and W. Yuan, J. Catal., 2014, 317, 99–104 CrossRef CAS.
- Y. Kuwauchi, S. Takeda, H. Yoshida, K. Sun, M. Haruta and H. Kohno, Nano Lett., 2013, 13, 3073–3077 CrossRef CAS PubMed.
- A. J. Logsdail, D. Mora-Fonz, D. O. Scanlon, C. R. A. Catlow and A. A. Sokol, Surf. Sci., 2015, 642, 58–65 CrossRef CAS.
Footnote |
| † Electronic supplementary information (ESI) available. See DOI: https://doi.org/10.1039/d4cp01094a |
| This journal is © the Owner Societies 2024 |

