 Open Access Article
Structure and dynamics of Li1.24K0.76CO3 molten carbonate electrolyte from molecular simulations with explicit polarization
Francesco
Sessa
 ab,
Massimiliano
Della Pietra
c,
Simone
Mataloni
c,
Ana B.
Muñoz-García
 bd and
Michele
Pavone
 *ab
*ab
aDepartment of Chemical Sciences, Università di Napoli “Federico II”, Compl. Univ. Monte Sant’Angelo, via Cintia 21, 80126, Napoli, Italy. E-mail: michele.pavone@unina.it
bNational Reference Centre for Electrochemical Energy Storage (GISEL) - INSTM, Via Giusti 9, 50121 Florence, Italy
cENEA, R. C. Casaccia, TERIN-PSU-ABI, Via Anguillarese 301, 00123, Rome, Italy
dDepartment of Physics “Ettore Pancini”, Università di Napoli “Federico II”, Compl. Univ. Monte Sant’Angelo, via Cintia 21, 80126, Napoli, Italy
First published on 25th April 2024
Abstract
Molten carbonate electrolysis cells represent a key technology for harnessing surplus energy from renewable sources and converting it into gaseous energy carriers. To optimize their efficiency, a comprehensive understanding of each step in the operational process is essential. Here, we focus on the electrolyte of choice in molten carbonate cells: the Li1.24K0.76CO3 melt. Utilizing molecular dynamics with explicit polarization, we demonstrate that the structure of this molten mixture is characterized by a dense network of lithium–carbonate complexes, with K+ ions loosely embedded within this network. This structural insight enables us to rationalize from an atomistic perspective the conductivity trends observed experimentally in molten carbonates. Moreover, our work highlights the importance of including polarization for the simulations of dense liquid carbonates. It also acts as a foundational step towards more advanced theoretical studies for elucidating the role of the electrolyte in these devices.
1. Introduction
The quest for clean energy is a defining challenge of our century, driven by the need to mitigate human impact on the planet's ecosystems. Given that carbon dioxide accounts for approximately 95% of energy-related greenhouse gas emissions,1 significant scientific effort is being invested in understanding how to efficiently harness energy from renewable sources.Renewable sources, however, are inherently dependent on weather conditions, posing a challenge for their integration within the existing power network and meeting constant energy demand. This has sparked interest in the development of a diverse range of energy storage technologies,2 as for example the electrolysis cells with their ability to convert surplus electricity from a renewable source into gaseous energy carriers such as H2 and CH4, on a seasonal basis.3 Among these, Molten carbonate electrolysis cells (MCECs) are prime examples. The high-temperature MCEC electrochemical devices can operate in electrolysis mode to convert electricity into a H2-rich gas, or reuse CO2 in fuel cell mode to reconvert H2 into energy.4,5 In electrolysis mode, CO2 and H2O react at the cathode to form H2 and carbonate anions. The CO32− anions then migrate through the electrolyte towards the anode where they are reduced to O2 and CO2.6 To enhance the efficiency of current MCEC devices, it is crucial to gain a comprehensive understanding of each step of this process.
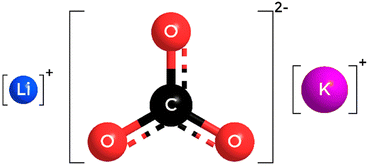
This study will focus on the structure of the cell electrolyte, a molten eutectic mixture of alkali-metal carbonates. The standard electrolyte composition in MCEC applications is currently Li1.24K0.76CO3,6,7 a mixture of 62% Li and 38% K carbonates. Therefore, we will focus exclusively on this composition in our investigation. Fig. 1 shows the atomic structure of the ions involved.
Existing literature provides valuable information on some dynamical properties of this mixture (e.g. ionic conductivity).8–12 However, an accurate analysis of the structural properties of the Li1.24K0.76CO3 mixture is still missing due to challenging experimental conditions (MCECs operate at around 923 K). In this context, computational chemistry can provide valuable insights through molecular dynamics (MD) simulations. Given that the experimental data available for a quantitative assessment of the MD model's reliability is primarily limited to dynamical properties, long simulation times are necessary. Estimating dynamical properties, such as diffusion coefficients or ionic conductivity, for viscous systems often requires reaching the nanosecond timescale. This range is unfeasible for any ab initio simulation, leaving the task to simpler models. Noteworthy, even in the absence of direct structural information from experiments, simulation models can still be qualitatively compared to analogous systems. Examples of comparable structural data include X-ray and neutron scattering of a LiKCO3 crystal,13,14 or X-ray scattering of molten Li2CO3.15
Building on the pioneering work of Tissen and Jenssen,16,17 numerous studies have explored the Li1.24K0.76CO3 system using classical force field models.18–21 However, these studies primarily focus on transport properties, limiting structural analysis mainly to radial distribution functions. Tissen and Jenssen were the only ones to provide additional structural information in the form of angular distribution functions.16,17 Their research revealed that the coordination of Li+ ions is more compact in Li1.24K0.76CO3 compared to pure Li2CO3, while the coordination of K+ ions is looser in the mixture compared to pure molten K2CO3. However, their use of a rigid model for the CO32− anion could significantly influence the resulting structure. Notably, the crystallographic structure of LiKCO3 shows considerable distortion of the CO32− anion from its typical trigonal symmetry.14 Also, Corradini et al. studied the ability of molten carbonates in solvating CO2, leading to the exceptional find of a Grotthus-like mechanism for CO2 diffusion within these melts.22 A further study showed how, in the Li1.24K0.76CO3 melt, only K+ ions coordinate CO2 while around Li+ ions the structure remains unperturbed.21
Another critical aspect to consider in force field models is the explicit accounting for polarizability. While the significance of polarization effects in MD simulations is often linked to the accuracy of transport properties, polarizabilities can also play a major role in the structure of ionic systems, particularly in ionic liquids in energy storage and conversion devices.23 To the best of our knowledge, the only attempt to introduce polarization effects in an MD simulation of molten Li1.24K0.76CO3 was made by Costa.18 He used the fluctuating charges model to simulate polarization effects,24 allowing partial charges to change via the electronegativity equalization method as the system evolves. This introduces polarization as a charge transfer between bonded atoms. While this model has yielded good results in simulating liquid water,24 treating polarization solely as a charge transfer presents significant limitations for a molten alkali carbonate mixture. It completely overlooks the polarizability of monoatomic ions such as Li+ and K+, and only allows for CO32− anions to experience polarization effects that would distort the ion electron density only within the molecular plane, not outside of it. To address these limitations, other polarization models, such as the Drude model,25 can be employed. This model treats polarization effects via the displacement of auxiliary fictitious particles, simulating the distortion of electron clouds.
In this study, we present MD simulations of the Li1.24K0.76CO3 melt using the Drude polarizable model to explicitly describe polarization effects. Based on our simulations, we will provide a comprehensive structural characterization of the Li1.24K0.76CO3 electrolyte at the operating temperature of MCECs. The structural insights gained will be compared to the crystallographic structure of a LiKCO3 crystal.14 Finally, we will evaluate the theoretical static structure factor, S(q), for the melt and compare it to the experimental S(q) obtained for molten Li2CO3 by Ohata et al.15
2. Methods and computational details
2.1 Force fields parameters
The force field utilized in this study is assembled by merging parameters from various works in recent literature. Harmonic potentials govern bond interactions, while non-bonded interactions are described through a combination of coulombic and Lennard-Jones (LJ) pairwise potentials. Explicit treatment of polarization effects is achieved using the Drude oscillator model,25 which involves attaching an auxiliary particle (Drude particle) carrying negative charge to each atom. The charge carried by a Drude particle is proportional to its atom's polarizability. These particles are connected to their respective atoms by a harmonic potential, and their displacement under the influence of the chemical environment simulates polarization effects. A detailed discussion on the Drude oscillator model and its relation to other polarization models can be found elsewhere.25For the CO32− anion, we adopt partial charges and bonding parameters from Mondal et al.,20 while LJ parameters are sourced from Silva et al.26 Polarizabilities for C and O atoms are extracted from the work by Heid et al.27 Charges and LJ parameters for both cations are derived from Reif and Hünenberger's “LE” set,28 with experimental polarizabilities obtained from the CRC handbook of chemistry and physics.29 Mixed LJ parameters between pairs of different atom types are generated by the geometric mean. To better account for the size of K+, σ(K–O) and σ(K–C) are then increased to 3.992 and 3.543 Å. Introducting polarization effects on K+ changes the pair potential, softening the hard repulsive barrier typical of LJ potentials and resulting in a smaller ion size. Since the polarizability of Li+ is almost negligible, such adjustment is unneccesary for interactions involving the Li+ ions. All charges are then scaled by a factor of 0.82 to enhance ion dynamics. This scaling factor has been successfully used by Corradini et al. to improve the dynamical properties of MD simulations of molten carbonates.19 Also, previous works have shown that the use of full charges overestimates coulombic interactions in the melt, slowing down dynamics.18,20
2.2 Molecular dynamics simulations
The LAMMPS package30 is employed for the MD simulation of the Li1.24K0.76CO3 melt. The system comprises 124 Li+, 76 K+, and 100 CO32− ions, with all atoms treated as polarizable. Simulations are conducted in the NVT ensemble with cubic periodic boundary conditions, an edge size of 20.3486 Å to reproduce the experimental density, and a fixed temperature of 923 K maintained by coupling the system to a Nose–Hoover thermostat (coupling constant of 0.5 ps).31,32 Long-range electrostatic effects beyond a 10 Å cutoff are handled using the particle mesh ewald (PME) method.33 The system is equilibrated for 10 ns using a time step of 1 fs before initiating a production run of 30 ns. The additional simulations required to estimate the ionic conduction activation energy are performed at fixed temperatures of 800, 1000, 1100 and 1200 K following the same setup described above for the simulation at 923 K.2.3 Molecular dynamics analyses
Structural properties are characterized using radial and combined distance-angle distribution functions (RDFs and CDFs). The RDF for AB pairs is defined by eqn (1). | (1) |
 | (2) |
CDFs analysis is used to obtain information about the geometry of an ABn coordination (eqn (3)).
 | (3) |
The theoretical static structure factor, S(q), is calculated from the MD simulation using eqn (4).
 | (4) |
To analyze the dynamics of ions in the simulation, we evaluate the self-diffusion coefficient of each ion, Dion, and the ionic conductivity of the system. Self-diffusion coefficients are obtained using the Einstein relation (eqn (5)) using the mean square displacement of an ion as function of time.
 | (5) |
The ionic conductivity is calculated using the Nernst–Einstein equation (eqn (6)).
 | (6) |
 | (7) |
All analyses are performed with in-house developed codes, except for the self-diffusion coefficients evaluation, for which a utility of the GROMACS package is used.36–38
3. Results and discussion
3.1 Validating the force field parameters
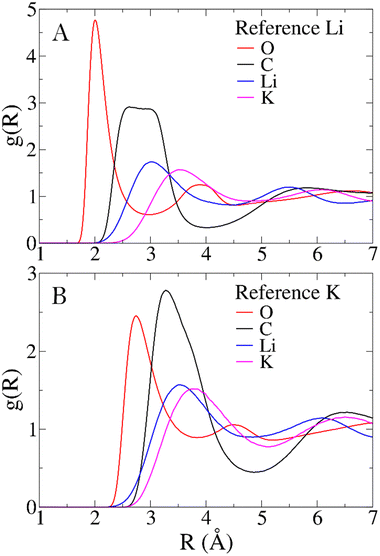
To characterize the structure of the Li1.24K0.76CO3 melt, RDFs for all significant pairs of atoms in the system are examined. Comparisons between the distributions of different pairs offer insights into how cations and anions interact in the melt. Mean distances obtained from RDFs are compared with other computational models and, when available, with experimental data to assess the reliability of the force field. In the absence of direct structural experimental data on the Li1.24K0.76CO3 mixture, the structure of the LiKCO3 crystal obtained from neutron and X-ray scattering data serves as the closest reference.13,14Fig. 2 illustrates the RDFs centered on Li+ (Panel A) and K+ (Panel B) with all other atoms in the simulated system, while Table 1 provides first peak mean distances (〈RMD〉) and coordination numbers (NMD) obtained from the simulation, along with corresponding values for the LiKCO3 crystallographic structure (〈Rcrys〉 and Ncrys).14The polarizable force field employed in this study yields Li–O and K–O mean distances and coordination numbers that closely align with those of the experimental reference LiKCO3 crystal. Larger disparities are observed for Li–C and K–C distances. The former is longer than in the crystal, while the latter is shorter. However, these seemingly significant shifts in cation-carbon distances can be justified in terms of a different bidentate to monodentate ligand ratio, expected when transitioning from solid to liquid phases. In the case of the CO32− anion, monodentate and bidentate coordinations primarily differ in the cation-carbon distance. Compared to LiKCO3 crystal (see Table 1), the melt exhibits an increase in monodentate ligands around Li+ and a higher number of bidentate ligands around K+, resulting in longer Li–C and shorter K–C distances.
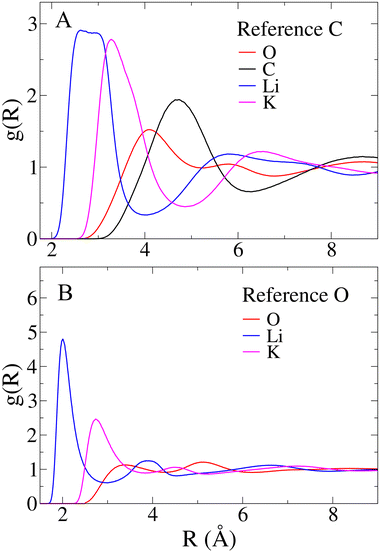
Aside from comparisons with literature references, Fig. 2 RDFs provide insights into the melt structure. The sharpness of the Li–O RDF first peak suggests a tight coordination of carbonate oxygen atoms around Li+. Conversely, the absence of such sharpness in K+ RDF indicates a looser coordination for the larger cation. A noteworthy structural observation arises from the significant overlap between cation-carbon RDFs and respective cation–cation RDFs in Fig. 2. While the mean distance trends in Table 1 align with expectations, indicating cation–cation distances are, on average, larger than cation-carbonate distances, the overlap implies that around a given cation, a layer may not only contain carbonate anions. In contrast, a neater charge alternation pattern is observed for carbonate anions, as shown in Fig. 3. For further validation, we compare our model's structural information with previous MD works. Recently, Corradini et al. presented RDFs for Li1.24K0.76CO3.19 Qualitatively comparing our RDFs (Fig. 2 and 3) with theirs reveals striking similarities, supporting the reliability of our force field. Considering the primary application of Li1.24K0.76CO3 as an electrolyte, evaluating the force field performance includes assessing ionic conductivity. Experimentally, Kojima et al. reported an ionic conductivity of 131 ± 1 S m−1 at 923 K,9 recently confirmed also by Zhadan et al. with NMR measurments.11 Our simulation yields a σMD of 121 ± 8 S m−1, showing reasonably good agreement (relative error < 8%). Despite an unusual trend of higher diffusivity for Li+ compared to K+, consistent with Li content-dependent conductivity observed in experiments,9 our simulation aligns well with previous MD studies.18,19Table 2 summarizes self-diffusion coefficients and ionic conductivity, demonstrating the agreement between our simulation and experimental data.9 In a recent work, Zhadan et al. also provide single-ion contributions to the total ionic conductivity,11 showing Li+, K+ and CO32− to account for 45%, 20% and 35% of the ionic conductivity, respectively. In Table 2, we obtain similar percentages, showing a correct balance in the electrostatic forces among the ions.
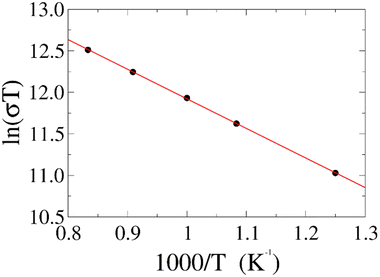
To further test our force field parameters on ion dynamics, we estimate the activation energy (Ea) for ionic conduction. We performed additional MD simulations at varying temperature in the 800–1200 K range, and the resulting conductivities are reported in Fig. 4. Fitting the results with an Arrhenius-like equation provides an Ea and a ln(σ0) of 307 meV and 15.48, respectively. The experimental values for these quantities reported by Zhadan et al. are 320 meV and 15.83 for Ea and ln(σ0).11 The good agreement between simulations and experiments shows how our choice of force field correctly models the energetics behind the ion dynamics.
3.2 Coordination site geometry of Li+ and K+
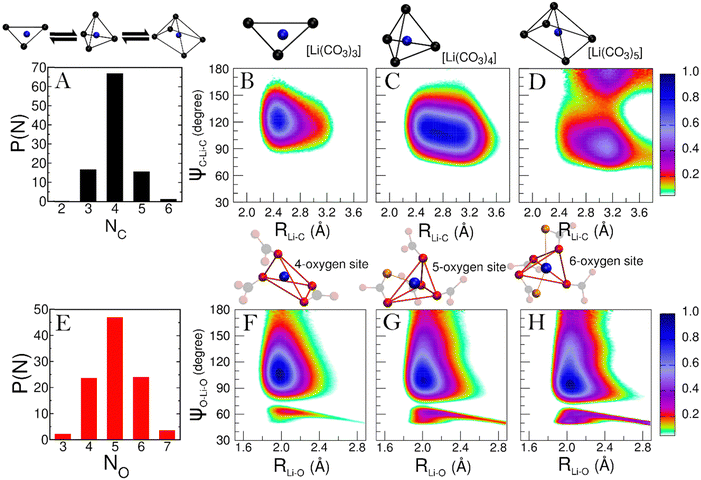
To explore how Li+ and K+ ions are coordinated within the melt, we employ distance-angle CDFs. In the liquid phase, characterizing coordination site geometry becomes challenging due to ion mobility and the presence of multiple coordination species. However, statistical analysis using distance and angular information enables the identification of these complex coordination geometries in solution. This analysis has proven effective in discerning the structure of molecular complexes in solutions and, more generally, in various liquid environments.34,35A comprehensive understanding of the speciation of each cation in the melt is essential. This is achieved by examining the probability distribution of cation–anion coordination numbers P(NC) from the simulation. For Li+, the P(NC) is depicted in panel A of Fig. 5. According to the distribution, the predominant Li+ species in the melt is [Li(CO3)4], although [Li(CO3)3] and [Li(CO3)5] complexes are also consistently found. Hence, we calculate the CDFs between Li–C distance and C–Li–C angles for each of these complexes (see Fig. 5, panels B to D).
In Fig. 5, the CDF for the [Li(CO3)3] complex (panel B) displays a single peak, centered at around 2.50 Å and 120°, typical of a trigonal symmetry. Furthermore, the short Li–C distance at which the peak is located suggests that the CO32− ligands are mainly bidentate. Such coordination closely resembles how Li+ ions are coordinated in the LiKCO3 crystal.14
For the [Li(CO3)4] complex (panel C), a single, much broader feature is observed, peaking in the 2.50–3.00 Å region. This is the convolution of the peaks from bidentate and monodentate ligands. For a 4-fold complex, a single feature at around 110° is typical of a tetrahedral geometry.
Finally, the CDF for [Li(CO3)5] (panel D) reveals two features at around 90° and 180°. While both features peak around a Li–C distance of 3.10 Å, the one at 90° shows larger contributions from bidentate ligands. These features suggest a square pyramidal geometry for the complex.
Regarding the geometry of the actual coordination site, we aim to understand how many oxygen atoms from the CO32− anion coordinate the cation. For Li+ the probability distribution of oxygen coordination numbers (P(NO)) is presented in Fig. 5E. Only three Li–O coordinations appear with significant recurrence (P > 5%), for which we have separately evaluated the CDFs (see Fig. 5, panels F to H). Interestingly, the CDFs for the 4, 5, and 6-fold coordinations are very similar. This suggests that the underlying symmetry of these three coordinations is the same. Each CDF in Fig. 3 presents the fingerprint low-angle feature of bidentate ligands, with growing intensity as the number of coordinating oxygen atoms increases.
The 4-fold coordination CDF in Fig. 5F, shows a single but very broad feature centered at around 100°–110°, which can be associated with a flexible tetrahedral-like geometry. What does this mean for the 5 and 6-fold sites? We can describe these coordination geometries as a tetrahedron formed by 4 of the oxygens, with a fifth (and sixth) oxygen atom at longer Li–O distances distorting the tetrahedral geometry without changing the symmetry of the structure entirely. Overall, the sharp P(NC) and P(NO) distributions we find for Li+ highlight a tight, well-structured, coordination network between this cation and the carbonate anions. Fig. 6 shows local snapshots around a Li+ ion of the MD simulation at 923 K as pictorial examples for the coordinations described in Fig. 5. Tight networks of lithium carbonate complexes are visible around the central Li+ cation.
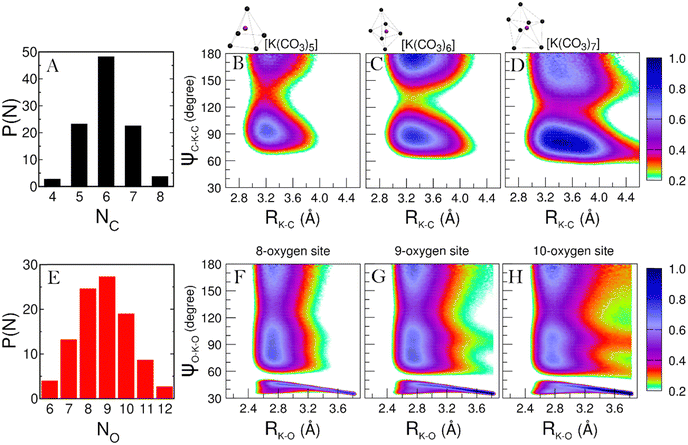
As concerns the K+ ion, the P(NC) describing its speciation is shown in Fig. 7A. The significant K+ species found in the melt are [K(CO3)5], [K(CO3)6] and [K(CO3)7], for which we evaluated the CDFs between K–C distances and C–K–C angles (Fig. 7, panels B to D).
Fig. 7B presents a primary feature around 90° and a secondary peak at 180°, suggesting that the five ligands are arranged in a square pyramidal geometry. The short K–C distance at which both features are found also suggests that the ligands in the [K(CO3)5] complexes are mainly bidentate. Fig. 7C shows similar features, although sharper in angular terms and with more contributions at 180°. This CDF is the typical fingerprint of an octahedral symmetry. In terms of K–C distances, the broader features show an increasing presence of monodentate ligands. Fig. 4D is a bit trickier to assign, representing the [K(CO3)7] complex. With a very intense feature centered in the 70°–90° region and a second feature with lower intensity spreading from 140° to 180°, the geometry can be associated with a distorted pentagonal bipyramid. This structure is somewhat similar to how the K+ ions are coordinated in the LiKCO3 crystal.14 In all the CDFs in Fig. 7, intensities below 0.2 are not reported to remove the background and highlight the features. However, we note that the presence of an intense background indicates a much looser and more disordered coordination of the K+ ions compared to the Li+ ones.
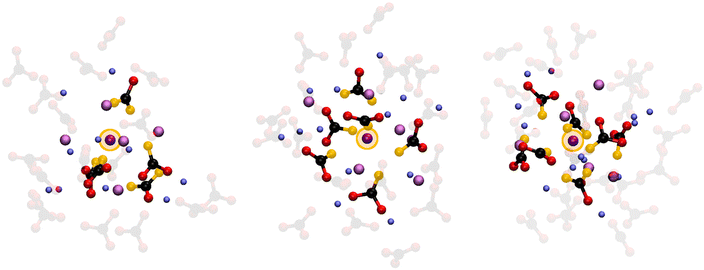
This looser K+ coordination becomes even more evident when examining how the oxygen atoms coordinate this cation. The P(NO) for the K+ ions (see Fig. 7E) is a very broad distribution, with recurring K–O coordinations ranging from 6 to 12. Such a large range of possible coordinations, and the lack of a single dominant one, is another sign of a labile coordination of K+ ions in the melt. Fig. 8 provides a pictorial example of such disordered coordination: it shows local snapshots around a K+ ion of the MD simulation at 923 K as examples for the coordinations analyzed in Fig. 7. Compared to the case of lithium cations (see Fig. 6), the orientation of carbonate anions coordinating the potassium here is much less ordered. The way the anions are oriented appears to be driven more by the Li+ cations sorrounding the complex.
Looking back at the the ionic mobilities shown in Table 2, a looser coordination for K+ ions may seem counterintuitive. Why would K+ be less mobile than Li+ when the latter ion is more tightly coordinated? A possible explanation is that, even if not tightly coordinated by oxygen atoms, K+ ions are still surrounded by a tight network of [Li(CO3)n] complexes. Due to their large size, the K+ ions need to disrupt this network to diffuse. This effectively imposes an additional barrier to K+ diffusion, resulting in Li+ being the more mobile cation. This notion is in line with a recent study by Zhadan et al. showing that conductivity in mixed molten carbonates does not depend only on the ionic radii.11 This peculiarly loose K+ coordination also explains this melt's ability to solvate CO2:21 not being strongly bound by anions, K+ ions are free to capture the solute molecules, embedding them within the structure of the melt.
While many coordination modes are possible for K+, we decided to evaluate the CDFs for the 8-, 9-, and 10-fold ones, as those are the most probable ones in the P(NO). The resulting CDFs are shown in panels F to H of Fig. 7. The similarity in the features among these CDFs suggests a similar symmetry in the coordination, much like what we have seen for the Li+ ions before. The presence of features around 70°, 110°, and 180° usually suggests the presence of a distorted, cubic-like symmetry. However, note that in Panels F to H, we have high-intensity regions spreading throughout the whole 60°–180° angular range. Such an overlap of broad features is often the result of the coexistence of different short-lived geometries, which is another indication of the very disordered coordination of K+ ions in the melt. This observation is consistent with the fact that, even in the LiKCO3 crystal, Kirfel et al. could only define the K–O coordination polyhedra as a “rather irregular shape”.14
3.3 Theoretical prediction of the static structure factor
In liquids, one of the most crucial structural properties that can be experimentally accessed is the static structure factor, S(q). Experimentally, this function can be measured using X-ray or neutron scattering. Theoretically, it can be computed directly from an MD simulation, as described in the Methods section.Fig. 9 displays the S(q) calculated from our MD simulation of the Li1.24K0.76CO3 melt (black line). Since experimental data on the S(q) of the Li1.24K0.76CO3 melt is not available for a direct comparison, we can draw a qualitative comparison with the experimental S(q) of molten Li2CO3 (blue dotted line), extrapolated from ref. 15. Note that we have dampened the signal from ref. 15 by a factor of 5, in order to better compare the features of both curves. The S(q) obtained from the MD simulation exhibits remarkable similarities in the overall shape and the positioning of the features, when compared to the S(q) from ref. 15. Both S(q) patterns reveal a first peak around 2.0 Å−1, with a shoulder just below 3 Å−1, a second feature in the 3–7 Å−1 range, comprised of a shoulder around 4 Å−1 and a peak around 6 Å−1, and a third double feature in the 8–13 Å−1 range.
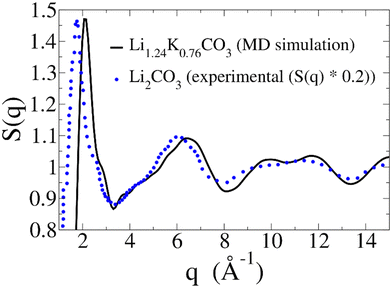 | ||
| Fig. 9 Static structure factor (S(q)) calculated from our MD simulation (black solid line). As a reference, experimental S(q) for Li2CO3 was extrapolated from ref. 15 (blue dotted line). The reported extrapolated S(q) is dampened by a 0.2 factor to better compare features. | ||
For the Li1.24K0.76CO3 melt, all these features are shifted to slightly higher q. While intuitively the presence of larger ions, such as K+, should result in a shift towards lower q, that is not always the case. Indeed, a similar shift can be observed when comparing the S(q) of molten LiCl and KCl salts.39 Another helpful comparison is the S(q) of a K1.1Mg0.45CO3 glass, and its melt,40 for which the main peak falls at a larger q than molten Li2CO3, even though both K+ and Mg2+ are larger ions than Li+. Therefore, we believe the shifts in Fig. 9 are consistent with the presence of K+ ions in the melt.
The large difference in the intensities of the two signals could also be attributed mainly to the presence of K+ ions. Again, a similar decrease in intensity is observed by comparing the S(q) of molten LiCl and KCl salts.39 The magnitude of the S(q) in Fig. 9 aligns with the S(q) of a K1.1Mg0.45CO3 glass and its melt.40
Overall, the S(q) presented in Fig. 9 strongly aligns with the available experimental data, providing further validation for the force field used here. While the Li1.24K0.76CO3 melt has been the subject of many studies due to its role as an electrolyte in MCFCs and MCECs, to the best of our knowledge, we are the first to present its static structure factor at the operating temperature.
Conclusions
In the past decades, the Li1.24K0.76CO3 melt has garnered considerable scientific interests as the preferred electrolyte for MCFCs/MCECs. While many of its transport properties are well-documented across a broad range of conditions, there remains a dearth of structural data at the atomistic scale, mostly because of the experimental challenges posed by high temperatures.In this study, we present an in-depth structural characterization of the Li1.24K0.76CO3 melt using explicit polarization MD, with a force field specifically constructed and optimized for this system. Our findings reveal distinct roles for the two cations in the liquid structure. Li+ ions form strong interactions with CO32− anions, creating a predominantly tetrahedral structural network throughout the melt. Conversely, K+ ions exhibit looser coordination than the smaller cations, assuming more of a “spectator” role in the melt structure. A marked difference in roles between Li+ and K+ was suggested before by Carof et al. when studying CO2 solvation in the Li1.24K0.76CO3 melt.21
Additionally, we provide, for the first time to our knowledge, a theoretical prediction of the static structure factor of the melt at 923 K. Intriguingly, our predicted S(q) for molten Li1.24K0.76CO3 bears striking similarities to that measured for molten Li2CO3 by Ohata et al.15 We must note that the S(q) for Li2CO3 is driven entirely by the anion-anion contribution due to the large difference in scattering factors, similarly to what occurs for LiCl.39 However, while the direct contribution of Li+ ions to the S(q) is minimal in both melts, these cations still exert a significant indirect impact due to their major role in determining the carbonate anions structure and dynamics.
An atomistic understanding of the structure of molten Li1.24K0.76CO3 allows us to explain the conductivity trend in molten alkali carbonates. The higher charge densities of smaller cations typically result in a stronger ability to coordinate anions (or solvent molecules), leading to Li+ having a larger Stokes radius than Na+ or K+. Consequently, the usual diffusivity trend in an electrolyte is Li+ < Na+ < K+.41 A similar trend is also found for molten alkali fluoride mixtures.42 However, for the molten alkali carbonates, the mobility trend is Li2CO3 > Li(2−x)NaxCO3 > Li(2−x)KxCO3, with the ionic conductivity increasing with Li content. In the Li1.24K0.76CO3 melt, the lower mobility of K+ ions stem from the structural network of [Li(CO3)n] complexes. K+ ions need to disrupt this network to diffuse, effectively imposing an additional barrier in the diffusion process.
This work represents an initial step in a larger endeavor to characterize each element of the chemical processes involved in MCEC devices at an atomistic level. The polarizable force field we developed here, capable of producing accurate structure and dynamics, will serve as a stepping stone towards more advanced theoretical studies involving the role of the electrolyte in MCECs.
Conflicts of interest
There are no conflicts to declare.Acknowledgements
This research was funded by the European Union - NextGenerationEU from the Italian Ministry of Environment and Energy Security, POR H2 AdP MEES/ENEA with involvement of CNR and RSE, PNRR - Mission 2, Component 2, Investment 3.5 “Ricerca e sviluppo sull’idrogeno” (CUP: I83C22001170006).References
- R. Quadrelli and S. Peterson, Energy Policy, 2007, 35, 5938–5952 CrossRef.
- M. Aneke and M. Wang, Appl. Energy, 2016, 179, 350–377 Search PubMed.
- M. Beaudin, H. Zareipour, A. Schellenberglabe and W. Rosehart, Energy Sustainable Dev., 2010, 14(4), 302–314 Search PubMed.
- S. Campanari, G. Manzolini and P. Chiesa, Appl. Energy, 2013, 112, 772–783 CrossRef CAS.
- J. P. Perez-Trujillo, F. Elizalde-Blancas, M. Della Pietra and S. J. McPhail, Appl. Energy, 2018, 226, 1037–1055 Search PubMed.
- L. Hu, I. Rexed, G. Lindbergh and C. Lagergren, Int. J. Hydrogen Energy, 2014, 39(23), 12323–12329 Search PubMed.
- L. Hu, G. Lindbergh and C. Lagergren, J. Phys. Chem. C, 2016, 120(25), 13427–13433 CrossRef CAS.
- G. J. Janz, J. Phys. Chem. Ref. Data, 1988, 17(Suppl 2), 159–252 Search PubMed.
- T. Kojima, Y. Miyazaki, K. Nomura and K. Tanimoto, J. Electrochem. Soc., 2007, 154(12), F222 Search PubMed.
- V. Lair, V. Albin, A. Ringuedé and M. Cassir, Int. J. Hydrogen Energy, 2012, 37(24), 19357–19364 Search PubMed.
- A. Zhadan, V. Sarou-kanian, L. Del Campo, L. Cosson, M. Malki and C. Bessada, J. Phys. Chem. C, 2022, 126(40), 17234–17242 Search PubMed.
- A. Zhadan, A. Carof, V. Sarou-Kanian, L. del Campo, L. Cosson, R. Vuilleumier, M. Malki and C. Bessada, J. Phys. Chem. C, 2023, 127(23), 11186–11194 CrossRef CAS.
- Y. Idemoto, J. W. Richardson, N. Koura, S. Kohara and C. K. Loong, J. Phys. Chem. Solids, 1998, 59(3), 363–376 CrossRef CAS.
- A. Kirfel, H. Euler, B. Barbier, E. Hägele and H. Klapper, Z. Kristallogr. - Cryst. Mater., 2000, 215(12), 744–751 CrossRef CAS.
- H. Ohata, K. Takeuchi, K. Ui and N. Koura, ECS Trans., 2007, 6(14), 57 CrossRef CAS.
- J. T. W. Tissen and G. J. M. Janssen, Mol. Phys., 1990, 71(2), 413–426 Search PubMed.
- J. T. W. Tissen, G. J. M. Janssen and P. van der Eerden, Mol. Phys., 1994, 82(1), 101–111 CrossRef CAS.
- M. F. Costa, J. Mol. Liq., 2008, 138(1), 61–68 Search PubMed.
- D. Corradini, F. X. Coudert and R. Vuilleumier, J. Chem. Phys., 2016, 144(10), 104507 CrossRef PubMed.
- A. Mondal, J. M. Young, T. A. Barckholtz, G. Kiss, L. Koziol and A. Z. Panagiotopoulos, J. Chem. Theory Comput., 2020, 16(9), 5736–5746 CrossRef CAS PubMed.
- A. Carof, F. X. Coudert, D. Corradini, D. Lesnicki, E. Desmaele and R. Vuilleumier, Int. J. Hydrogen Energy, 2021, 46(28), 15008–15023 CrossRef CAS.
- D. Corradini, F. X. Coudert and R. Vuilleumier, Nat. Chem., 2016, 8(5), 454–460 CrossRef CAS PubMed.
- A. Massaro, J. Avila, K. Goloviznina, I. Rivalta, C. Gerbaldi, M. Pavone, M. F. C. Gomes and A. A. H. Padua, Phys. Chem. Chem. Phys., 2020, 22(35), 20114–20122 Search PubMed.
- S. W. Rick, S. J. Stuart and B. J. Berne, J. Chem. Phys., 1994, 101(7), 6141–6156 CrossRef CAS.
- J. A. Lemkul, J. Huang, B. Roux and A. D. MacKerell Jr, Chem. Rev., 2016, 116(9), 4983–5013 CrossRef CAS PubMed.
- L. B. Silva and L. C. Freitas, J. Mol. Struct. THEOCHEM, 2007, 806(1), 23–34 CrossRef CAS.
- E. Heid, A. Szabadi and C. Schröder, Phys. Chem. Chem. Phys., 2018, 20(16), 10992–10996 RSC.
- M. M. Reif and P. H. Hünenberger, J. Chem. Phys., 2011, 134(14), 144104 CrossRef PubMed.
- W. M. Haynes, CRC Handbook of Chemistry and Physics, CRC Press, 2014 Search PubMed.
- A. P. Thompson, H. M. Aktulga, R. Berger, D. S. Bolintineanu, W. M. Brown, P. S. Crozier, P. J. in’t Veld, A. Kohlmeyer, S. G. Moore, T. D. Nguyen, R. Shan, M. J. Stevens, J. Tranchida, C. Trott and S. J. Plimpton, Comput. Phys. Commun., 2022, 271, 108171 CrossRef CAS.
- S. Nosé, J. Chem. Phys., 1984, 81(1), 511–519 Search PubMed.
- D. J. Evans and B. L. Holian, J. Chem. Phys., 1985, 83(8), 4069–4074 Search PubMed.
- U. Essmann, L. Perera, M. L. Berkowitz, T. Darden, H. Lee and L. G. Pedersen, J. Chem. Phys., 1995, 103(19), 8577–8593 CrossRef CAS.
- F. Sessa, V. Migliorati, A. Serva, A. Lapi, G. Aquilanti, G. Mancini and P. D’Angelo, Phys. Chem. Chem. Phys., 2018, 20(4), 2662–2675 RSC.
- F. Sessa, P. D’Angelo and V. Migliorati, Chem. Phys. Lett., 2018, 691, 437–443 CrossRef CAS.
- H. J. C. Berendsen, D. van der Spoel and R. G. van Drunen, Comput. Phys. Commun., 1995, 91(1), 43–56 CrossRef CAS.
- D. Van Der Spoel, E. Lindahl, B. Hess, G. Groenhof, A. E. Mark and H. J. C. Berendsen, J. Comput. Chem., 2005, 26(16), 1701–1718 CrossRef CAS PubMed.
- M. J. Abraham, T. Murtola, R. Schulz, S. Páll, J. C. Smith, B. Hess and E. Lindahl, SoftwareX, 2015, 1–2, 19–25 CrossRef.
- S. Sharma, A. S. Ivanov and C. J. Margulis, J. Phys. Chem. B, 2021, 125(24), 6359–6372 Search PubMed.
- M. C. Wilding, B. L. Phillips, M. Wilson, G. Sharma, A. Navrotsky, P. A. Bingham, R. Brooker and J. B. Parise, J. Mater. Res., 2019, 34(19), 3377–3388 CrossRef CAS.
- R. Mills and V. M. M. Lobo, Physical Sciences Data, Elsevier: Amsterdam, Netherlands, 1989 Search PubMed.
- A. Y. Galashev, Nucl. Eng. Technol., 2023, 55(4), 1324–1331 CrossRef.
| This journal is © the Owner Societies 2024 |



![[thin space (1/6-em)]](https://www.rsc.org/images/entities/char_2009.gif)
