
 Open Access Article
 This Open Access Article is licensed under a Creative Commons Attribution-Non Commercial 3.0 Unported Licence
Difference in reaction mechanism between ZnZrOx and InZrOx for CO2 hydrogenation†
Shohei
Tada
 *a,
Yurika
Ogura
b,
Motohiro
Sato
c,
Akihiro
Yoshida
cd,
Tetsuo
Honma
e,
Masahiko
Nishijima
f,
Tatsuya
Joutsuka
*g and
Ryuji
Kikuchi
*a
*a,
Yurika
Ogura
b,
Motohiro
Sato
c,
Akihiro
Yoshida
cd,
Tetsuo
Honma
e,
Masahiko
Nishijima
f,
Tatsuya
Joutsuka
*g and
Ryuji
Kikuchi
*a
aDivision of Applied Chemistry, Graduate School of Engineering, Hokkaido University, Sapporo, Hokkaido 060-8628, Japan. E-mail: shohei.tada.st@eng.hokudai.ac.jp; rkikuchi8@eng.hokudai.ac.jp
bDepartment of Materials Science and Engineering, Ibaraki University, 4-12-1, Nakanarusawa, Hitachi, Ibaraki 316-8511, Japan
cGraduate School of Science and Technology, Hirosaki University, 3 Bunkyo-cho, Hirosaki, Aomori 030-8651, Japan
dInstitute of Regional Innovation, Hirosaki University, 3 Bunkyo-cho, Hirosaki, Aomori 030-8651, Japan
eJapan Synchrotron Radiation Research Institute, Sayo-gun, Hyogo 679-5198, Japan
fFlexible 3D System Integration Laboratory, Osaka University, 8-1 Mihogaoka Ibaraki-Shi, Osaka 567-0047, Japan
gDepartment of Materials Science and Engineering, Ehime University, 3 Bunkyo-cho, Matsuyama, Ehime 790-8577, Japan. E-mail: joutsuka.tatsuya.zk@ehime-u.ac.jp
First published on 22nd April 2024
Abstract
Oxide solid-solution catalysts, such as Zn-doped ZrO2 (ZnZrOx) and In-doped ZrO2 (InZrOx), exhibit distinctive catalytic capabilities for CH3OH synthesis via CO2 hydrogenation. We investigated the active site structures of these catalysts and their associated reaction mechanisms using both experimental and computational approaches. Electron microscopy and X-ray absorption spectroscopy reveal that the primary active sites are isolated cations, such as Zn2+ and In3+, dissolved in tetragonal ZrO2. Notably, for Zn2+, decomposition of the methoxy group, which is an essential intermediate in CH4 synthesis, is partially suppressed because of the relatively high stability of the methoxy group. Conversely, the methyl group strongly adsorbs on In3+, facilitating the conversion of the methoxy species into methyl groups. The decomposition of CH3OH is also suggested to contribute to CH4 synthesis. These results highlight the generation of CH4 as a byproduct of the InZrOx catalyst. Understanding the active site structure and elucidating the reaction mechanism at the atomic level are anticipated to contribute significantly to the future development of oxide solid-solution catalysts.
Introduction
Carbon dioxide hydrogenation is recognized as a key technology for the utilization of CO2. Hydrogen is generated by water electrolysis using renewable energy sources. The produced H2 reacts with CO2 to create raw materials for chemicals and fuels. This process has the potential to contribute substantially to the establishment of a sustainable society, provided the feasibility of obtaining cost-effective H2 is considered. Methanol is often regarded as the building block in C1 chemistry. Essentially, CO2-to-CH3OH hydrogenation (eqn (1)) occurs at approximately 250 °C using Cu-based catalysts, such as Cu/ZnO/Al2O3,1–3 and the resulting CH3OH molecules are subsequently transformed into hydrocarbons and oxygenates at acid sites in solid acid catalysts at 400 °C and higher temperatures.4 When reactors designed for CH3OH synthesis and conversion reactions are connected in series, it is essential to recognize that the former reaction typically determines the overall rate. In the context of CO2 hydrogenation, additional challenges arise owing to the simultaneous formation of CO byproducts through the reverse water gas shift reaction (eqn (2)) and/or CH3OH decomposition (eqn (3)), along with the CH3OH synthesis reaction. Thermodynamically, the dominance of CO byproducts occurs under conditions where the reaction temperature is high.5 Furthermore, depending on the catalyst, CH4 by-production via CO2 methanation (eqn (4)) may also occur. To enhance the efficiency of the entire system, it is necessary to improve the yield of CH3OH.| CO2 + 3H2 → CH3OH + H2O | (1) |
| CO2 + H2 → CO + H2O | (2) |
| CH3OH → CO + 2 H2 | (3) |
| CO2 + 4H2 → CH4 + 2H2O | (4) |
To address this limitation, numerous researchers have explored bifunctional catalysts that incorporate both the CH3OH synthesis and conversion reactions. These catalysts facilitate both reactions simultaneously in a one-pass process: the CH3OH produced is swiftly intercepted by a solid acid catalyst, generating hydrocarbons and oxygenates and effectively suppressing CO byproducts. Notably, integrating CH3OH synthesis catalysts with solid acid catalysts substantially enhances the overall yield of CH3OH-derived products, including CH3OH, hydrocarbons, and oxygenates.6 However, the considerable difference between the reaction temperatures of these two processes poses a challenge. Thus, optimization of the catalyst design involves either increasing the temperature for CH3OH synthesis or reducing the temperature for CH3OH conversion.
Metal-oxide catalysts have emerged as promising agents for CO2-to-CH3OH hydrogenation. Notably, CH3OH synthesis over these catalysts occurs at higher temperatures (above 300 °C) than over traditional Cu-based catalysts. The combination of metal oxides and solid acid catalysts enables the one-pass hydrogenation of CO2 to hydrocarbons and oxygenates. Some reported metal oxide catalysts for high-temperature CH3OH synthesis include Zn-doped ZrO2,7–13 In-doped ZrO2,14,15 In2O3,14–16 and Ga-doped ZrO2,17 among others. For Zn-doped ZrO2, isolated [ZnOa] clusters activate H2 molecules, whereas Zr4+ sites activate CO2, emphasizing the crucial role of the interfacial sites between Zn and Zr in high-temperature CH3OH synthesis.8 This reaction over Zn-doped ZrO2 proceeds via a formate route, where the surface formate species on the Zr4+ sites serve as essential intermediates, eventually hydrogenating to methoxy species on Zr4+ and CH3OH.7,8,12 In the case of In2O3, as initially reported by Ye et al.,18 the reaction over In2O3-based catalysts is expected to follow the formate route.18–21 However, the mechanism of In2O3-based catalysts appears to be slightly different from that of Zn-doped ZrO2 because In2O3-based catalysts produce a small amount of CH4, unlike Zn-doped ZrO2.22 Our study aimed to investigate the differences between the Zn-doped ZrO2- and In2O3-based catalysts. Similar to traditional methanation catalysts, the catalyst may undergo CO2 methanation, in which a surface formate species is hydrogenated to CO and the resulting CO is then methanated.23,24 Alternatively, the surface methoxy species or adsorbed CH3OH molecules may be directly hydrogenated to CH4.25 In this study, we prepared model catalysts of Zn- and In-doped ZrO2 and examined the differences in their reaction mechanisms.
Experimental
Chemicals
Amorphous ZrO2 was supplied by Daiichi Kigenso Kagaku Kogyo (product name: NND). Zn(NO3)2·6H2O, ZnO, In2O3, and quartz sand were purchased from Fujifilm Wako. In(NO3)3·nH2O was purchased from Kanto Chemical.Catalyst preparation
ZnZrOx and InZrOx were prepared using an incipient wetness impregnation method. The amorphous ZrO2 was impregnated with a metal nitrate aqueous solution, dried at 110 °C for 12 h, and calcined at 500 °C for 3 h. The abbreviations and compositions of the prepared catalysts are summarized in Table 1.| Catalyst | Abbreviation | Zn/Zr molar ratioa [−] | In/Zr molar ratioa [−] | SSAb [m2 g−1] | Vmc [10−2 cm3 g−1] |
|---|---|---|---|---|---|
| a Determined by XRF. b Specific surface area determined by N2 adsorption. c Total pore volume determined by N2 adsorption. p/p0 = 0.98. | |||||
| ZnZrOx | ZnZr46 | 0.46 | 40 | 0.14 | |
| InZrOx | InZr09 | 0.087 | 82 | 0.24 | |
| InZr22 | 0.22 | 66 | 0.15 | ||
Characterization
X-ray fluorescence (XRF), X-ray diffraction (XRD), N2 adsorption and desorption, X-ray absorption spectroscopy (XAS), and scanning transmission electron microscopy (STEM) analyses were performed. The detailed procedure is summarized in the ESI.†Performance test
 | (5) |
 | (6) |
 | (7) |
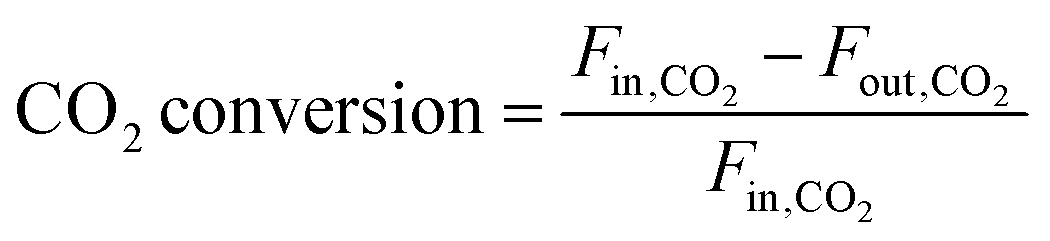
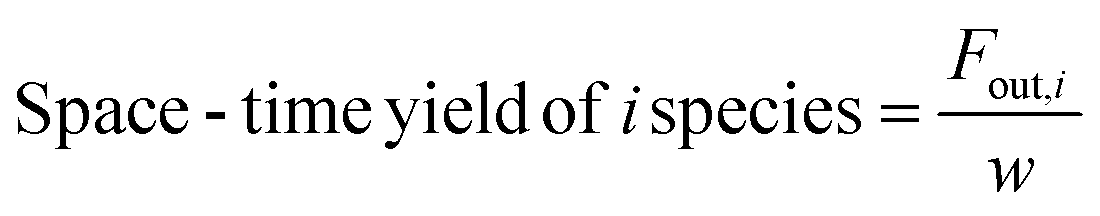
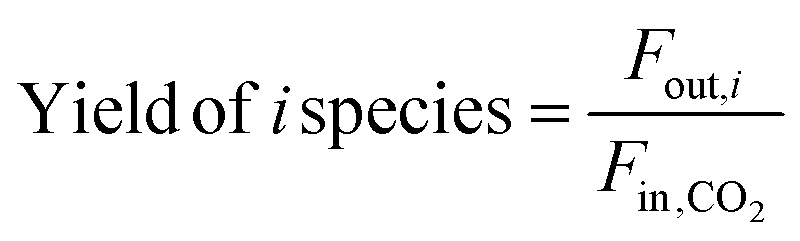
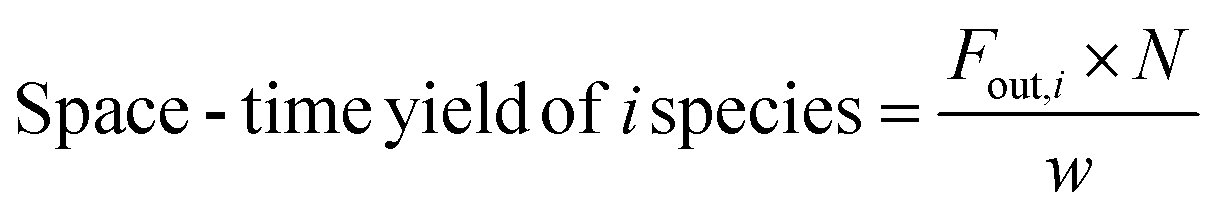
In these equations, Fin,i and Fout,i are the inlet and outlet gas flow rates of species i [mLSTP min−1], respectively, and w is the catalyst weight [g]. The carbon yield was 100% ± 0.5%.
 | (8) |
We calculated the electronic energy under 3D periodic boundary conditions. The optimization of a unit cell of bulk tetragonal (t)-ZrO2 results in cell lengths of a = b = 3.623 Å and c = 5.280 Å using a larger plane-wave cutoff of 600.0 eV, which agrees with previous studies.30,31 The initial configuration of the t-ZrO2 (101) surface was made by cleaving the optimized bulk ZrO2. Along the surface parallel direction, the cell lengths are 12.806 Å × 10.868 Å, and the employed Monkhorst–Pack32k-point mesh is 2 × 2. Along the surface normal direction, the cleaved surface has two ZrO2 layers (72 atoms) to follow the computational model in ref. 31 because ref. 31 (two-layer model) and ref. 7 (three-layer model) yielded comparable energy profiles (the validity of our model is discussed in the ESI†); the width of the vacuum region is 15 Å, and one k-point is used. During the geometry optimization, the coordinates of the atoms, except for the bottom layer, were optimized. An electric dipole correction was considered.33
The InZrOx surface was prepared by removing one O atom and replacing one Zr atom with an In atom from the top layer of a stoichiometric ZrO2 surface. The Zr atoms on the surface are classified into two types, and the replaced Zr atom acts as a strong Lewis site with longer Zr–O bonds.34,35 Fig. S1 (ESI†) shows the positions of In and one oxygen vacancy (VO). For comparison, ZnZrOx was prepared using the same method. The VO was situated next to the In atom, similar to a previous study of the ZnZrOx surface.31 The geometries of the surfaces were optimized, and the adsorbates were placed on the optimized surfaces. The adsorption energies are calculated using the following eqn (9):
| Eads = E(substrate + adsorbate) − E(substrate) − E(adsorbate) | (9) |
The climbing-image nudged elastic band method36 was used to calculate the potential surface and activation energies. Free energy (G) was computed using the normal mode analysis. In the calculations of the translational, rotational, and vibrational enthalpic and entropic contributions, the gas-phase molecules were approximated as ideal gases. The further details are summarized in the ESI.†
Results and discussion
CO2 hydrogenation
We conducted CO2 hydrogenation performance tests using ZnZr46, InZr9, and InZr22. We have previously reported that the Zn/Zr ratio of ZnZrOx does not affect its catalytic performance on CO2-to-CH3OH hydrogenation. Therefore, this time, we adopted ZnZr46 as a representative ZnZrOx.8 Fig. S2 (ESI†) shows plots of CO2 conversion at different reaction temperatures. At 250 °C, CO2 conversion is approximately 1%, irrespective of the catalyst type. For ZnZr46, the CO2 conversion gradually increases from 1% to 4% with increasing reaction temperature. For InZr09 and InZr22, the increase in CO2 conversion is more substantial. Particularly, at 325 °C, the CO2 conversion for InZr09 and InZr22 is more than twice as high as that of ZnZr46, reaching 8%.Fig. 1 illustrates the space-time yields (STY) of CH3OH, CO, and CH4 for ZnZr46, InZr09, and InZr22, with the right axes indicating the yields. In this experiment, the identified carbon-containing products are limited to CH3OH, CO, and CH4; therefore, the total STY corresponds to the CO2 conversion rate, as shown in Fig. S2 (ESI†). For ZnZr46, an increase in the reaction temperature enhances the STY of CH3OH and CO. At 325 °C, the STY of CH3OH and CO reach 0.27 and 0.46 mL min−1 g−1, respectively. CH4 production is not observed. According to our previous study,37 we have confirmed that below 400 °C, Zn-doped ZrO2 produces CH3OH and CO, but not CH4. For comparison, we also assessed the performance of commercially available ZnO particles at 325 °C. However, no CH3OH is observed (Fig. S3a, ESI†). This result indicates that ZnZr46, unlike ZnO, possesses active sites that are effective for CH3OH production.
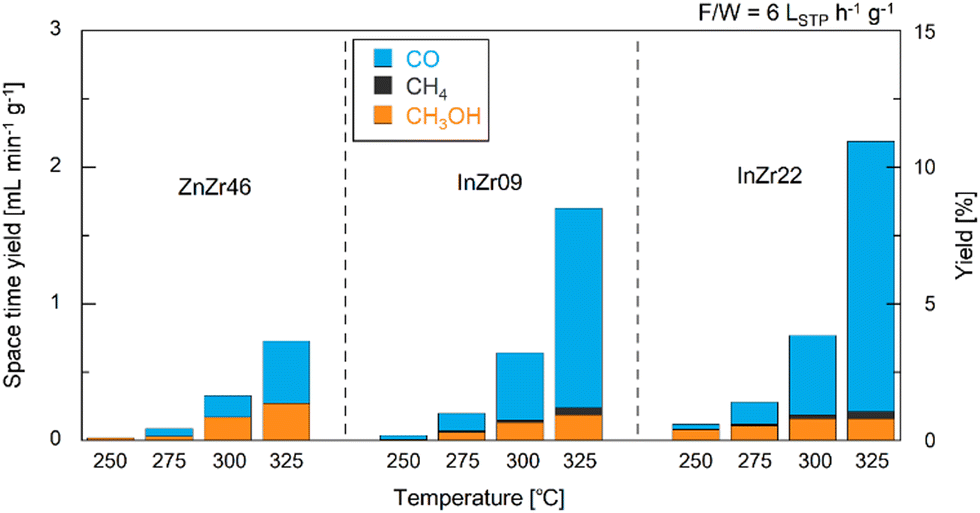 | ||
| Fig. 1 Space–time yields and yields of CH3OH, CO, and CH4 over ZnZr46, InZr09, and InZr22 for CO2 hydrogenation. F/W = 6 LSTP h−1 g−1. Pressure = 1.0 MPa. Gas composition: CO2/H2/N2 = 1/3/1. | ||
In InZr09, the CH3OH STY is slightly lower than that of ZnZr46, whereas the CO STY is higher (Fig. 1). The increased CO2 conversion rate (Fig. S2, ESI†) of InZr09 is attributed to the enhanced generation of CO. Additionally, the production of CH4 is observed. When comparing InZr09 and InZr22, no significant differences are observed in the STY trends. Additionally, the performance of commercially available In2O3 is evaluated at 325 °C (Fig. S3a, ESI†). Despite its lower space velocity, the yield of In2O3 is lower than that of InZr09 and InZr22, suggesting the presence of additional active sites on InZr09 and InZr22 that activate CO2. However, these sites are not present in In2O3. Notably, In2O3 generates CO and CH3OH while producing a negligible amount of CH4. Therefore, In2O3 does not possess active sites that generate CH4, whereas InZr09 and InZr22 possess active sites that facilitate CH4 production.
Structure
In this study, we examined the catalyst structure to reveal the role of active sites. First, we measured the specific surface area (SSA) and total pore volume by N2 adsorption (Table 1). The SSA of ZnZr46, InZr09, and InZr22 is lower than that of amorphous ZrO2 (approximately 200 m2 g−1),35 which is the raw material. This result was attributed to sintering at 500 °C during catalyst preparation. Fig. 2 shows the high-angle annular dark field scanning transmission electron microscopy (HAADF-STEM) images of ZnZr46, InZr09, and InZr22. Regardless of the catalyst type, all elements are distributed uniformly. The size of the observed particles is approximately 15 nm. Consequently, no differences are observed between the morphologies of the two InZrOx catalysts.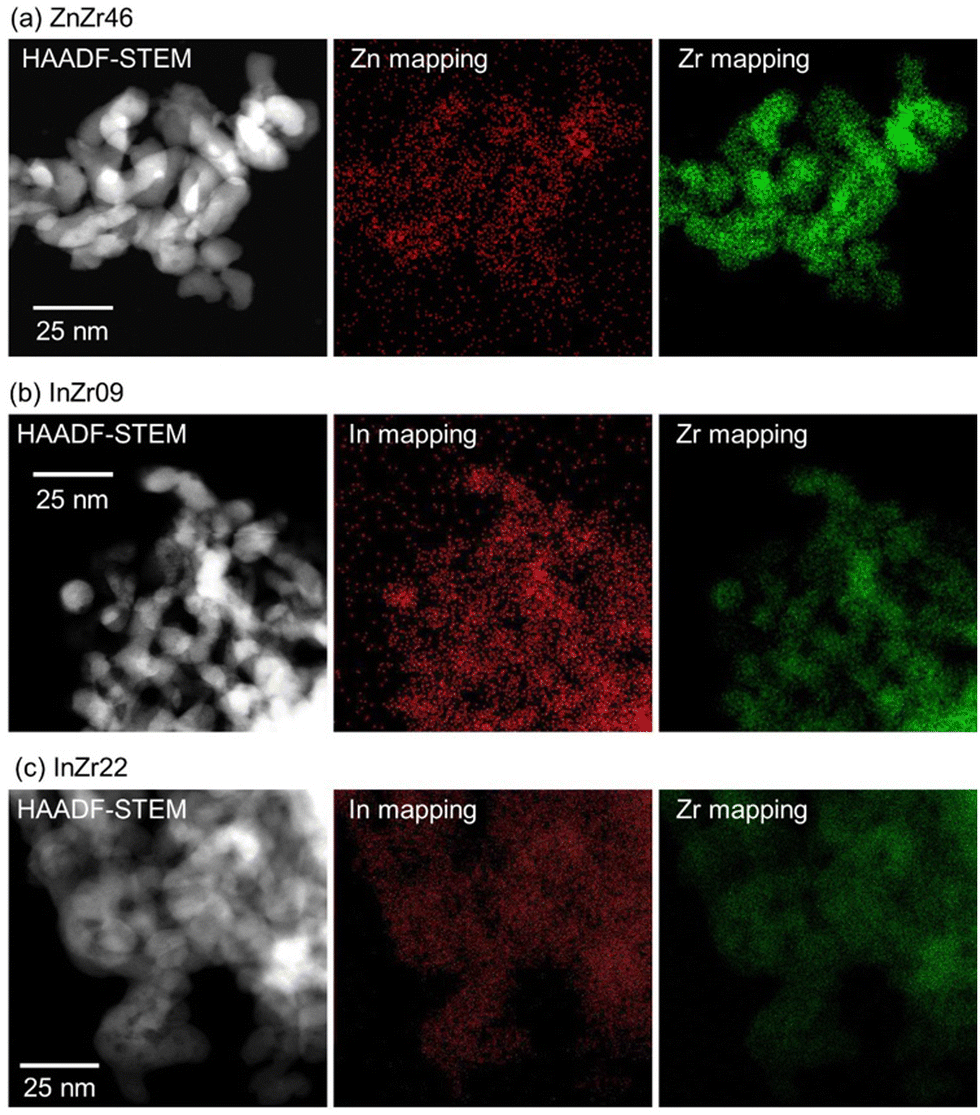 | ||
| Fig. 2 HAADF-STEM images and elemental maps of (a) ZnZr46, (b) InZr09, and (c) InZr22. | ||
The crystal structure was examined using X-ray diffraction (XRD) (Fig. 3 and Fig. S3b, ESI†). For amorphous ZrO2, a broad peak is observed at approximately 31°, indicating a lack of a distinct crystal structure. For ZnZr46, strong peaks are observed at 31°, 35°, and 51°, which correspond to t-ZrO2. In contrast to the conventional anticipation of the formation of monoclinic (m-)ZrO2 from amorphous ZrO2 at 500 °C, calcination of amorphous ZrO2 results in the formation of t-ZrO2. This unexpected outcome signifies the incorporation of Zn2+ species into the ZrO2 lattice, leading to the establishment of a solid solution of ZnZrOx with a tetragonal crystal structure, which agrees with our previously reported observations.8 The doped Zn2+ species coordinated with the O atoms to form isolated [ZnOa] clusters (refer to ESI† and Fig. S4). The additional peaks at 32°, 34°, 36°, 48°, and 56° indicate the presence of ZnO. Therefore, ZnO precipitates when the Zn/Zr molar ratio exceeds 0.19 because the ZnZrOx solid solution reaches its limit when additional Zn species are incorporated.8 Consequently, ZnZr46 contains both the ZnZrOx solid solution and ZnO. Previous observations indicate minimal differences in catalyst performance among ZnZrOx samples with different Zn/Zr molar ratios, implying that the [ZnOa] isolated clusters on the ZnZrOx solid solution serve as crucial active sites, whereas the ZnO particles remain inert for CO2 hydrogenation to methanol.8
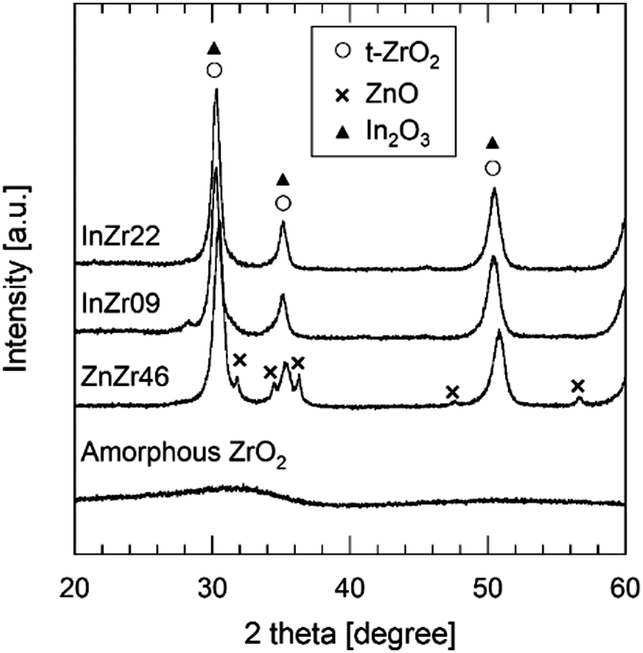 | ||
| Fig. 3 XRD patterns of amorphous ZrO2, ZnZr46, InZr09, and InZr22. | ||
The XRD patterns of InZr09 and InZr22 (Fig. 3) reveal peaks exclusively corresponding to t-ZrO2. The presence of t-ZrO2 instead of m-ZrO2 suggests the incorporation of In species into the ZrO2 lattice, resulting in the formation of an InZrOx solid solution. Notably, the peaks derived from tetragonal ZrO2 and In2O3 coincide, making it difficult to unequivocally confirm the existence of In2O3 through XRD analysis alone. As elucidated earlier, the presence of the In species is conclusively determined using XRF (Table 1).
We conducted K-edge XAS measurements on various InZrOx samples with different In/Zr molar ratios (0.05, 0.10, 0.16, 0.37, and 0.88) to explore the structural characteristics of the In species. Our primary focus was to determine the relationship between the In/Zr ratio and coordination structure of In. Fig. 4a shows the In K-edge X-ray absorption near edge structure (XANES) spectra, with In foil and In2O3 included as the reference materials. The InZrOx spectra closely resemble those of In2O3, characterized by a distinctive white line at 27![[thin space (1/6-em)]](https://www.rsc.org/images/entities/char_2009.gif) 952 eV. A detailed examination of the InZrOx XANES spectrum reveals several isosbestic points (Fig. 4a), indicating the presence of two distinct In species in InZrOx. The relative proportions of the In species also change with variations in the In:Zr ratio. In Fig. 4b, the In K-edge radial structure functions (RSFs) of In2O3 and InZrOx are shown, and Table 2 summarizes the fitting parameters. The RSF of In2O3 exhibits three peaks, representing the nearest-neighbor In–O distance (at 1.7 Å) and the nearest-neighbor and second-nearest In–In distances (at 3.1 and 3.7 Å). For InZrOx at In/Zr ratios of 0.88 and 0.37, the RSFs exhibit these characteristic peaks. The In–O peaks shift to the left as the ratio decreases from 0.37 to 0.05, indicating a gradual change in the In coordination structure. Simultaneously, the In–In peaks at 3.1 and 3.7 Å gradually disappear, and a new peak emerges at 3.3 Å. The peak at 3.3 Å corresponds to the nearest-neighbor In–Zr distance, determined from the optimized InZrOx structure (Fig. S1, ESI†). In the sample with an In/Zr ratio of 0.16, the peaks derived from In–In and In–Zr coexist, making it difficult to analyze the coordination structure of the In species by fitting. Consequently, when the In/Zr ratio is low, InZrOx predominantly contains In3+ species doped into t-ZrO2. Conversely, when the In/Zr ratio is high, InZrOx primarily contains In2O3. These results suggest that the solid solubility limit of the In species is approximately 0.10.
952 eV. A detailed examination of the InZrOx XANES spectrum reveals several isosbestic points (Fig. 4a), indicating the presence of two distinct In species in InZrOx. The relative proportions of the In species also change with variations in the In:Zr ratio. In Fig. 4b, the In K-edge radial structure functions (RSFs) of In2O3 and InZrOx are shown, and Table 2 summarizes the fitting parameters. The RSF of In2O3 exhibits three peaks, representing the nearest-neighbor In–O distance (at 1.7 Å) and the nearest-neighbor and second-nearest In–In distances (at 3.1 and 3.7 Å). For InZrOx at In/Zr ratios of 0.88 and 0.37, the RSFs exhibit these characteristic peaks. The In–O peaks shift to the left as the ratio decreases from 0.37 to 0.05, indicating a gradual change in the In coordination structure. Simultaneously, the In–In peaks at 3.1 and 3.7 Å gradually disappear, and a new peak emerges at 3.3 Å. The peak at 3.3 Å corresponds to the nearest-neighbor In–Zr distance, determined from the optimized InZrOx structure (Fig. S1, ESI†). In the sample with an In/Zr ratio of 0.16, the peaks derived from In–In and In–Zr coexist, making it difficult to analyze the coordination structure of the In species by fitting. Consequently, when the In/Zr ratio is low, InZrOx predominantly contains In3+ species doped into t-ZrO2. Conversely, when the In/Zr ratio is high, InZrOx primarily contains In2O3. These results suggest that the solid solubility limit of the In species is approximately 0.10.
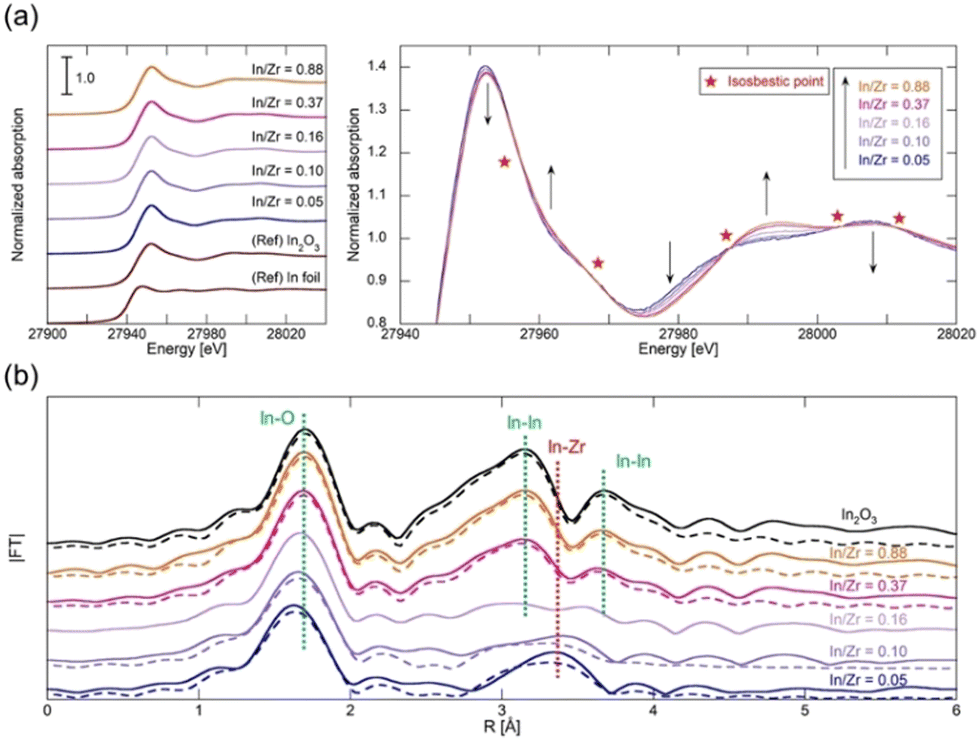 | ||
| Fig. 4 (a) K-edge XANES spectra of In foil, In2O3, and InZrOx with In/Zr molar ratios of 0.05, 0.10, 0.16, 0.37, and 0.88. (b) Fourier transforms of k3-weighted extended X-ray absorption fine structure (EXAFS) oscillations measured at room temperature near the In K-edge of InZrOx. k range: 3–12 Å−1. R range: 1–4 Å. Solid line: experimental; dotted line: EXAFS model. | ||
| Sample | Path | CN | σ 2 [Å] | ΔE0 [eV] | R [Å] | R factor |
|---|---|---|---|---|---|---|
| Notation: CN, coorination number; σ, Debye–Waller factor; ΔE0, increase in the threshold energy; R, distance. Confidence intervals = 68%. | ||||||
| In2O3 | In–O | 5.5 ± 0.3 | 0.007 ± 0.001 | 8.0 ± 0.7 | 2.16 ± 0.01 | 0.002 |
| In–In | 5.1 ± 0.8 | 0.005 ± 0.001 | 7.0 ± 0.9 | 3.35 ± 0.01 | ||
| In–In | 3.8 ± 1.2 | 0.005 ± 0.002 | 7.2 ± 1.9 | 3.84 ± 0.01 | ||
| InZrOx | ||||||
| In/Zr = 0.88 | In–O | 6.2 ± 0.5 | 0.007 ± 0.001 | 7.2 ± 0.9 | 2.16 ± 0.01 | 0.003 |
| In–In | 5.2 ± 1.2 | 0.006 ± 0.001 | 5.8 ± 1.4 | 3.36 ± 0.01 | ||
| In–In | 3.6 ± 1.8 | 0.006 ± 0.003 | 6.2 ± 3.1 | 3.83 ± 0.02 | ||
| In/Zr = 0.37 | In–O | 6.1 ± 0.4 | 0.007 ± 0.001 | 6.8 ± 0.7 | 2.16 ± 0.01 | 0.003 |
| In–In | 4.3 ± 0.9 | 0.006 ± 0.001 | 5.0 ± 1.3 | 3.36 ± 0.01 | ||
| In–In | 2.7 ± 1.3 | 0.005 ± 0.003 | 4.9 ± 3.0 | 3.83 ± 0.02 | ||
| In/Zr = 0.10 | In–O | 5.0 ± 0.7 | 0.007 ± 0.001 | 7.5 ± 1.6 | 2.14 ± 0.01 | 0.034 |
| In–Zr | 8.1 ± 3.8 | 0.017 ± 0.004 | 5.2 ± 2.8 | 3.53 ± 0.02 | ||
| In/Zr = 0.05 | In–O | 4.5 ± 0.5 | 0.007 ± 0.001 | 6.2 ± 1.4 | 2.12 ± 0.01 | 0.022 |
| In–Zr | 6.7 ± 2.1 | 0.013 ± 0.002 | 6.4 ± 2.1 | 3.57 ± 0.02 | ||
As detailed in the CO2 hydrogenation section, InZr09 and InZr22 exhibit distinct active sites that are absent in In2O3. The catalytic performances of InZr09 and InZr22 are notably similar, as observed for the STYs of CH3OH, CO, and CH4 (Fig. 1). XAS measurements (Table 2) further reveal that when the In/Zr ratio is below 0.10, the prevalent In species in InZrOx are primarily In species doped with t-ZrO2. Collectively, these findings strongly suggest that the catalytic performances of InZr09 and InZr22 are governed by the presence of doped In species.
Reaction mechanism analysis by DFT
As described earlier, it is evident that the sites responsible for producing CH3OH and CH4 are Zn and In species incorporated into ZrO2. Through DFT calculations, we aimed to delve into reactions at the atomic level, which are challenging to observe experimentally.Fig. 5 shows the free energy surfaces for CH4 and CH3OH formation on the InZrOx surface. Fig. 6 and 7 show the structures of the reaction intermediates in the formate, CO, and CH4 pathways, respectively. Fig. S5 (ESI†) shows the structures of transition states (TSs) in Fig. 5.
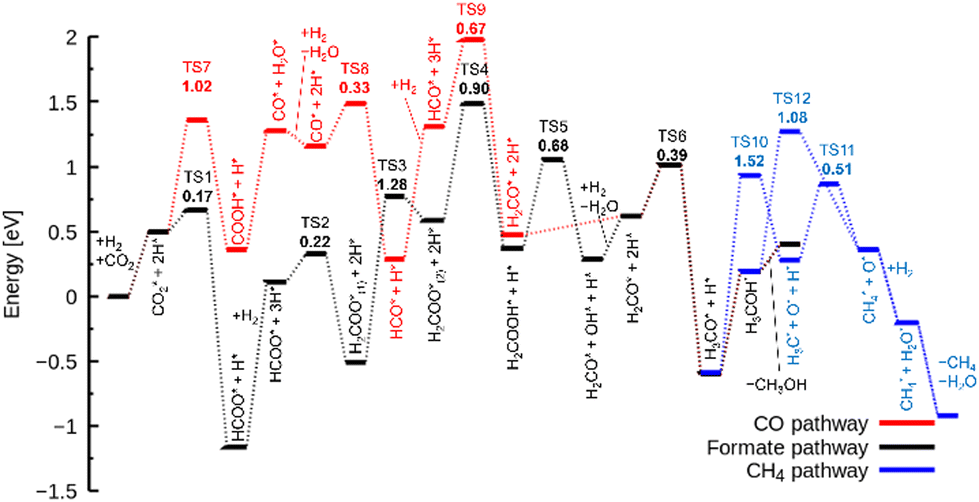 | ||
| Fig. 5 Free energy surfaces of the InZrOx surface for formate (black), CO (red), and CH4 (blue) pathways. The values in the bold face and * indicate the activation free energies of the TSs and adsorbed species, respectively. | ||
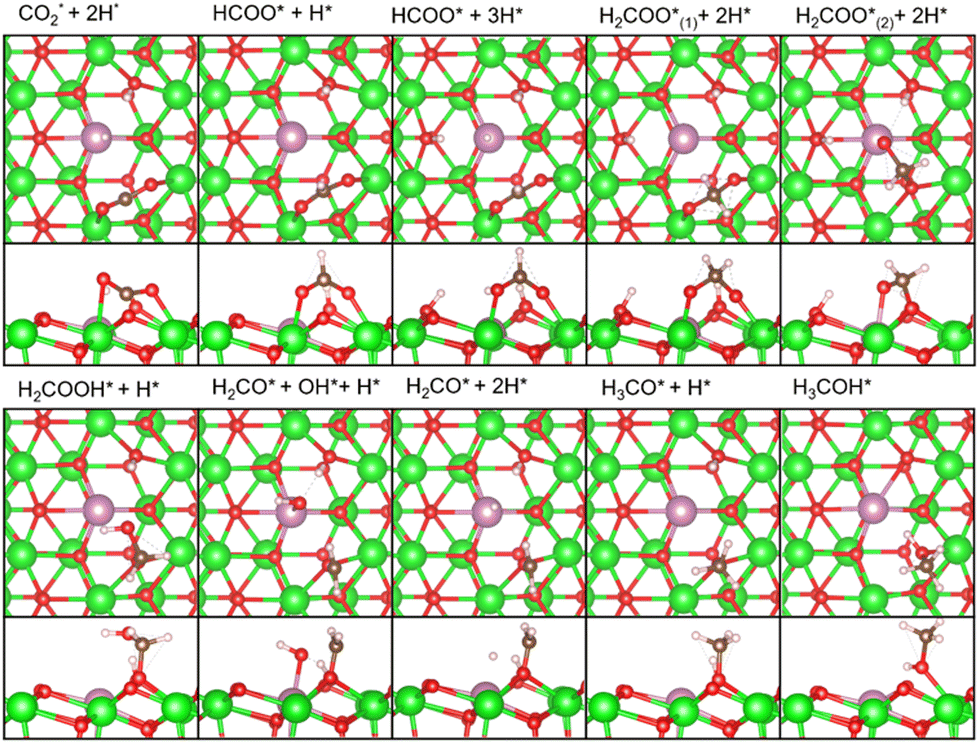 | ||
| Fig. 6 Top and side views of the reaction intermediates in the formate pathway of Fig. 5. Color code: green: Zr, red: O, purple: In, white: H, and brown: C. The figures are made by VESTA.39 | ||
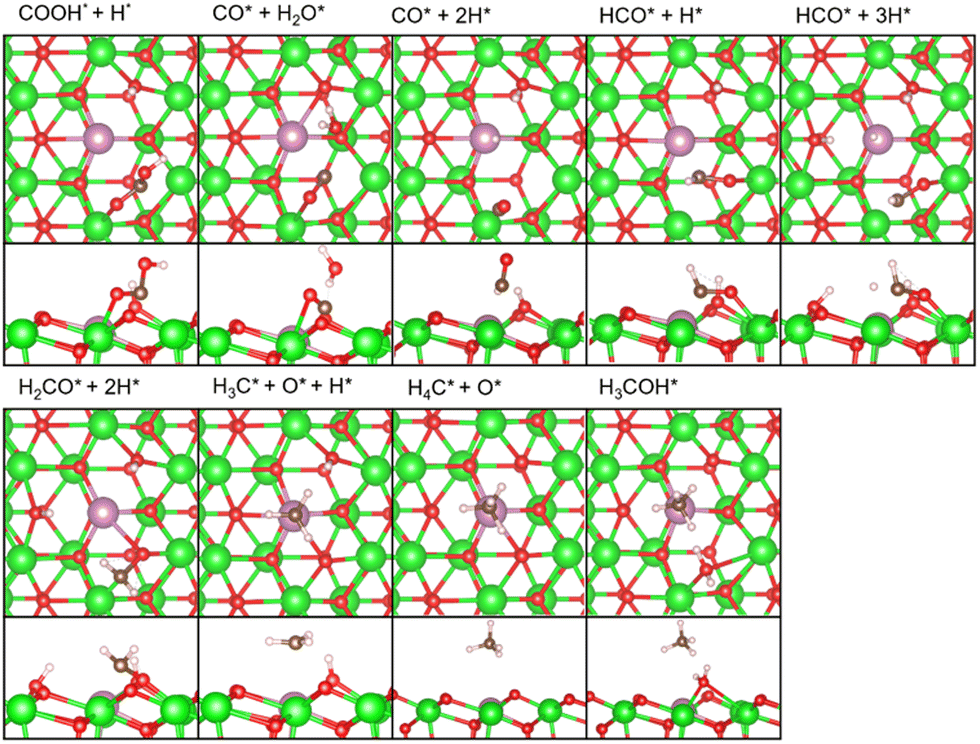 | ||
| Fig. 7 Top and side views of the reaction intermediates in the CO and CH4 pathways in Fig. 5. Color code: green: Zr, red: O, purple: In, white: H, and brown: C. The figures are made by VESTA.39 | ||
In the formate pathway, CO2 adsorbs onto the surface Zr atoms as a bidentate carbonate species, whereas H2 dissociates and adsorbs onto the surface Zr and O atoms. The adsorbed CO2 is protonated by the neighboring H atom to form HCOO (formate). The formate group receives a H atom to form H2COO. One O atom in H2COO changes its bond with the surface Zr atom to an In atom with the largest barrier (ΔG‡) of 1.28 eV in the formate pathway. The O atom on the In atom in H2COO accepts the H atom to form H2COOH, which then decomposes into H2CO (formaldehyde), OH, and H species. Protonation of formaldehyde yields a methoxy group (H3CO), which is converted into CH3OH by further protonation.
In the CO pathway, the H atom on the In atom hydrogenates adsorbed CO2 to yield COOH (carboxyl group). This carboxyl group decomposes into CO and water. The CO molecule successively changes to HCO, H2CO (formaldehyde) and finally, to H3CO to join the formate pathway. In Fig. 1, CO production increases at higher temperatures partly because CO2 hydrogenation to CH3OH is an exothermic reaction while the reverse water gas shift reaction is an endothermic reaction, making the chemical equilibrium shift to the right side in CO2 + H2 ⇄ CO + H2O and enhancing CO production at higher reaction temperatures. However, it is noted that we showed in Fig. S6 (ESI†) by changing the space velocity that CH3OH can be converted to CO, contributing to CO production. Fig. 5 shows that the decomposition of COOH to CO and H2O, which undergoes also at zirconia surfaces,38 is endothermic by 0.92 eV, and it is found to be barrierless. This suggests that after CO is formed from the decomposition of COOH, the backward reaction can proceed without a barrier, allowing CO to readily transition back to a stable COOH. Additionally, the adsorption energy in Table S1 (ESI†) is the highest for a CO molecule among the reaction intermediates. This indicates that a CO molecule can desorb from the catalyst surface easier than the other intermediates,7 and the CO pathway does not proceed further.
In the CH4 pathway, Fig. 5 suggests two possible routes: decompositions of methoxy group and CH3OH. In the case of methoxy group decomposition, the methyl group in the methoxy group is transferred to the surface of the In atom for stable adsorption, with a C–In distance of 2.69 Å. However, this adsorption is unstable on the Zn atom of the ZnZrOx surface, and the methyl group changes to a methoxy group (Fig. S7, ESI†) because the methyl group forms a bond with the O atom next to Zn. The barrier of the methyl group transfer is 1.52 eV on the InZrOx surface, which is higher than those in the other steps of this study, such as 1.28 eV in the formate pathway. It is also higher than those in CH3OH formation from CO2 on ZnZrOx surfaces.7,31 This suggests that CH4 production is unfavored compared to CH3OH. This result is consistent with the lower experimental yield of CH4 than that of CH3OH. Therefore, methyl group transfer is the rate-determining step in CH4 formation. This result supports the experimental evidence of CH4 formation on the InZrOx surface, indicating that stable adsorption of a methyl group on the InZrOx surface is important for CH4 production.
The methyl group adsorbed on the In atom accepts a proton from the neighboring OH group to form CH4. The remaining O atom adsorbed at the VO site combines with the H2 molecule to form H2O. The H2O and CH4 molecules finally desorb from the surface into the gas phase, completing CH4 formation. In the last step, the InZrOx surface regains the surface VO sites.
In the case of CH3OH decomposition (CH3OH → CH4 + O*) without the transfer of the methyl group on the InZrOx surface, the activation free energy is 1.08 eV that is lower than that in the case of methoxy group decomposition, yet CH3OH desorbs with the free energy difference of only 0.21 eV. This suggests that CH3OH decomposition can be competitive but is unfavored over CH3OH desorption. It is noted that the decomposition of a CH3OH molecule on the ZnZrOx surface requires a higher barrier (2.60 eV) as illustrated in Fig. S8 (ESI†), indicating that CH4 production on the ZnZrOx surface is unfavored.
Here, we discuss the density of states (DOS) shown in Fig. 8 to understand the adsorption of methyl groups on the InZrOx surface. The mid-gap (also called the impurity) band for the InZrOx surface in Fig. 8a lies between the valence band maximum of ZrO2 and the conduction band minimum. The mid-gap band primarily arises from the In atom, and the s and 5pz orbitals mainly contribute to the DOS of the In atom, as shown in Fig. 8d (the z coordinate is along the surface-normal direction). In contrast, the DOS of the ZnZrOx surface in Fig. 8b has no midgap band. The d band of a Zn atom in Fig. 8e dominates the DOS of the Zn atom between −10 and 0 eV.
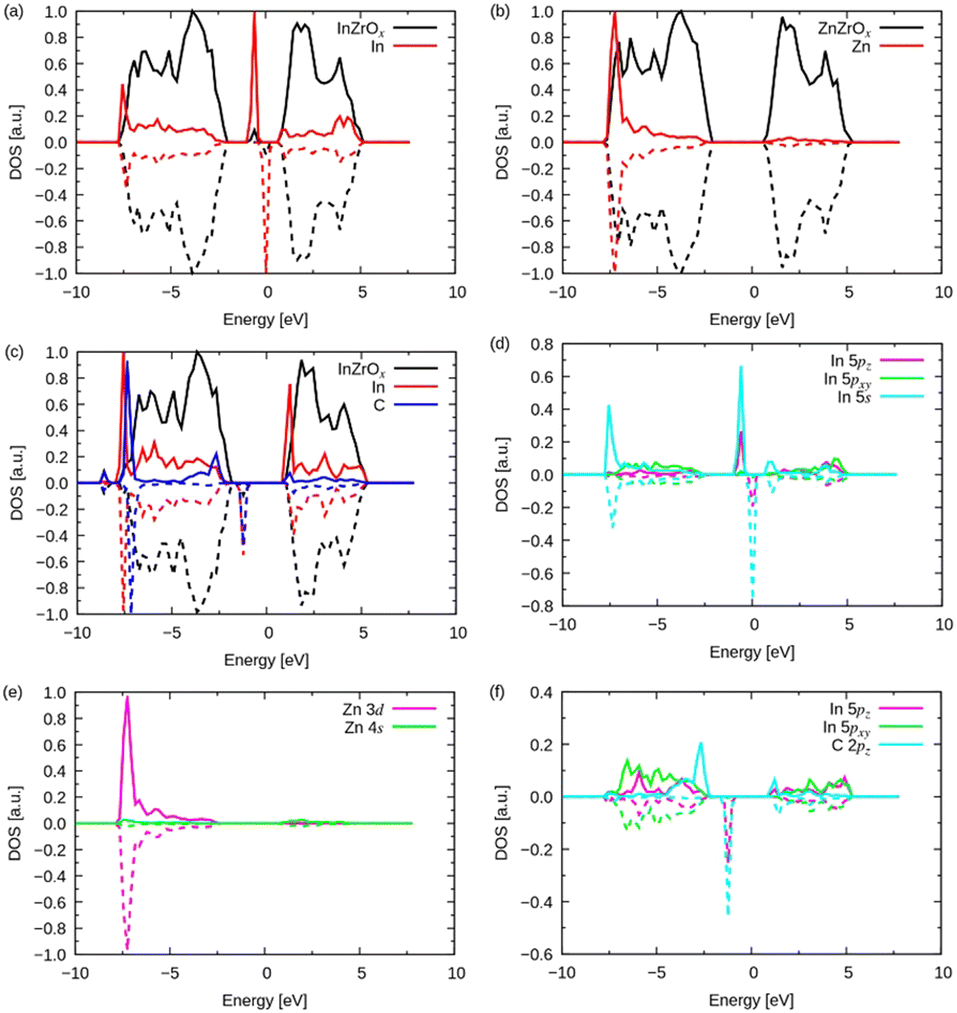 | ||
| Fig. 8 Density of states (DOS) of neat (a) InZrOx, (b) ZnZrOx surfaces, and (c) methyl groups on the InZrOx surface. The solid and dashed lines denote the up and down spins, respectively. Each DOS is normalized for clarity. (d)–(f) Projected DOSs corresponding to panels (a)–(c), where the z coordinate is along the surface normal direction. | ||
The projected DOSs of In and C atoms on the InZrOx surface with an adsorbed methyl group in Fig. 8c also shows a mid-gap state. Fig. 8f shows the midgap state consisting of the 5pz orbital of the In atom and 2pz orbital of the C atom. Therefore, the 5pz orbital of the In atom and the 2pz orbital of the C atom overlapped with the adsorbed methyl group on the InZrOx surface, and the distinct band structures of the doped metals determined the adsorption strength of the methyl group on the InZrOx and ZnZrOx surfaces. A methyl group was readily adsorbed on the In atom on the InZrOx surface owing to the superior overlap of orbitals; however, the adsorption of a methyl group on the Zn atom on the ZnZrOx surface is unstable, as shown in Fig. S7 (ESI†). Therefore, In-doping of ZrO2 enhances CH4 formation.
CH3OH conversion
We conducted a test of the CH3OH conversion reaction to directly observe how each catalyst activates the CH3OH molecules (Fig. 9). Taking into consideration the reaction condition of CO2 hydrogenation, unreacted H2 is assumed to coexist with CH3OH during CO2 hydrogenation. Hence, for the CH3OH conversion test, CH3OH and H2 were supplied simultaneously.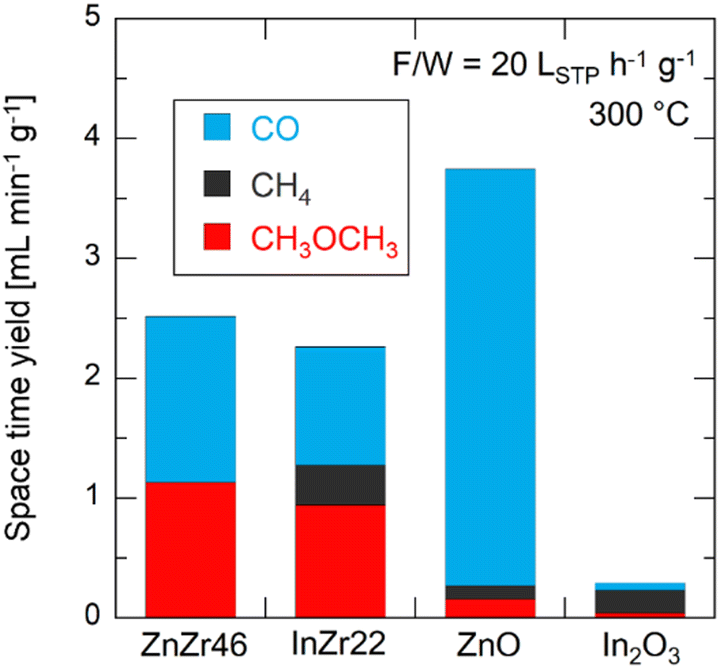 | ||
| Fig. 9 Space time yields of CO, CH4, and CH3OCH3 over ZnZr46, InZr22, ZnO, and In2O3 for the methanol conversion reaction. F/W = 20 LSTP h−1 g−1. Temperature = 300 °C. Pressure = 0.1 MPa. Gas composition: CH3OH/H2/N2 = 13/22/65. | ||
ZnZr46 generates CO and CH3OCH3 from CH3OH. The former is attributed to the product of the CH3OH decomposition reaction, which represents the reverse of the CH3OH synthesis via CO hydrogenation (eqn (3)). In contrast, the latter is related to CH3OH dehydration (eqn (10)) at the Brønsted acid site of the catalyst.
| 2CH3OH → CH3OCH3 + H2O | (10) |
Apart from ZrO2, which possesses acid sites, Brønsted acid sites are formed by doping metal into ZrO2.40 Moreover, the CH4 production is minimal, with a selectivity below 1%. Even when using commercially available ZnO, the CO selectivity (93%) is much higher than that for CH4 (3%) and CH3OCH3 (4%). For InZr22, along with CO and CH3OCH3, a significant amount of CH4 is generated (selectivity = 15%). Notably, the results for In2O3 revealed a CH4 selectivity of 65%, although the yield is extremely small compared to that of the other catalysts. These results align with the computational chemistry predictions, indicating that CH3OH is directly converted to CH4 on In3+. As shown in Fig. S3 (ESI†), during the CO2 hydrogenation reaction with In2O3, CH3OH is observed, but CH4 remains undetected. Therefore, the results in Fig. S3 (ESI†) and Fig. 9 appear to be contradictory. We expect that the absence of CH4 in the CO2 hydrogenation reaction with In2O3 is linked to the inhibition of the In-methoxy bond formation owing to the presence of CO2 in the reaction gas. However, we were unable to clarify these differences beyond the reaction tests. We plan to explore and elucidate this distinction in future studies.
Conclusions
This study focused on oxide solid-solutions of ZnZrOx and InZrOx for CO2-to-CH3OH hydrogenation and clarified the differences in their reaction mechanisms. For both catalysts, the metal cations (In3+ and Zn2+) incorporated into the t-ZrO2 lattice serve as crucial active sites for CH3OH synthesis. In the case of the ZnZrOx catalyst, CO is produced as a byproduct along with CH3OH. Conversely, the InZrOx catalyst produces a small amount of CH4, in addition to CH3OH and CO. Remarkably, CH4 is produced by passing CH3OH and H2 through the InZrOx catalyst. We performed a DFT study on CH4 formation on InZrOx by calculating the free energy surface and density of states (DOS). Our calculations suggest a possible reaction pathway, highlighting the methyl group transfer with a competitive activation barrier, which is consistent with the experimental findings. The CH3OH decomposition was also suggested to contribute to the CH4 production. A methyl group can only be adsorbed on the InZrOx catalyst due to the better overlap of DOS between the adsorbate and substrate than on the ZnZrOx catalyst.Author contributions
This manuscript was written through the contributions of all authors. All authors have given approval to the final version of the manuscript.Conflicts of interest
There are no conflicts of interest to declare.Acknowledgements
This study was financially supported by the Feasibility Study Program on Energy and New Environmental Technology (No. 22100386-0) of the New Energy and Industrial Technology Development Organization of Japan, the JSPS KAKENHI (Grant Number 24K01240), and the Environment Research and Technology Development Fund (JPMEERF20243RA3) of the Environmental Restoration and Conservation Agency provided by Ministry of the Environment of Japan. We thank the Advanced Research Infrastructure for Materials and Nanotechnology of Japan (ARIM) program (Grant No. JPMXP1222OS0026) from the Ministry of Education, Culture, Sports, Science, and Technology (MEXT), Japan, at the Research Center for Ultra-High-Voltage Electron Microscopy (Nanotechnology Open Facilities), Osaka University. Synchrotron radiation experiments were performed at BL14B2 of SPring-8 with the approval of the Japan Synchrotron Radiation Research Institute (JASRI, Proposal no. 2023B1576). We used supercomputers from the Institute for Solid State Physics, University of Tokyo, ACCMS, Kyoto University, and the Research Institute for Information Technology, Kyushu University.References
- M. Behrens, F. Studt, I. Kasatkin, S. Kuhl, M. Hävecker, F. Abild-Pedersen, S. Zander, F. Girgsdies, P. Kurr, B. L. Kniep, M. Tovar, R. W. Fischer, J. K. Nørskov and R. Schlögl, Science, 2012, 336, 893–897 CrossRef CAS PubMed.
- S. Kuld, M. Thorhauge, H. Falsig, C. F. Elkjaer, S. Helveg, I. Chorkendorff and J. Sehested, Science, 2016, 352, 969–974 CrossRef CAS PubMed.
- S. Kattel, P. J. Ramirez, J. G. Chen, J. A. Rodriguez and P. Liu, Science, 2017, 355, 1296–1299 CrossRef CAS PubMed.
- M. Stöcker, Microporous Mesoporous Mater., 1999, 29, 3–48 CrossRef.
- A. Alvarez, A. Bansode, A. Urakawa, A. V. Bavykina, T. A. Wezendonk, M. Makkee, J. Gascon and F. Kapteijn, Chem. Rev., 2017, 117, 9804–9838 CrossRef CAS PubMed.
- S. Tada, H. Kinoshita, N. Ochiai, A. Chokkalingam, P. Hu, N. Yamauchi, Y. Kobayashi and K. Iyoki, Int. J. Hydrogen Energy, 2021, 46, 36721–36730 CrossRef CAS.
- J. J. Wang, G. N. Li, Z. L. Li, C. Z. Tang, Z. C. Feng, H. Y. An, H. L. Liu, T. F. Liu and C. Li, Sci. Adv., 2017, 3, e170129 Search PubMed.
- S. Tada, N. Ochiai, H. Kinoshita, M. Yoshida, N. Shimada, T. Joutsuka, M. Nishijima, T. Honma, N. Yamauchi, Y. Kobayashi and K. Iyoki, ACS Catal., 2022, 12, 7748–7759 CrossRef CAS.
- Z. Feng, C. Tang, P. Zhang, K. Li, G. Li, J. Wang, Z. Feng and C. Li, J. Am. Chem. Soc., 2023, 145, 12663–12672 CrossRef CAS PubMed.
- K. Y. H. Lee, U. Anjum, C. Mondelli, Q. He, S. Furukawa, J. Perez-Ramirez, S. M. Kozlov, N. Yan and T. P. Araujo, Appl. Catal., B, 2022, 304, 120994 CrossRef CAS.
- K. Fujiwara, T. Akutsu, M. Nishijima and S. Tada, Top. Catal., 2023, 66, 1492–1502 CrossRef CAS.
- T. P. Araujo, J. Morales-Vidal, T. Zou, M. Agrachev, S. Verstraeten, P. O. Willi, R. N. Grass, G. Jeschke, S. Mitchell, N. Lopez and J. Perez-Ramirez, Adv. Energy Mater., 2023, 13, 2204122 CrossRef.
- C. Temvuttirojn, Y. Poo-arporn, N. Chanlek, C. K. Cheng, C. C. Chong, J. Limtrakul and T. Witoon, Ind. Eng. Chem. Res., 2020, 59, 5525–5535 CrossRef CAS.
- T. P. Araujo, J. Morales-Vidal, G. Giannakakis, C. Mondelli, H. WEliasson, R. Erni, J. Stewart, S. Mitchell, N. Lopez and J. Perez-Ramirez, Angew. Chem., Int. Ed., 2023, 62, e202306563 CrossRef CAS PubMed.
- J. Wang, G. Zhang, J. Zhu, X. Zhang, F. Ding, A. Zhang, X. Guo and C. Song, ACS Catal., 2021, 11, 1406–1423 CrossRef CAS.
- M. S. Frei, C. Mondelli, R. Garcia-Muelas, K. S. Kley, B. Puertolas, N. Lopez, O. V. Safanova, J. A. Stewart, D. C. Ferre and J. Perez-Ramirez, Nat. Commun., 2019, 10, 3377 CrossRef PubMed.
- J. J. Wang, C. Z. Tang, G. N. Li, Z. Han, Z. L. Li, H. Liu, F. Cheng and C. Li, ACS Catal., 2019, 9, 10253–10259 CrossRef CAS.
- J. Ye, C. Liu, D. Mei and Q. Ge, ACS Catal., 2013, 3, 1296–1306 CrossRef CAS.
- O. Martin, A. J. Martin, C. Mondelli, S. Mitchell, T. F. Segawa, R. Hauert, C. Drouilly, D. Curulla-Ferre and J. Perez-Ramirez, Angew. Chem., Int. Ed., 2016, 55, 6261–6265 CrossRef CAS PubMed.
- M. S. Frei, C. Mondelli, R. García-Muelas, K. S. Kley, B. Puértolas, N. López, O. V. Safonova, J. A. Stewart, D. C. Ferré and J. Pérez-Ramírez, Nat. Commun., 2019, 10, 3377 CrossRef PubMed.
- A. Posada-Borbón and H. Grönbeck, ACS Catal., 2021, 11, 9996–10006 CrossRef.
- S. Tada and K. Iyoki, Chem. Lett., 2021, 50, 724–726 CrossRef CAS.
- S. Tada and R. Kikuchi, Catal. Sci. Technol., 2015, 5, 3061–3070 RSC.
- M. Marwood, R. Doepper and A. Renken, Appl. Catal., A, 1997, 151, 223–246 CrossRef CAS.
- Y. Xie, J. Chen, X. Wu, J. Y. Wen, R. Zhao, Z. Li, G. Tian, Q. Zhang, P. Ning and J. Hao, ACS Catal., 2022, 12, 10587–10602 CrossRef CAS.
- G. Kresse and J. Furthmüller, Phys. Rev. B: Condens. Matter Mater. Phys., 1996, 54, 11169–11186 CrossRef CAS PubMed.
- G. Kresse and J. Furthmüller, Comput. Mater. Sci., 1996, 6, 15–50 CrossRef CAS.
- G. Kresse and D. Joubert, Phys. Rev. B: Condens. Matter Mater. Phys., 1999, 59, 1758–1775 CrossRef CAS.
- J. P. Perdew, K. Burke and M. Ernzerhof, Phys. Rev. Lett., 1996, 77, 3865–3868 CrossRef CAS PubMed.
- M. Delarmelina, M. G. Quesne and R. A. Catlow, Phys. Chem. Chem. Phys., 2020, 22, 6660–6676 RSC.
- S. L. Zhou and S. Li, J. Phys. Chem. C, 2020, 124, 27467–27478 CrossRef CAS.
- H. J. Monkhorst and J. D. Pack, Phys. Rev. B: Solid State, 1976, 13, 5188–5192 CrossRef.
- J. Neugebauer and M. Scheffler, Phys. Rev. B: Condens. Matter Mater. Phys., 1992, 46, 16067–16080 CrossRef CAS PubMed.
- F. Haase and J. Sauer, J. Am. Chem. Soc., 1998, 120, 13503–13512 CrossRef CAS.
- T. Joutsuka and S. Tada, J. Phys. Chem. C, 2023, 127, 6998–7008 CrossRef CAS.
- G. Henkelman and H. Jonsson, J. Chem. Phys., 2000, 113, 9978–9985 CrossRef CAS.
- S. Tada, H. Kinoshita, D. Li, M. Nishijima, H. Yamaguchi, R. Kikuchi, N. Yamauchi, Y. Kobayashi and K. Iyoki, Adv. Powder Technol., 2023, 34, 104174 CrossRef CAS.
- M. E. Kauppinen, M. M. Melander, A. S. Bazhenov and K. Honkala, ACS Catal., 2018, 8, 11633–11647 CrossRef CAS.
- K. Momma and F. Izumi, J. Appl. Crystallogr., 2011, 44, 1272–1276 CrossRef CAS.
- C. A. Akinnawo, N. Bingwa and R. Meijboom, New J. Chem., 2021, 45, 7878–7892 RSC.
Footnote |
| † Electronic supplementary information (ESI) available. See DOI: https://doi.org/10.1039/d4cp00635f |
| This journal is © the Owner Societies 2024 |