
 Open Access Article
 This Open Access Article is licensed under a Creative Commons Attribution-Non Commercial 3.0 Unported Licence
High-accuracy experimental determination of photon mass attenuation coefficients of transition metals and lithium fluoride in the ultra-soft energy range†
Pia
Schweizer
 *ac,
Yves
Ménesguen
b,
Marie-Christine
Lépy
b,
Emmanuelle
Brackx
a,
Maxime
Duchateau
a and
Philippe
Jonnard
c
*ac,
Yves
Ménesguen
b,
Marie-Christine
Lépy
b,
Emmanuelle
Brackx
a,
Maxime
Duchateau
a and
Philippe
Jonnard
c
aCEA, DES, ISEC, DMRC, Université Montpellier, Marcoule, France. E-mail: pia.schweizer@cea.fr
bUniversité Paris-Saclay, CEA, LIST, Laboratoire National Henri Becquerel (LNE-LNHB), F-91120, Palaiseau, France
cLaboratoire de Chimie Physique—Matière et Rayonnement, Faculté des Sciences et Ingénierie, Sorbonne Université, UMR CNRS, 4 place Jussieu, 75252 Paris Cedex 05, France
First published on 10th April 2024
Abstract
In the field of quantitative X-ray analysis techniques, such as electron probe microanalysis, precise knowledge of fundamental parameters is crucial. Especially, the accurate determination of photon mass attenuation coefficients is essential to perform correct elemental quantification. While the widely used databases offer agreement for the hard X-ray range, significant differences arise for lower photon energies. Furthermore, addressing the uncertainties of the tabulated data, which can be of several hundreds of percent, is of urgent need. Driven by recent advances in analytical techniques in the low energy range including investigation of materials containing lithium, the interest in a reliable set of photon mass attenuation coefficients is steadily increasing. In this study, we experimentally determine photon mass attenuation coefficients for lithium fluoride, aluminium, and different transition metals in the extreme low energy range from 40 eV to a several hundreds of eV. This high-precision experimental determination allows a comparison with the existing data tables. We observe differences that turn out to be significant, especially around the absorption edges.
Introduction
Photon mass attenuation coefficients (MACs) with low uncertainties are required in a wide range of quantitative analytical techniques such as X-ray fluorescence and electron probe microanalysis (EPMA). Many years of investigations of fundamental parameters lead to different compilations based on the combination of theoretical descriptions and experimental data.1–4 These values are most often correct in the hard X-ray range, hence for photon energies larger than several keV, but have large discrepancies between one another for lower energies.5 The authors warn of their use in the extreme low energy range without considering the uncertainties that can be of several hundreds of percent.6 With the advances in analytical techniques in the low energy range,7–10 emerging complex simulation methods,11–13 and the steadily increasing demand for the characterization of strategic materials containing light elements, an exact determination of MACs of elements of interest in the extreme low energy range and around their absorption edges becomes necessary. Especially, the analysis of materials containing lithium, for example, lithium-ion batteries, is a current important issue. Addressing discrepancies in tabulated fundamental parameters of lithium, potentially stemming from non-valid calculation models, is imperative.14 In practical applications, lithium is frequently found in samples alongside transition metals (e.g., batteries) or in metal alloys containing aluminum. Therefore, the aim of this work is to experimentally study the MACs of lithium fluoride, aluminium and transition metals with atomic numbers from 24 to 29 in an energy range from several hundreds of eV down to 40 eV as they all present absorption edges in this range. To our knowledge, high accuracy measurements at these low energies have not been published yet for most of these elements. Scientists base their work on existing databases that have large or undetermined uncertainties. Quantitative analytical techniques such as EPMA use matrix corrections in which the main factor is absorption correction. A one-percent uncertainty in the MAC is considered to introduce a one-percent relative uncertainty in the measured concentration.15 Given the large uncertainty budget for soft X-rays, it is hardly possible to obtain a satisfying matrix correction and therefore exact measured concentrations.5 Thus, experimental investigation is urgently needed for a large community and can help increase the reliability of quantitative analysis. Our results are compared to existing data coming mostly from theoretical calculations.1,16Experimental
Methods
The MAC (μ/ρ) translates the interaction probability of a photon beam with matter. Depending on photoabsorption and scattering effects, it is a function of the photon energy. For a parallel and monochromatic photon beam, the MAC can be deduced by measuring the intensity which is transmitted through a sample following the Beer–Lambert law, | (1) |
Therefore, μ/ρ can be measured in transmission mode. A limitation to this technique is the photon beam monochromaticity and flux stability but its main limitation is given by the sample characteristics: its purity and thickness. Non-homogenous samples can easily falsify measurement results. As the main uncertainties are directly linked to these factors, they should be known with high accuracy to get reliable experimental results. The purity of the samples was controlled by EDS microanalysis and is further detailed in the ‘Samples’ section below. Moreover, a detailed description of the determination of uncertainties for our work is given in the ‘Estimation of uncertainties’ section.
For measurements in the energy range from 40 eV to 700 eV, the samples have to be extremely thin, as they would absorb the total intensity of the incident photon beam otherwise. In addition, following Nordfors, the statistical uncertainty on the measurement is minimal, if the transmitted intensity respects the criterion 2 ≤ ln(I/I0) ≤ 4.18 To fulfil this requirement, samples must be between a few dozen and a few hundred nm thick. The following section describes the sample fabrication and characteristics.
Samples
The samples were prepared at the French Alternative Energies and Atomic Energy Commission (CEA Marcoule) in the LMAT laboratory using an Agar Scientific Combined Coater System for metal evaporation. Thin layers of LiF and the metals were respectively evaporated on copper 200 mesh support grids with a carbon coating of 28–30 nm used for transmission electron microscopy (TEM). A scheme of this grid is shown in Fig. 1. | ||
| Fig. 1 Scheme of the copper TEM support grid with carbon coating (left) and a grid mesh (right). | ||
Even if the evaporation is conducted under vacuum, the deposition of layers of several tens of nm requires several evaporation cycles and the sample is exposed to air between each cycle. This results in stratified samples that may contain significant quantities of oxide not only on their surface. In order to respect the Nordfors criterion over the entire measured energy range, samples of different thicknesses were prepared for each material.
The samples were studied using a Zeiss Merlin high-resolution scanning electron microscope (SEM) and a Bruker energy dispersive X-ray spectroscopy (EDS) system QUANTAX XFlash providing information about the surface condition and purity of the deposited layer. For this purpose, characteristic EDS spectra were acquired for each sample. The spectra present emission lines of carbon, oxygen, copper and the evaporated element. No other peaks with significant intensities are visible which allows us to conclude that the prepared samples are free of contamination that may have remained in the metal evaporator. Fig. 2 shows an example of an EDS spectrum acquired on a TEM grid that was covered with a Co layer. One can see the characteristic peaks C Kα, O Kα, Co L2,3, Cu L2,3, Co Kα and Kβ and Cu Kα and Kβ (from low to high photon energies).
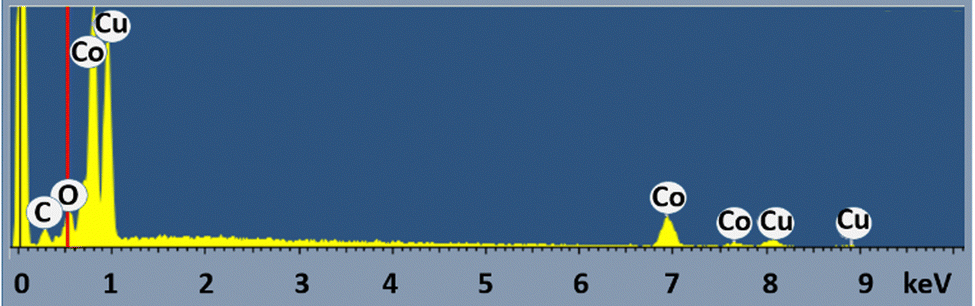 | ||
| Fig. 2 EDS spectrum of a TEM grid with a Co layer acquired at an acceleration voltage of 15 kV. The red line shows the energy position of the O Kα line. | ||
Even if the exact quantification of oxygen is challenging using EDS,19 this first analysis of the samples helps to estimate the oxygen mass fraction by taking into account the intensity of the O Kα peak.
The TEM grids are extremely fragile and easily damaged. Fig. 3 shows SEM images of TEM grids with two different thicknesses of Al layers. Other SEM images of the grids can be found in the ESI† in Fig. 1 and 2.
 | ||
| Fig. 3 Al layers of 40 nm (left) and 160 nm (right) on TEM grids. The grid shown on the left presents damage from handling. | ||
In addition to SEM imaging, to ensure that the samples used for the measurements were in the best possible conditions, we performed two-dimensional scans of the grids at the synchrotron. These transmission measurements helped determine the optimal areas and perfect sample alignment to avoid measuring areas containing defects. A reconstructed 2d transmission scan is shown in Fig. S3 and S4 for copper and iron samples, respectively, in the ESI.†
Beamline description
Measurements were carried out at the French national synchrotron facility SOLEIL at the METROLOGIE beamline. The METROLOGIE beamline is dedicated to the metrology and characterization of different optics, materials and industrial components. It presents two branches operating simultaneously: a hard X-ray branch (3 keV to 40 keV) and a soft X-ray branch (30 eV to 1800 eV) which was used for this work. The resolving power of the beam is 1000 to 10![[thin space (1/6-em)]](https://www.rsc.org/images/entities/char_2009.gif) 000 depending on the energy range where the beam size is a few hundred micrometers in focused mode with a full width at half maximum (FWHM) of about 400 μm. The energy selection is performed using three different variable line-spacing gratings in combination with filters and an order-sorter system for minimizing the harmonics for different configurations. Depending on the energy range, the photon flux is 109 to 1012 s−1 on the sample. A more detailed description of the beamline can be found in ref. 20. The samples are placed on a support holder in a two-axis high vacuum goniometer, as shown in Fig. 4.
000 depending on the energy range where the beam size is a few hundred micrometers in focused mode with a full width at half maximum (FWHM) of about 400 μm. The energy selection is performed using three different variable line-spacing gratings in combination with filters and an order-sorter system for minimizing the harmonics for different configurations. Depending on the energy range, the photon flux is 109 to 1012 s−1 on the sample. A more detailed description of the beamline can be found in ref. 20. The samples are placed on a support holder in a two-axis high vacuum goniometer, as shown in Fig. 4.
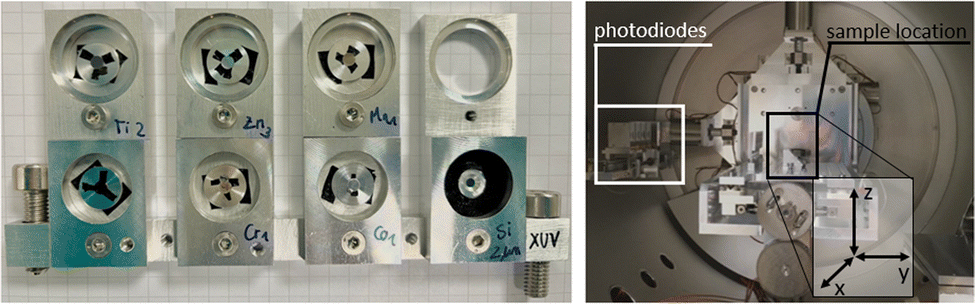 | ||
| Fig. 4 Samples fixed on a sample holder using carbon tape (left); photograph of the goniometer (right). | ||
The intensity transmitted through each sample is measured using a Si photodiode whose dark noise is subtracted from all current values to derive an unbiased transmittance. The final transmittance is obtained by comparing the intensity transmitted through the sample, that is the deposited material on the carbon coated TEM grid, and the intensity transmitted through a carbon coated TEM grid with no additional deposition, further called the blank value. The blank values were measured several times over the whole energy range. They all superpose better than 1% which confirms good reproducibility of the energy scans.
Results and discussion
As discussed earlier, μ/ρ measurements were carried out in transmission mode. Although this type of measurement is easy to perform, the results require detailed processing to take account of the sample characteristics. The following paragraph briefly describes the various constraints that have to be considered leading to the description of the data processing before showing the results below.The X-UV beam, with a FWHM of about 400 μm, largely covers the TEM grid during the measurement. The beam is only transmitted through the grid holes and depending on the orientation of the grid, the part of the beam cut by the grid varies. In addition, as shown in the Samples section, grids can easily be damaged during the evaporation process and subsequent handling. The measured intensity has to be corrected from these factors introducing a correction factor for the grid aperture. Furthermore, as the sample may contain a significant quantity of oxide, the calculation of the MAC must take the oxygen mass fraction into account. Accordingly, the final equation for determining the mass attenuation coefficient is written as follows:
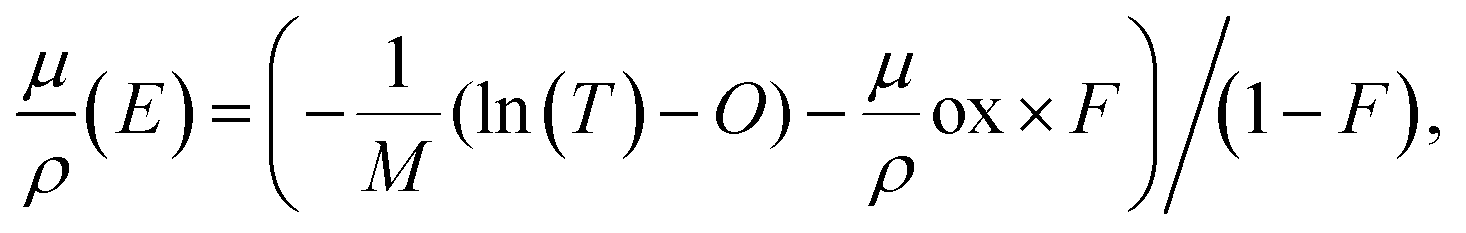 | (2) |
To determine the absolute MAC values from eqn (2) without the precise knowledge of M, O and F, we performed data fitting on the experimental or calculated data available for higher energy ranges, as these data have much lower uncertainties. Experimental high-precision data comes from LNHB.21 The data were fitted using Origin 202014 defining the non-linear fitting function eqn 2 using the Levenberg–Marquardt Least-Squares Algorithm. The data for μ/ρ ox comes from tabulated ultra-high precision experimental measurements.21 The values of the fitted parameters as well as the related standard uncertainties can be found in Table A in the ESI† for all samples.
Estimation of uncertainties
The uncertainty budget of μ/ρ is a combination of statistical and systematic uncertainties, such as measurement uncertainties and calibration of the instrument as well as the sample preparation. In our case, the most important contribution to the uncertainty is the quality of the data fitting that determines the values of M, O and F. The uncertainty associated with eqn (2) is given by the quadratic sum of the partial derivatives which leads to the following expression of the relative uncertainty Δμ/ρ = ∂μ/ρ: | (3) |
Results
The results are presented in Fig. 5–12. The measured data are compared to the latest compilations from Chantler (FFast)16 and Henke (CXRO)1 that contain several updates, notably for Cr.22 For the sake of completeness, we also present the experimental measurements reported from LNHB21 that have been used for the data fitting whenever available. Thus, these high-accuracy measurements are in perfect agreement to the measurements of this study. One can clearly see that the published compilations do not account for the fine structure (XAFS) and that the energy of the absorption edges as well as the absolute value of the MACs is not necessarily the same from one compilation to another. Discrepancies are discussed in detail below. For most elements, the measurements show some discontinuities over the photon energy range. This is principally due to the harmonics of the beamline. As discussed in the ‘Experimental’ section, the beamline is equipped with filters and an order-sorter system for minimizing them. Nevertheless, some harmonics persist, especially for the configuration used for photon energies between 200 eV and 300 eV and 500 eV and 600 eV.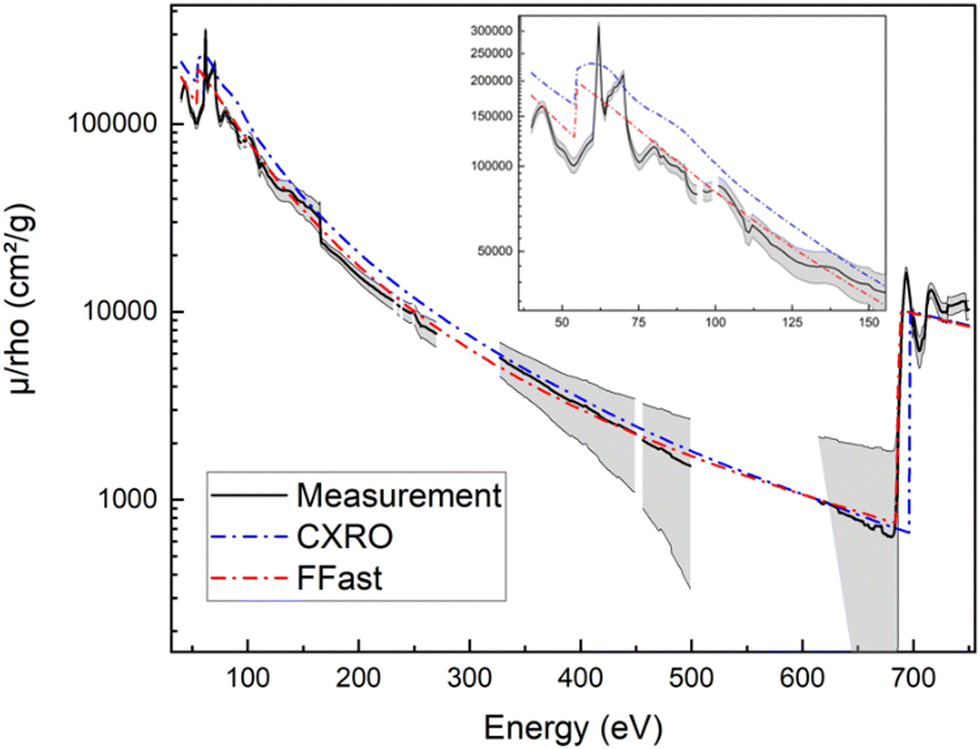 | ||
| Fig. 5 Tabulated and measured MACs of lithium fluoride as a function of energy in the photon range from 40 eV to 750 eV. The calculated uncertainty budget is shown by the shaded areas. | ||
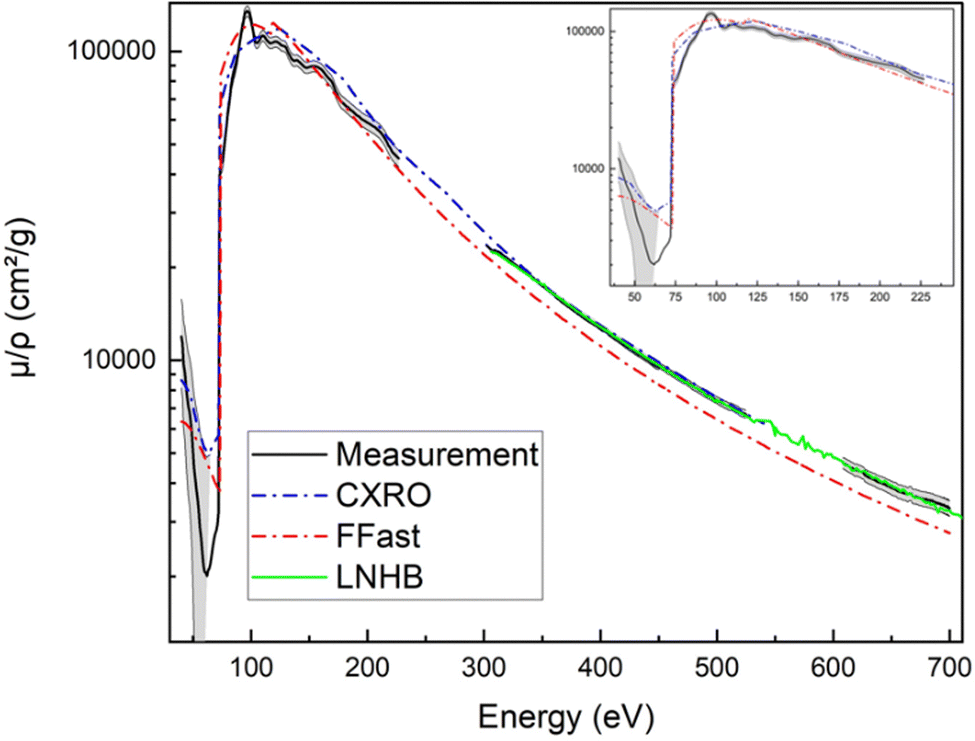 | ||
| Fig. 6 Tabulated and measured MACs of aluminium as a function of energy in the photon range from 40 eV to 700 eV. The calculated uncertainty budget is shown by the shaded areas. | ||
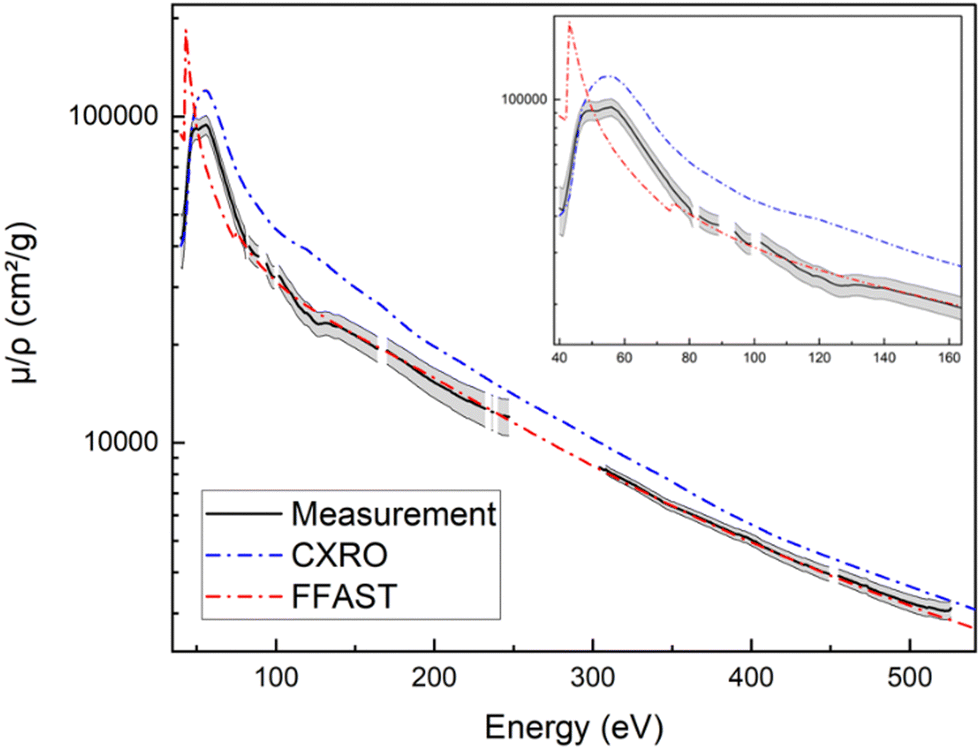 | ||
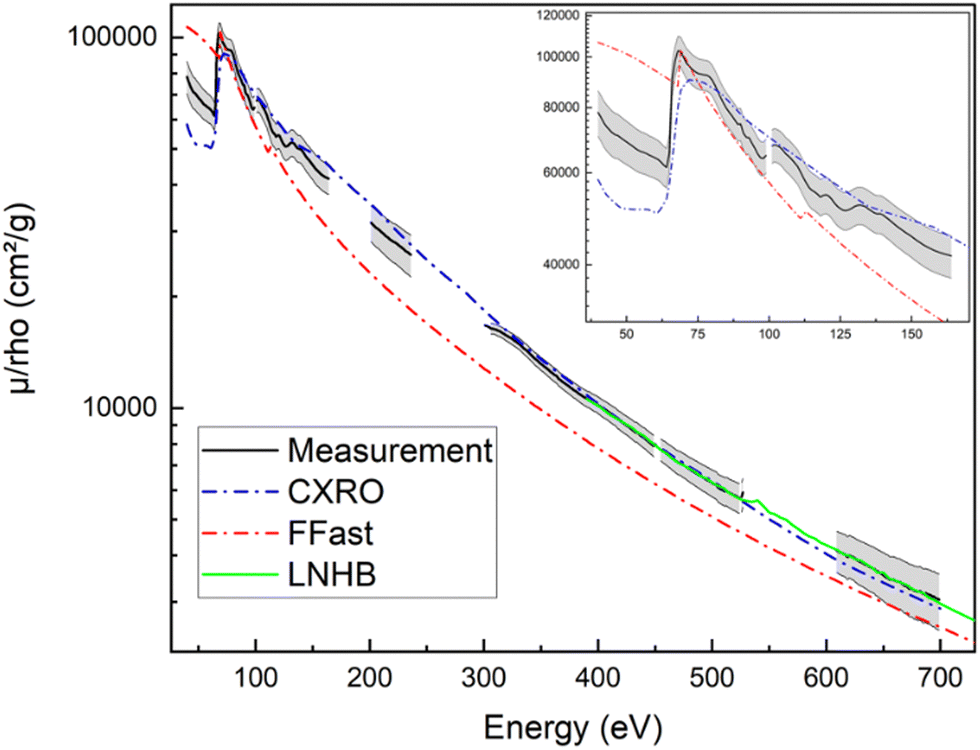
| Fig. 7 Tabulated and measured MACs of chromium as a function of energy in the photon range from 40 eV to 525 eV. The calculated uncertainty budget is shown by the shaded areas. | ||
 | ||
| Fig. 8 Tabulated and measured MACs of manganese as a function of energy in the photon range from 40 eV to 700 eV. The calculated uncertainty budget is shown by the shaded areas. | ||
 | ||
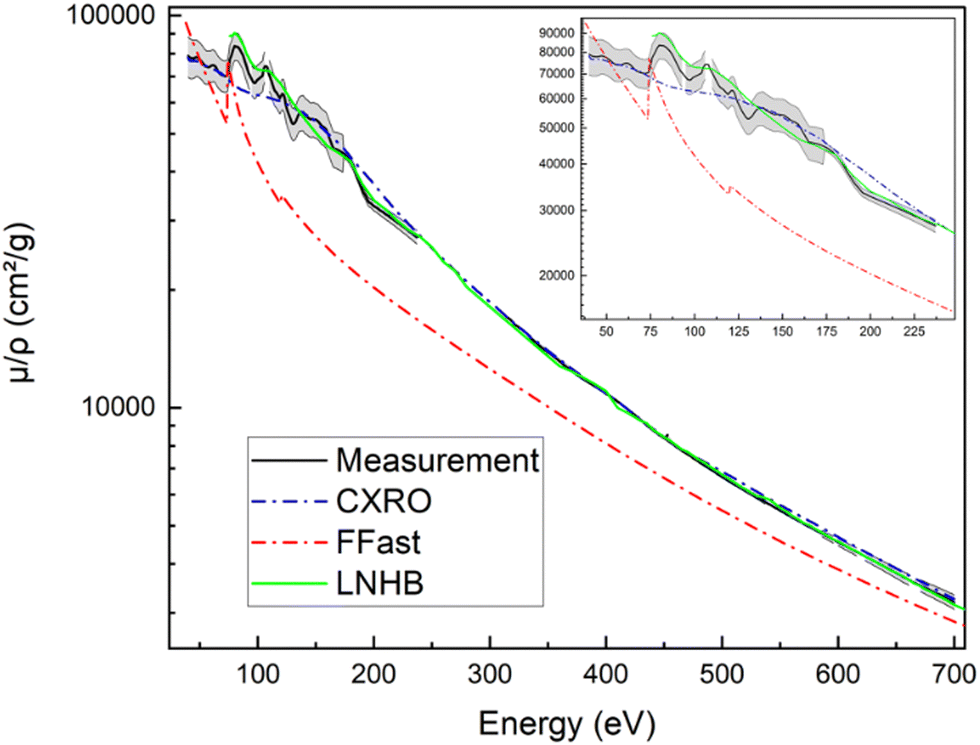
| Fig. 9 Tabulated and measured MACs of iron as a function of energy in the photon range from 40 eV to 750 eV. The calculated uncertainty budget is shown by the shaded areas. | ||
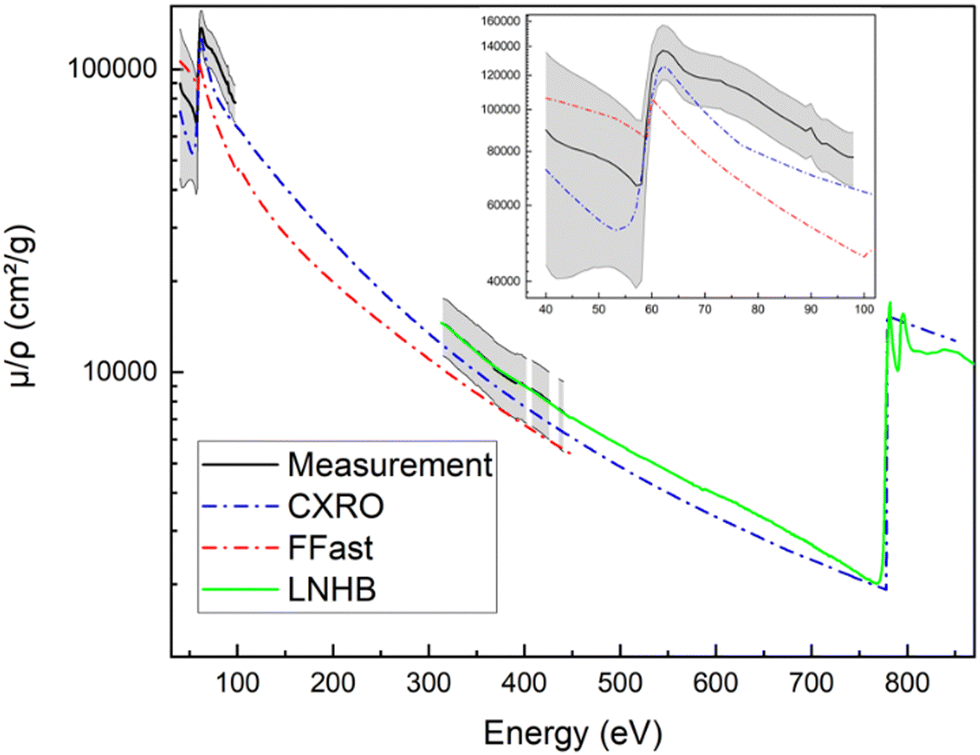 | ||
| Fig. 10 Tabulated and measured MACs of cobalt as a function of energy in the photon range from 40 eV to 850 eV. The calculated uncertainty budget is shown by the shaded areas. | ||
 | ||
| Fig. 11 Tabulated and measured MACs of nickel as a function of energy in the photon range from 40 eV to 700 eV. The calculated uncertainty budget is shown by the shaded areas. | ||
 | ||
| Fig. 12 Tabulated and measured MACs of copper as a function of energy in the photon range from 40 eV to 700 eV. The calculated uncertainty budget is shown by the shaded areas. | ||
Fig. 5 shows the MACs for LiF in an energy range from 40 eV to 750 eV. The F K absorption edge is situated at 687 eV which is consistent with the literature.13
One can observe a near edge fine structure around the absorption edge. The measured position of the absorption edge at 61 eV is consistent with other X-ray absorption near edge structure (XANES) spectra for LiF.23 The Li K absorption edge in LiF is not measured at 54 eV which is the tabulated energy position for the Li metal. In fact, the existing compilations, showing the absorption edge at 54 eV, do not account for chemical bonding which introduces an important shift of the absorption edge. The shift to 61 eV, with respect to the value tabulated for the metal, can also be calculated by taking into account the Fermi level position deduced from XPS measurements and a bandgap of 10.9 eV for LiF.24
Fig. 6 shows the MACs for Al in an energy range from 40 eV to 700 eV. Below the absorption edge at 72 eV, the relative uncertainties of the measured values range from 30% to 130%. However, for higher energies, they are contained between 1% and 7%. For energies below the absorption edge, the measured mass attenuation coefficients are lower than those reported in FFast and CXRO. This has also been observed in other experimental measurements.25 Taking the uncertainty into account, the measurements are in good agreement with the values determined in this previous study. For energies above 300 eV, the MACs from CXRO are closer to the experimental MACs than the MACs from FFast.
The MACs of Cr and Mn are shown in Fig. 7 and 8.
In general, the present measurements for Fe, Co, Ni and Cu shown in Fig. 9–12 seem to be in better agreement with the CXRO data.
As shown in Fig. 6–12, for pure metals, the energy positions of the absorption edges we measured are identical to the ones reported in the existing databases. Nevertheless, the figures reveal significant discrepancies of the absolute MAC values that are not included in the uncertainty budget from one description to another. These differences often increase close to the absorption edges. Table 1 shows numerical values of the MACs for selected X-ray lines in the ultra-soft energy range, below 100 eV, and compares them to the data reported in CXRO and FFast.
| MACs (cm2 g−1) | Energy line | 54 eV Li Kα | 72 eV Al L2,3 | 92 eV Si L2,3 |
|---|---|---|---|---|
| LiF | Measured | 100000 ± 6000 |
120000 ± 7000 |
82000 ± 6000 |
| CXRO | 164912 |
180235 |
125549 |
|
| FFast | 126785 |
140091 |
95110 |
|
| Al | Measured | 4000 ± 3000 | 3200 ± 2700 | 117000 ± 5000 |
| CXRO | 6110 | 5716 | 102400 |
|
| FFast | 5345 | 3784 | 118055 |
|
| Cr | Measured | 93000 ± 6000 |
55000 ± 4000 |
36300 ± 2800 |
| CXRO | 119553 |
74812 |
50216 |
|
| FFast | 75335 |
43586 |
34264 |
|
| Mn | Measured | 122600 ± 1700 |
90300 ± 1500 |
55300 ± 1500 |
| CXRO | 132489 |
59737 |
40418 |
|
| FFast | 89152 |
57640 |
47584 |
|
| Fe | Measured | 109000 ± 9000 |
103000 ± 8000 |
69000 ± 6000 |
| CXRO | 71872 |
78961 |
61652 |
|
| FFast | 87776 |
73378 |
50156 |
|
| Co | Measured | 70000 ± 30000 |
117000 ± 16000 |
83000 ± 12000 |
| CXRO | 52895 |
93265 |
69141 |
|
| FFast | 93961 |
75730 |
51710 |
|
| Ni | Measured | 66000 ± 6000 |
96000 ± 6000 |
70200± 5000 |
| CXRO | 51056 |
90464 |
75896 |
|
| FFast | 98683 |
96252 |
65099 |
|
| Cu | Measured | 75000 ± 8000 |
70000 ± 6000 |
71000 ± 6000 |
| CXRO | 74751 |
69739 |
63712 |
|
| FFast | 72000 |
54027 |
46500 |
The small thicknesses of the analysed samples did not allow measurements up to the L absorption edges for most of the elements. In the present case, for photon energies of several hundreds of eV, absorption was close to zero which no longer respects the Nordfors criterion.18 For measurements above 700 eV, the thickness of the samples for most materials should exceed several hundreds of nm.
Conclusions and perspectives
In conclusion, our study allowed the experimental high-precision measurements of mass attenuation coefficients of photons in the extreme low energy range. This novel data set represents a valuable addition to the existing databases used across various analytical techniques. A comparative analysis shows substantial differences between databases, emphasizing the necessity for users to take into account the uncertainty associated with the selected data. Particularly at these low energies where uncertainties are not precisely determined, the potential impact on analysis results is noteworthy, underscoring the importance of careful consideration. The precision of the experimental results, characterised by an uncertainty budget of less than one percent for certain materials and energies, improves the reliability of our data, potentially allowing better analytical results.The choice of using TEM grids as a sample substrate which makes data fitting necessary prompts consideration for alternative solutions to perform this kind of experiment. Exploring options such as self-supporting thin films without the use of TEM grids could be a promising approach for future works. However, the exact thickness determination remains a challenge for thin films, and data fitting similar to that used in our study may remain necessary for its determination.
Moreover, our work was motivated by the specific goal of improving matrix correction programs for lithium quantification using EPMA. The choice of elements analysed in our study aligns with practical applications, such as elements commonly found in battery materials or metal alloys. While our work constitutes a first step, we are aware of the necessity to extend these measurements to other elements. This experimental study complements existing databases to improve the knowledge and precision in fundamental parameters that remain an important current limitation for continuous improvement of quantitative analytical techniques using soft X-rays.
Author contributions
P. Schweizer: conceptualization, funding acquisition, investigation, formal analysis, and writing – original draft; Y. Ménesguen: methodology, data curation, investigation, formal analysis, validation, and writing – review and editing; M. C. Lépy: methodology, data curation, validation, and writing – review and editing; E. Brackx: conceptualization, supervision, resources, and project administration; M. Duchateau: supervision and resources; P. Jonnard: conceptualization, supervision, validation, project administration, and writing – review and editing.Conflicts of interest
There are no conflicts to declare.Acknowledgements
This research was performed at the synchrotron SOLEIL in the framework of proposal 20220894. We acknowledge SOLEIL for provision of synchrotron radiation facilities and we would like to say a special thanks to Pascal Mercère and Paulo Dasilva for assistance in using the METROLOGIE beamline. We also like to thank the CEA cross-cutting basic research Program RBNEW for additional funding.Notes and references
- B. L. Henke, E. M. Gullikson and J. C. Davis, X-Ray Interactions: Photoabsorption, Scattering, Transmission, and Reflection at E = 50-30,000 eV, Z = 1-92, At. Data Nucl. Data Tables, 1993, 54(2), 181–342 CrossRef CAS.
- W. T. Elam, B. D. Ravel and J. R. Sieber, A new atomic database for X-ray spectroscopic calculations, Radiat. Phys. Chem., 2002, 63(2), 121–128 CrossRef CAS.
- H. Ebel, R. Svagera, M. F. Ebel, A. Shaltout and J. H. Hubbell, Numerical description of photoelectric absorption coefficients for fundamental parameter programs, X-Ray Spectrom., 2003, 32(6), 442–451 CrossRef CAS.
- XCOM: Photon Cross Sections Database, NIST, 2009. Available from: https://www.nist.gov/pml/xcom-photon-cross-sections-database.
- X. Llovet, P. Pöml, A. Moy and J. H. Fournelle, Assessing the Accuracy of Mass Attenuation Coefficients for Soft X-ray EPMA, Microsc. Microanal., 2023, 29(2), 540–551 CrossRef PubMed.
- D. E. Cullen, J. H. Hubbell and L. Kissel, EPDL97: the evaluated photo data library ‘97 version. Lawrence Livermore National Lab. (LLNL), Livermore, CA (United States); 1997 Sep. Report No.: UCRL-50400-Vol.6-Rev.5. Available from: https://www.osti.gov/biblio/295438.
- F. Zhao, S. Zhang, Y. Li and X. Sun, Emerging Characterization Techniques for Electrode Interfaces in Sulfide-Based All-Solid-State Lithium Batteries, Small Struct., 2022, 3(1), 2100146 CrossRef CAS.
- V. Polkonikov, N. Chkhalo, R. Pleshkov, A. Giglia, N. Rividi and E. Brackx, et al., Periodic Multilayer for X-ray Spectroscopy in the Li K Range, Appl. Sci., 2021, 11(14), 6385 CrossRef CAS.
- J. Probst, C. Braig and A. Erko, Flat Field Soft X-ray Spectrometry with Reflection Zone Plates on a Curved Substrate, Appl. Sci., 2020, 10(20), 7210 CrossRef CAS.
- P. Hovington, V. Timoshevskii, S. Burgess, H. Demers, P. Statham and R. Gauvin, et al., Can we detect Li K X-ray in lithium compounds using energy dispersive spectroscopy?, Scanning, 2016, 38(6), 571–578 CrossRef CAS.
- R. Gauvin and P. Michaud, MC X-Ray, a New Monte Carlo Program for Quantitative X-Ray Microanalysis of Real Materials, Microsc. Microanal., 2009, 15(S2), 488–489 CrossRef.
- X. Llovet and C. Merlet, Electron Probe Microanalysis of Thin Films and Multilayers Using the Computer Program XFILM, Microsc. Microanal., 2010, 16(1), 21–32 CrossRef CAS PubMed.
- X. Llovet and F. Salvat, PENEPMA: a Monte Carlo programme for the simulation of X-ray emission in EPMA, IOP Conf. Ser.: Mater. Sci. Eng., 2016, 109, 012009 Search PubMed.
- S. Rudinsky, N. C. Wilson, C. M. MacRae, Y. Yuan, H. Demers and M. A. Gibson, et al., The Impact of Chemical Bonding on Mass Absorption Coefficients of Soft X-rays, Microsc. Microanal., 2020, 26(4), 741–749 CrossRef PubMed.
- G. F. Bastin and H. J. M. Heijligers, Quantitative electron probe microanalysis of ultralight elements (boron-oxygen), Scanning, 1990, 12(4), 225–236 CrossRef CAS.
- FFast Physical Reference Database. Available from: https://physics.nist.gov/cgi-bin/ffast/ffast.pl?Z=3&Formula=>ype=3&lower=&upper=&density=.
- Y. Ménesguen, C. Dulieu and M. C. Lépy, Advances in the measurements of the mass attenuation coefficients, X-Ray Spectrom., 2019, 48(5), 330–335 CrossRef.
- B. Nordfors, The statistical error in X-ray absorption measurements, Ark. Fys., 1960, 18, 37–47 CAS.
- D. E. Newbury and N. W. M. Ritchie, Performing elemental microanalysis with high accuracy and high precision by scanning electron microscopy/silicon drift detector energy-dispersive X-ray spectrometry (SEM/SDD-EDS), J Mater. Sci., 2015, 50(2), 493–518 CrossRef CAS PubMed.
- Y. Ménesguen, B. Boyer, H. Rotella, J. Lubeck, J. Weser and B. Beckhoff, et al., CASTOR, a new instrument for combined XRR-GIXRF analysis at SOLEIL, X-Ray Spectrom., 2017, 46(5), 303–308 CrossRef.
- MACAO - Mass Attenuation Coefficients And Optical Constants. 2023. Available from: https://www.lnhb.fr/Laraweb/Mu/.
- F. Delmotte, J. Meyer-Ilse, F. Salmassi, R. Soufli, C. Burcklen and J. Rebellato, Soft x-ray optical constants of sputtered chromium thin films with improved accuracy in the L and M absorption edge regions, J Appl Phys., 2018, 124, 3 CrossRef.
- D. Wang and L. Zuin, Li K-edge X-ray absorption near edge structure spectra for a library of lithium compounds applied in lithium batteries, J. Power Sources, 2017, 337, 100–109 CrossRef CAS.
- M. Q. Khokhar, S. Q. Hussain, D. P. Pham, M. Alzaid, A. Razaq and I. Sultana, et al., Role of electron carrier selective contact layer of lithium fluoride films with wide bandgap and low work function for silicon heterojunction solar cells, Mater. Sci. Semicond. Process., 2021, 134, 105982 CrossRef CAS.
- E. M. Gullikson, P. Denham, S. Mrowka and J. H. Underwood, Absolute photoabsorption measurements of Mg, Al, and Si in the soft-x-ray region below the L2,3 edges, Phys. Rev. B: Condens. Matter Mater. Phys., 1994, 49(23), 16283–16288 CrossRef CAS PubMed.
Footnote |
| † Electronic supplementary information (ESI) available. See DOI: https://doi.org/10.1039/d4cp00500g |
| This journal is © the Owner Societies 2024 |