
 Open Access Article
 This Open Access Article is licensed under a
 Creative Commons Attribution 3.0 Unported Licence
Stable mass-selected AuTiOx nanoparticles for CO oxidation†
Rikke Egeberg
Tankard‡
 a,
Filippo
Romeggio‡
a,
Stefan Kei
Akazawa
b,
Alexander
Krabbe
a,
Olivia Fjord
Sloth
a,
Niklas Mørch
Secher
a,
Sofie
Colding-Fagerholt
b,
Stig
Helveg
b,
Richard
Palmer
c,
Christian Danvad
Damsgaard
abd,
Jakob
Kibsgaard
ab and
Ib
Chorkendorff
*a
a,
Filippo
Romeggio‡
a,
Stefan Kei
Akazawa
b,
Alexander
Krabbe
a,
Olivia Fjord
Sloth
a,
Niklas Mørch
Secher
a,
Sofie
Colding-Fagerholt
b,
Stig
Helveg
b,
Richard
Palmer
c,
Christian Danvad
Damsgaard
abd,
Jakob
Kibsgaard
ab and
Ib
Chorkendorff
*a
aDepartment of Physics, Technical University of Denmark, 2800 Kongens Lyngby, Denmark. E-mail: ibchork@fysik.dtu.dk
bCenter for Visualizing Catalytic Processes (VISION), Department of Physics, Technical University of Denmark, 2800 Kongens Lyngby, Denmark
cNanomaterials Lab, Swansea University, Bay Campus, Swansea, UK
dNational Centre for Nano Fabrication and Characterization, Technical University of Denmark, 2800 Kongens Lyngby, Denmark
First published on 4th March 2024
Abstract
Stability under reactive conditions poses a common challenge for cluster- and nanoparticle-based catalysts. Since the catalytic properties of <5 nm gold nanoparticles were first uncovered, optimizing their stability at elevated temperatures for CO oxidation has been a central theme. Here we report direct observations of improved stability of AuTiOx alloy nanoparticles for CO oxidation compared with pure Au nanoparticles on TiO2. The nanoparticles were synthesized using a magnetron sputtering, gas-phase aggregation cluster source, size-selected using a lateral time-of-flight mass filter and deposited onto TiO2-coated micro-reactors for thermocatalytic activity measurements of CO oxidation. The AuTiOx nanoparticles exhibited improved stability at elevated temperatures, which is attributed to a self-anchoring interaction with the TiO2 substrate. The structure of the AuTiOx nanoparticles was also investigated in detail using ion scattering spectroscopy, X-ray photoelectron spectroscopy, and transmission electron microscopy. The measurements showed that the alloyed nanoparticles exhibited a core–shell structure with an Au core surrounded by an AuTiOx shell. The structure of these alloy nanoparticles appeared stable even at temperatures up to 320 °C under reactive conditions, for more than 140 hours. The work presented confirms the possibility of tuning catalytic activity and stability via nanoparticle alloying and self-anchoring on TiO2 substrates, and highlights the importance of complementary characterization techniques to investigate and optimize nanoparticle catalyst designs of this nature.
Introduction
Improving catalyst stability is a central challenge for many thermal and electrocatalytic processes which could play a key role in the transition to more sustainable production of fuels and chemicals in the future.1–4 A catalyst in the form of nanoparticles or clusters bound to a support can deactivate, for example due to sintering over time, in a reactive environment.5–7 From a research perspective, the change in structure of the catalyst during reaction can make it difficult to relate the ex situ properties to the in situ catalytic performance. More practically, poor stability limits the relevance of an otherwise active catalyst for commercial use. Understanding fundamental ways to stabilize active metal nanoparticles prone to sintering can therefore have a wide-ranging impact.8,9Gold (Au) nanoparticles have long been of high importance in catalysis research, and are still of interest for a wealth of reactions including oxidation of alcohols, selective hydrogenation reactions and CO2 electroreduction.10–12 Since the catalytic activity at −70 °C of 3–5 nm Au nanoparticles on oxide supports for CO oxidation was first shown by M. Haruta et al. in 1987,13 this system has been widely studied. CO oxidation on supported Au nanoparticles is a large research area spanning over topics including size studies,14–17 promotional effects of water,18–21 and extensive investigations on the influence of the oxide support.22–25 One of the most studied supports is TiO2, which exhibits poor activity on its own. However, when combined with Au nanoparticles, the resulting Au/TiO2 composite exhibits a high activity for CO oxidation.10,14 In 2011, T. Fujitani and I. Nakamura showed that the active site for CO oxidation is located at the perimeter between the Au nanoparticles and the TiO2 support at lower temperatures, while at temperatures >320 K, the reaction may take place on the Au nanoparticle surface itself.20 While the catalytic activity of Au nanoparticles on TiO2 is promising, industrial applications are limited due to the lack of stability over appreciable time periods.26 Compared to other noble metals, Au has a high chemical stability, but suffers from poor thermal stability which causes sintering, especially for smaller cluster sizes at elevated temperatures.24
A focus has emerged on improving the stability of Au nanoparticles while maintaining their activity.22 Approaches mainly involve modifying the support to influence its interaction with the Au nanoparticles or changing the nanoparticle structure itself. Several attempts have been made to modify the oxide support to achieve more stable Au nanoparticles. For example, W. Goodman et al. showed that Au nanoparticles on a SiO2 surface doped with Ti were less prone to sintering at 850 K than without the Ti present.27 Recently, several studies have emerged on the encapsulation of Au nanoparticles as a result of different treatments of the TiO2 support, which leads to enhanced stability for CO oxidation.28,29 Similar work has also been shown for other metals on reducible oxide supports.30 J. Wang et al. describe in detail the permeability of the TiO2 as a factor for increasing the activity,29 and T. Zhang et al. suggest that metal-promoted oxygen vacancy formation in the oxide overlayer can also contribute to an enhanced activity.28
The structure of the nanoparticles themselves can also be tuned to improve their stability, for example using ligands26 or through alloying with another metal within the nanoparticle.31 In 2018, some of the authors on this paper observed that Au could be stabilized by depositing AuTi alloy nanoparticles on a SiO2 support; decreased sintering was observed, compared with pure Au nanoparticles, under electron beam radiation.32 Spectroscopy measurements before and after heating the sample at 100 °C in 1 bar of O2 and CO gas showed that a segregation process took place, where more Ti was drawn towards the surface of the cluster, but Au atoms were still present on the surface, making this alloy form an interesting possibility for stabilizing the catalyst. Cluster beam synthesis by gas aggregation, prior to mass-selection, allows a measure of control of the aggregation parameters, which can be used to tune the structural composition (as well as size) of bimetallic alloy nanoparticles,33 making these techniques highly suitable for investigating the phenomena described.
In general, alterations of the support and/or nanoparticle structure leads to changes in the local atomic environment surrounding the Au atoms, and hence will affect not only the stability, but also the activity of the catalyst. With emerging approaches to stabilizing Au clusters, it is important that the catalytic performance of these systems is also directly investigated, to test stability and activity under relevant conditions.
In this work, alloy nanoparticles from an Au/Ti alloy target are demonstrated to exhibit an enhanced stability for CO oxidation compared to pure Au nanoparticles, on TiO2. Through a combination of activity tests, spectroscopy, and microscopy methods, the alloy nanoparticles are investigated in detail and are shown to exhibit a reduced mobility and sintering under reactive conditions compared to Au nanoparticles. The nanoparticle structure is shown to consist of an Au core surrounded by an AuTiOx alloy shell. The TiOx in the shell is believed to aid in the anchoring of the nanoparticles and hence improve the catalyst stability. The core–shell structure is furthermore observed to be maintained after reaction, and under reactive conditions on a silicon nitride (SiNx) support. The results indicate that alloying Au with Ti directly within the nanoparticles can facilitate this anchoring effect while maintaining activity for CO oxidation. The work thus provides a demonstration that alloying of a reactive metal within noble metal nanoparticles can provide a useful tool for stabilizing active catalyst materials during reaction.
Experimental
Substrate preparation
The nanoparticles were deposited onto TiO2-coated state-of-the-art μ-reactors34 for the thermal activity tests and onto SiNx FEI NanoEx MEMS heater chips35 for transmission electron microscopy (TEM) measurements. The MEMS heaters were loaded directly into the cluster source UHV chamber before nanoparticle deposition and received no treatment before deposition. The μ-reactors, consisting of a thermally grown SiO2 layer on top of Si, were first wiped with ethanol and then dried using a CO2 blower. They were then mounted into a magnetron sputtering system with a base pressure in the low 10−8 mbar region. A ∼50 nm TiO2 substrate was deposited using reactive DC sputtering of metallic Ti (AJA International, purity 99.995%) at room temperature (Ar/O2 = 60/6 sccm, 120 W). The chamber pressure during all the depositions was kept constant at 5 mTorr while rotating the sample stage to obtain a more homogeneous film. Subsequently, the TiO2 coated μ-reactors were loaded into the cluster source UHV chamber and cleaned with Ar+ sputtering in 10−6 mbar Ar with 1.5 keV, 10 mA emission and a measured sample current of 10−6 A for 20 min. The XPS measurements of the AuTiOx nanoparticles were carried out on a SiO2 μ-reactor with no TiO2 coating which also received the Ar+ sputtering procedure before nanoparticle deposition.Nanoparticle synthesis
Nanoparticles were produced and deposited using a cluster beam source (UHV Nano-beam 2011 cluster source) from Birmingham Instruments Ltd, based on the design of some of the authors on this paper.36 Au nanoparticles of mass 56k amu were deposited from an Au metal sputter target (AJA International, purity 99.99%) and AuTi nanoparticles of mass 160k amu were deposited from an Au/Ti mixed alloy target with At% ratio 50/50. The nanoparticles were formed via magnetron sputtering of the metal target followed by cluster growth in an aggregation zone with Ar and He gases present. Mass selection (by mass-to-charge ratio) was carried out using a lateral time-of-flight mass filter.37 The mass filter resolution was m/Δm = 20. During deposition, the substrates were rastered in a uniform manner in front of the beam to achieve an even coverage, and the deposition current was monitored to achieve the desired coverage (5% projected coverage for the μ-reactors and 2% coverage for the TEM chips). A bias was applied to the sample to ensure soft landing38 of the nanoparticles (0.03–0.17 eV per atom).Catalyst loading and amount of Au
Au nanoparticle deposition: deposition of 5% coverage of 56![[thin space (1/6-em)]](https://www.rsc.org/images/entities/char_2009.gif) 000 ± 2800 amu nanoparticles. This corresponds to particles with 280 ± 10 atoms, or a particle diameter of 2.09 ± 0.04 nm. The equivalent mass loading of Au is 135 ± 7 ng cm−2. AuTi nanoparticle deposition: 5% coverage of 160000 ± 8000 amu nanoparticles. The Au/Ti alloy target consists of a 50/50 at%, meaning that we expect particles with 660 ± 40 atoms of each metal, or a particle diameter of 3.49 ± 0.06 nm assuming a density of 11.91 g cm−3 (average of Au and Ti). The equivalent mass loading of AuTi is 139 ± 7 ng cm−2 (5.23 × 10¹¹ nanoparticles per cm2). If an Au nanoparticle consisted of 660 ± 40 atoms, its size would be 2.77 ± 0.06 nm. With the same number of nanoparticles per cm2, this is equivalent to a mass loading of Au of 113 ± 7 ng cm−2. Measured Au core in TEM: the core size in the AuTi nanoparticles is measured to be 2.1 ± 0.2 nm in TEM. This corresponds to a mass of 60000 ± 20000 amu, or 300 ± 100 Au atoms, which only accounts for 50 ± 20% of the Au in the alloy nanoparticles if their At% is 50/50. Values used for calculations: Au atomic mass 197 amu, Ti atomic mass 48 amu, Au density 19.32 g cm−3, Ti density 4.5 g cm−3.
000 ± 2800 amu nanoparticles. This corresponds to particles with 280 ± 10 atoms, or a particle diameter of 2.09 ± 0.04 nm. The equivalent mass loading of Au is 135 ± 7 ng cm−2. AuTi nanoparticle deposition: 5% coverage of 160000 ± 8000 amu nanoparticles. The Au/Ti alloy target consists of a 50/50 at%, meaning that we expect particles with 660 ± 40 atoms of each metal, or a particle diameter of 3.49 ± 0.06 nm assuming a density of 11.91 g cm−3 (average of Au and Ti). The equivalent mass loading of AuTi is 139 ± 7 ng cm−2 (5.23 × 10¹¹ nanoparticles per cm2). If an Au nanoparticle consisted of 660 ± 40 atoms, its size would be 2.77 ± 0.06 nm. With the same number of nanoparticles per cm2, this is equivalent to a mass loading of Au of 113 ± 7 ng cm−2. Measured Au core in TEM: the core size in the AuTi nanoparticles is measured to be 2.1 ± 0.2 nm in TEM. This corresponds to a mass of 60000 ± 20000 amu, or 300 ± 100 Au atoms, which only accounts for 50 ± 20% of the Au in the alloy nanoparticles if their At% is 50/50. Values used for calculations: Au atomic mass 197 amu, Ti atomic mass 48 amu, Au density 19.32 g cm−3, Ti density 4.5 g cm−3.
Ion scattering spectroscopy and X-ray photoelectron spectroscopy
The surfaces before and after nanoparticle deposition, as well as after activity tests, were characterized in the same UHV chamber as the cluster source using survey scans of ISS with He+ ions, using 1 keV acceleration voltage, 1 mA emission current, and a He pressure of 5 × 10⁻⁸ mbar. Due to the high cross-section for neutralization of the ions below the first atomic layer in the sample surface, the signal detected arises mainly from the outermost layer of the sample surface, and therefore the probing depth of the ISS technique is expected to be only 1 atomic layer. The Au and Ti atomic percentage concentrations in the AuTiOx nanoparticles were investigated by depositing the AuTi nanoparticles onto a blank reference μ-reactor (surface terminated by 50 nm thermally grown SiO2). After deposition, the μ-reactor was transported to a different UHV chamber and measured using a monochromatic Al Kα X-ray source (1486.68 eV). The survey spectrum and details of the Au and Ti peak fittings, as well as an analysis of the probing depth and signal intensity, are given in ESI† S4.Scanning electron microscopy
The surface of the TiO2-coated μ-reactors with Au and AuTiOx nanoparticles was studied by SEM using a Thermo Scientific Helios 5 Hydra UX PFIB microscope operating at an acceleration voltage of 5 kV, a current of 0.20 nA, and using a Through the Lens Detector (TLD) in immersion mode. The images were acquired with a magnification equivalent to an image pixel size ranging from 0.62 nm to 0.83 nm. The probe size at optimal focus conditions was estimated to be around 1 nm. Post-reaction SEM images were taken after opening the μ-reactors using a dicing saw Disco DAD 321.Transmission electron microscopy
The nanoparticles were examined using an FEI Titan ETEM.39 The microscope was operated at 300 kV in high-resolution transmission electron microscopy (HRTEM) mode with the spherical aberration coefficient for the objective lens in TEM mode set to approximately −10 μm in its corrected state. Images were acquired at a detector-incident dose-rate below 60 e− Å−2 s−1 using a Gatan K3 IS camera in counting mode. HRTEM images were acquired of samples during exposure to a gas mixture of 2 mbar O2 and 1 mbar CO and elevated temperatures of 100 °C, 200 °C, 300 °C, and 400 °C (Fig. S16, ESI†). The micrographs were acquired from primary areas, which were consecutively exposed to the electron beam, and from reference areas which were prior to the image acquisition unexposed to the electron beam at earlier stages of the experiment (see ESI† Sections S8–S10). Each displayed micrograph represents a total exposure of 5 seconds and was obtained by acquiring 4 HRTEM images per second followed by band-pass filtered drift-alignment of the images and subsequent summation.CO oxidation measurements
Activity measurements were conducted in state-of-the-art μ-reactors (Fig. S24, ESI†). This system has a total reaction volume of ∼240 nL and gas flows in the order of magnitude of nmol s−1. All the gases that enter the reactive area flow directly to the mass spectrometer without any dilution/carrier gas, allowing for an extremely sensitive product detection. On the back side, a 50 nm platinum thin film is used to control the temperature through resistive heating and a resistance temperature detector. Temperature was also measured with a thermocouple on the Pyrex lid area on top of the reactive surface.The μ-reactors were sealed via anodic bonding40 (Fig. S25, ESI†). The reactive surface contains pillar structures to prevent the Pyrex lid from collapsing during bonding. Right after nanoparticle deposition, the surface of the μ-reactors were cleaned with ethanol (avoiding the deposition area) and dried with a CO2 blower. After applying a thin layer of thermal paste (Dow Corning 340) on the “cold finger”, the μ-reactors and a Pyrex lid were pressed together between the Cu anode and Al cathode. A potential of 1 kV was applied using an (Impo Electronic) power supply and a temperature of 360 °C was reached by applying 25 V to (Philips 7748XHP) heating lamps. The circular reactor area itself was aligned with the “cold finger”, which allows cooling to temperatures below ∼120 °C. After 1 hour, the μ-reactor and the Pyrex lid resulted in a permanent sealing.
The catalysts were exposed to a constant inlet flow of ∼25 nmol min−1 (CO:O2:Ar = 1:2:0.5) at P = 1 bar. Ar was used as a control gas. Temperature ramps (up to 250 °C and 320 °C for Au and AuTi, respectively) of 4 °C min−1 with 1 h steps every 15 °C were performed to check the catalyst relative activity and stability at different conditions. The products were measured with a Pfeiffer vacuum QMG 422 Quadrupole Mass Spectrometer (QMS), using an ionization energy of 70 eV (SEM voltage = 1850 V, emission current = 0.1 mA). The signal from the QMS was converted to moles/second after baratron calibration (see ESI† Section S12).
Results and discussion
Au and AuTiOx nanoparticles
Nanoparticles were deposited onto TiO2-coated μ-reactors using an ultra-high vacuum (UHV)-based gas-aggregation cluster source, and mass-selected using a time-of-flight mass filter. Au nanoparticles of mass 56k amu were made from a pure Au sputter target and alloy nanoparticles of mass 160k amu were made from an Au/Ti sputter target with an At% ratio of 50/50. The two sputter targets used for each sample type are illustrated in Fig. 1a. The samples were produced with the same nanoparticle coverage of 5% of the sample surface. Characterization of the sample surface using ion scattering spectroscopy (ISS) before and after the nanoparticle deposition is shown in Fig. 1b, for the samples prior to air exposure. The ISS data show the TiO2 substrate before and after deposition, as well as an Au signal which becomes present after the deposition of the nanoparticles. The Au signal which originates from the outermost atomic layer of the nanoparticles produced from the alloy target is significantly smaller than the signal from the sample with pure Au nanoparticles. This suggests the outer surface of the nanoparticles contains a reduced amount of Au. These observations agree with the previous report on SiO2,32 where nanoparticles from the Au/Ti target were shown to undergo a segregation process with Au concentrated at the center of the nanoparticles, and Ti drawn to the surface of the nanoparticles.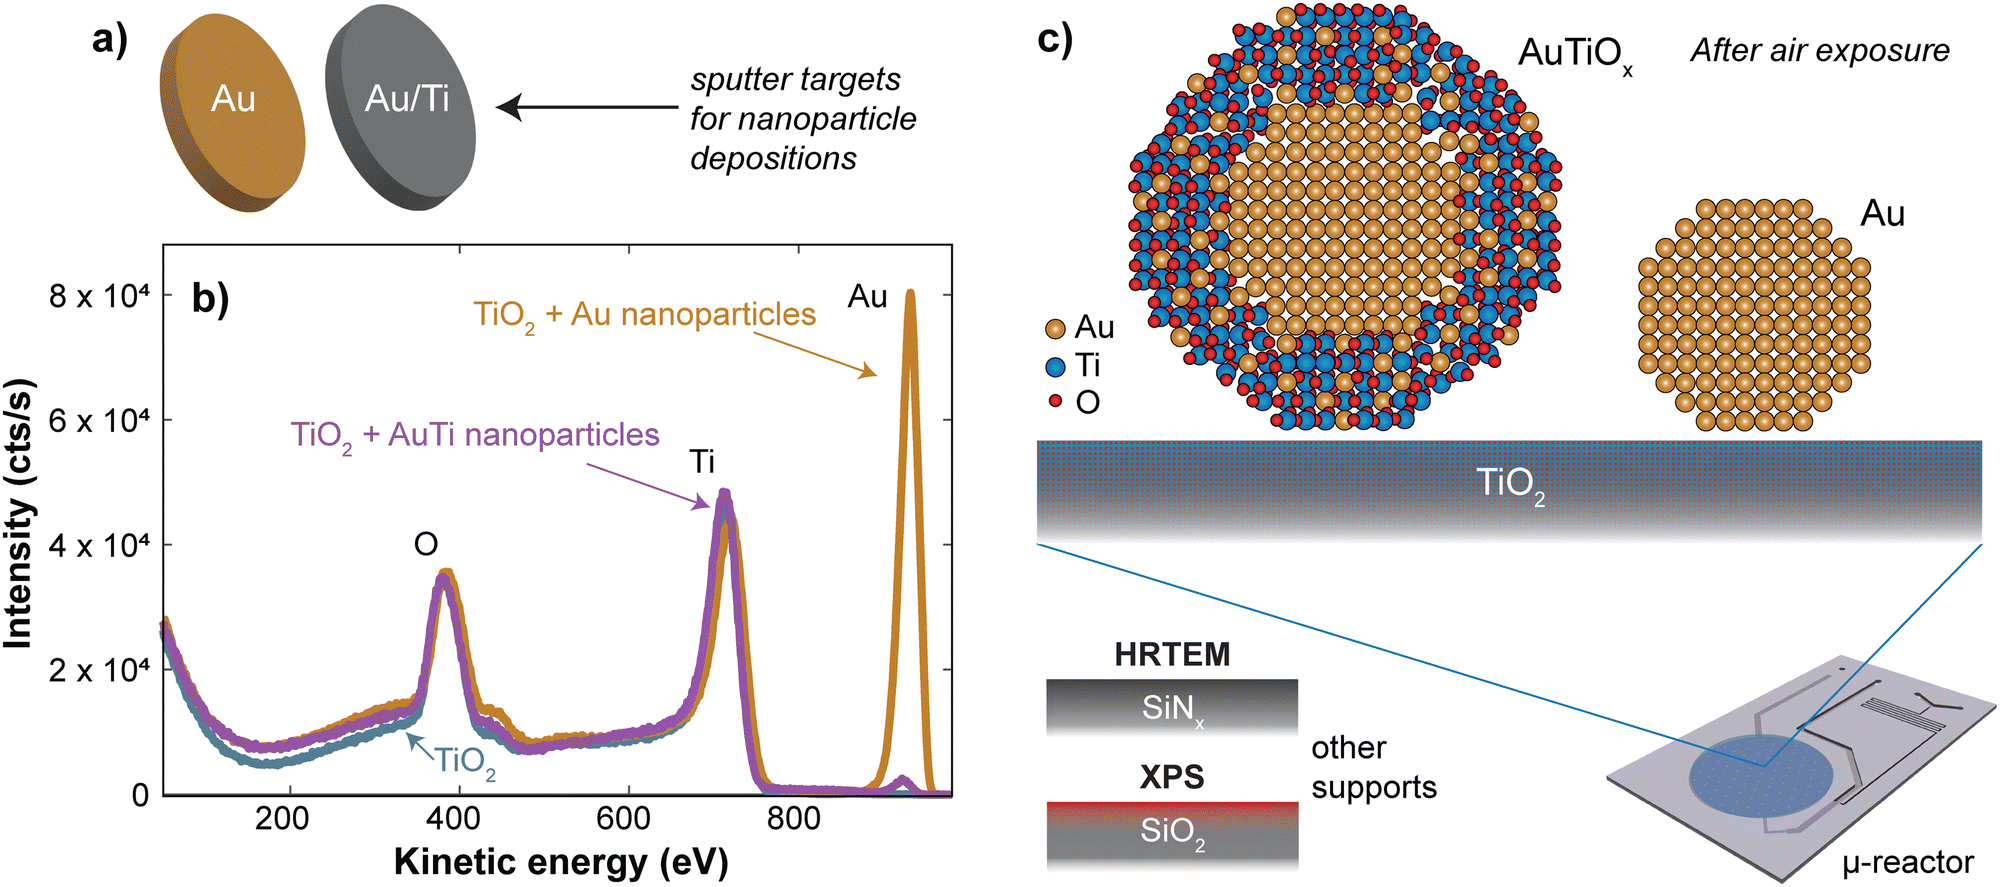 | ||
| Fig. 1 Au and AuTiOx nanoparticles were produced in a cluster source from the sputter targets shown in (a). The ISS spectrum before and after deposition of the nanoparticles onto TiO2 in (b) indicate that there is only a small amount of Au in the outer surface of the alloy nanoparticles even before the nanoparticles are exposed to air, after which a further oxidation of the Ti is also expected. (c) Illustration of the AuTiOx and Au nanoparticles once the nanoparticles have been exposed to air. The structure of the AuTiOx nanoparticles is further studied using HRTEM and XPS. | ||
After removing the sample from UHV conditions, it is expected that an oxidation of the Ti will take place, which may draw more Ti towards the nanoparticle surface, as indicated in Fig. 1c. The nanoparticles from the Au/Ti sputter target are therefore given the label AuTiOx. To investigate the structure of the AuTiOx nanoparticles further, they were also deposited onto SiNx FEI NanoEx MEMS heater chips35 for high-resolution transmission electron microscopy (HRTEM) imaging, and onto a SiO2 support for analysis by X-ray photoelectron spectroscopy (XPS). Fig. 2 shows a HRTEM image of the AuTiOx nanoparticles. The image reveals circular dark-contrast features surrounded by bright-contrast rims. A series of consecutive HRTEM images shows that the projected width of the bright rim is focus dependent and can be suppressed as defocus approaches zero (details in ESI† Section S1). As the focus approaches zero the dark circular features display lattice fringes matching FCC Au, suggesting that the dark features are a projection of a crystalline Au core. The projected diameter of the core is on average 2.1 ± 0.2 nm (details in ESI† Section S2).
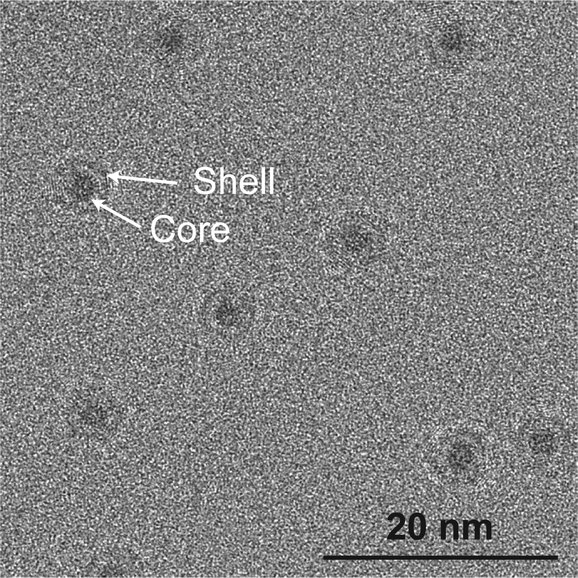 | ||
| Fig. 2 HRTEM image of AuTiOx nanoparticles on SiNx chips, after air exposure. The images reveal a core–shell structure with an Au core of size 2.1 ± 0.2 nm. Image pixel size: 0.074 nm per pixel. | ||
Assuming that the alloyed nanoparticles contain a 50/50 At% according to the composition of the sputter target, the measured Au core size of 2.1 ± 0.2 nm accounts for 50 ± 20% of the Au within the nanoparticles, which means the surrounding shell is expected to contain Au atoms as well as the oxidized TiOx. A small fraction of Au in the outer surface of the nanoparticles also agrees with the small Au signal observed in ISS before air exposure. A decrease in Au concentration towards the edge has also been observed previously in measurements of slightly larger AuTiOx nanoparticles (5.5 nm) prepared from the same target and cluster source, using scanning transmission electron microscopy (STEM) energy dispersive X-ray spectroscopy (EDS) (details in ESI† Section S3).
To study the composition of the AuTiOx nanoparticles in further detail, XPS of the AuTiOx nanoparticles was carried out after air exposure as well. The Au 4f and Ti 2p peaks are shown in Fig. 3. The Ti 2p signal shows that most of the Ti is oxidized, as expected. The Au/Ti At% ratio over the depth probed is estimated from the areas of the peaks, measured to be Au/Ti = 38/62. Further details on these fittings, and information on all peak origins in the survey spectrum, are given in ESI† Section S4. The expected signal in XPS should be considered based on the illustration in Fig. 3a, and on the signal decay which decreases according to exp(−x/λ), where the signal intensity decays to 37% of its value at x = λ, the mean free path of the photoelectrons. In Au for example, the photoelectrons in this study are expected to have kinetic energy ∼1400 eV, which corresponds to λ ∼ 2 nm. A detailed description of the signal decay is provided in ESI† Section S4. Using a cylindrical approximation shows that for a core–shell nanoparticle with an Au core of diameter 2.1 nm and outer diameter 3.5 nm, the expected Au/Ti ratio detected would be 25/75, if no Au was present in the shell. Therefore, the observed ratio of 38/62 indicates the presence of Au in the shell in addition to the core observed in TEM. While exact details about the full nanoparticle structure cannot be inferred from this ratio, it also indicates a larger fraction of TiOx compared to Au in the outer shell of the nanoparticles, which further supports the separated core–shell structure. The structure is therefore predicted to resemble a core–shell with an Au core, surrounded by a shell with an AuTiOx alloy.
 | ||
| Fig. 3 XPS of the AuTiOx nanoparticles on a SiO2 substrate. (a) Illustration of the estimated thickness of the shell. The XPS signal will arise mainly due to the outermost layers in the shell. (b) Au 4f and (c) Ti 2p peaks in XPS, giving an At% of Au/TiO2 of 38/62 in the outer shell layers. | ||
CO oxidation performance
To compare the stability of the Au and AuTiOx nanoparticles for CO oxidation, a size of 2.1 nm (56k amu) was selected for the reference sample of Au nanoparticles, to match the Au core size measured in the AuTiOx nanoparticles. Both types of nanoparticles were deposited onto TiO2-coated state-of-the-art μ-reactors with a projected area coverage of 5%. After air exposure and sealing by anodic bonding (see Methods), the high product-sensitivity μ-reactors were placed in a pumped-down containment volume (∼10–1 mbar) to avoid atmospheric contamination. The outlet flow was analyzed without any dilution and in real-time using a quadrupole mass spectrometer (QMS). Initially, all samples underwent a minimum of two temperature ramps up to 250 °C and 320 °C for Au and AuTiOx, respectively. Subsequently, a TOS experiment >24 hours was conducted to evaluate the long-term stability of the nanoparticles. The complete raw data can be found in ESI† Section S5.Fig. 4a–c illustrates the raw CO oxidation activity performance of Au and AuTiOx nanoparticles at various temperatures. Since both samples were deposited with a 5% nanoparticle coverage, the amount of Au atoms in the two samples is different. For the pure Au nanoparticles, the loading of Au is 135 ± 7 ng cm−2, and for the AuTiOx nanoparticles, the loading of Au can be estimated to be 113 ± 7 ng cm−2 based on the assumption that Au makes up half of the atoms in the alloyed nanoparticles, according to the composition of the sputter target (further details given in the methods section). At temperatures <170 °C, pure Au nanoparticles exhibited a higher CO2 signal compared to the AuTiOx samples. This is expected due to the higher number of exposed active Au sites in the Au sample.
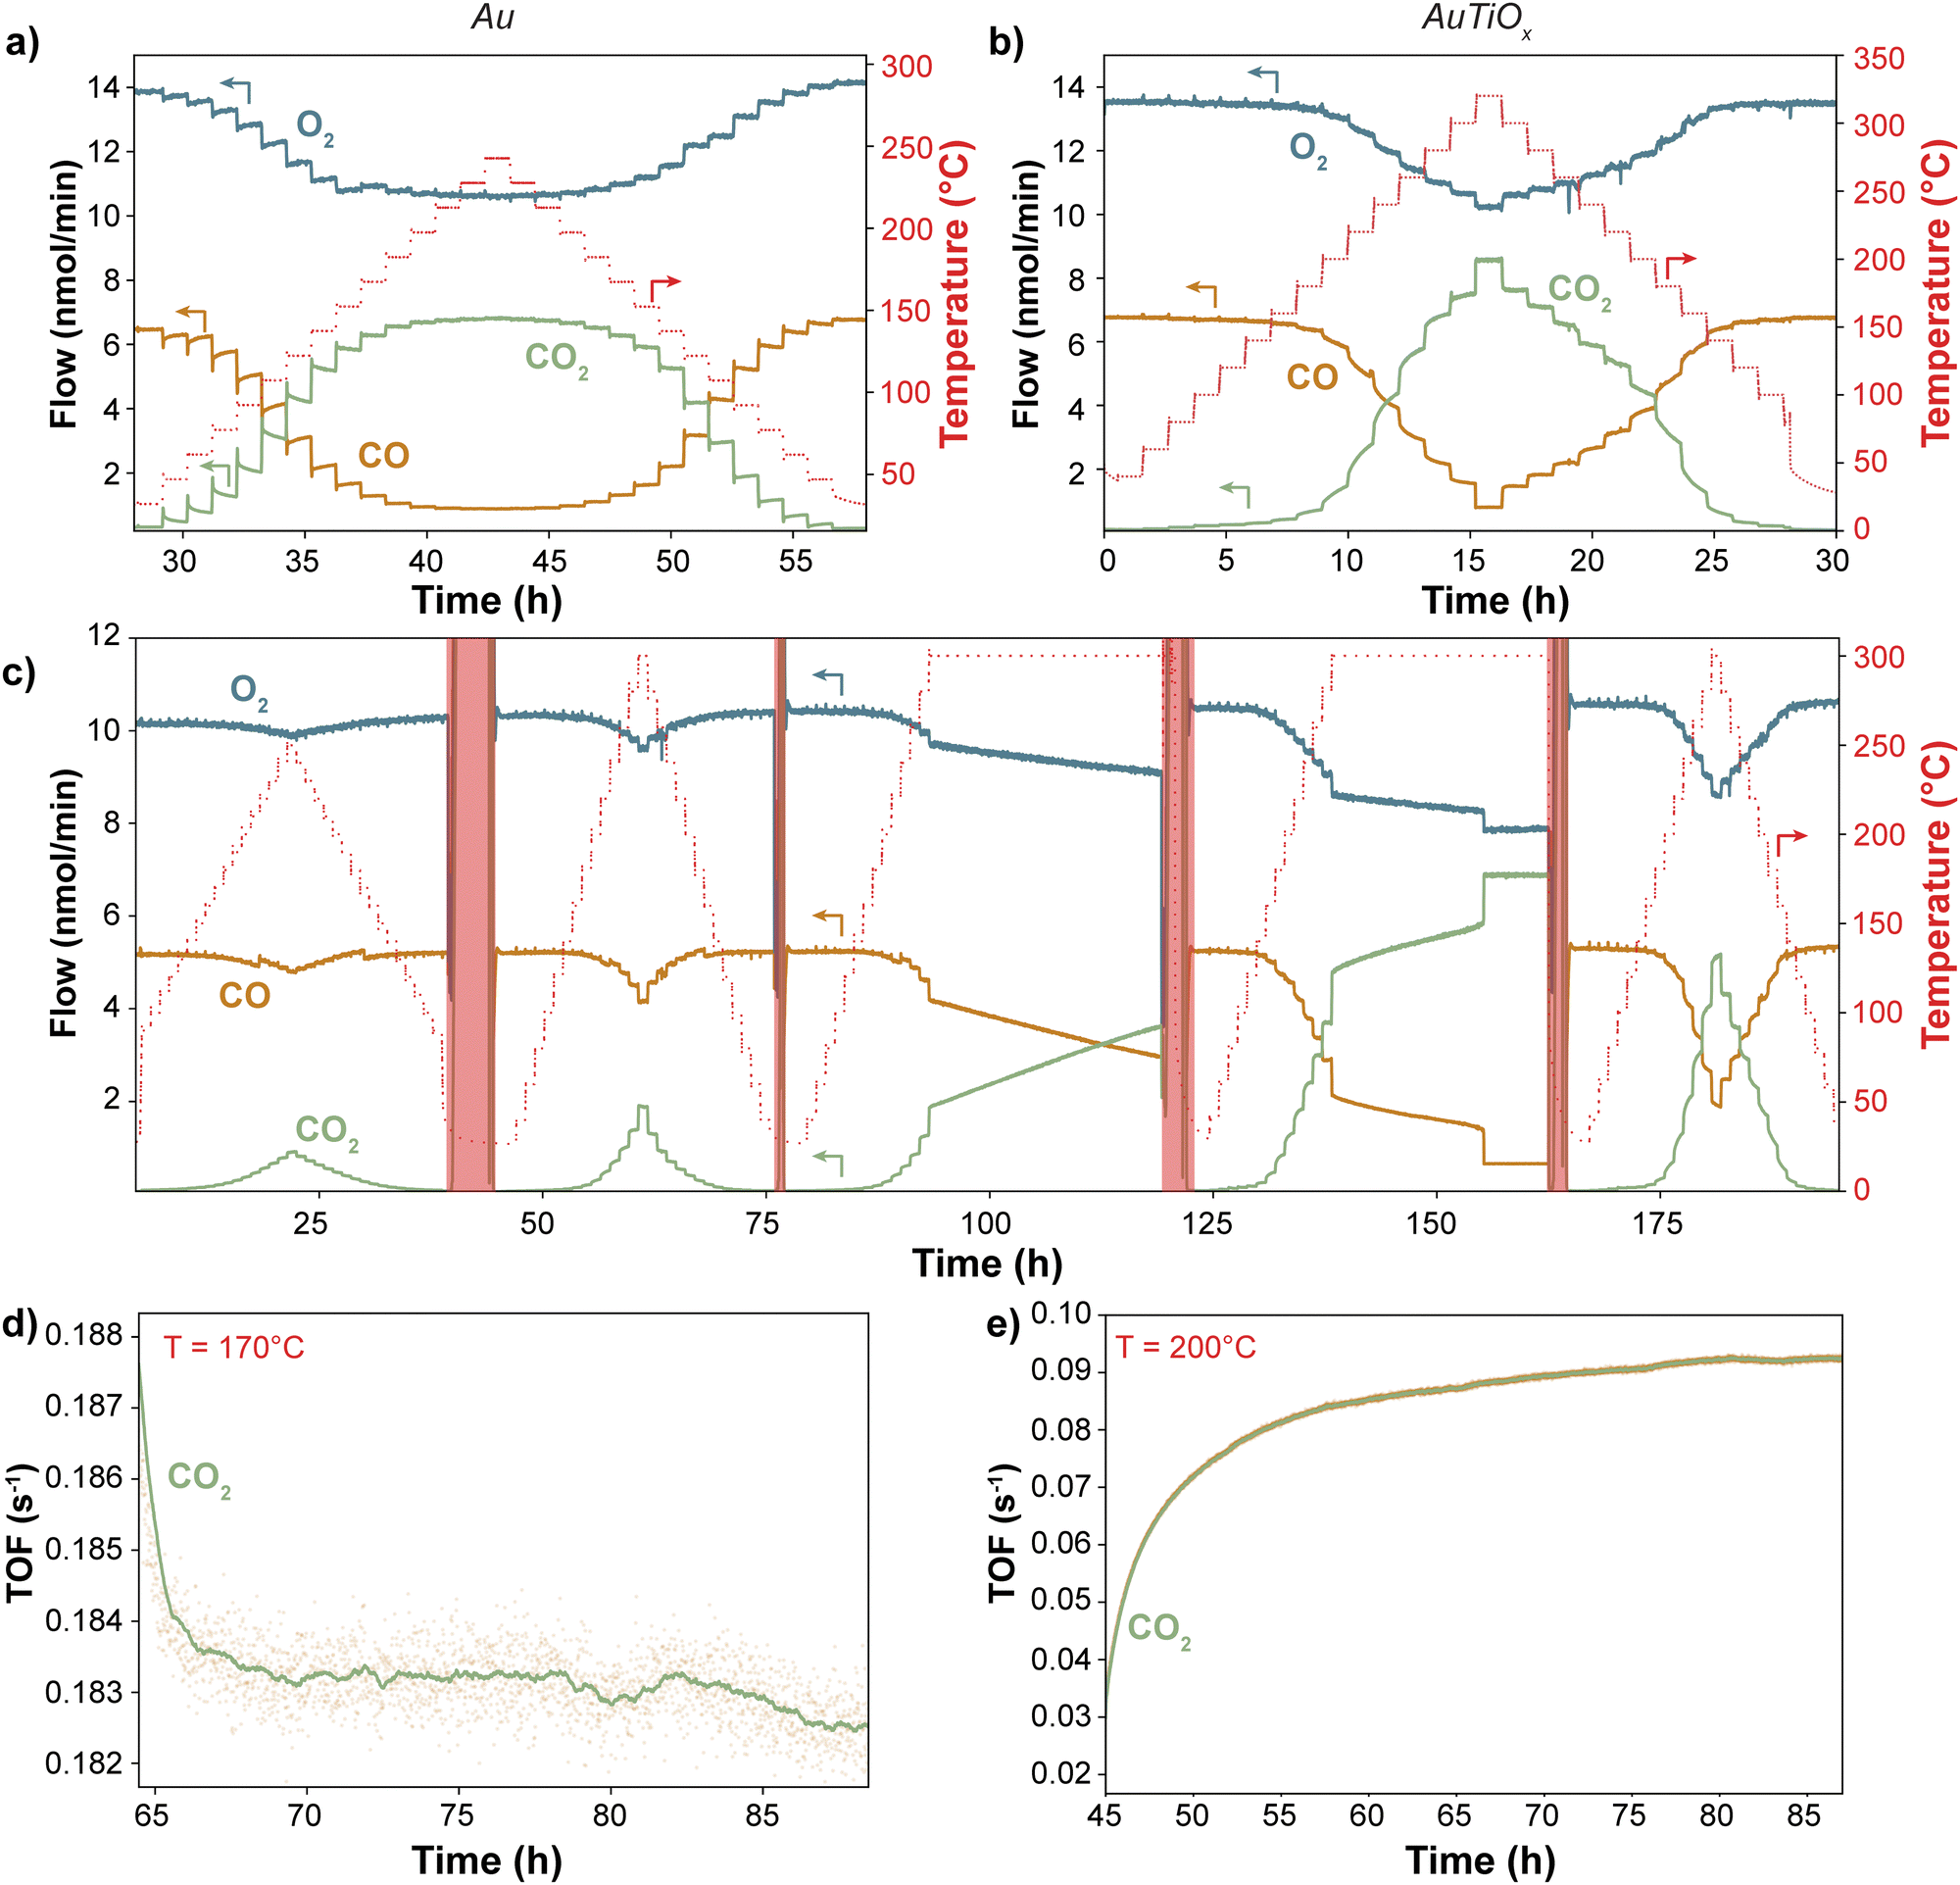 | ||
| Fig. 4 Catalytic activity vs. temperature and stability performance of the Au and AuTiOx nanoparticles. Catalytic activity temperature dependance of (a) Au and (b) and (c) AuTiOx nanoparticles on the TiO2 support. (b) and (c) Show data from different AuTiOx samples. In the regions highlighted in red, the μ-reactor was pumped down to remove all the gases, the data are therefore to be disregarded. Each temperature was held for 1 hour before ramping to the next step. The Au nanoparticles exhibit a deactivation behavior which is not observed for the AuTiOx nanoparticles. >24-hour long-term stability testing of (d) Au nanoparticles (e) AuTiOx nanoparticles on the TiO2 support. The TOF for the AuTiOx nanoparticles in (e) was normalized by the Au weight loading in the alloy nanoparticles. The yellow dots represent the raw data, which are then averaged and result in the green line. Before (d) the same Au sample underwent 2 temperature ramps up to 200 and 250 °C. Before (e) the same AuTiOx sample underwent 3 temperature ramps of which 1 to 250 °C and 2 up to 320 °C. There is a significant difference in the stability performance of the samples over the >24-hour period. All the experiments were conducted at 1 bar with an inlet flow of 2:1 O2:CO + Ar as control gas. | ||
The difference in stability between the two systems becomes evident when observing the produced CO2 in relation to the steady-state temperature. In the case of Au systems, as depicted in Fig. 4a, the CO2 signal exhibits a declining trend at each temperature step. This deactivation process initiates at temperatures as low as 50 °C and is particularly rapid within the first ∼20 minutes of each step. However, once full conversion is achieved at approximately 200 °C, the deactivation seems less pronounced likely due to the high turnover frequencies on the Au sites at these temperatures. The deactivation behavior is indicative of the high instability of Au nanoparticles supported on TiO2, even at mild conditions. The same deactivation is not observed for the AuTiOx nanoparticles when treated under similar experimental conditions. In Fig. 4b, the nanoparticles were exposed to temperatures up to 320 °C in order to reach full conversion. In addition, even after >200 hours of reaction at temperatures up to 300 °C there was no sign of activity loss (Fig. 4c). This increased stability is thought to be caused by a strong self-anchoring effect of the AuTiOx shell with the underlying TiO2 support.29
In Fig. 4d and e, a >24-hour time-on-stream experiment was conducted for both Au and AuTiOx systems to evaluate deactivation rates. A temperature of 170 °C was selected to investigate the sintering of Au nanoparticles but avoiding full conversion conditions. Conversely, the AuTiOx temperature was set at 200 °C to approximately match the turnover frequency (TOF) of Au nanoparticles (exposing the particles to similar gases partial pressures), and to compare the stability at harsher conditions. The data in Fig. 4d and e have been normalized by the weight loading of Au. However, the TOF for the Au nanoparticles is still approximately 3 times higher compared to the AuTiOx nanoparticles. This is likely owing to the lower amount of exposed Au atoms in the AuTiOx nanoparticles due to their core–shell structure.
It should also be emphasized that the experiments were performed on catalysts that had already undergone at least two temperature ramps. Consequently, sintering and surface rearrangement had already partially occurred (Fig. S12, ESI†). Nevertheless, the long time-on-stream experiment evidences a distinct disparity between the two catalysts: despite being more active, Au nanoparticles exhibit a decreasing trend in CO2 signal, indicating a progressive reduction in exposed Au surface area, potentially due to sintering. In contrast, the AuTiOx nanoparticles displayed an increasing trend, as observed in the temperature ramp of Fig. 4b. As described, the as-synthesized AuTiOx nanoparticles were observed to consist of an Au core overlayed by an AuTiOx shell. The small signal of the AuTiOx nanoparticles at low temperatures can likely be attributed to the fact that there is only a small number of Au atoms in the surface of the shell, which is otherwise mostly composed of TiOx that by itself is inactive for CO oxidation. At higher temperatures, the AuTiOx nanoparticles in Fig. 4b and c are characterized by an increase over time in the CO oxidation rate at each temperature step.
A hypothesis to explain the observed increase in CO production over time by the AuTiOx nanoparticles could be derived from the activation time scale. In Fig. 4c–e, after a rapid initial increase, the CO2 TOF keeps increasing linearly for several hours. The initial rise speed seems to be directly proportional to the temperature, reaching a linear increase zone faster at higher temperatures (Fig. S11, ESI†). A suggested mechanism to explain this could be based on thermally enhanced mobility or diffusion of Au atoms into the TiOx shell, similar to what has been observed for Ni–Au core–shell structures.41,42 This progressive migration could cause the exposure of more Au atoms on the surface, thereby enhancing the CO oxidation performance. The migration process may arise from an equilibrium between the segregated core–shell structure and alloyed AuTiOx, which could depend on the temperature and surface adsorbates.43 Notably, the structural changes appear to be partially reversible, as evidenced by the similar activation behavior observed during each temperature ramp in Fig. 4c. Since a migration would be kinetically limited, after leaving the AuTiOx μ-reactor at high temperature for long time (>10 h) and subsequently ramping the temperature down and up again, the activity would be expected to remain similar, and not undergo the same activation. In Fig. 4c this trend seems to be observed: in the fifth temperature ramp at 300 °C, the sample shows activities that are slightly higher than the ones in the fourth ramp, possibly suggesting an incomplete migration of Au atoms in the nanoparticle core. Another observation which could be explained by a migration mechanism is the sudden increase in activity to full conversion after ∼17 h. This could indicate the moment when the surface is filled with Au sites, and therefore most active for CO oxidation.
An alternative and perhaps complementary phenomenon could entail the diffusion of CO and O2 molecules through a porous shell toward the Au core, followed by CO oxidation and out-diffusion of CO2. At approximately 170 °C, a substantial increase in the QMS CO2 signal could suggest accelerated diffusion of CO, O2, and CO2. This increase is particularly pronounced until around 250 °C, beyond which it becomes less evident, indicating that the process might no longer be limited by diffusion. Diffusion of reactant gases through shell layers has previously been studied by Y. Yin et al. in 2013.44 In their study, the authors designed stable nanostructured materials by encapsulating them in shells of metal oxides (e.g., TiO2) and making them porous by “surface-protected etching”. A similar mechanism was proposed by J. Wang et al.29 However, in both studies a different synthesis technique was used (“surface-protected etching” and melamine induced permeable TiOx, respectively), and the AuTiOx nanoparticles were an order of magnitude larger than the nanoparticles in this work, making the comparison difficult. Moreover, such a diffusive mechanism would not explain why the catalyst remains more active after consecutive ramps (Fig. 4c) nor the reason behind the linear increase in activity. A combination of the two phenomena could therefore be at play, but more experiments would be necessary to investigate the mechanism responsible for the increase in catalytic activity.
Structure of the nanoparticles after reaction
The observed deactivation behavior of the Au nanoparticles is suspected to be caused by sintering effects. To investigate potential differences in sintering between the samples, SEM images of the μ-reactors were acquired before and after the reaction tests. The results are shown in Fig. 5. The Au sample underwent 3 temperature ramps at 200–250 °C and one 24 h stability test at 200 °C. The AuTiOx samples were instead exposed to harsher conditions: 4 temperature ramps to 250–320 °C and one >100 h stability test at temperatures up to 300 °C. The resolution of the SEM images is limited owing to the non-conductive substrate (50 nm of TiO2 on top of 50 nm of SiO2 on 350 μm of Si). However, significant sintering was observed for the Au sample (shown in Fig. 5a) before and after reaction, where the average particle size was observed to have increased to 7.6 ± 0.7 nm after reaction. Details on the SEM size measurements are described in ESI† Section S6. Some degree of sintering can already be seen before the reaction, and after the reaction it is significantly more pronounced. It should be noted that the particle size after reaction being calculated from the SEM image might lead to a mild overestimation due to edge blurring which makes smaller nanoparticles hard to resolve. However, the increase in average nanoparticle size for the Au sample is clear. The higher amount of Au particles on the surface after reaction is also indicative of sintering, as more particles become big enough to be resolved with SEM compared to before.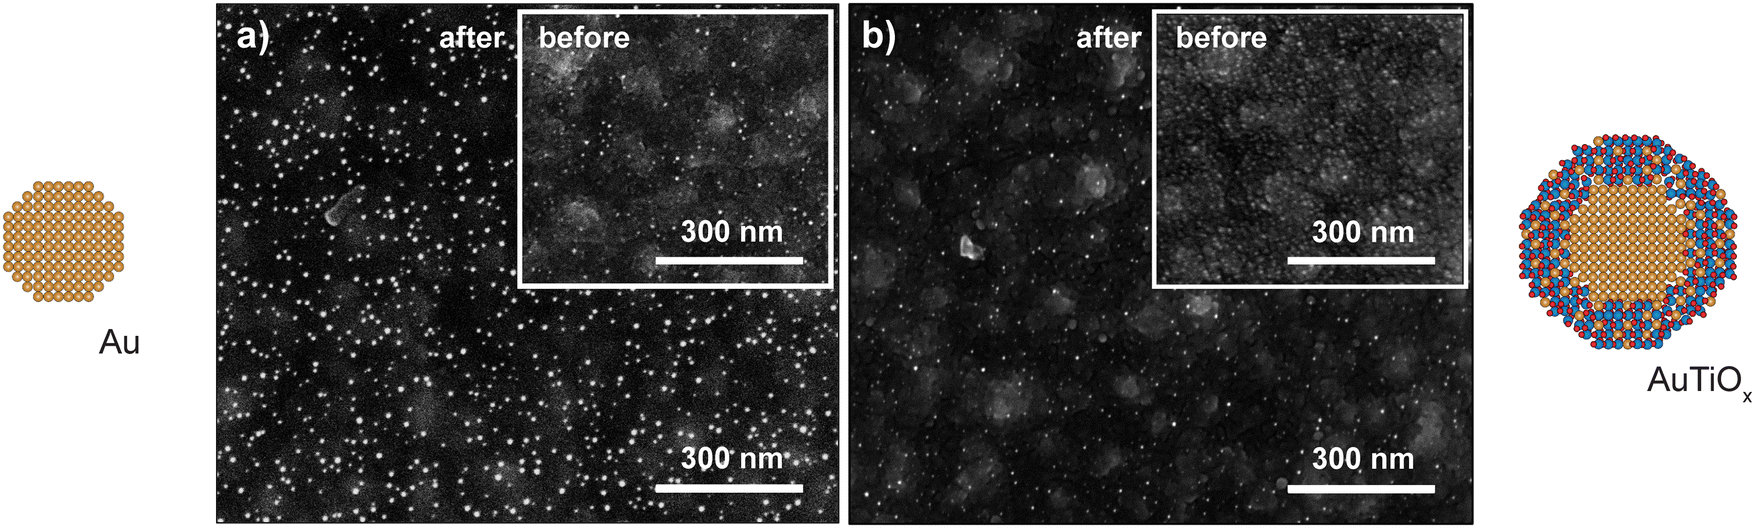 | ||
| Fig. 5 Sintering after catalytic testing was observed to be more severe for the Au nanoparticles. SEM images of the (a) Au and (b) AuTiOx nanoparticles on the μ-reactors before and after reaction. All SEM images were taken with a TLD secondary electron detector with a beam acceleration voltage of 5 kV. Images pixel size: 0.68 nm (a, before), 0.62 nm (a, after), 0.83 nm (b, before), 0.62 nm (b, after). More images at different magnifications are available in ESI† Section S6. | ||
Despite the harsher conditions at which the AuTiOx samples were exposed, the nanoparticles showed a remarkable stability throughout all the catalytic experiments. In the post reaction SEM picture shown in Fig. 5b, the nanoparticles are comparable in size to the image taken before reaction (inset), and evidently smaller compared to the equivalent image for the Au system. The AuTiOx sample shows a narrow particle size distribution, except for minor sintering in some parts of the μ-reactor surface (Fig. S14, ESI†). The possibility of obtaining a good focus on both the nanoparticles and the TiO2 substrate may further indicate a small and narrow nanoparticle size distribution. The SEM image quality was not high enough to extrapolate an accurate particle size distribution, therefore, the increased stability was observed qualitatively by the absence of bigger particles post-reaction (as in the Au nanoparticles case).
To study the Au distribution in the AuTiOx nanoparticles after reaction, the μ-reactor sample with demonstrated activity performance in Fig. 4c was also opened after the activity tests and loaded back into the cluster source chamber to study the nanoparticle structure with ISS depth profiling experiments. The same settings as the post-deposition ISS were used and survey scans were run continuously to achieve a gradual sputtering of the surface. Fig. 6 shows the ISS spectra at various cycle numbers, as well as a comparison to the spectrum from before the activity measurements (black spectrum in Fig. 6a). The intensity has been normalized to the Ti peak for all spectra to allow a comparison of how the Au/Ti ratio changes through the cycles. It should be noted that after the sample has been exposed to air, the first ISS cycles show only a broad background signal until the layer of surface adsorbates from the air exposure are removed, so these data have been omitted in Fig. 6, but are shown for reference in ESI† Section S7.
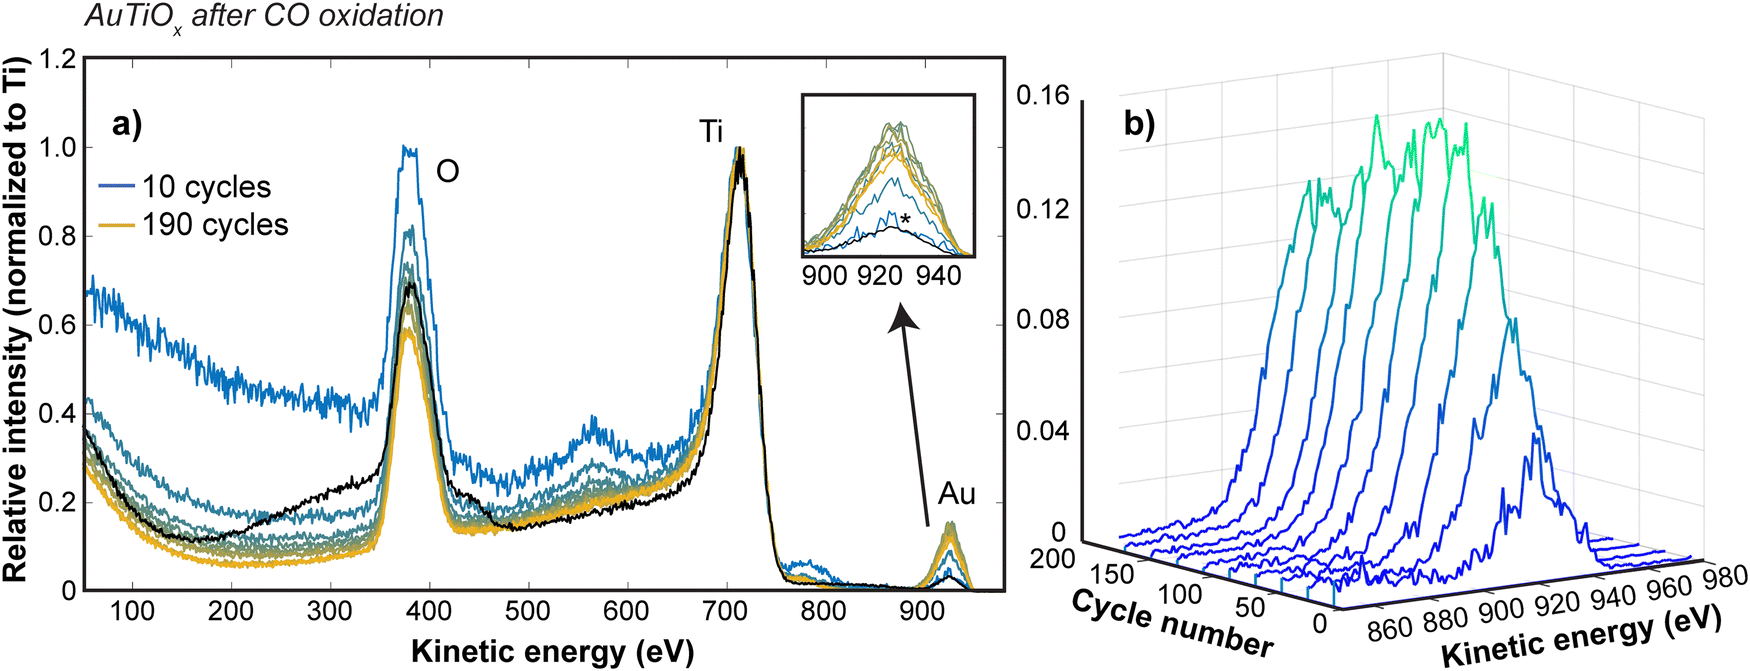 | ||
| Fig. 6 ISS sputter profile of the AuTiOx nanoparticles on the TiO2 substrate after the activity tests. Before the ISS measurement, the nanoparticles were exposed to air when opening the μ-reactors after activity tests. (a) Survey spectra at various sputter depths (1 keV, 1 mA emission current). The black spectrum in (a) shows the reference spectrum from before activity tests. The other spectra from blue (10 cycles) to yellow (190 cycles) show the ISS spectra at every 20 ISS cycles for the sample after activity tests. All spectra have been normalized such that the Ti peak corresponds to a relative intensity of 1, to make them comparable. The inset in (a) shows a zoomed focus on how the Au signal (relative to Ti) changes with the sputter depth. It shows that the Au signal before activity tests (black) is comparable to the signal subsequent to activity tests after the first 10 cycles (marked *). To make the Au signal variation with sputter depth easier to interpret, the Au part of the spectrum has been plotted with a waterfall plot in (b). The figure shows that the Au signal first increases, and then after about 130 cycles starts to decrease again, suggesting that the Au concentration still gradually increases from the surface of the nanoparticles towards the center after activity tests. | ||
The Au signal before activity measurements is comparable to the Au signal observed after the first 10 cycles, suggesting that the amount of Au in the outer surface of the nanoparticles is similar to before the activity tests. Furthermore, in Fig. 6b, the variation in the Au signal is shown at intervals of 20 cycles up to 190 cycles. The Au signal undergoes a steady increase with the sputter depth, suggesting that a nanoparticle structure with an increasing amount of Au towards the center of the nanoparticles is still intact after activity measurements. This observation therefore confirms that the core–shell structure is maintained after the reaction and supports the discussed hypotheses related to the possible activation mechanisms during reaction.
Stability under reactive conditions in TEM
To further characterize the structural stability, the Au and AuTiOx nanoparticles were deposited onto SiNx FEI NanoEx MEMS heater chips35 and examined separately by HRTEM during exposure to 2 mbar O2 and 1 mbar CO at elevated temperatures, as outlined in the ESI† Section S8. HRTEM images were acquired in an “intermittent” way at different locations that were previously unexposed to the electron beam at earlier stages of the experiment. This imaging approach suppressed contamination that was observed to accumulate in the AuTiOx experiment for specific areas that were consecutively irradiated for prolonged periods during exposure to the reaction environment (details in ESI† Section S9).Fig. 7 shows HRTEM images of the Au and AuTiOx nanoparticles acquired during exposure to the CO oxidation reaction environments at elevated temperatures. Specifically, Fig. 7a–d show dark circular features with diameters of ∼2.1 nm matching the average diameter of Au clusters exiting the cluster source (Fig. S6, ESI†). At the lowest temperatures of 100 °C and 200 °C, visual inspection indicates that coverage, size, and shape of the nanoparticles appear similar (Fig. 7a and b). At 250 °C, a brighter contrast feature (track) is associated with a few of the nanoparticles (Fig. 7c) and at 400 °C almost all nanoparticles are associated with such tracks. Moreover, Fig. S22 (ESI†) shows tracks extending beyond an edge termination of the SiNx support. These findings suggest that the tracks reflect filamentous materials growing between the Au nanoparticle surfaces and the SiNx support. In this view, irregular filamentous structures in arbitrary 3D orientations can in part explain the various shapes of the tracks observed in the two-dimensional projection geometry of HRTEM imaging. HRTEM images acquired near zero defocus show lattice fringes in the filaments indicating that they are crystalline (Fig. S23, ESI†). Based on the crystallinity and distinct contrast of the filament, it is likely a material phase different from both support and nanoparticles. Further analysis is not pursued here. However, it is noted that similar filament growths have previously been reported for metal nanoparticles supported on MgO.45
 | ||
| Fig. 7 Behavior of Au and AuTiOx nanoparticles under CO oxidation conditions. HRTEM micrographs of Au nanoparticles in (a)–(d) and AuTiOx nanoparticles in (e)–(h) acquired in situ at the indicated temperatures and during exposure to 1 mbar CO and 2 mbar O2. The individual images are cropped from original ones taken at different locations. Image pixel size: 0.037 nm per pixel. | ||
Fig. 7e–h show HRTEM images of the AuTiOx particles acquired similarly in situ under exposure to the CO oxidation reaction conditions at variable temperatures. The images reveal that the projected shape and size of the majority of the nanoparticles remained constant. While several of the nanoparticles appear to be in close proximity without any structural changes in the projected core–shell contrasts, a few nanoparticles do appear with irregular shapes that could be due to incomplete coalescence.
The stability of the Au and AuTiOx nanoparticles differs mainly by the interaction with the SiNx support. While the Au nanoparticles create filamentous materials, AuTiOx nanoparticles suppress the interaction with the support, suggesting that the TiOx shell acts as a protective layer. This result extends the previous findings of reduced STEM beam-induced sintering for AuTiOx nanoparticles in comparison to Au nanoparticles when supported on SiO2.32
Conclusions
This work demonstrates that AuTiOx alloy nanoparticles on TiO2 exhibit superior stability compared to Au nanoparticles during CO oxidation. The AuTiOx nanoparticles were observed to have a core–shell structure which is thought to aid the stability of the nanoparticles through a self-anchoring effect on the TiO2 support, similar to stabilization by encapsulation by the support.28–30 The core–shell structure of the AuTiOx nanoparticles was observed to be stable under reactive conditions in the electron microscope and after activity tests using depth profiling experiments. Over time, an increase in the CO oxidation rate was observed for the AuTiOx system, likely due to an equilibrium between the Au/TiOx core/shell structure and its alloyed form. Both processes would be highly dependent on temperature, explaining the low activity at lower temperatures for AuTiOx. Further characterization of the catalyst structure would be needed to fully elucidate the activation mechanisms and structure dynamics for the system. Employing advanced characterization techniques, such as in situ and operando spectroscopy (e.g., near ambient pressure-XPS, extended X-ray absorption fine structure or electron energy loss spectroscopy) could provide valuable insights into the dynamic evolution and chemical state of the catalyst during and after CO oxidation reaction, gaining information such as the real-time ratio between Au/Ti on the outermost surface of the catalyst.20Despite strongly improving the stability, the AuTiOx nanoparticles exhibit a decreased catalytic activity. Nevertheless, the catalytic performance of the AuTiOx system could be further optimized by exploring the effect of different TiO2 support phases, varying the Au/Ti ratio or core/shell thickness, or testing other support materials and Au nanoparticle metal alloys.31 The influence of reaction conditions, such as pressure and reactant composition on the nanoparticle structure should also be considered. The findings presented complement other studies on Au–Ti(Ox) catalysts synthesized via physical methods,28,29,32 and demonstrate how cluster beam methods can allow for fine-tuning of catalyst structures by enabling consistent synthesis of well-defined nanoparticle compositions. The work also highlights the importance of obtaining an accurate characterization of the nanoparticle structure in evaluating the performance. It lays the groundwork for further research and development of alloy nanoparticle catalysts, contributing to the design of more efficient and stable catalysts for a wide range of industrial applications.
Author contributions
Rikke Egeberg Tankard: investigation, methodology, formal analysis, writing – original draft. Filippo Romeggio: investigation, methodology, formal analysis, writing – original draft. Stefan Kei Akazawa: investigation, methodology, formal analysis, writing – original draft. Alexander Krabbe: methodology. Olivia Fjord Sloth: methodology. Niklas Mørch Secher: investigation, methodology. Sofie Colding-Fagerholt: investigation, formal analysis. Stig Helveg: writing – review & editing, conceptualization, resources, supervision. Richard Palmer: writing – review & editing, conceptualization, resources. Christian Danvad Damsgaard: writing – review & editing, supervision. Jakob Kibsgaard: writing – review & editing, supervision. Ib Chorkendorff: writing – review & editing, conceptualization, resources, supervision.Conflicts of interest
There are no conflicts to declare.Acknowledgements
The authors are thankful for the funding from the ERC European Union's Horizon 2020 research and innovation program, the EU Marie Skłodowska-Curie Actions-Innovative Training Network Catchy, and the Danish National Research Foundation (Grant no. DNRF146) which made this work possible. The authors thank C. Wei for his assistance in acquiring the XPS data, and J. L. Needham & K. Toudahl for their sparring and general assistance on the cluster source. The authors thank Sven Ullmann for support on the FEI Titan 80-300 ETEM and J. Kryger-Baggesen for his assistance in creating the nanoparticle illustrations. Topsoe A/S is acknowledged for access to its ETEM facility. This work was supported by the Villum Fonden, part of the Villum Center for the Science of Sustainable Fuels and Chemicals (V-SUSTAIN grant 9455), the European Research Council (ERC) CLUNATRA under the European Union's Horizon 2020 research and innovation program (grant agreement no. 741860), by the European Union under the Marie Skłodowska-Curie Actions-Innovative Training Network Catchy (grant agreement no. 955650), and The Center for Visualizing Catalytic Processes (VISION) is sponsored by the Danish National Research Foundation (Grant no. DNRF146).Notes and references
- J. K. Nørskov, A. Latimer and C. F. Dickens, Eds., 2019, https://sunergy-initiative.eu/project/energy-x-research-needs-report/.
- Z. W. Seh, J. Kibsgaard, C. F. Dickens, I. Chorkendorff, J. K. Nørskov and T. F. Jaramillo, Science, 2017, 355, eaad4998 CrossRef PubMed.
- J. Kibsgaard and I. Chorkendorff, Nat. Energy, 2019, 4, 430–433 CrossRef.
- R. M. Bullock, J. G. Che, L. Gagliardi, P. J. Chiri, O. K. Farh, C. H. Hendo, C. W. Jone, J. A. Keit, J. Klosin, S. D. Mintee, R. H. Morri, A. T. Radosevic, T. B. Rauchfus, N. A. Strotma, A. Vojvodic, T. R. War, J. Y. Yan and Y. Surendranath, Science, 2020, 369, eabc318 CrossRef PubMed.
- M.-L. Sun, Z.-P. Hu, H.-Y. Wang, Y.-J. Suo and Z.-Y. Yuan, ACS Catal., 2023, 13, 4719–4741 CrossRef CAS.
- J. A. Hernández, S. A. Gómez, T. A. Zepeda, J. C. Fierro-González and G. A. Fuentes, ACS Catal., 2015, 5, 4003–4012 CrossRef.
- L. Liu and A. Corma, Nat. Rev. Mater., 2021, 6, 244–263 CrossRef CAS.
- Y. Wang, X. Zheng and D. Wang, Nano Res., 2022, 15, 1730–1752 CrossRef CAS.
- F. Behafarid and B. R. Cuenya, Top. Catal., 2013, 56, 1542–1559 CrossRef CAS.
- T. Ishida, T. Murayama, A. Taketoshi and M. Haruta, Chem. Rev., 2020, 120, 464–525 CrossRef CAS PubMed.
- S. Han and C. B. Mullins, Acc. Chem. Res., 2021, 54, 379–387 CrossRef CAS PubMed.
- X. Cai, G. Li, W. Hu and Y. Zhu, ACS Catal., 2022, 12, 10638–10653 CrossRef CAS.
- M. Haruta, T. Kobayashi, H. Sano and N. Yamada, Chem. Lett., 1987, 16, 405–408 CrossRef.
- M. Haruta, S. Tsubota, T. Kobayashi, H. Kageyama, M. J. Genet and B. Delmon, J. Catal., 1993, 144, 175–192 CrossRef CAS.
- M. Valden, X. Lai and D. W. Goodman, Science, 1998, 281, 1647–1650 CrossRef CAS PubMed.
- M. Valden, S. Pak, X. Lai and D. W. Goodman, Catal. Lett., 1998, 56, 7–10 CrossRef CAS.
- B. Hvolbæk, T. V. W. Janssens, B. S. Clausen, H. Falsig, C. H. Christensen and J. K. Nørskov, Nano Today, 2007, 2, 14–18 CrossRef.
- T. Fujitani, I. Nakamura and A. Takahashi, ACS Catal., 2020, 10, 2517–2521 CrossRef CAS.
- J. Saavedra, C. J. Pursell and B. D. Chandler, J. Am. Chem. Soc., 2018, 140, 3712–3723 CrossRef CAS PubMed.
- T. Fujitani and I. Nakamura, Angew. Chem., Int. Ed., 2011, 50, 10144–10147 CrossRef CAS PubMed.
- J. Saavedra, H. A. Doan, C. J. Pursell, L. C. Grabow and B. D. Chandler, Science, 2014, 345, 1599–1602 CrossRef CAS PubMed.
- M. Haruta, Angew. Chem., Int. Ed., 2014, 53, 52–56 CrossRef CAS PubMed.
- T. W. van Deelen, C. Hernández Mejía and K. P. de Jong, Nat. Catal., 2019, 2, 955–970 CrossRef CAS.
- T. Takei, T. Akita, I. Nakamura, T. Fujitani, M. Okumura, K. Okazaki, J. Huang, T. Ishida and M. Haruta, Adv. Catal., 2012, 55, 1–126 CAS.
- F. Kettemann, S. Witte, A. Birnbaum, B. Paul, G. Clavel, N. Pinna, K. Rademann, R. Kraehnert and J. Polte, ACS Catal., 2017, 7, 8247–8254 CrossRef CAS.
- N. Kapil, T. Weissenberger, F. Cardinale, P. Trogadas, T. A. Nijhuis, M. M. Nigra and M.-O. Coppens, Angew. Chem., Int. Ed., 2021, 60, 18185–18193 CrossRef CAS PubMed.
- B. K. Min, W. T. Wallace and D. W. Goodman, J. Phys. Chem. B, 2004, 108, 14609–14615 CrossRef CAS.
- H. Tang, Y. Su, B. Zhang, A. F. Lee, M. A. Isaacs, K. Wilson, L. Li, Y. Ren, J. Huang, M. Haruta, B. Qiao, X. Liu, C. Jin, D. Su, J. Wang and T. Zhang, Sci. Adv., 2017, 3, e1700231 CrossRef PubMed.
- S. Liu, W. Xu, Y. Niu, B. Zhang, L. Zheng, W. Liu, L. Li and J. Wang, Nat. Commun., 2019, 10, 5790 CrossRef CAS PubMed.
- S. Kaiser, J. Plansky, M. Krinninger, A. Shavorskiy, S. Zhu, U. Heiz, F. Esch and B. A. J. Lechner, ACS Catal., 2023, 13, 6203–6213 CrossRef CAS.
- R. Zanella, V. Rodríguez-González, Y. Arzola and A. Moreno-Rodriguez, ACS Catal., 2012, 2, 1–11 CrossRef CAS.
- Y. Niu, P. Schlexer, B. Sebok, I. Chorkendorff, G. Pacchioni and R. E. Palmer, Nanoscale, 2018, 10, 2363–2370 RSC.
- F. Yin, Z. W. Wang and R. E. Palmer, J. Am. Chem. Soc., 2011, 133, 10325–10327 CrossRef CAS PubMed.
- T. R. Henriksen, J. L. Olsen, P. Vesborg, I. Chorkendorff and O. Hansen, Rev. Sci. Instrum., 2009, 80, 124101 CrossRef PubMed.
- L. Mele, S. Konings, P. Dona, F. Evertz, C. Mitterbauer, P. Faber, R. Schampers and J. R. Jinschek, Microsc. Res. Tech., 2016, 79, 239–250 CrossRef PubMed.
- S. Pratontep, S. J. Carroll, C. Xirouchaki, M. Streun and R. E. Palmer, Rev. Sci. Instrum., 2005, 76, 045103 CrossRef.
- B. Von Issendorff and R. E. Palmer, Rev. Sci. Instrum., 1999, 70, 4497–4501 CrossRef CAS.
- V. N. Popok, I. Barke, E. E. B. Campbell and K.-H. Meiwes-Broer, Surf. Sci. Rep., 2011, 66, 347–377 CrossRef CAS.
- J. R. Jinschek and S. Helveg, Micron, 2012, 43, 1156–1168 CrossRef CAS PubMed.
- P. C. K. Vesborg, J. L. Olsen, T. R. Henriksen, I. Chorkendorff and O. Hansen, Rev. Sci. Instrum., 2010, 81, 016111 CrossRef PubMed.
- X. Zhang, S. Han, B. Zhu, G. Zhang, X. Li, Y. Gao, Z. Wu, B. Yang, Y. Liu, W. Baaziz, O. Ersen, M. Gu, J. T. Miller and W. Liu, Nat. Catal., 2020, 3, 411–417 CrossRef CAS.
- M. Schnedlitz, M. Lasserus, R. Meyer, D. Knez, F. Hofer, W. E. Ernst and A. W. Hauser, Chem. Mater., 2018, 30, 1113–1120 CrossRef CAS.
- J. C. Matsubu, S. Zhang, L. DeRita, N. S. Marinkovic, J. G. Chen, G. W. Graham, X. Pan and P. Christopher, Nat. Chem., 2017, 9, 120–127 CrossRef CAS.
- Q. Zhang, I. Lee, J. B. Joo, F. Zaera and Y. Yin, Acc. Chem. Res., 2013, 46, 1816–1824 CrossRef CAS.
- A. G. Nasibulin, L. Sun, S. Hämäläinen, S. D. Shandakov, F. Banhart and E. I. Kauppinen, Cryst. Growth Des., 2010, 10, 414–417 CrossRef CAS.
Footnotes |
| † Electronic supplementary information (ESI) available: Additional experimental methods, further calibration and data analysis details, and supporting microscopy and spectroscopy information. See DOI: https://doi.org/10.1039/d4cp00211c |
| ‡ These authors contributed equally. |
| This journal is © the Owner Societies 2024 |