
The impact of solvation on the structure and electric field strength in Li+GlyGly complexes†
Katharina A. E.
Meyer
 and
Etienne
Garand
*
and
Etienne
Garand
*
University of Wisconsin-Madison, Department of Chemistry, 1101 University Ave, Madison, WI 53706, USA. E-mail: egarand@wisc.edu
First published on 16th April 2024
Abstract
To scrutinise the impact of electric fields on the structure and vibrations of biomolecules in the presence of water, we study the sequential solvation of lithium diglycine up to three water molecules with cryogenic infrared action spectroscopy. Conformer-specific IR–IR spectroscopy and H2O/D2O isotopic substitution experiments provide most of the information required to decipher the structure of the observed conformers. Additional confirmation is provided by scaled harmonic vibrational frequency calculations using MP2 and DFT. The first water molecule is shown to bind to the Li+ ion, which weakens the electric field experienced by the peptide and as a consequence, also the strength of an internal NH⋯NH2 hydrogen bond in the diglycine backbone. The strength of this hydrogen bond decreases approximately linearly with the number of water molecules as a result of the decreasing electric field strength and coincides with an increase in the number of conformers observed in our spectra. The addition of two water molecules is already sufficient to change the preferred conformation of the peptide backbone, allowing for Li+ coordination to the lone pair of the terminal amine group.
1 Introduction
The impact of electric fields on the structure and function of biomolecules is a well-known, though not well understood phenomenon. Prominent in this regard are enzymes, whose catalytic function is highly dependent on local electric fields around the active site. An example is the zinc-based enzyme histone deacetylase 8, which catalyses a deacetlylation reaction important in the post-translational modification during the biosynthesis of proteins.1,2 Close to the active Zn site of that enzyme is a potassium ion, without which the reaction is not taking place.1,2 While the exact role of the K+ ion is not known, its electric field is thought to prestructure the sourroundings around the active site.2 For a clearer insight into electrostatic preorganisation, the impact of electric fields of metal ions on the structure of biomolecules needs to be examined in greater detail.Computational modelling and optimisation of electric fields is a very active field of research in (enzyme) catalysis,3,4 but electric field strengths in biomolecules and changes in structure upon variation of those can also be probed experimentally, typically via vibrational Stark spectroscopy in the condensed phase where the frequency shift of a vibrational probe is utilised to obtain information about the local electric field.5–8 Gas phase studies of electric field effects on the vibrations and structures of molecules or molecular clusters in the presence of different metal ions have also gained significant interest in recent years, particularly exploiting the series of alkali and alkaline earth metals.9–13 The advantage of such spectroscopic gas phase studies compared to similar studies in the condensed phase is the ability to prepare well-defined model complexes exploiting the mass selectivity afforded by mass spectrometry. This enables in depth studies of the interplay of the various non-covalent interactions and significantly enhances the level of information that can be obtained, especially if the spectroscopic studies are performed at cryogenic temperatures. There are numerous vibrational studies targeting the interplay of non-covalent interactions in model systems for biomolecules in the gas phase. Examples include the structural analysis of oligosaccharides,14,15 lipids,16,17 metal ion-amino acid and -peptide complexes,12,18–25 studies of model peptides for the selectivity filter of potassium ion channels,26–28 solvation studies of biomolecules,29–33 and solvent-induced protomer switching,34–37 to name just a few.
In order to make meaningful comparisons from gas phase studies and apply them to condensed phase systems, it is important to systematically include effects of the condensed phase environment, e.g., solvent–solute interactions. This is typically done in microsolvation studies by sequentially increasing the number of solvent molecules.30,31 One challenge, however, is the spectral overlap of vibrational features of solvent molecules such as water with indicative bands for the local structure in biomolecules such as OH, NH2, NH, and C![[double bond, length as m-dash]](https://www.rsc.org/images/entities/char_e001.gif) O stretching and bending vibrations, in addition to the steep increase in spectral congestion upon water hydrogen bonding.32 One way to decipher the spectral features of the biomolecule from those of the solvent and monitor changes as a function of the number of solvent molecules is to compare spectra of the biomolecule clustered with H2O to those using D2O as solvent, as the D2O stretching and bending vibrations overlap to a lesser extent with the structurally characteristic peptide vibrations.31 To avoid H/D exchange between the biomolecule and the deuterated solvent that would impair the level of information that can be obtained from the spectra, the D2O clusters can be prepared in cryogenic ion traps via the re-condensation of solvent molecules onto the biomolecule where minimal H/D exchange is observed if the ion temperature is sufficiently low.31
O stretching and bending vibrations, in addition to the steep increase in spectral congestion upon water hydrogen bonding.32 One way to decipher the spectral features of the biomolecule from those of the solvent and monitor changes as a function of the number of solvent molecules is to compare spectra of the biomolecule clustered with H2O to those using D2O as solvent, as the D2O stretching and bending vibrations overlap to a lesser extent with the structurally characteristic peptide vibrations.31 To avoid H/D exchange between the biomolecule and the deuterated solvent that would impair the level of information that can be obtained from the spectra, the D2O clusters can be prepared in cryogenic ion traps via the re-condensation of solvent molecules onto the biomolecule where minimal H/D exchange is observed if the ion temperature is sufficiently low.31
In this work, we study the solvation of the model peptide diglycine (GlyGly) in the presence of a Li+ ion to monitor changes of the peptide structure as a function of the number of solvent molecules. The structure of Li+GlyGly has been studied previously with infrared predissociation (IRPD) spectroscopy showing Li+ coordination to the amide and carboxylic acid carbonyl groups and an internal hydrogen bond between the amide NH and the terminal amine in the peptide backbone.12 Interestingly, the strength of this NH⋯NH2 hydrogen bond depends on the metal ion and was shown to decrease in strength when the metal ion is changed from Li+ to Na+ and K+ as a result of the decreasing electric field strength with larger metal ion-peptide distances.12 The addition of water to these complexes likely reduces the electric field strength experienced by the peptide and thereby also the strength of the hydrogen bond in the peptide backbone, as it increases the distance between the metal ion and the peptide if coordinating to the metal ion. By studying the solvation of Li+GlyGly complexes with H2O and D2O up to three water molecules with cryogenic infrared action spectroscopy, conformer-specific IR–IR spectroscopy, and scaled harmonic MP2 and DFT calculations, we show that the decrease in internal hydrogen bond strength by the addition of water is approximately linear with the number of water molecules. Expectedly, this decrease in strength is accompanied by an increase in population of conformers without this hydrogen bond in the peptide backbone. The addition of two water molecules is sufficient to change the preferred peptide conformation leading to structures where the terminal amine group is binding to the metal ion instead of accepting a hydrogen bond from the amide NH group. Favorably, experimental assignment aides such as isotopic labeling of the solvent and the conformer-specific IR–IR experiments are most decisive for spectral assignments, whereas the scaled harmonic vibrational frequency calculations take a supporting role. Comparison of the band position agreement between the DFT and MP2 calculations and experiment shows that DFT tends to overestimate the strength of water hydrogen bonding, whereas MP2 shows a distinctly better performance for those types of vibrations.
2 Methods
2.1 Experimental technique
Infrared action spectra of the Li+GlyGly-nH/D2O complexes were obtained using a set-up described in detail in previous publications.12,38 Here, only the most relevant features to this work will be briefly highlighted. Li+GlyGly was formed via electrospray ionisation from solutions of LiCl and diglycine using concentrations of 0.20–0.33 mM of LiCl and 0.42–0.51 mM of diglycine in methanol. The complex was guided into a liquid nitrogen-cooled octupole ion trap held at 80 K. Thermalisation of the ions and water clustering on Li+GlyGly was achieved with a gas pulse of nitrogen or helium seeded with either H2O or D2O (concentrations ≤ 3%).39 The thus formed Li+GlyGly-nH/D2O complexes were subsequently transferred into a quadrupole ion trap held at 10 K by a closed-cycle liquid helium cryocooler, where the ions are thermalised by a 1 ms pulse of a 10% mixture of D2 in helium. The addition of D2 to the buffer gas facilitates the formation of weakly bound 1D2 adducts of the Li+GlyGly and Li+GlyGly-1H2O complexes. For the larger water clusters, these 1D2 adducts do not form to a significant extent.For detection, the ions are ejected into a time-of-flight (TOF) mass spectrometer equipped with a two-stage reflectron and a multi-channel plate (MCP) detector. The complex of interest is mass-selected in the TOF tube and intersected with tunable infrared light from an optical parametric oscillator/amplifier (OPO/OPA) laser system operated at 10 Hz (laser linewidth ≈3–5 cm−1). Throughout this work, the laser light is tuned from 3000–3800 cm−1. Upon resonant absorption of a photon, a photofragment appears in the mass spectrum as a result of the loss of either the weakly bound 1D2 adduct in case of the Li+GlyGly-1D2 and Li+GlyGly-1H/D2O-1D2 complexes or the loss of 1H/D2O for the Li+GlyGly-2H/D2O and Li+GlyGly-3H/D2O complexes. The signal of the photofragment is monitored as a function of laser wavenumber to obtain the infrared spectrum. Note that the loss of D2 is a single photon process, whereas the loss of water in the n = 2, 3 complexes is a multi-photon process due to the much higher binding energy of H2O or D2O compared to D2. In case of the absorption of multiple photons, the photofragment ion yield is not strictly linearly correlated to the absorption cross-section and laser power as it is the case for a single photon process.40 This needs to be taken into account when the thus obtained infrared multi-photon (IRMPD) Li+GlyGly-nH/D2O (n = 2, 3) spectra are compared to the spectra of the Li+GlyGly-1D2 and Li+GlyGly-1H/D2O-1D2 complexes or quantum chemical calculations.
To distinguish between conformers of the same mass-to-charge ratio, conformer-specific IR–IR experiments41–43 were performed for the Li+GlyGly-1H2O-1D2 complex by overlapping a second tunable OPO/OPA laser with the ions in the 10 K quadrupole ion trap. By fixing the laser wavenumber of that laser to a band unique to one conformer (3573 cm−1 and 3552 cm−1 in case of Li+GlyGly-1H2O-1D2), the population of the respective conformer is depleted via tag loss in the trap prior to ejection into the TOF, so that upon mass-selection and IR interrogation by the second laser in the TOF tube, only Li+GlyGly-1H2O-1D2 conformers that do not absorb light of this wavenumber are photofragmented. The comparison of the spectra with and without the trap laser on can then be used to identify all bands corresponding to the depleted conformer, which is especially useful if there are only two conformers present (vide infra).
2.2 Computational methods
The conformational landscape of the Li+GlyGly-nH2O complexes has been sampled with the conformer-rotamer ensemble sampling tool (CREST) by the Grimme group using the non-covalent interactions (NCI) mode.44 The minima found by CREST were subsequently pre-optimised in Gaussian 16 (version C.01)45 using B97D/def2-SV(P).46,47 The thus obtained (local) minima on the potential energy surface were optimised using B3LYP-D3(BJ)48–51 followed by harmonic vibrational frequency calculations. To test the predictive power of the calculations, additional harmonic vibrational frequency calculations were performed in Gaussian 1645 using PBE0-D3(BJ), ωB97XD,52 M06-2X,53 and PM3.54,55 For all hybrid functionals, the def2TZVP basis set has been used.47In addition, optimized geometries and Hessians were also computed with MP256,57 and B2PLYP-D3(BJ)50,51,58 in the ORCA program package (version 4.2.1)59–61 using the resolution of identity (RI) approximation62–64 and default frozen core settings where no electrons are frozen for Li. As the basis set for those calculations, aug-cc-pVTZ65 was chosen for the H, C, N, and O atoms and the weighted core-valence cc-pwCVTZ basis set is used for Li+.66 This basis set combination is abbreviated to aVXZ* throughout this work (X = T for MP2 and B2PLYP-D3(BJ)). A detailed list of the keywords used in the harmonic vibrational frequency calculations can be found in Table S1 in the ESI.†
To improve the accuracy of the relative electronic energies, single-point calculations on optimised DFT and MP2 structures were performed for the Li+GlyGly-nH2O complexes (n = 0–2) using the DLPNO-CCSD(T) method67 in ORCA (version 4.2.1) with TightPNO setting.68 As for the perturbative methods, the aVXZ* basis set was chosen (aug-cc-VXZ on H, C, N, and O and cc-pwCVXZ on Li+, with X = Q). B2PLYP-D3(BJ) yielded the lowest single-point DLPNO-CCSD(T) energies closely followed by MP2 and B3LYP-D3(BJ) with structures on average 0.2 and 0.5 kJ mol−1 higher in energy, respectively (see Table S2 in the ESI† for results of all methods). As the scaled harmonic MP2 band position predictions agree best with experiment for hydrogen bonded modes (see Section 4), the relative energy differences for the Li+GlyGly-nH2O complexes (n = 0–2) shown throughout this work were calculated at the MP2/aVTZ* level with the electronic energies replaced by single-point DLPNO-CCSD(T)/aVQZ* energies (DLPNO-CCSD(T)/aVQZ*//MP2/aVTZ*). Due to the increasing computational costs for Li+GlyGly-3H2O, the DLPNO-CCSD(T)/aVQZ* single-point energies were computed on B3LYP-D3(BJ)/def2TZVP geometries and are displayed alongside B3LYP-D3 zero-point and thermal corrections (DLPNO-CCSD(T)/aVQZ*//B3LYP-D3(BJ)/def2TZVP). In addition, all energies have been counterpoise-corrected to account for the basis set superposition error (BSSE).69–71
To account for vibrational anharmonicity, the harmonic vibrational frequencies are scaled to the experimental band position of the OH stretching vibration of Na+GlyGly (3556 cm−1),12 yielding scaling factors between 0.933 and 0.964 for the different methods (see Table S1 in the ESI† for further details). The experimental infrared spectra are compared to scaled (0.958) MP2/aVTZ* harmonic vibrational frequencies for complexes up to two water molecules and the spectra of Li+GlyGly-3H2O are compared to scaled (0.964) B3LYP/def2TZVP calculations.
The spectra of the Li+GlyGly-nH2O-1D2 clusters (n = 0, 1) are compared to calculations without the inclusion of the weakly bound D2 tag, as it is binding to the metal ion and therefore is not expected to change the peptide vibrations significantly. In Table S3 in the ESI,† a comparison of B3LYP-D3(BJ)/def2TZVP band position predictions with and without the tag is shown, verifying that its overall impact on the predicted spectra is small.
To estimate the electric field strength at the midpoint of the OH bond in the Li+GlyGly-nH2O complexes, the charge on the Li+ atom has been approximated with the natural population analysis (NPA) using the natural bond orbital (NBO) program (version 7) by Weinhold and co-workers (see Section 6).72,73
3 Spectral analysis of the Li+GlyGly-nH2O spectra
3.1 Overview of the experimental results
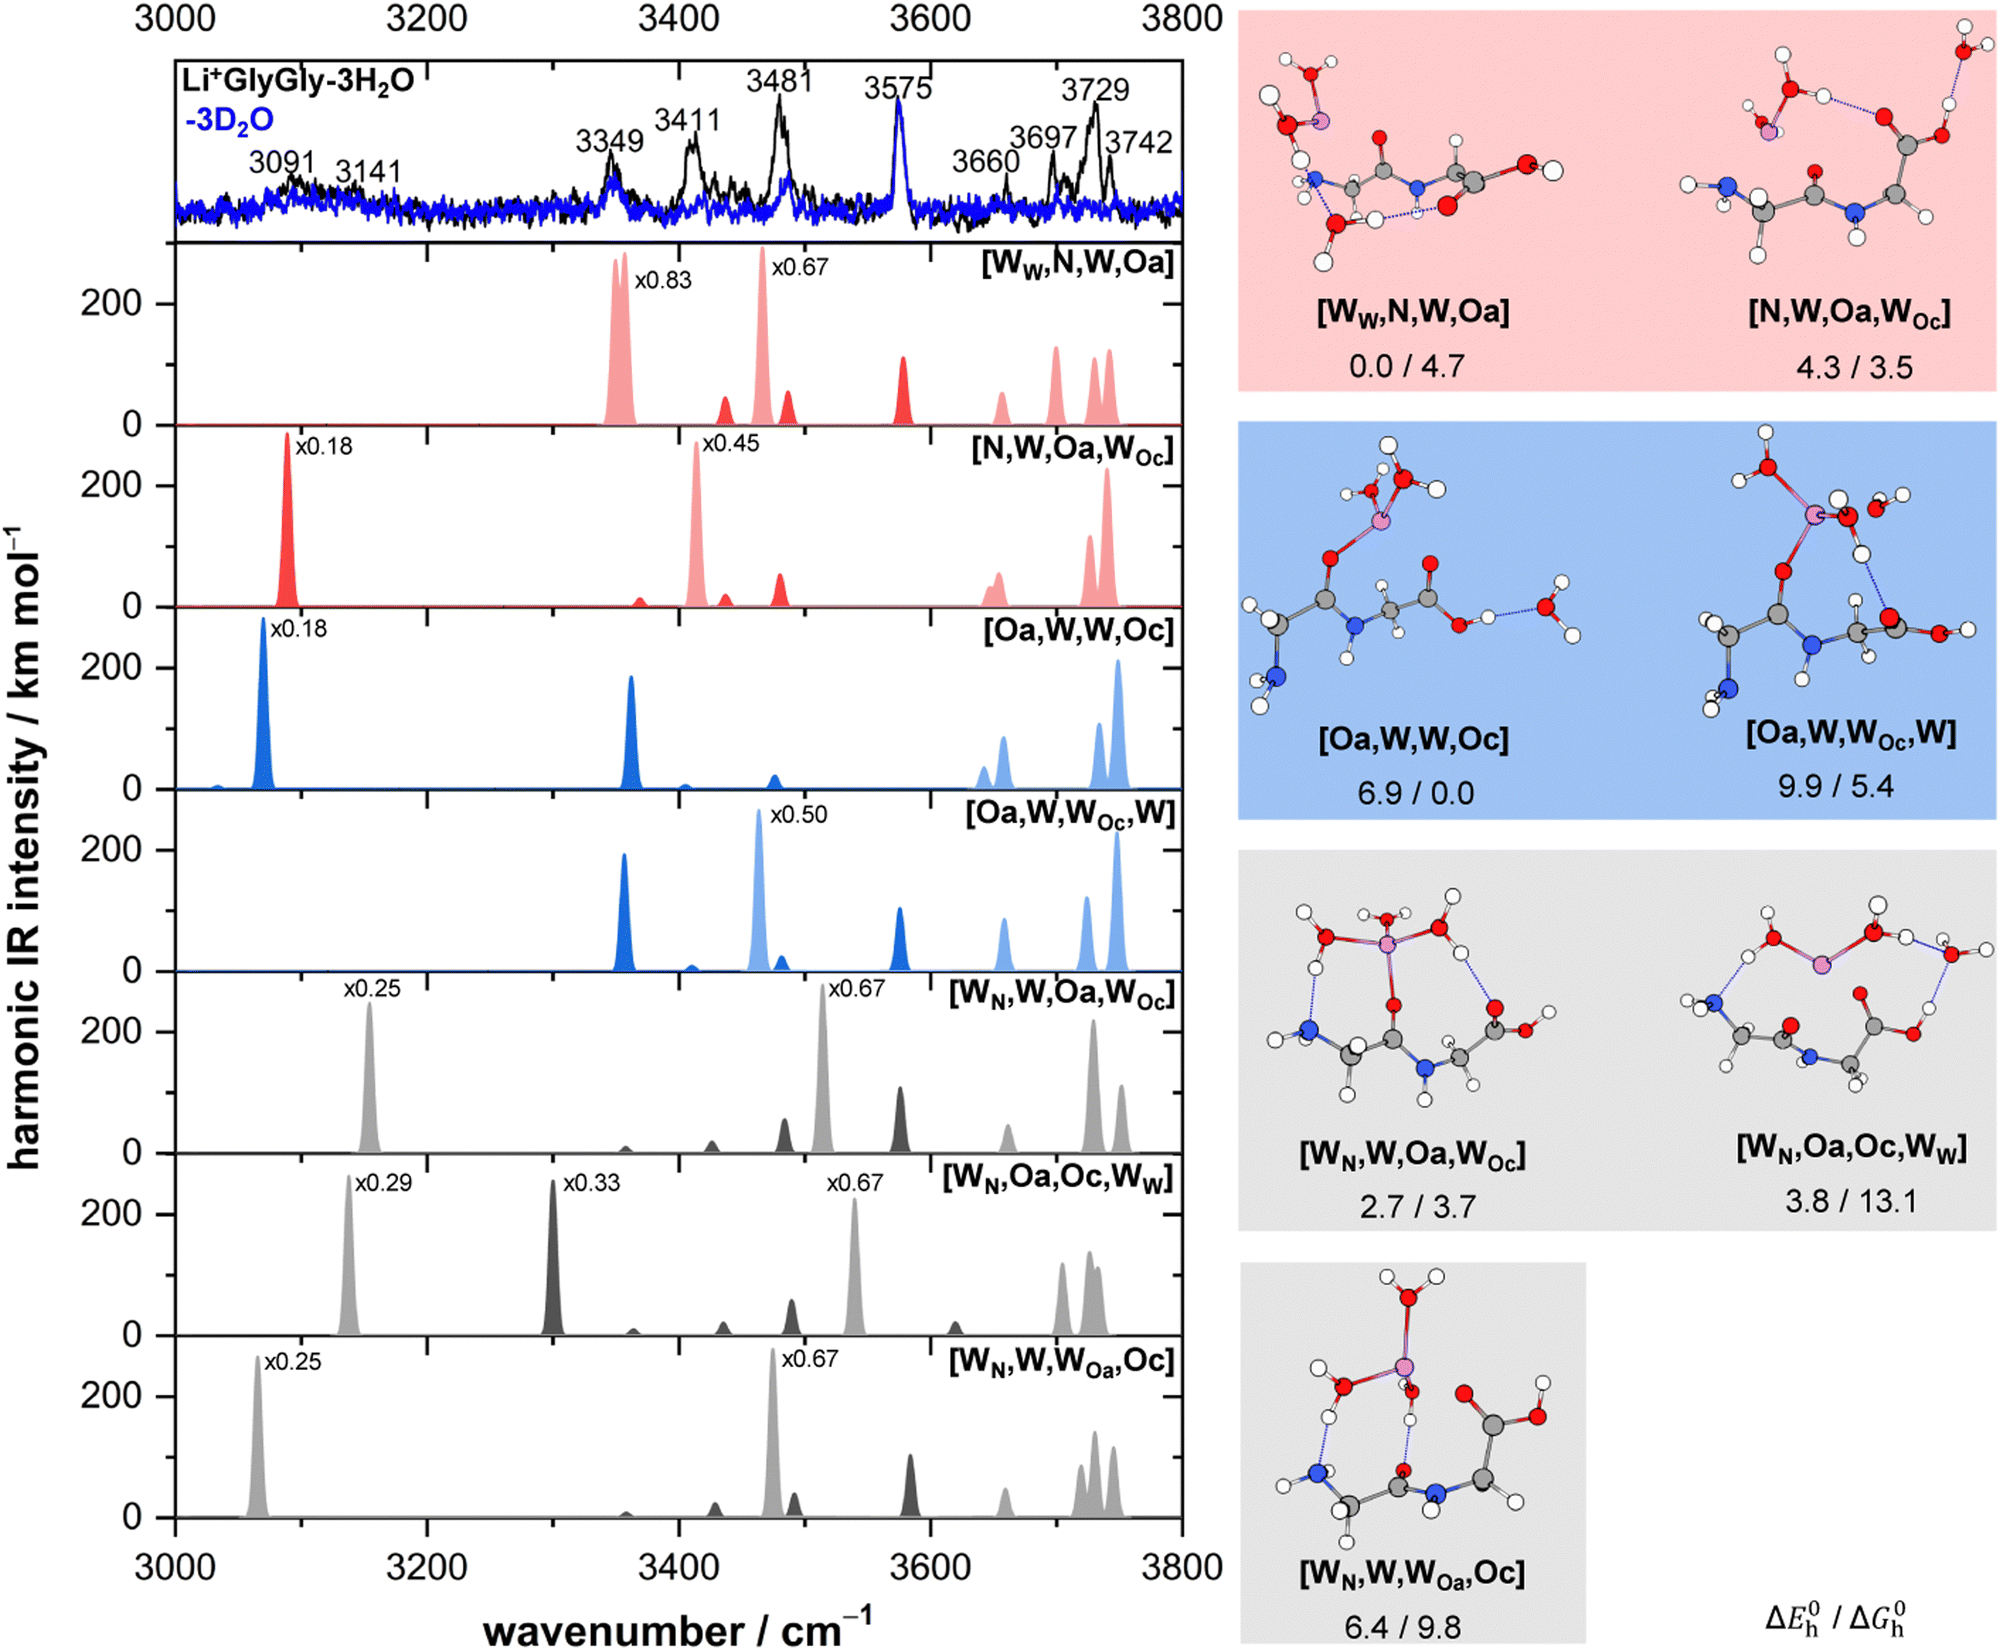
Solvated Li+GlyGly spectra with up to three water molecules are shown in Fig. 1. A comparison of Li+GlyGly spectra using D2O versus H2O is crucial to distinguish bands of peptide and solvent vibrations, as the spectral congestion between 3000–3800 cm−1 significantly increases with the number of water molecules due to strong hydrogen bonding interactions.31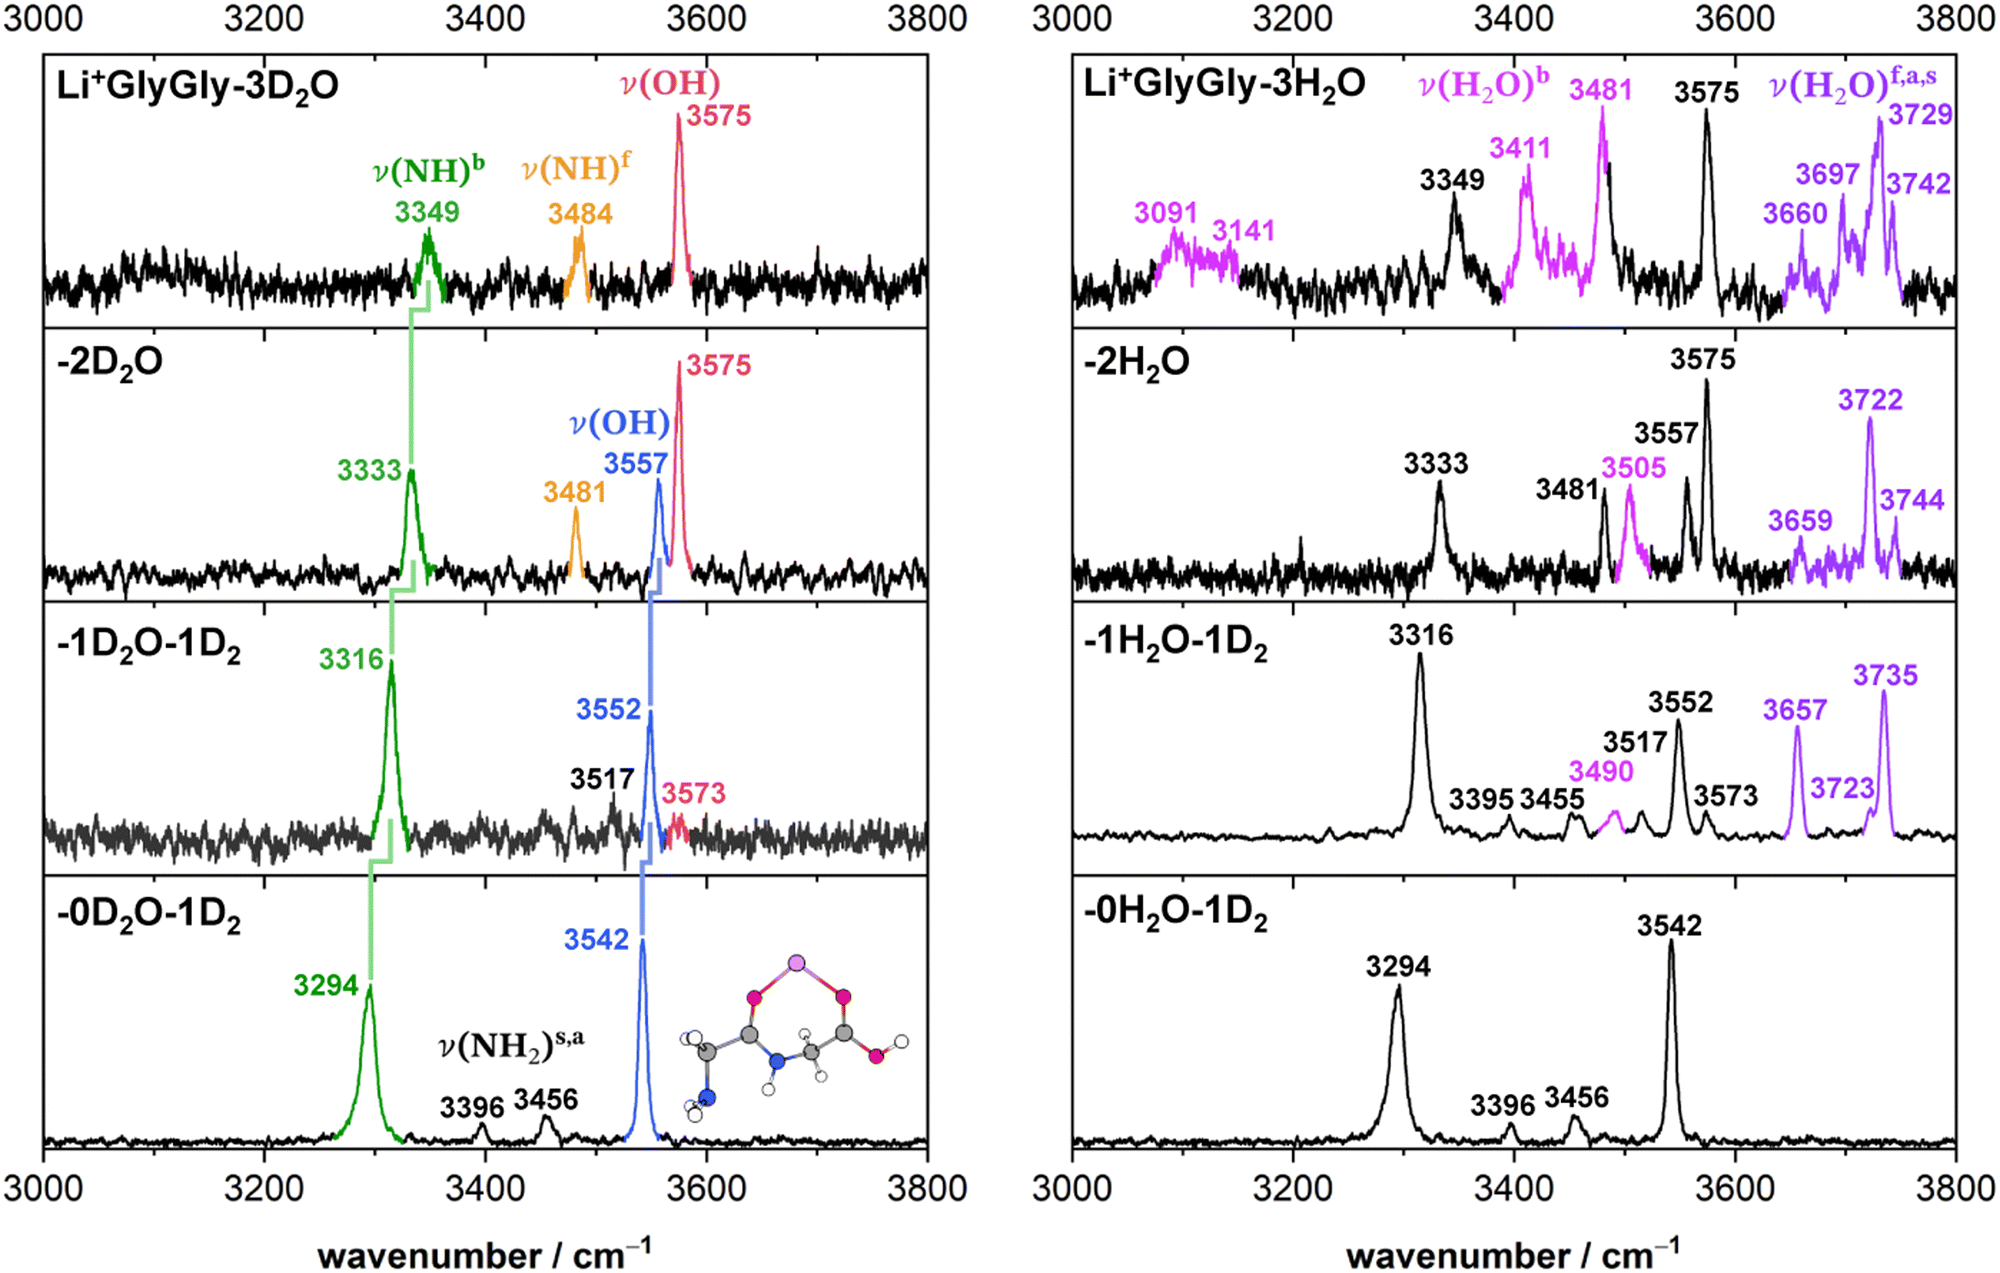 | ||
| Fig. 1 Infrared action spectra of Li+GlyGly-nD2O (left) and Li+GlyGly-nH2O (right) with n = 0–3. For n = 0 and 1, the complexes were tagged with 1D2 (IRPD), whereas for the larger water clusters the loss of 1H/D2O was monitored to obtain the spectrum (IRMPD). The stretching bands are labelled ν, indicating the functional group mainly involved in parentheses and various superscripts detailing the chemical environment (b: hydrogen bonded, f: free) or relative phase (s: symmetric, a: antisymmetric). The previously assigned structure of the Li+GlyGly complex is shown as an inlet (see ref. 12 for further details). | ||
The Li+GlyGly-1D2 spectrum has been previously assigned to a conformer with an NH⋯NH2 hydrogen bond in the peptide backbone and Li+ coordination to the carboxylic and amide CO groups (see structure in Fig. 1).12 The most characteristic vibrational feature of that structure is the hydrogen bonded NH stretching vibration ν(NH)b at 3294 cm−1. The band at 3542 cm−1 corresponds to the OH stretching vibration ν(OH) and the bands in-between to the symmetric and antisymmetric NH2 stretching vibrations ν(NH2)s,a. Upon the addition of one water, the bands of the NH and OH stretching vibrations upshift in the spectra, whereas the shift of the NH stretching vibration is approximately twice as large (+21 versus +10 cm−1). The bands of the symmetric and antisymmetric NH2 stretching vibrations barely change upon the addition of water with differences of −1 cm−1. Next to the OH stretching band (3552 cm−1), there are two less-intense OH stretching features in the Li+GlyGly-1H/D2O-1D2 spectrum at 3517 and 3573 cm−1, indicating the presence of additional conformer(s). In addition to these peptide features, there are four water bands in the spectrum easily identified by the comparison of the corresponding H2O and D2O spectra – two intense water bands at 3657 and 3735 cm−1, the latter with a shoulder at 3723 cm−1, and a weaker band at 3490 cm−1. As the two most intense water bands at 3657 and 3735 cm−1 are close to the band positions of free (non-hydrogen bonded) water (3657 and 3756 cm−1)74,75 and the most intense peptide bands are similar to those of Li+GlyGly, the main conformer observed in our spectra has water binding to the Li+ ion without additional hydrogen bonding to the peptide, meaning that there is no change in peptide conformation upon the addition of the first water. The presence of a less intense water band at 3723 cm−1 hints at a free water vibration in a less populated conformer with the second water OH stretching vibration being hydrogen bonded, as the remaining water feature in the spectrum is observed significantly lower in wavenumber (3490 cm−1). To confirm that these two water bands as well as one of the two less-intense bands in the OH stretching region (3517 or 3573 cm−1) correspond to a second conformer, we have carried out an IR–IR burn experiment with the trap laser set to the OH stretching band at 3573 cm−1, which is shown in the upper panel of Fig. 2. The bands at 3490, 3573 and 3723 cm−1 decrease in intensity in the IR–IR burn spectrum relative to the one laser experiment, validating that those correspond to a second conformer. To check whether the experimental band at 3517 cm−1 belongs to a third or to the main conformer, we have carried out a second IR–IR burn experiment with the trap laser set to the OH stretching band of the main conformer at 3552 cm−1, which is shown in the lower panel of Fig. 2. In addition to the main conformer bands at 3316, 3395, 3455, 3552, 3657, and 3735 cm−1, the band at 3517 cm−1 also decreases in intensity in this IR–IR burn spectrum, meaning that this band must correspond to the main conformer. A plausible origin could be a combination or overtone vibration. The overtone of the carboxylic acid CO stretching vibration (3534.69 cm−1) has for example been observed near the OH stretching fundamental (3570.49 cm−1) in the infrared spectrum of formic acid.76 We have measured the fundamental of the carboxylic CO stretch of Li+GlyGly-1H2O-1D2 at 1748 cm−1 (spectrum not shown). An assignment of the band at 3517 cm−1 to the CO stretching overtone would therefore imply a positive anharmonicity, which seems very unlikely.
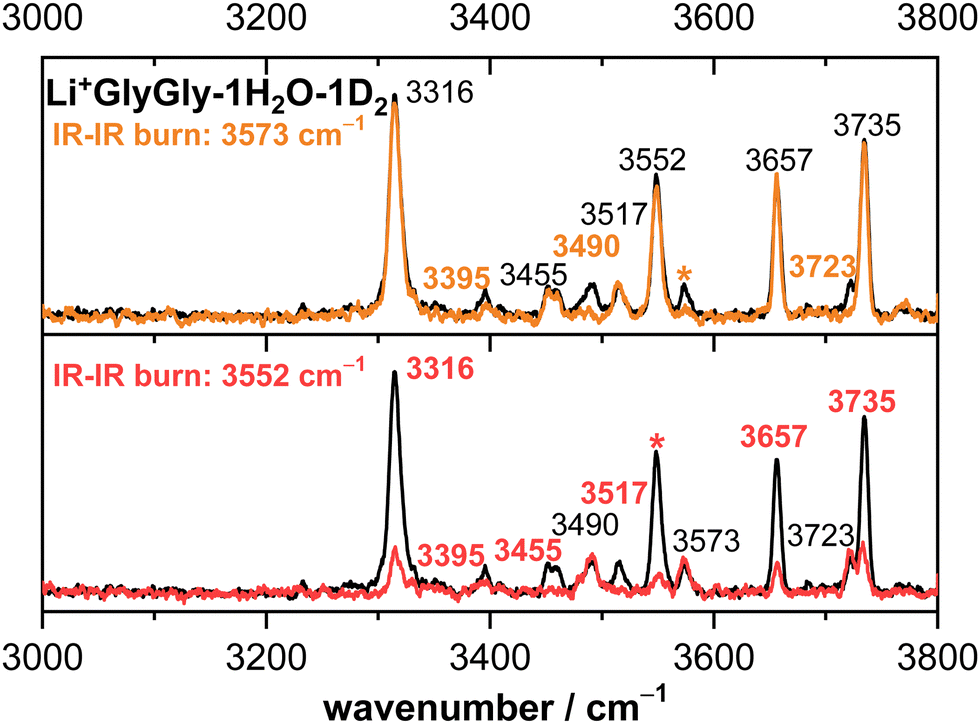 | ||
| Fig. 2 Infrared action spectra of Li+GlyGly-1H2O-1D2 (black) alongside IR–IR burn experiments with the trap laser set to 3573 cm−1 (orange) and 3552 cm−1 (red). The respective band is marked with an asterisk (*) in the spectrum. Band positions of bands corresponding to the conformer that is depleted in the IR–IR burn experiments are marked in the respective colour (orange or red), whereas the band positions of the conformer that remains are shown in black. | ||
Perhaps surprisingly, adding a second water to Li+GlyGly-1H2O does not increase the spectral complexity significantly. In the Li+GlyGly-2D2O spectrum, there are two OH stretching bands at 3557 and 3575 cm−1 both of which are slightly upshifted with respect to the corresponding Li+GlyGly-1D2O bands at 3552 and 3573 cm−1. The trend of an increase in wavenumber of the hydrogen bonded NH stretching band continues for Li+GlyGly-2D2O with an upshift of +18 cm−1. One large difference between the Li+GlyGly-1D2O-1D2 and Li+GlyGly-2D2O spectra is the relative intensity of the two OH stretching bands, which is reversed with the higher wavenumber band (3575 cm−1) having a higher intensity than the lower wavenumber one in case of Li+GlyGly-2D2O. This is accompanied by a decrease of the relative intensity of the hydrogen bonded NH stretching band and the emergence of a new band at 3481 cm−1, which is close to the characteristic band position of a free (non-hydrogen bonded) NH stretching vibration ν(NH)f in those clusters.12 All of these spectral changes are indicative of a change of the relative population of peptide conformers with and without an internal NH⋯NH2 hydrogen bond in the peptide backbone in favour of those without one. Looking at the water bands in the Li+GlyGly-2H2O spectrum, there is a hydrogen bonded water band observed at 3505 cm−1 which has increased in intensity and wavenumber relative to the corresponding band in the Li+GlyGly-1H2O-1D2 spectrum at 3490 cm−1 indicating a weakening of the hydrogen bond upon the addition of water. Accordingly, the band of the free H2O stretching vibration at 3722 cm−1 is also significantly more intense, whereas the symmetric and antisymmetric H2O stretching bands observed at 3659 and 3744 cm−1 are rather weak in the Li+GlyGly-2H2O compared to the Li+GlyGly-1H2O-1D2 spectrum.
Expectedly, the number of hydrogen bonded water bands increases significantly in the Li+GlyGly-3H2O spectrum with water contributions to the broad feature around 3100 cm−1 as well as to the bands at 3411 and 3481 cm−1. The relative population of the peptide conformations with and without a NH⋯NH2 hydrogen bond seems to further steer towards no hydrogen bond in the peptide backbone, as the potential hydrogen bonded NH stretching band at 3349 cm−1 has decreased further in intensity. The broad low intense feature around 3100 cm−1 in the Li+GlyGly-3D2O spectrum might indicate water hydrogen bonding to the OH group of the peptide.
Overall, the comparison of the solvated Li+GlyGly spectra using H2O versus D2O (Fig. 1) as well as the conformer-specific IR–IR burn experiments (Fig. 2) already allow for a few insightful conclusions, without even any support by quantum chemical calculations. Firstly, there are two conformers observed in the spectra upon the addition of the first water. Furthermore, a change in peptide conformation from a NH⋯NH2 hydrogen bond in the peptide backbone to a free (non-hydrogen bonded) NH stretching vibration is observed, with conformer(s) without the hydrogen bond being the dominant peptide conformation from two water molecules onwards. These purely experimental conclusions about the conformers observed in our spectra nicely align with the conformer assignments based on a comparison of the IR spectra with scaled harmonic vibrational frequency calculations discussed in the following section.
3.2 Conformer assignments
The lowest energy conformers of the Li+GlyGly-nH2O complexes with n = 1–2 are shown in Fig. 3 and can be distinguished into three conformer families, which are coloured in grey, red, and blue. The blue conformers are based on the global minimum structure of the Li+GlyGly complex, which exhibits an internal NH⋯NH2 hydrogen bond in the peptide backbone and Li+ coordination to the carbonyl groups of diglycine. The conformer label [Oa,Oc] indicates the coordination sites of the metal ion, i.e., the amide oxygen (Oa) and the carboxyl oxygen (Oc). The lowest-energy conformations including this peptide binding motif of the respective singly and doubly solvated complexes have water (W) coordinating to the metal ion and are therefore labelled [Oa,Oc,W] and [Oa,Oc,W,W], respectively. The second most stable conformation of the Li+GlyGly complex [N,Oa,Oc] has the lone pair of the nitrogen atom of the terminal amine group binding to the metal ion instead of accepting a hydrogen bond from the amide NH. There are two conformer families based on this peptide conformation, which differ in the location of the first water. In the grey conformer family, the water coordinates to the Li+ ion and hydrogen bonds to the lone pair of the nitrogen atom of the terminal amine group. The location of hydrogen bonds originating from one of the metal ion binding sites are indicated as subscripts in the conformer labels. Therefore, this conformer is labelled [WN,Oa,Oc]. In the red conformer family, the water coordinating to the Li+ ion hydrogen bonds to the carbonyl oxygen of the carboxylic acid group ([N,Oa,WOc]). The second water in both conformer families binds to the metal ion without additional peptide interactions ([WN,Oa,Oc,W] and [W,N,Oa,WOc] in Fig. 3).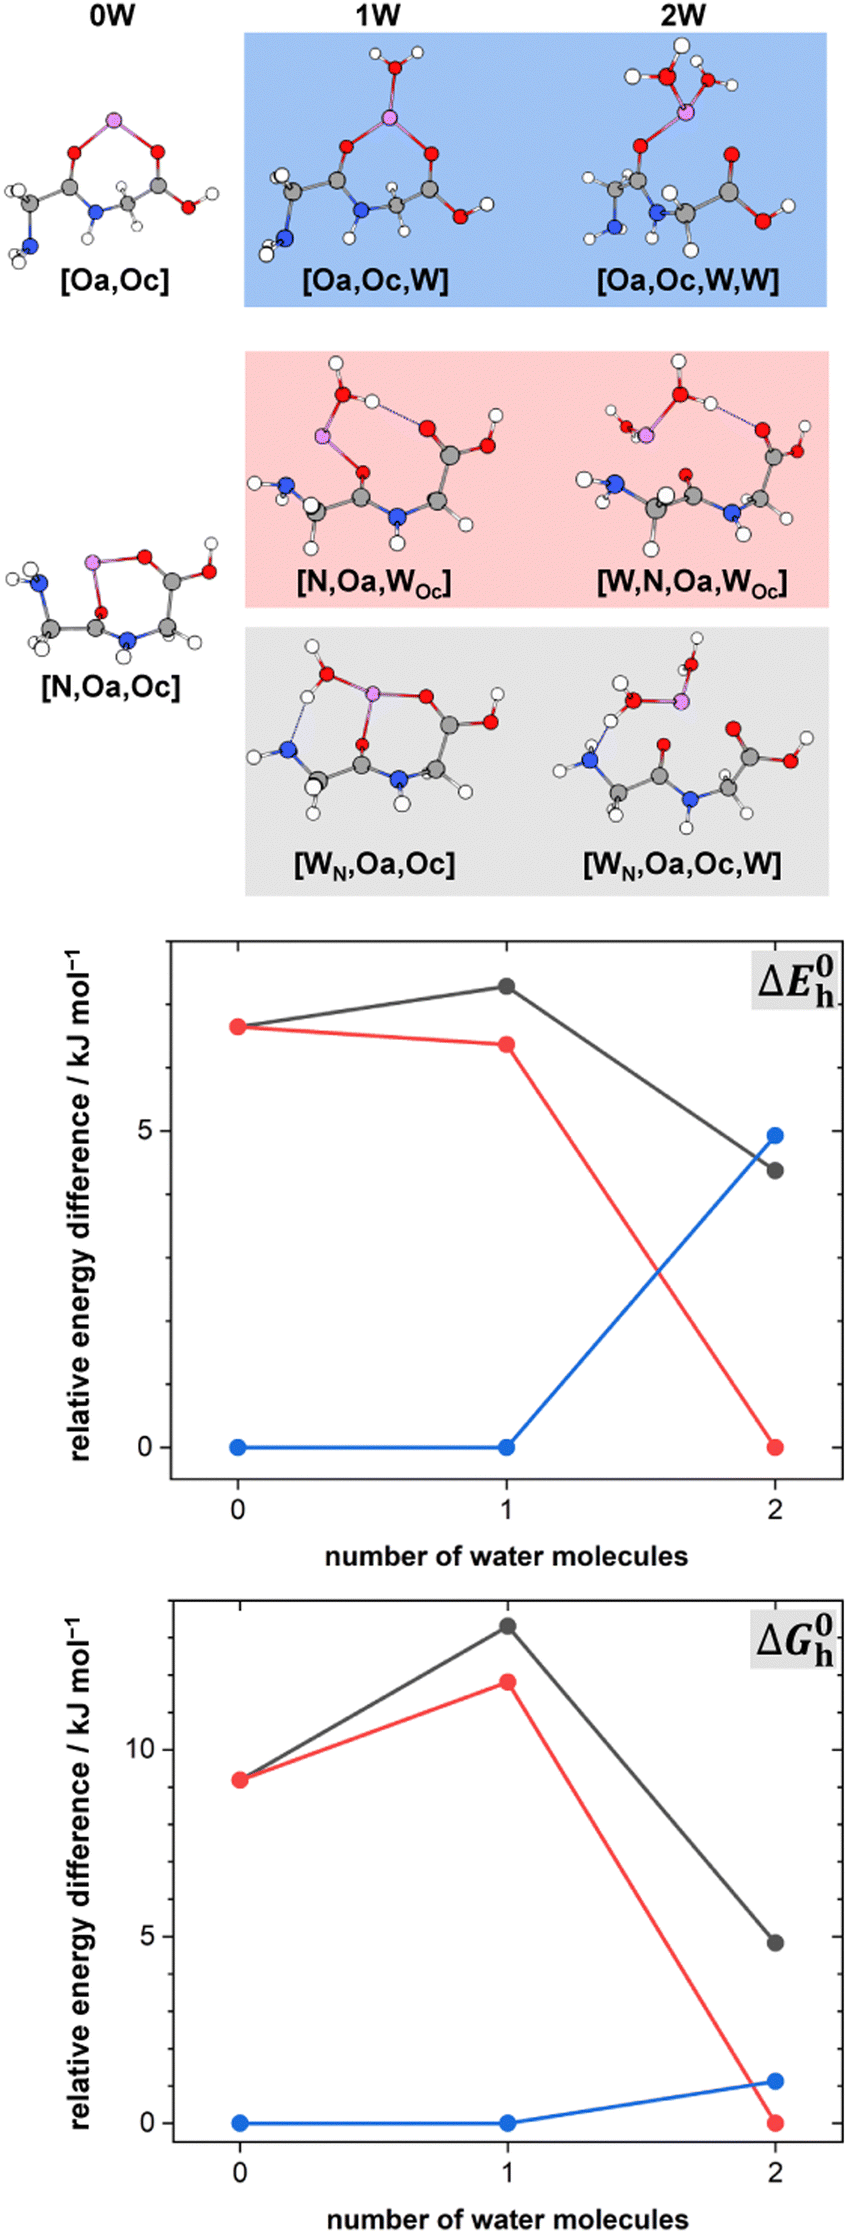 | ||
| Fig. 3 Lowest-energy conformers of Li+GlyGly-nH2O with n = 0–2. Oa and Oc in the conformer labels indicate metal ion coordination to the amide and carboxylic CO groups, N metal ion coordination to the lone pair of the NH2 group, W indicates water coordination to Li+, and subscripts illustrate the location of hydrogen bonds originating from the respective metal ion binding sites. Additional higher-energy conformers are shown in Fig. S2 in the ESI.† Harmonic zero-point and BSSE corrected relative energy differences ΔE0h and relative Gibbs free energy differences ΔG0h of the lowest-energy conformers of Li+GlyGly-nH2O are shown as a function of the number of water molecules, calculated at the DLPNO-CCSD(T)/aVQZ*//MP2/aVTZ* level. | ||
The harmonically calculated relative BSSE and zero-point corrected electronic ΔE0h and Gibbs free energies ΔG0h (DLPNO-CCSD(T)/aVQZ*//MP2/aVTZ*) of the solvated Li+GlyGly complexes are shown in the lower panels of Fig. 3. The Gibbs free energies of the complexes have been computed at 300 K to scrutinise whether any entropically favoured conformations are observed in our spectra as a result of the efficient collisional cooling process in the ion trap33 – a potential cause of the small population of kinetically trapped conformers observed even at ion trap temperatures as low as 10 K.12,77,78 For Li+GlyGly, the energy difference between the global minimum [Oa,Oc] conformer and the conformer without the internal hydrogen bond ([N,Oa,Oc]) amounts to 6.6 kJ mol−1 (ΔE0h in Fig. 3). Considering entropic effects, this energy difference is predicted to be even larger due to the larger number of low frequency modes of [Oa,Oc] (9.2 kJ mol−1, cf. ΔG0h in Fig. 3). Upon the addition of the first water, the internal hydrogen bond is still favoured over H2O or metal-ion NH2 coordination with energy differences of 6.4 and 7.3 kJ mol−1 for [N,Oa,WOc] and [WN,Oa,Oc], respectively. At room temperature, this energy difference is predicted to be even larger (cf. ΔG0h in Fig. 3). Upon the addition of the second water, the preferred peptide conformation is predicted to change with [W,N,Oa,WOc] being the lowest energy structure, followed by [WN,Oa,Oc,W] 4.4 kJ mol−1 and [Oa,Oc,W,W] 4.9 kJ mol−1 higher in energy. The inclusion of thermal contributions at 300 K leads to a stabilisation of the NH⋯NH2 hydrogen bonded conformer which is predicted to be only 1.1 kJ mol−1 higher in energy with respect to [W,N,Oa,WOc] at the DLPNO-CCSD(T)/aVQZ*//MP2/aVTZ* level. At the MP2/aVTZ* level, the relative Gibbs free energy difference of [Oa,Oc,W,W] relative to [W,N,Oa,WOc] is with 2.4 kJ mol−1 predicted to be slightly larger, whereas the DFT methods predict the [Oa,Oc,W,W] conformer to be lower in energy (cf. Table S5 in the ESI†), illustrating that these ΔG0h values are highly method dependent. The same applies to the corresponding ΔE0h values (Table S6 in the ESI†).
In Fig. 4, the infrared spectra of Li+GlyGly-1H/D2O-1D2 and Li+GlyGly-2H/D2O are shown alongside harmonically calculated and wavenumber-scaled (0.958) MP2/aVTZ* band position predictions of the three respective conformers. For strongly hydrogen bonded water bands, the calculated intensity has also been scaled and the scaling factor is displayed next to the predicted band position.
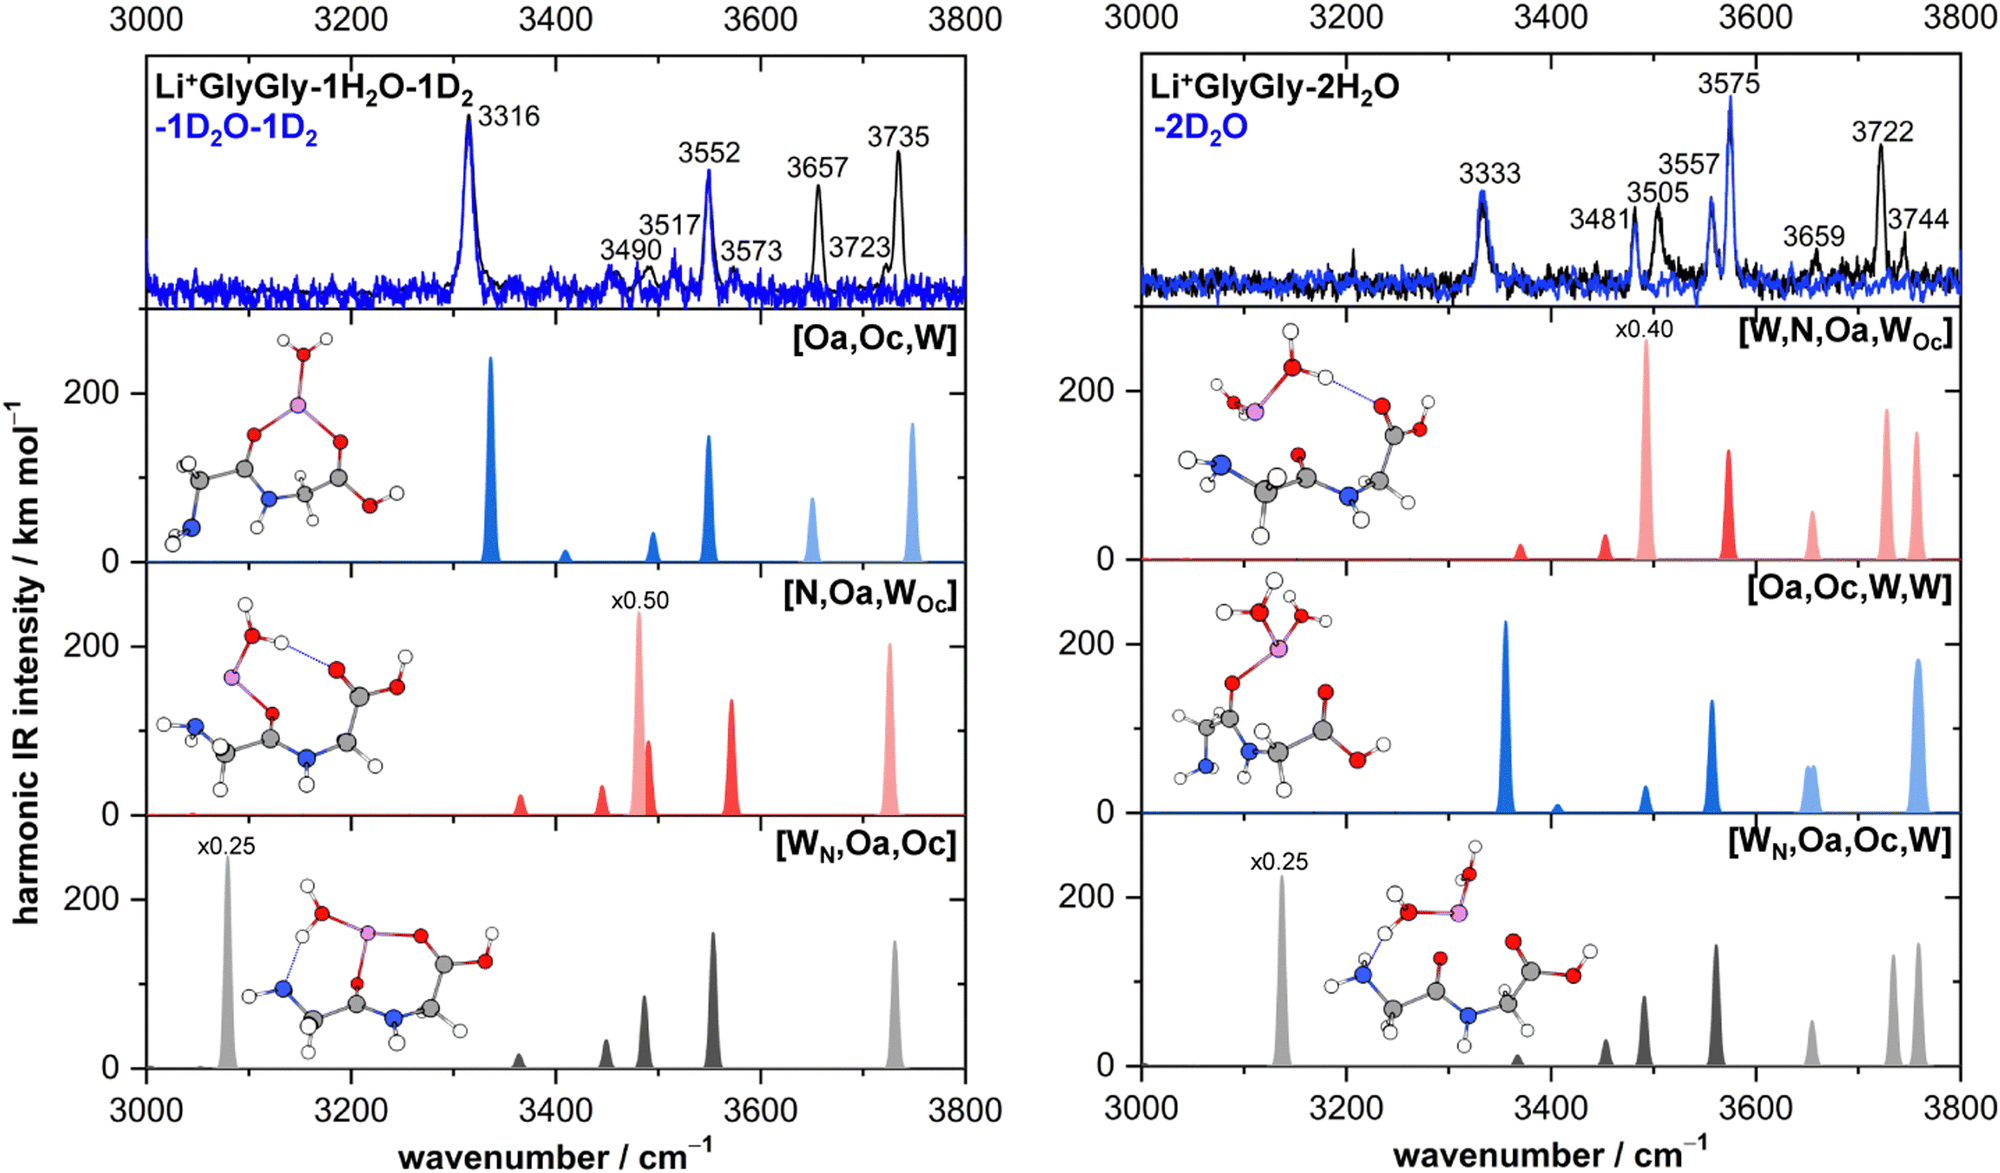 | ||
| Fig. 4 Infrared action spectra of Li+GlyGly-1H/D2O-1D2 (left) and Li+GlyGly-2H/D2O (right) alongside harmonically calculated, wavenumber-scaled (0.958) and Gaussian-broadened (σ = 4 cm−1) spectra of the lowest-energy conformers at the MP2/aVTZ* level. Predicted bands corresponding to water vibrations are shown in a lighter and peptide vibrations in a darker shade (grey/blue/red), respectively. Note that the Li+GlyGly-1H/D2O-1D2 spectra were recorded via tag-loss (1D2), whereas the Li+GlyGly-2H/D2O spectra were recorded via water-loss (1H/D2O). | ||
The most intense bands in the Li+GlyGly-1H/D2O-1D2 spectrum (left column of Fig. 4) at 3316, 3552, 3657, and 3735 cm−1 agree well with the predicted band positions of the hydrogen bonded NH stretching ν(NH)b, carboxylic acid OH stretching ν(OH), and symmetric and antisymmetric water stretching vibrations ν(H2O)s,a of the lowest-energy [Oa,Oc,W] conformer. The slightly larger deviation of +21 cm−1 for the hydrogen bonded NH stretching vibration is very similar to the deviation observed for the bare Li+GlyGly complex (+24 cm−1) and is therefore a result of an insufficient capture of its vibrational anharmonicity by the wavenumber scaling to an OH stretching vibration.12 The bands of the second conformer at 3490, 3573, and 3723 cm−1 agree well with the band position predictions for ν(H2O)b (3481 cm−1), ν(OH) (3571 cm−1), and ν(H2O)f (3726 cm−1) of the second most stable [N,Oa,WOc] conformer. Expectedly, the largest band position deviation is observed for the hydrogen bonded water vibration, but it is with solely −9 cm−1 fairly moderate. The third conformer, [WN,Oa,Oc], has a strong HO–H⋯NH2 hydrogen bond between the water and the NH2 group of the peptide. The hydrogen bonded water stretching vibration of that cluster is predicted at 3079 cm−1, but not observed in the spectra, so that its contribution to the Li+GlyGly-1H2O-1D2 spectrum seems unlikely.
The assignment of the Li+GlyGly-2H/D2O IRMPD spectrum is similarly straightforward as that of the IRPD spectrum of the singly hydrated complex. The most stable conformer is predicted to be [W,N,Oa,WOc], which has already been observed to a small extent in the Li+GlyGly-1H2O-1D2 spectrum. The MP2/aVTZ* calculation predicts its OH stretching vibration at 3573 cm−1 and its free NH stretching vibration at 3492 cm−1 as the most IR-active peptide vibrations of the complex, the latter of which is hidden below the significantly more intense hydrogen bonded water vibration at 3493 cm−1 in the predicted [W,N,Oa,WOc] spectrum in Fig. 4. Those predicted band positions agree well with the experimental bands at 3575 cm−1 (OH stretch), 3481 cm−1 (free NH stretch), and 3505 cm−1 (hydrogen bonded water vibration), especially considering the similar deviation between the hydrogen bonded H2O band position prediction and experiment in the Li+GlyGly-1H/D2O cluster (−9 cm−1 compared to −12 cm−1). Similarly good agreement is observed for the calculated band position of the free water stretching vibration (3722 cm−1). However, the predicted intensity of the antisymmetric water stretch at 3757 cm−1 does not match the band at 3744 cm−1 with respect to the band at 3722 cm−1. Either the intensity of that band diminishes due to couplings to other modes, the intensity prediction is incorrect, the band position difference is predicted too large so that both overlap and contribute to the band at 3722 cm−1, or this a result of the multi-photon process. The bands of the hydrogen bonded NH stretching vibration at 3333 cm−1 and the OH stretching vibration at 3557 cm−1 can be assigned to the third most stable [Oa,Oc,W,W] conformer with devations of +24 cm−1 and +1 cm−1, respectively. The symmetric and antisymmetric water stretching vibrations of that conformer most likely contribute to the bands at 3659 and 3744 cm−1. There is no spectral evidence of the conformer with water hydrogen bonding to the terminal amine [WN,Oa,Oc,W] predicted 0.5 kJ mol−1 lower in energy than the [Oa,Oc,W,W] conformer at the DLPNO-CCSD(T)/aVQZ*//MP2/aVTZ* level. Comparing the Gibbs free energy differences between the conformers (Fig. 3), however, shows that thermal contributions might explain this as the [Oa,Oc,W,W] conformer is entropically favoured with respect to [WN,Oa,Oc,W]. This might indicate that the collisional cooling in our ion trap is indeed fast enough to preserve some population of such entropically favoured conformers.
Overall, these conformer assignments of the Li+GlyGly-nH2O complexes (n = 1, 2) based on scaled harmonic MP2/aVTZ* vibrational frequency calculations are consistent with the pure experimental analysis using conformer-specific IR–IR and H2O/D2O isotopic substitution experiments presented in Section 3.1, underlining the advantage of such experimental assignment aides. In the following section, we will assess the performance of MP2/aVTZ* in comparison to popular DFT methods with the aim to find a more cost-efficient method for a tentative analysis of the more complex Li+GlyGly-3H2O spectrum.
4 Agreement between theory and experiment
A popular way to assign vibrational spectra is to use scaled harmonic vibrational frequency calculations, as anharmonic vibrational frequency calculations are often computationally expensive and limited to relatively stiff systems.79 To be confident with the scaled harmonic assignments, it is insightful to analyse the band position deviations of various methods not only with the intent to find the method with the smallest deviations considering the computational costs, but also to identify how well the anharmonicity of certain modes can be captured by the employed scaling factor, as systematic over- or underestimations can also be utilised as a helpful assignment tool. In this work, we scale the harmonic band positions to the experimental band of the OH stretching vibration of Na+GlyGly (3556 cm−1) for each of the tested methods listed in Table 1. The thus obtained scaling factors range from 0.933 to 0.964 (for full list, see Table S1 in the ESI†). , cf.Fig. 4), and average deviations obtained for the OH
  , hydrogen bonded NH
  , as well as free, antisymmetric, symmetric, and hydrogen bonded H2O vibrations
  (all in cm−1). The average deviations are displayed alongside their standard deviations in parenthesis. The free NH stretching vibration ν(NH)f has only been observed for Li+GlyGly-2H2O ([W,N,Oa,WOc] conformer) and is therefore displayed without a standard deviation (ΔNHf). Note that the asterisk (*) at the aVTZ* basis set indicates that for Li+, the aVTZ basis set has been replaced with the weighted core-valence cc-pwCVTZ basis set (see Section 2.2 for further details)
| Method |
|
|
ΔNHf |
|
|
|
t CPU |
|---|---|---|---|---|---|---|---|
| B3LYP-D3(BJ)/def2TZVP | 11.1 | 3(1) | 3.2 | 21(0) | −2(4) | −39(10) | 10.5 |
| B3LYP/def2TZVP | 8.7 | 2(1) | −0.5 | 19(2) | −3(3) | −22(2) | 11.3 |
| ωB97XD/def2TZVP | 15.3 | −1(1) | −36.6 | −3(3) | −12(4) | −61(10) | 15.2 |
| M06-2X/def2TZVP | 15.4 | 0(2) | −31.7 | 17(3) | −17(4) | −37(4) | 16.7 |
| B2PLYP-D3(BJ)/aVTZ* | 10.7 | 0(1) | 2.3 | 29(3) | −4(4) | −29(1) | 6671.3 |
| MP2/aVTZ* | 11.9 | −1(1) | 10.9 | 23(2) | 4(9) | −10(2) | 6614.1 |
| PM3 | 95.8 | 3(5) | −333.0 | −194(16) | −64(30) | 3(2) | 0.02 |


The vibrational modes we chose to include in this comparison are indicative modes of the structure in those complexes, as without a good description of those, assignments cannot be easily made (vide infra). Most indicative for the peptide and water conformation in the Li+GlyGly-nH2O complexes are the OH, NH, and water stretching vibrations. The band position of the NH stretching vibration indicates the presence (ν(NH)b) or absence (ν(NH)f) of the internal NH⋯NH2 hydrogen bond and the carboxylic acid OH stretch ν(OH) contains information about the local electric field in those clusters.12 Besides, a significant spectral downshift of it indicates (water) hydrogen bonding to it, the latter of which is not observed in the Li+GlyGly-nH2O complexes with up to two water molecules. The water vibrations can be distinguished into free (f), symmetric (s), antisymmetric (a), and hydrogen bonded (b) vibrations, whereby the deviations of the former three are averaged and listed as ν(H2O)f,a,s in Table 1. The symmetric and antisymmetric NH2 stretching vibrations are not as structurally indicative for the assignments, which is why their deviations are listed in Table S7 in the ESI.† For all modes with more than one data point (all but ν(NH)f), we list the average deviation alongside the standard deviation in parenthesis in Table 1 to illustrate the breadth of the deviations.
Before turning to the comparison of experiment and theory, it is important to consider sources of uncertainty in the experimental band positions. Firstly, we compare our Li+GlyGly-nH2O-1D2 spectra with n = 0 and 1 to calculations without the D2 messenger tag, as the D2 molecule is binding to the Li+ ion and is therefore not expected to perturb the vibrational band positions of the peptide significantly. To validate that the omission of tag has indeed little impact on the predicted vibrational spectra, we have carried out exploratory B3LYP-D3(BJ)/def2TZVP calculations including the D2 tag without thoroughly accounting for its position dependence on the Li+ ion. Upon the inclusion of the tag, we observe differences of merely 0.1 cm−1 in the average absolute band position deviations (see Table S3 in the ESI† for further details). This confirms that the tag impact on the predicted peptide vibrations in these systems is indeed small. As a measure of the experimental uncertainty of the band positions, one can compare the full-width half-maximum (FWHM) of the experimental bands in the spectra. The FWHM amounts on average to approximately 9 cm−1 leading to an estimate of the experimental uncertainty of the band positions of ±5 cm−1. To be slightly more generous and also accommodate any small band position deviations for the spectra including the D2 tag, we consider reasonable agreement with experiment to be within twice of the uncertainty of the band positions (±10 cm−1).
For an overview of the performance of DFT and MP2, the average absolute deviations over all modes  can be compared, which are listed in the second column of Table 1. As a rough measure of the cost-efficiency of the methods, the sum of the total CPU time tCPU needed to compute the vibrational spectra of the five Li+GlyGly-nH2O complexes (n = 0–2) assigned in our spectra is also listed in Table 1. Unsurprisingly, the scaled harmonic vibrational frequency calculations using the semi-empirical method PM3 have by far the lowest CPU time of just 0.02 h, but also exhibit by far the largest overall deviations of 95.8 cm−1. Out of the hybrid functionals, B3LYP-D3(BJ) shows the best overall agreement with experiment. B2PLYP-D3(BJ) and MP2 perform similarly to B3LYP-D3(BJ) in terms of
  , yet the computational cost are about 600 times higher. Interestingly, the agreement with experiment can be improved if the D3(BJ) dispersion correction is omitted for empirically scaled B3LYP, which yields the best overall result with a
  value of less than 10 cm−1. In fact, B3LYP is the only method where the average absolute deviation falls within the experimental uncertainty.
In addition to the average absolute deviation  , the comparison of the description of the individual modes is also insightful. With the exception of PM3, the largest band position deviations are observed for the hydrogen bonded modes, i.e., the hydrogen bonded NH ν(NH)b and H2O stretches ν(H2O)b (cf. columns five and seven in Table 1). This is not surprising, as the anharmonicity of those modes is expected to differ from non-hydrogen bonded vibrations such as the OH stretch, which the scaling factor is based on. The band position of the hydrogen bonded NH stretching vibration ν(NH)b is overestimated by most methods with the exception of PM3 and ωB97XD, the latter of which predicts it within the experimental uncertainty. The band position of the hydrogen bonded water stretching vibration ν(H2O)b, on the other hand, is severely underestimated by most methods apart from PM3 which is the only method that predicts its band position within the experimental uncertainty (deviations of merely 3(2) cm−1), although the MP2/aVTZ* result is close with −10(2) cm−1. This accuracy of the description of ν(H2O)b for PM3 is undoubtedly accidental, as the deviations of most other modes are unjustifiably large with discrepancies for the free and hydrogen bonded NH stretches of −333 cm−1 and −194(16) cm−1, respectively. This clearly highlights the need to test the accuracy of the description for more than just one experimental observable. Expectedly, the best description within the non-hydrogen bonded modes is observed for the OH stretch. For the free NH stretch and the non-hydrogen bonded water vibrations only slightly larger deviations close to or slightly above the experimental uncertainty (±10 cm−1) are observed with the exception of ωB97-XD and M06-2X which underestimate the free NH stretch by 36.6 and 31.7 cm−1, respectively.
Overall, the vibrational description of the Li+GlyGly-nH2O complexes with n = 0–2 using scaled harmonic vibrational frequencies works reasonably well for some of the methods tested despite the lack of an accurate anharmonic description. Comparing different DFT methods and MP2 shows stark differences in the description of individual vibrations, particularly considering the hydrogen bonded water stretching vibrations, whereas the average absolute deviation over all modes is more similar. When affordable and structural assignments of hydrogen bonded water clusters are ambiguous, MP2/aVTZ* calculations are preferable over hybrid functionals such as B3LYP, which was the best overall DFT methods tested. The overestimation of (OH) hydrogen bond strengths is a well-known weakness of many DFT methods that is limiting the descriptive power for larger hydrogen bonded systems where high-level ab inito methods are out of reach. Using B3LYP without dispersion correction can lead to a significant improvement in the description of hydrogen bonded water vibrations largely due to an improvement of the error compensation rather than a more accurate description of hydrogen bonds. The comparison of vibrational frequency calculations including the D3(BJ) dispersion correction on a geometry obtained without this correction and vice versa indicates that this is largely a geometric effect (see Section S3 in the ESI† for further details). It is important to note, however, that omitting such corrections for dispersion interactions can lead to an inaccurate description of molecular structure, as for example seen in studies of the trimers of trans-N-methylacetamide, imidazole, and 1,1,1,3,3,3-hexafluoro-propan-2-ol.80–82 We will use B3LYP/def2TZVP for the tentative analysis of our Li+GlyGly-3H2O spectra in the following section, but for the comparisons of relative energies of the Li+GlyGly-3H2O complexes, B3LYP is used with the D3(BJ) dispersion correction. To improve the results, the B3LYP-D3(BJ)/def2TZVP electronic energy in those calculations is replaced by a DLPNO-CCSD(T)/aVQZ* single-point energy (DLPNO-CCSD(T)/aVQZ*//B3LYP-D3(BJ)/def2TZVP).
5 Tentative analysis of Li+GlyGly-3H2O spectra
With an increasing number of water molecules, spectral assignments are getting increasingly more difficult due to the larger number of conformers very close in energy and the shortcomings of quantum chemical methods accessible to the system size. Particularly noteworthy in this context is the aforementioned overestimation of (OH) hydrogen bond strengths of DFT methods such as B3LYP-D3(BJ) (Table 1),83,84 as errors can quickly and systematically add up with the number of water hydrogen bonds. From an experimental perspective, there is another complication. One valuable way of simplifying the spectral analysis are conformer-specific IR–IR experiments, as these enable the recording of individual spectra of different conformers. This is particularly helpful if there is a multitude of conformers present, as highlighted for the Na+ complex with glucose where a total of eight conformers were identified to contribute to the experimental spectrum at 10 K.43 In case of experiments requiring the absorption of multiple photons to record the spectrum, having a second laser interrogating the ions in the ion trap can yield to warming of the clusters upon the absorption of a single photon in addition to the desired depletion of a certain conformer upon the absorption of multiple photons. The thus warmed up clusters can then dissociate upon the absorption of a second photon by the second IR laser in TOF tube. Besides, this increase in internal energy can also result in a change in the conformation of the complex if the barrier is low enough. The overall spectrum might then contain contributions of both processes and can therefore be significantly less conclusive. Moreover, the likelihood of kinetic trapping increases with the system size due to the slower unimolecular dynamics.33 This highlights the need for reliable, cost-efficient quantum chemical methods for the description of (strongly) hydrogen bonded systems.In Fig. 5, the IRMPD spectra of Li+GlyGly-3H/D2O are shown alongside scaled, harmonic B3LYP/def2TZVP vibrational frequencies of the lowest-energy conformers of the different conformer families. We chose this method over MP2/aVTZ* for this system size because it is overall computationally more efficient and the expected increase in the deviation of the water hydrogen bond description is moderate (cf.Table 1). Next to the predicted spectra, harmonic BSSE and zero-point corrected relative energy differences and relative Gibbs free energy differences are listed, calculated at the DLPNO-CCSD(T)/aVQZ*//B3LYP-D3(BJ)/def2TZVP level.
 | ||
| Fig. 5 Infrared action spectra of Li+GlyGly-3H/D2O alongside harmonically calculated, wavenumber-scaled (0.964) and Gaussian-broadened (σ = 4 cm−1) spectra of low-energy conformers at the B3LYP/def2TZVP level. Predicted bands corresponding to water vibrations are shown in a lighter and peptide vibrations in a darker shade (grey/blue/red), respectively. Note that the spectra were recorded via water-loss. Next to the spectra, BSSE and zero-point corrected relative energy differences and relative Gibbs free energy differences of the different conformers calculated at the DLPNO-CCSD(T)/aVQZ*//B3LYP-D3(BJ)/def2TZVP level are listed (ΔE0h/ΔG0h, in kJ mol−1). | ||
The Li+GlyGly-3D2O spectrum is surprisingly simple with an OH stretching band at 3575 cm−1, a band of a free NH stretching vibration at 3484 cm−1, and an equally weak band at 3349 cm−1. Considering the band position and the increase in hydrogen bonded NH stretching band position upon the addition of water (cf.Fig. 1), it seems likely that this band is still due to a NH⋯NH2 hydrogen bond in the peptide backbone. The presence of a free and a hydrogen bonded NH stretching band in the spectrum therefore indicates the presence of least two conformers, one with and one without an internal hydrogen bond, whereby the contribution of the conformer(s) without the internal hydrogen bond is larger. Since the most intense peptide vibration in the Li+GlyGly-3D2O spectrum is the OH stretch, conformers with water hydrogen bonding to the carboxlic acid OH group cannot dominate the observed conformer population, although the broad low-intense feature around 3100 cm−1 (cf.Fig. 1) precludes an exclusion of those. Comparing the respective D2O to the H2O spectra reveals that there are at least two different types of water hydrogen bonds present in these systems, namely two intense bands of mid-strength water hydrogen bonds at 3411 and 3481 cm−1, in addition to a potential very small contribution of a strong water hydrogen bond resulting in the broad and rather weak band around 3100 cm−1.
There are many conformers of the Li+GlyGly-3H/D2O complex below 10 kJ mol−1 due to the large number of water hydrogen bonds possible. To simplify the analysis, we have selected the lowest-energy ones of each of the three conformer families (red, blue, and grey, cf.Fig. 3). Spectra of additional conformers can be found in Fig. S4 in the ESI.†
The lowest-energy conformer is based on the most stable conformation of the two water complex. It has the Li+ ion coordinating to the terminal amine, the amide CO group, and two water molecules, one of which is free and the other is hydrogen bonding to the third water, which in turn hydrogen bonds to the carboxylic CO group. This conformer is labelled [WW,N,W,Oa] and stems from the red conformer family by insertion of a water into the Li+⋯OH2⋯OC bond. The predicted scaled, harmonic spectrum of [WW,N,W,Oa] is shown in the panel below the experimental spectra in Fig. 5. At first, one might be surprised that this conformer appears to have three hydrogen bonded water vibrations, though only two water hydrogen bonds. The reason for this is that the normal modes of the two bands very close in band position at 3350/3357 cm−1 are predicted to be a linear combination of the symmetric NH2 stretch and the hydrogen bonded water OH stretch at the B3LYP/def2TZVP level. As the contribution of the water OH stretch to both modes is roughly equal, it cannot be distinguished which of the two is the water OH stretch. Therefore, both are displayed in light red. The overall agreement of the predicted band positions of [WW,N,W,Oa] with experiment is very good for the free, symmetric, and antisymmetric water OH stretches with predictions at 3657, 3699, 3730, and 3742 cm−1 compared to the experimental bands at 3660, 3697, 3729, and 3742 cm−1. The carboxylic acid OH stretch also matches well with an overestimation of +3 cm−1. The two hydrogen bonded water OH stretches are predicted lower in wavenumber compared to the experimental bands at 3411 cm−1 and 3481 cm−1 with deviations of −62/54 cm−1 and −15 cm−1, respectively. The weaker hydrogen bond to the carboxylic acid CO group has been observed for the smaller water clusters and the magnitude and sign of this deviation is only slightly smaller to what has been observed for those at the B3LYP/def2TZVP level (−22(2) cm−1, cf.Table 1). Therefore, it seems fairly plausible that this conformer is a main contribution to the experimental IRMPD spectrum of Li+GlyGly-3H/D2O complex. The next higher in energy conformer of the red conformer family is [N,W,Oa,WOc]. It is predicted to be solely 4.3 kJ mol−1 less stable than the global minimum. As this conformer has the carboxylic acid OH group hydrogen bonding to a water molecule and therefore, no free carboxlic OH stretch, it can only be a small contribution to the spectrum if present at all. As the hydrogen bonded water vibration of [N,W,Oa,WOc] is within the width of the water band at 3411 cm−1 (prediction 3414 cm−1), though an underestimation would be expected for this type of vibration, its contribution to the spectrum seems overall unlikely.
After possibly identifying a large contribution to the spectrum, there are still bands in the experimental spectrum that cannot be explained by the global minimum conformer alone, most importantly, the band of the hydrogen bonded NH stretch at 3349 cm−1, which is characteristic for the blue conformer family. The lowest-energy blue conformer at the DLPNO-CCSD(T)/aVQZ*//B3LYP-D3(BJ)/def2TZVP level is [Oa,W,W,Oc], which can be formed from the second conformer contributing to the Li+GlyGly-2H/D2O spectrum by the addition of water to the carboxylic OH group. Considering thermal effects at 300 K, it is predicted to be the most stable conformer (compare ΔG0h values in Fig. 5). Its hydrogen bonded NH stretch is predicted at 3362 cm−1, which matches the peptide band at 3349 cm−1 within the expected uncertainty for that vibration at the B3LYP/def2TZVP level. Since this conformer does not have a free carboxylic acid OH stretch, it can only be a small contribution to the spectrum, if the ambiguous, very broad band around 3100 cm−1 in the Li+GlyGly-3D2O spectrum is indeed a hydrogen bonded peptide band. Another good match for the hydrogen bonded NH stretching band at 3349 cm−1 is observed for the second lowest energy blue conformer, [Oa,W,WOc,W], with a predicted band position at 3357 cm−1. This conformer can also be directly formed from the most stable blue conformer of the two water complex by the addition of water to the Li+ ion, which then hydrogen bonds to the carboxylic CO group. The band of this weak water hydrogen bond to the carboxylic CO group is underestimated by −18 cm−1 with respect to experiment, a deviation that is expected for B3LYP/def2TZVP for this type of bond (−22(2) cm−1, cf. Table 1). As its predicted symmetric, antisymmetric, and free water OH stretches at 3658, 3723, and 3748 cm−1, as well as the carboxylic OH stretch at 3576 cm−1 match experiment well, it is fairly likely that this conformer is contributing to the experimental spectrum.
These conformers considered, all intense bands in the IRMPD spectrum of Li+GlyGly-3H2O can be accounted for. The only remaining band unaccounted for by our assignment is the very weak band of a hydrogen bonded water stretch at 3091/3141 cm−1. Depending on how the blue spectrum is scaled, however, the contribution of this band is almost negligible. The most likely explanation of this band is a strong hydrogen bond such as the HO–H⋯NH2 hydrogen bond of water to the terminal amine group characteristic for the grey conformer family. The lowest-energy grey conformer, [WN,W,Oa,WOc], is predicted to be solely 2.7 kJ mol−1 higher in energy compared to the global minimum structure. This type of conformer has not been observed in the spectra of the smaller water complexes of Li+GlyGly, even though it was always predicted close in energy to the most stable structure. While the band position agreement with experiment seems to be fairly good for [WN,W,Oa,WOc] for most vibrations, the band positions of both hydrogen bonded modes are overestimated with respect to the experimental bands at 3091/3141 cm−1 (prediction 3154 cm−1) and at 3481 cm−1 (prediction 3514 cm−1). As mentioned above, the band position of the weak water hydrogen bond to the carboxylic acid CO group is expected to be underestimated at the B3LYP/def2TZVP level, which is why [WN,W,Oa,WOc] can be discarded. The next higher in energy grey conformer, [WN,Oa,Oc,WW] (+1.1 kJ mol−1), can similarly be excluded based on an overestimation of its hydrogen bonded water band (3549 cm−1) with respect to experiment (3481 cm−1). The third most stable grey conformer, [WN,W,WOa,Oc], is a better fit for the fairly weak and broad band at 3091/3141 cm−1 with a prediction at 3065 cm−1. The second, weaker water hydrogen bond to the amide CO group matches the water band at 3481 cm−1 with a deviation of −6 cm−1. If the intensity of the strongly hydrogen bonded water band at 3091/3141 cm−1 is not lost due to coupling to other modes, the band of the OH stretch will not be intense enough to be observed considering the signal-to-noise ratio of the spectra. All in all, the spectral agreement of the grey conformers with the IRMPD spectrum is fairly low, yet a small contribution cannot be excluded, most likely of the [WN,W,WOa,Oc] conformer.
Overall, this very tentative analysis of the Li+GlyGly-3H2O spectra clearly illustrates how difficult the assignments get upon the addition of multiple waters, especially as experimental assignment aides such as IR–IR experiments are less meaningful. Recording deuterated water spectra, however, is clearly the most helpful experiment in guiding the assignments, as those reveal the peptide conformation(s) observed in those clusters. The predominant peptide conformation of Li+GlyGly-3H2O is one with non-hydrogen bonded NH and OH groups and mostly mid-strength water hydrogen bonds, as the most downshifted water bands around 3100 cm−1 are fairly weak with respect to those at 3411 and 3481 cm−1. The most likely assignment is the global minimum conformer [WW,N,W,Oa] with a small additional population of conformer(s) with a hydrogen bonded NH group (most likely [Oa,W,WOc,W]), conclusions which were largely possible even without any guidance from quantum chemical calculations.
6 Impact of the electric field and solvation on the structure and vibrations of the metal ion-peptide complexes
After the assignment of the Li+GlyGly-1H2O-1D2 and Li+GlyGly-2H2O conformers in our spectra and the tentative analysis of the Li+GlyGly-3H2O spectrum, we can now discuss the structural impact of the electric field of the Li+ ion. In a previous IRPD study of alkali metal ion di- and triglycine complexes using Li+, Na+, and K+, it was shown that the electric field of the metal ion had an impact on the vibrations as well as the structure of those complexes.12 One very sensitive probe of the electric field strength was shown to be the OH stretching vibration, which downshifts approximately linearly with electric field strength as a result of the vibrational Stark effect.9,12 As such, we have plotted the five OH stretching band positions observed in the Li+GlyGly-nH2O spectra alongside that of the Li+GlyGly complex as a function of electric field strength, qMNPA , in Fig. 6A. The electric field strength was approximated from the distance of the Li+ ion to the midpoint of the OH bond RM+OH in B3YLP-D3(BJ)/def2TZVP calculations and the charge on the Li+ ion, qMNPA, is obtained from a natural population analysis (NPA) using the natural bond orbital (NBO) program (version 7),72,73 as this method was shown to worked well for similar systems in the past.9,12,29,86 The thus obtained NPA charges are very close to +1 and slightly decrease with the number of water molecules. For Li+GlyGly, the charge is predicted to be +0.96 and decreases from +(0.92–0.93) for the Li+GlyGly-1H2O complexes to +0.89 for Li+GlyGly-2/3H2O. Overall, this indicates that charge transfer does not play a significant role in these complexes.
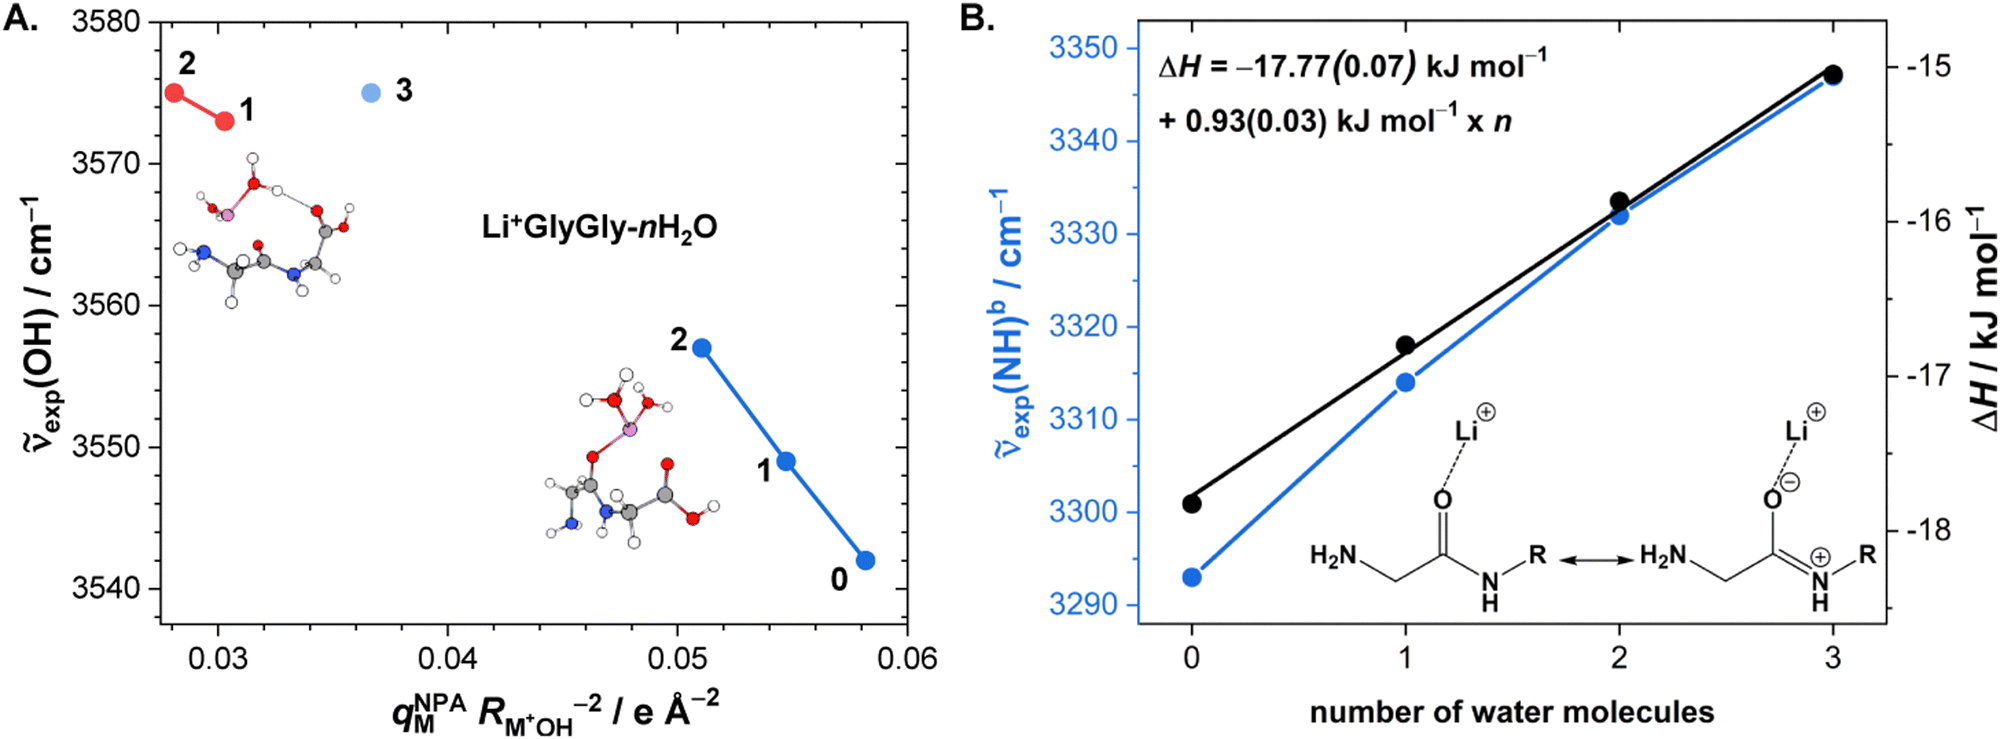 | ||
Fig. 6 (A) Experimental band position of the OH stretching vibration in Li+GlyGly-nH2O complexes as a function of the electric field strength, with qNPAM the charge of the Li+ ion determined with the natural population analysis72,73 and RM+OH the distance of the Li+ ion to the midpoint of the OH group, calculated at the B3LYP-D3(BJ)/def2TZVP level. (B) Experimental band position of the hydrogen bonded NH stretching vibration in Li+GlyGly-nH2O complexes as a function of the number of water molecules n as well as approximated hydrogen bond enthalpies determined from the square root of the hydrogen bond induced downshift 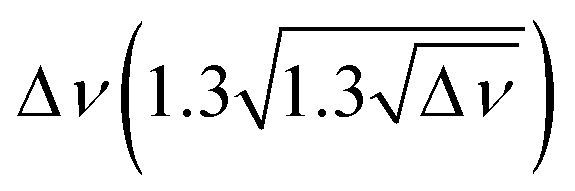 85 with respect to a free (non-hydrogen bonded) NH stretching band (3481 cm−1, free NH stretch of [W,N,Oa,WOc], see Fig. 4). A linear fit of ΔH as a function of n is shown by a black line (ΔH = (−17.77(0.07) + 0.93(0.03) × n) kJ mol−1). 85 with respect to a free (non-hydrogen bonded) NH stretching band (3481 cm−1, free NH stretch of [W,N,Oa,WOc], see Fig. 4). A linear fit of ΔH as a function of n is shown by a black line (ΔH = (−17.77(0.07) + 0.93(0.03) × n) kJ mol−1). | ||
Fig. 6A shows a linear decrease of the OH stretch band position with electric field strength for the conformers with an internal hydrogen bond up to two water molecules (blue data points). Assuming that the OH stretching band at 3575 cm−1 also contains contributions from a conformer with an internal hydrogen bond and estimating the electric field strength for the lowest-energy conformation of those with a non hydrogen bonded carboxylic OH stretch ([Oa,W,WOc,W], cf.Fig. 5) yields an electric field strength of 0.037 e Å−2, which still matches the linear trend roughly (light blue data point in Fig. 6). The reasons for the decreasing electric field strength with increasing number of water molecules are two-fold – the distance between the metal ion and the OH group increases as the water molecules are pulling the metal ion further away from the peptide with increases in RM+OH of 0.04 Å upon the addition of the first water and 0.07 Å upon the addition of the second water, respectively. The second reason is the aforementioned predicted small decrease in charge on the metal ion (+0.96 to +0.89), which is equally distributed over the cluster.
Due to the much larger distance between the metal ion and the OH group (4.1 versus 5.5 Å for Li+GlyGly-1H2O and 4.2 versus 5.6 Å for Li+GlyGly-2H2O), the electric field strength at the midpoint of the OH group is significantly lower in the [N,Oa,WOc] and [W,N,Oa,WOc] conformers (red data points in Fig. 6A). As the [N,Oa,Oc] conformer is not observed for Li+GlyGly in our spectra, no information about the OH stretching shift as a function of electric field strength can be obtained.
Interesting is also the change in hydrogen bond strength upon the addition of water, shown in Fig. 6B. In blue, the band positions of the hydrogen bonded NH stretching vibration ν(NH)b are depicted, which decrease almost linearly as a function of the number of water molecules n. Rozenberg and co-workers have shown that the hydrogen bond enthalpy ΔH can be approximated from the square root of the hydrogen bond induced band position shift Δ![[small nu, Greek, tilde]](https://www.rsc.org/images/entities/i_char_e0e1.gif) multiplied by one-third.85 To estimate ΔH and its decrease with n, we use the free NH stretching vibration observed for the [W,N,Oa,WOc] conformer in the Li+GlyGly-2H2O spectra at 3481 cm−1 as a reference point for Δ, which is within the band position range of free NH stretching vibrations observed for M+GlyGly and M+GlyGlyGly complexes with M+ = Li+, Na+, and K+ (3480–3487 cm−1).12 The thus estimated ΔH values (black data points in Fig. 6B) decrease linearly with the number of water molecules, meaning that the addition of each water molecule decreases the hydrogen bond strength by roughly the same amount. This decrease in hydrogen bond strength by the addition of water to the Li+ ion can be rationalised as an electric field effect. The electric field of the metal ion polarises the CO bond, which results in a shorter CN bond and therefore a more acidic amide NH proton (cf. amide resonance structures in the inlet of Fig. 6B). Changing the metal ion from Li+ to K+ was shown to reduce the strength of the internal hydrogen bond, as a result of the decrease in electric field strength due to the larger metal ion-peptide distance for the K+GlyGly compared to the Li+GlyGly complex.12 The addition of water has a similar effect – it reduces the electric field experienced by the peptide as it increases the distance between the metal ion and the peptide, as seen in Fig. 6A for the OH stretch. The resulting decrease in hydrogen bond enthalpy per water molecule is approximated to be 0.93(0.03) kJ mol−1 by a linear fit, shown as a solid black line in Fig. 6B.
multiplied by one-third.85 To estimate ΔH and its decrease with n, we use the free NH stretching vibration observed for the [W,N,Oa,WOc] conformer in the Li+GlyGly-2H2O spectra at 3481 cm−1 as a reference point for Δ, which is within the band position range of free NH stretching vibrations observed for M+GlyGly and M+GlyGlyGly complexes with M+ = Li+, Na+, and K+ (3480–3487 cm−1).12 The thus estimated ΔH values (black data points in Fig. 6B) decrease linearly with the number of water molecules, meaning that the addition of each water molecule decreases the hydrogen bond strength by roughly the same amount. This decrease in hydrogen bond strength by the addition of water to the Li+ ion can be rationalised as an electric field effect. The electric field of the metal ion polarises the CO bond, which results in a shorter CN bond and therefore a more acidic amide NH proton (cf. amide resonance structures in the inlet of Fig. 6B). Changing the metal ion from Li+ to K+ was shown to reduce the strength of the internal hydrogen bond, as a result of the decrease in electric field strength due to the larger metal ion-peptide distance for the K+GlyGly compared to the Li+GlyGly complex.12 The addition of water has a similar effect – it reduces the electric field experienced by the peptide as it increases the distance between the metal ion and the peptide, as seen in Fig. 6A for the OH stretch. The resulting decrease in hydrogen bond enthalpy per water molecule is approximated to be 0.93(0.03) kJ mol−1 by a linear fit, shown as a solid black line in Fig. 6B.
The reduction of the NH⋯NH2 hydrogen bond strength as a function of the number of solvent molecules due to the decreasing electric field strength is consistent with the increase in competition from conformers without this internal hydrogen bond, as readily seen in the deuterated spectra in Fig. 1 by the appearance of a band of free NH stretching vibration ν(NH)f. Such a decrease in (individual) hydrogen bond strength upon the addition of solvent is also seen for the conformers with HO–H⋯OC hydrogen bonding to the peptide carbonyl group (spectral upshift of +15 cm−1 from [N,Oa,WOc] to [W,N,Oa,WOc]) and marks the onset of the increasing conformational flexibility in larger water clusters.
While this analysis of the electric field effects on the vibrations in the Li+GlyGly-nH2O complexes from the partial charge on the Li+ ion and the distance to the midpoint of the OH bond does not include all possible effects such as charge transfer or partial covalency effects, which are presumably small as indicated by the estimated partial charges close to +1, it provides a useful molecular-level understanding that can explain the largest contribution to those shifts.
7 Conclusions
In this work, we have studied the impact of solvation on the electric field strength and structure in lithium diglycine (Li+GlyGly) upon the sequential addition of up to three water molecules. Water solvation is shown to weaken an internal NH⋯NH2 hydrogen bond in the peptide backbone. This is a result of the weakening of the electric field strength of the Li+ ion experienced by the peptide due to the increased metal ion peptide distance in those water clusters compared to the bare Li+GlyGly complex. The OH stretching vibration is a useful probe of this decrease in electric field strength, as its vibrational Stark shift is on the order of a few tens of cm−1 in those clusters. The NH⋯NH2 hydrogen bond strength decrease upon the addition of water is shown to be approximately linear, as the H2O molecules preferentially bind to the metal ion in those clusters. Unsurprisingly, this decrease in hydrogen bond strength coincides with an increase in competition from conformers without this hydrogen bond in the peptide backbone and initiates the onset of the wealth of conformational flexibility in larger water clusters. The addition of two solvent molecules is sufficient to change the preferential conformation of the peptide to a structure where the terminal amine group binds to the metal ion instead of accepting a hydrogen bond from the amide NH group. The conformer with this internal hydrogen bond, however, was shown to contribute to the spectra to a smaller extent up to three water molecules. The presence of multiple conformers was already observed upon the addition of the first water molecule despite the low temperatures of ≈10 K the ions are equilibrated to in our experiments. Estimations of thermal effects indicate that some of the population of those conformers might be caused by preserving some thermally populated conformers in our cryogenic ion traps, even though the temperature at which those are frozen out is hard to experimentally determine. This highlights the need for a better understanding of the cooling process in cryogenic ion traps, which are commonly used in spectroscopic experiments to reduce the spectral complexity.One of the largest challenges in the assignment of vibrational spectra of water complexes remains the description of hydrogen bond strengths in those systems, which tend to be poorly described by DFT methods. The comparison of experimental band positions to the results of scaled harmonic predictions of various DFT and ab initio methods highlights that most DFT methods exhibits errors on the order of tens of cm−1. One way of reducing those is to use ab initio methods like MP2 instead, which is computationally demanding and therefore not feasible for larger system sizes. Another way to reduce the band position deviations is to neglect long-range corrections such as the D3 dispersion correction. However, such an improvement of the results for the wrong reason is not necessarily desirable as it leaves room for wrong results for the right reason. The development of cost-efficient methods for the description of hydrogen bonded systems clearly remains one of the largest challenges for the accurate description of solvated clusters. The assignment of our Li+GlyGly-nH2O spectra with n = 0–3 was shown to be particularly difficult for clusters with more than two water molecules, where this deficiency in the water hydrogen bond description is very challenging for definite assignments. The most useful assignment aid is the comparison of spectra recorded with D2O to those with H2O, as it allows for the distinction of peptide and water vibrations. In a peptide as rigid as diglycine, this is sufficient to determine the peptide configuration in the conformers accurately without any help from quantum chemical predictions. For structurally more flexible peptides, selective 15N, 18O, and 13C labelling will become an important additional assignment guide of the peptide conformation in such water clusters.
Author contributions
K. A. E. Meyer: conceptualization; investigation; formal analysis; writing – original draft preparation; writing – review & editing. E. Garand: conceptualization; resources; writing – review & editing.Conflicts of interest
There are no conflicts to declare.Acknowledgements
This work was supported by the US Department of Energy, Office of Science, Basic Energy Sciences, under award no. DE-SC0018902. KAEM gratefully acknowledges a postdoctoral fellowship funded by the Deutsche Forschungsgemeinschaft (DFG, German Research Foundation) – 452620003. KAEM thanks Dr Arman Nejad for very insightful discussions.Notes and references
- M. R. Nechay, N. M. Gallup, A. Morgenstern, Q. A. Smith, M. E. Eberhart and A. N. Alexandrova, J. Phys. Chem. B, 2016, 120, 5884–5895 CrossRef CAS PubMed.
- N. G. Léonard, R. Dhaoui, T. Chantarojsiri and J. Y. Yang, ACS Catal., 2021, 11, 10923–10932 CrossRef PubMed.
- V. V. Welborn, L. R. Pestana and T. Head-Gordon, Nat. Catal., 2018, 1, 649–655 CrossRef.
- W.-L. Li and T. Head-Gordon, ACS Cent. Sci., 2020, 7, 72–80 CrossRef PubMed.
- M. M. Waegele, R. M. Culik and F. Gai, J. Phys. Chem. Lett., 2011, 2, 2598–2609 CrossRef CAS PubMed.
- S. D. Fried, S. Bagchi and S. G. Boxer, Science, 2014, 346, 1510–1514 CrossRef CAS PubMed.
- S. H. Schneider and S. G. Boxer, J. Phys. Chem. B, 2016, 120, 9672–9684 CrossRef CAS PubMed.
- S. H. Schneider, H. T. Kratochvil, M. T. Zanni and S. G. Boxer, J. Phys. Chem. B, 2017, 121, 2331–2338 CrossRef CAS PubMed.
- B. M. Marsh, J. Zhou and E. Garand, Phys. Chem. Chem. Phys., 2015, 17, 25786–25792 RSC.
- J. K. Denton, P. J. Kelleher, M. A. Johnson, M. D. Baer, S. M. Kathmann, C. J. Mundy, B. A. W. Rudd, H. C. Allen, T. H. Choi and K. D. Jordan, Proc. Natl. Acad. Sci. U. S. A., 2019, 116, 14874–14880 CrossRef CAS PubMed.
- M. M. Foreman and J. M. Weber, J. Phys. Chem. Lett., 2022, 13, 8558–8563 CrossRef CAS PubMed.
- K. A. E. Meyer, K. A. Nickson and E. Garand, J. Chem. Phys., 2022, 157, 174301 CrossRef CAS PubMed.
- A. Mohamed, S. C. Edington, M. Secor, J. R. Breton, S. Hammes-Schiffer and M. A. Johnson, J. Phys. Chem. A, 2023, 127, 1413–1421 CrossRef CAS PubMed.
- A. H. Abikhodr, V. Yatsyna, A. B. Faleh, S. Warnke and T. R. Rizzo, Anal. Chem., 2021, 93, 14730–14736 CrossRef CAS PubMed.
- P. Bansal, A. B. Faleh, S. Warnke and T. R. Rizzo, J. Am. Soc. Mass Spectrom., 2023, 34, 695–700 CrossRef CAS PubMed.
- C. Kirschbaum, K. Greis, L. Polewski, S. Gewinner, W. Schöllkopf, G. Meijer, G. von Helden and K. Pagel, J. Am. Chem. Soc., 2021, 143, 14827–14834 CrossRef CAS PubMed.
- C. Kirschbaum, R. S. E. Young, K. Greis, J. P. Menzel, S. Gewinner, W. Schöllkopf, G. Meijer, G. von Helden, T. Causon, V. R. Narreddula, B. L. J. Poad, S. J. Blanksby and K. Pagel, Chem. Sci., 2023, 14, 2518–2527 RSC.
- C. Kapota, J. Lemaire, P. Maître and G. Ohanessian, J. Am. Chem. Soc., 2004, 126, 1836–1842 CrossRef CAS PubMed.
- P. B. Armentrout, M. T. Rodgers, J. Oomens and J. D. Steill, J. Phys. Chem. A, 2008, 112, 2248–2257 CrossRef CAS PubMed.
- J. T. O'Brien, J. S. Prell, J. D. Steill, J. Oomens and E. R. Williams, J. Phys. Chem. A, 2008, 112, 10823–10830 CrossRef PubMed.
- R. C. Dunbar, A. C. Hopkinson, J. Oomens, C.-K. Siu, K. W. M. Siu, J. D. Steill, U. H. Verkerk and J. Zhao, J. Phys. Chem. B, 2009, 113, 10403–10408 CrossRef CAS PubMed.
- J. K. Martens, I. Compagnon, E. Nicol, T. B. McMahon, C. Clavaguéra and G. Ohanessian, J. Phys. Chem. Lett., 2012, 3, 3320–3324 CrossRef CAS.
- C. Baldauf, K. Pagel, S. Warnke, G. von Helden, B. Koksch, V. Blum and M. Scheffler, Chem. – Eur. J., 2013, 19, 11224–11234 CrossRef CAS PubMed.
- J. Oomens, N. C. Polfer, G. Berden and J. R. Eyler, Eur. J. Mass Spectrom., 2019, 25, 86–96 CrossRef CAS PubMed.
- P. B. Armentrout, G. C. Boles, M. Ghiassee, G. Berden and J. Oomens, J. Phys. Chem. A, 2021, 125, 6348–6355 CrossRef CAS PubMed.
- Y. Suzuki, K. Hirata, J. M. Lisy, S.-i. Ishiuchi and M. Fujii, J. Phys. Chem. A, 2021, 125, 9609–9618 CrossRef CAS PubMed.
- Y. Suzuki, K. Hirata, J. M. Lisy, S.-i. Ishiuchi and M. Fujii, Phys. Chem. Chem. Phys., 2022, 24, 20803–20812 RSC.
- S. Tanabe, K. Hirata, K. Tsukiyama, J. M. Lisy, S.-i. Ishiuchi and M. Fujii, J. Phys. Chem. Lett., 2023, 14, 2886–2890 CrossRef CAS PubMed.
- A. Kamariotis, O. V. Boyarkin, S. R. Mercier, R. D. Beck, M. F. Bush, E. R. Williams and T. R. Rizzo, J. Am. Chem. Soc., 2006, 128, 905–916 CrossRef CAS PubMed.
- N. S. Nagornova, T. R. Rizzo and O. V. Boyarkin, Science, 2012, 336, 320–323 CrossRef CAS PubMed.
- J. M. Voss, K. C. Fischer and E. Garand, J. Phys. Chem. Lett., 2018, 9, 2246–2250 CrossRef CAS PubMed.
- K. C. Fischer, S. L. Sherman, J. M. Voss, J. Zhou and E. Garand, J. Phys. Chem. A, 2019, 123, 3355–3366 CrossRef CAS PubMed.
- S. L. Sherman, K. A. Nickson and E. Garand, J. Phys. Chem. Lett., 2022, 13, 2046–2050 CrossRef CAS PubMed.
- T. Khuu, S. J. Stropoli, K. Greis, N. Yang and M. A. Johnson, J. Chem. Phys., 2022, 157, 131102 CrossRef CAS PubMed.
- G. D. Santis, N. Takeda, K. Hirata, K. Tsuruta, S.-i. Ishiuchi, S. S. Xantheas and M. Fujii, J. Am. Chem. Soc., 2022, 144, 16698–16702 CrossRef CAS PubMed.
- K. Hirata, F. Haddad, O. Dopfer, S.-i. Ishiuchi and M. Fujii, Phys. Chem. Chem. Phys., 2022, 24, 5774–5779 RSC.
- K. Akasaka, K. Hirata, F. Haddad, O. Dopfer, S.-i. Ishiuchi and M. Fujii, Phys. Chem. Chem. Phys., 2023, 25, 4481–4488 RSC.
- E. Garand, J. Phys. Chem. A, 2018, 122, 6479–6490 CrossRef CAS PubMed.
- O. C. Bridgeman and E. W. Aldrich, J. Heat Transfer, 1964, 86, 279–286 CrossRef CAS.
- N. C. Polfer, Chem. Soc. Rev., 2011, 40, 2211–2221 RSC.
- B. M. Elliott, R. A. Relph, J. R. Roscioli, J. C. Bopp, G. H. Gardenier, T. L. Guasco and M. A. Johnson, J. Chem. Phys., 2008, 129, 094303 CrossRef PubMed.
- C. M. Leavitt, A. B. Wolk, J. A. Fournier, M. Z. Kamrath, E. Garand, M. J. Van Stipdonk and M. A. Johnson, J. Phys. Chem. Lett., 2012, 3, 1099–1105 CrossRef CAS PubMed.
- J. M. Voss, S. J. Kregel, K. C. Fischer and E. Garand, J. Am. Soc. Mass Spectrom., 2018, 29, 42–50 CrossRef CAS PubMed.
- S. Grimme, J. Chem. Theory Comput., 2019, 15, 2847–2862 CrossRef CAS PubMed.
- M. J. Frisch, G. W. Trucks, H. B. Schlegel, G. E. Scuseria, M. A. Robb, J. R. Cheeseman, G. Scalmani, V. Barone, G. A. Petersson, H. Nakatsuji, X. Li, M. Caricato, A. V. Marenich, J. Bloino, B. G. Janesko, R. Gomperts, B. Mennucci, H. P. Hratchian, J. V. Ortiz, A. F. Izmaylov, J. L. Sonnenberg, D. Williams-Young, F. Ding, F. Lipparini, F. Egidi, J. Goings, B. Peng, A. Petrone, T. Henderson, D. Ranasinghe, V. G. Zakrzewski, J. Gao, N. Rega, G. Zheng, W. Liang, M. Hada, M. Ehara, K. Toyota, R. Fukuda, J. Hasegawa, M. Ishida, T. Nakajima, Y. Honda, O. Kitao, H. Nakai, T. Vreven, K. Throssell, J. A. Montgomery, Jr., J. E. Peralta, F. Ogliaro, M. J. Bearpark, J. J. Heyd, E. N. Brothers, K. N. Kudin, V. N. Staroverov, T. A. Keith, R. Kobayashi, J. Normand, K. Raghavachari, A. P. Rendell, J. C. Burant, S. S. Iyengar, J. Tomasi, M. Cossi, J. M. Millam, M. Klene, C. Adamo, R. Cammi, J. W. Ochterski, R. L. Martin, K. Morokuma, O. Farkas, J. B. Foresman and D. J. Fox, Gaussian 16 Revision C.01, Gaussian Inc., Wallingford CT, 2019 Search PubMed.
- S. Grimme, J. Comput. Chem., 2006, 27, 1787–1799 CrossRef CAS PubMed.
- F. Weigend and R. Ahlrichs, Phys. Chem. Chem. Phys., 2005, 7, 3297 RSC.
- C. Lee, W. Yang and R. G. Parr, Phys. Rev. B, 1988, 37, 785–789 CrossRef CAS PubMed.
- A. D. Becke, J. Chem. Phys., 1993, 98, 5648–5652 CrossRef CAS.
- S. Grimme, J. Antony, S. Ehrlich and H. Krieg, J. Chem. Phys., 2010, 132, 154104 CrossRef PubMed.
- S. Grimme, S. Ehrlich and L. Goerigk, J. Comput. Chem., 2011, 32, 1456–1465 CrossRef CAS PubMed.
- J.-D. Chai and M. Head-Gordon, Phys. Chem. Chem. Phys., 2008, 10, 6615–6620 RSC.
- Y. Zhao and D. G. Truhlar, Theor. Chem. Acc., 2007, 120, 215–241 Search PubMed.
- J. J. P. Stewart, J. Comput. Chem., 1989, 10, 209–220 CrossRef CAS.
- J. J. P. Stewart, J. Comput. Chem., 1989, 10, 221–264 CrossRef CAS.
- C. Møller and M. S. Plesset, Phys. Rev., 1934, 46, 618–622 CrossRef.
- M. Head-Gordon, J. A. Pople and M. J. Frisch, Chem. Phys. Lett., 1988, 153, 503–506 CrossRef CAS.
- S. Grimme, J. Chem. Phys., 2006, 124, 034108 CrossRef PubMed.
- F. Neese, Wiley Interdiscip. Rev.: Comput. Mol. Sci., 2012, 2, 73–78 CAS.
- F. Neese, Wiley Interdiscip. Rev.: Comput. Mol. Sci., 2018, 8, e1327 Search PubMed.
- F. Neese, F. Wennmohs, U. Becker and C. Riplinger, J. Chem. Phys., 2020, 152, 224108 CrossRef CAS PubMed.
- E. Baerends, D. E. Ellis and P. Ros, Chem. Phys., 1973, 2, 41–51 CrossRef CAS.
- J. L. Whitten, J. Chem. Phys., 1973, 58, 4496–4501 CrossRef CAS.
- B. I. Dunlap, J. W. D. Connolly and J. R. Sabin, J. Chem. Phys., 1979, 71, 3396–3402 CrossRef CAS.
- T. H. Dunning Jr, J. Chem. Phys., 1989, 90, 1007–1023 CrossRef.
- B. P. Prascher, D. E. Woon, K. A. Peterson, T. H. Dunning Jr and A. K. Wilson, Theor. Chem. Acc., 2010, 128, 69–82 Search PubMed.
- D. G. Liakos, M. Sparta, M. K. Kesharwani, J. M. L. Martin and F. Neese, J. Chem. Theory Comput., 2015, 11, 1525–1539 CrossRef CAS PubMed.
- C. Riplinger, B. Sandhoefer, A. Hansen and F. Neese, J. Chem. Phys., 2013, 139, 134101 CrossRef PubMed.
- S. F. Boys and F. Bernardi, Mol. Phys., 1970, 19, 553–566 CrossRef CAS.
- B. Liu and A. D. McLean, J. Chem. Phys., 1980, 72, 3418–3419 CrossRef CAS.
- B. Liu and A. D. McLean, J. Chem. Phys., 1989, 91, 2348–2359 CrossRef CAS.
- F. Weinhold, C. R. Landis and E. D. Glendening, Int. Rev. Phys. Chem., 2016, 35, 399–440 Search PubMed.
- E. D. Glendening, J. K. Badenhoop, A. E. Reed, J. E. Carpenter, J. A. Bohmann, C. M. Morales, P. Karafiloglou, C. R. Landis and F. Weinhold, NBO 7.0., Theoretical Chemistry Institute, University of Wisconsin, Madison, WI, 2018 Search PubMed.
- K. E. Otto, Z. Xue, P. Zielke and M. A. Suhm, Phys. Chem. Chem. Phys., 2014, 16, 9849–9858 RSC.
- P. E. Fraley and K. N. Rao, J. Mol. Spectrosc., 1969, 29, 348–364 CrossRef CAS.
- Y.-C. Chan and D. J. Nesbitt, J. Mol. Spectrosc., 2023, 392, 111743 CrossRef CAS.
- J. M. Voss, K. C. Fischer and E. Garand, J. Mol. Spectrosc., 2018, 347, 28–34 CrossRef CAS.
- S. L. Sherman, K. C. Fischer and E. Garand, J. Phys. Chem. A, 2022, 126, 4036–4045 CrossRef CAS PubMed.
- T. Carrington, J. Chem. Phys., 2017, 146, 120902 CrossRef PubMed.
- T. Forsting, H. C. Gottschalk, B. Hartwig, M. Mons and M. A. Suhm, Phys. Chem. Chem. Phys., 2017, 19, 10727–10737 RSC.
- T. Forsting, J. Zischang, M. A. Suhm, M. Eckhoff, B. Schröder and R. A. Mata, Phys. Chem. Chem. Phys., 2019, 21, 5989–5998 RSC.
- S. Oswald, N. A. Seifert, F. Bohle, M. Gawrilow, S. Grimme, W. Jäger, Y. Xu and M. A. Suhm, Angew. Chem., Int. Ed., 2019, 58, 5080–5084 CrossRef CAS PubMed.
- F. Kollipost, K. Papendorf, Y.-F. Lee, Y.-P. Lee and M. A. Suhm, Phys. Chem. Chem. Phys., 2014, 16, 15948–15956 RSC.
- S. Oswald and M. A. Suhm, Phys. Chem. Chem. Phys., 2019, 21, 18799–18810 RSC.
- M. Rozenberg, A. Loewenschuss and Y. Marcus, Phys. Chem. Chem. Phys., 2000, 2, 2699–2702 RSC.
- J. Narbutt, A. Wodyński and M. Pecul, Dalton Trans., 2015, 44, 2657–2666 RSC.
Footnote |
| † Electronic supplementary information (ESI) available: It contains details on the computational methods (keywords and scaling factors), a list of experimental band positions of the assigned conformers, results of additional DLPNO-CCSD(T)/aVQZ* calculations, as well as higher-energy conformers of the Li+ GlyGly-nH2O complexes. See DOI: https://doi.org/10.1039/d3cp06264c |
| This journal is © the Owner Societies 2024 |