
 Open Access Article
 This Open Access Article is licensed under a
 Creative Commons Attribution 3.0 Unported Licence
Mid-infrared spectroscopy of 1-cyanonaphthalene cation for astrochemical consideration†
Julianna
Palotás
 ,
Francis C.
Daly
,
Thomas E.
Douglas-Walker
and
Ewen K.
Campbell
*
,
Francis C.
Daly
,
Thomas E.
Douglas-Walker
and
Ewen K.
Campbell
*
School of Chemistry, University of Edinburgh, Joseph Black Building, Kings Buildings, David Brewster Road, Edinburgh EH9 3FJ, UK. E-mail: e.k.campbell@ed.ac.uk
First published on 10th January 2024
Abstract
We present the low temperature gas-phase vibrational spectrum of ionised 1-cyanonaphthalene (1-CNN+) in the mid-infrared region. Experimentally, 1-CNN+ ions are cooled below 10 K in a cryogenic ion trapping apparatus, tagged with He atoms and probed with tuneable radiation. Quantum-chemical calculations are carried out at a density functional theory level. The spectrum is dominated by the CN-stretch at 4.516 μm, with weaker CH modes near 3.2 μm.
1 Introduction
A set of infrared (IR) emission features originating from the planetary nebulae NGC 7027, BD+30°3639, and NGC 6572 were discovered in the 1970s,1,2 and termed the unidentified infrared bands (UIBs). Duley and Williams first discussed the wavelengths of these features in the context of the vibrational frequencies of aromatic materials.3 Polycyclic aromatic hydrocarbons (PAHs) were subsequently proposed as carrier molecules capable of explaining the astronomical observations, leading to the so-called PAH hypothesis.4,5 This is now widely known, and the prominent features at 3.3, 6.2, 7.7, 8.6, and 11.2 μm attributed to the vibrational modes of this class of molecule. The observed spectra are understood to arise due to emission of IR photons following absorption of ultraviolet (UV) radiation. PAHs giving rise to these features are suggested to account for 10% of the cosmically available carbon, and these species are believed to possess between 50 and 100 carbon atoms; a nice review of the topic was reported by Tielens.6 Note that other structures such as mixed aromatic/aliphatic organic nanoparticles,7 hydrogenated amorphous carbon,8 and hydrogenated fullerenes9 have also been proposed as carriers. Due to experimental challenges, the only laboratory emission studies on PAHs in the fingerprint region were reported by Saykally and co-workers.10,11One problem encountered with the analysis of spectra in the 5–15 μm range is due to the plethora of molecular structures capable of emitting at similar frequencies. A consequence is that association with individual members of the PAH or similar carbonaceous family is near impossible. An exception to this is the case of C60, which due to its high Ih symmetry possesses just four IR active modes, facilitating its detection in a young planetary12 and reflection nebula.13 Changes to the symmetry upon ionisation,14 protonation,15 or addition of other atoms to the outside of the C60 cage16,17 lead to significant changes in the IR spectra, and make unambiguous assignment to observational data more challenging.
Prior to 2018, the only purely aromatic molecular structure detected in the interstellar medium (ISM) was benzene, and this was achieved via association of just one IR feature at 14.85 μm to a bending mode.18–21 However, recently, its polar analogue benzonitrile was identified in TMC-122 based on its laboratory rotational spectroscopy.22–26 Follow-up observational studies of the same cloud have revealed the presence of larger aromatic structures such as 1- and 2-cyanonaphthalene.27,28 One motivation for radio-astronomical studies of these cyclic structures is due to the PAH hypothesis29 and the hitherto lack of detection of polycyclic aromatics in the ISM. McGuire et al. suggests that the benzonitrile itself may contribute to the PAH emission through its IR active CH- and CN-stretching modes near 3.3 and 4.5 μm, respectively.22,30,31
Recently, measurement of the dissociation rate of cyanonaphthalene cations at the DESIREE storage ring facility were reported.32 These experiments revealed a high stability of 1-CNN+ against dissociation, attributed to inverse internal conversion and recurrent fluorescence. This competitive route for radiative relaxation led Stockett et al. to suggest that the general consensus that small PAHs will undergo dissociation in the diffuse ISM should be revisited.32 This motivated a study of the electronic absorptions of 1-CNN+ in the laboratory under conditions relevant for comparison with astronomical observations of diffuse interstellar bands (DIBs).33 The D2 ← D0 electronic transition possesses an oscillator strength f = 0.075 and has an origin band at 7343 Å, falling in the wavelength region of interest for the DIBs. In observational data, the spectral region is polluted by telluric water lines and the study concludes that space-based observations are require to assess its abundance in the diffuse ISM.
In terms of astronomical observations in the IR, aside from the aromatic CH-stretching wavelength, the intermediate/mid-IR region from 1–5 μm is less explored than the >5 μm spectral range. However, emission bands at 4.4 and 4.65 μm have been reported originating from the ionisation bar in Orion and suggested to be caused by deuterated PAHs, whose CD-stretching modes fall in this part of the spectrum.34 An alternative explanation for emission at this wavelength may be the CN-stretch of PAHs containing cyano-groups, such as benzonitrile or cyanonaphthalene. This proposal is of contemporary interest given their identification in TMC-1 as mentioned above. Surprisingly, there appears to be a paucity of gas-phase laboratory data on the mid-IR spectra of cyano-substituted PAHs necessary to test this hypothesis. Spectra of argon tagged benzonitrile cation in the CH-stretching region were reported in ref. 35. More recently, vibrational spectra of neon tagged benzonitrile cation, and fragments produced by electron impact, were reported in ref. 36.
The charge state of PAHs is known to significantly affect the absolute and relative intensities of their infra-red active modes. For example, compared to their neutral counterparts, the intensities of the CH-stretch in PAH cations is drastically reduced, while the in-plane CC-stretching and CH-bending modes are stronger.37
In this contribution, low temperature gas-phase vibrational spectra of 1-CNN+–He are reported in the region 3.1–5 μm. These data were obtained following buffer gas cooling in a cryogenic ion trapping apparatus. Section 2.1 describes the experimental methods, and computational procedures are outlined in Section 2.2. The experimental data and its comparison with theory is presented in Section 3. Finally, the astrochemical implications are given in Section 4, and conclusions in Section 5.
2 Methodology
2.1 Experimental
The sample, apparatus and procedure used to carry out measurement of the infrared spectrum of 1-CNN+ is identical to that used to detect its electronic transitions as reported in detail recently by Daly et al. (2023).33,38 Only further information specific to the present measurements is given here. Spectroscopic investigation of 1-CNN+ was carried out by probing the 1-CNN+–He complexes (m/z = 157) synthesised in a linear quadrupole ion trap from mass-selected (m/z = 153) and buffer gas cooled 1-CNN+ ions (Tnom = 4 K). The singly charged 1-CNN cations were produced by 30 eV electron impact of the neutral gas sublimed from a sample of 1-CNN obtained from Alfa Aesar (95%).The ion cloud was irradiated by an OPO/OPA (LaserVision) pumped by a Nd:YAG (Amplitude Laser Inc.), producing nanosecond pulses at a repetition rate of 10 Hz. The ion cloud was exposed to 4 pulses of radiation per trapping cycle (1 Hz), with energies up to 20 mJ per pulse. Mid-IR radiation was focused into the ion trapping apparatus by a CaF2 positive meniscus lens (f = 1 m). The ion counts on the m/z 157 channel were detected on alternate trapping cycles with (Ni) and without (N0) interaction with OPO/OPA radiation. Exposure to radiation was controlled using a mechanical shutter. The detected attenuation was corrected for the number of background ions (NB) on this mass channel that did not dissociate following excitation of the D2 ← D0 electronic transition with high laser power as described in ref. 33. The presented spectra are corrected for changes to the OPO/OPA power with wavelength and plotted in terms of the relative cross-sections, σrel = −ln((Ni − NB)/(N0 − NB))/Φ, where Φ is the relative OPO/OPA fluence. To generate the spectra plotted in this article, the number of ions at each wavelength was averaged over 20 trapping cycles, and spectra are typically averaged over 5 individual scans.
To determine the accurate mid-IR wavelength of the OPA (2.128–5 μm), the wavelengths of the Nd:YAG and OPO signal output were recorded with a wavemeter (HighFiness Gmbh). The OPO/OPA was operated in two different modes: with a linewidth of either 1.7 or 3.7 cm−1, as noted in the Figure captions. Band maxima are reported with an uncertanity of ±0.8 cm−1.
2.2 Computational methods
Geometry optimizations and frequency calculations were performed at the density functional theory (DFT) level using the B3LYP/6-311+G(d,p) functional and basis set combination that has been known to predict the IR spectra of aromatic molecules accurately. To study the effect of the He tag on the IR spectrum, additional harmonic calculations were performed on 1-CNN+–He with the same functional and basis set by manually adding empirical dispersion (GD3 dispersion) to the computation.39 The vibrational frequencies were scaled by a factor of 0.9679.40 Anharmonic calculations within the vibrational second-order perturbation level of theory (VPT2) were performed with the same functional and basis set combination.All stick spectra were convoluted by a Lorentzian lineshape function with 4 cm−1 full width at half maximum (FWHM). All calculations used the Gaussian 16 software package installed at Eddie, the University's research compute cluster.41
3 Results
Fig. 1 presents the experimental IR spectrum of the 1-CNN+–He complex in the 2200–3200 cm−1 (4.6–3.1 μm) region. The spectrum is recorded as a function of wavelength with a step size of 10−4 μm, by monitoring the attenuation of the ions in the m/z 157 mass channel. A prominent band appears at 2214.7 cm−1 that is attributed to the CN-stretch of 1-CNN+. Relatively weak bands are present at 3114.6 cm−1 and 3131.1 cm−1 that belong to the CH-stretching modes. The lower signal-to-noise ratio in the longer wavelength range compared to the shorter wavelength part of the spectrum is due to lower power and atmospheric absorption of IR radiation in the laboratory. Based on quantum chemical calculations, we do not expect vibrational features of 1-CNN+–He in the part of the spectrum most affected (2300–2400 cm−1).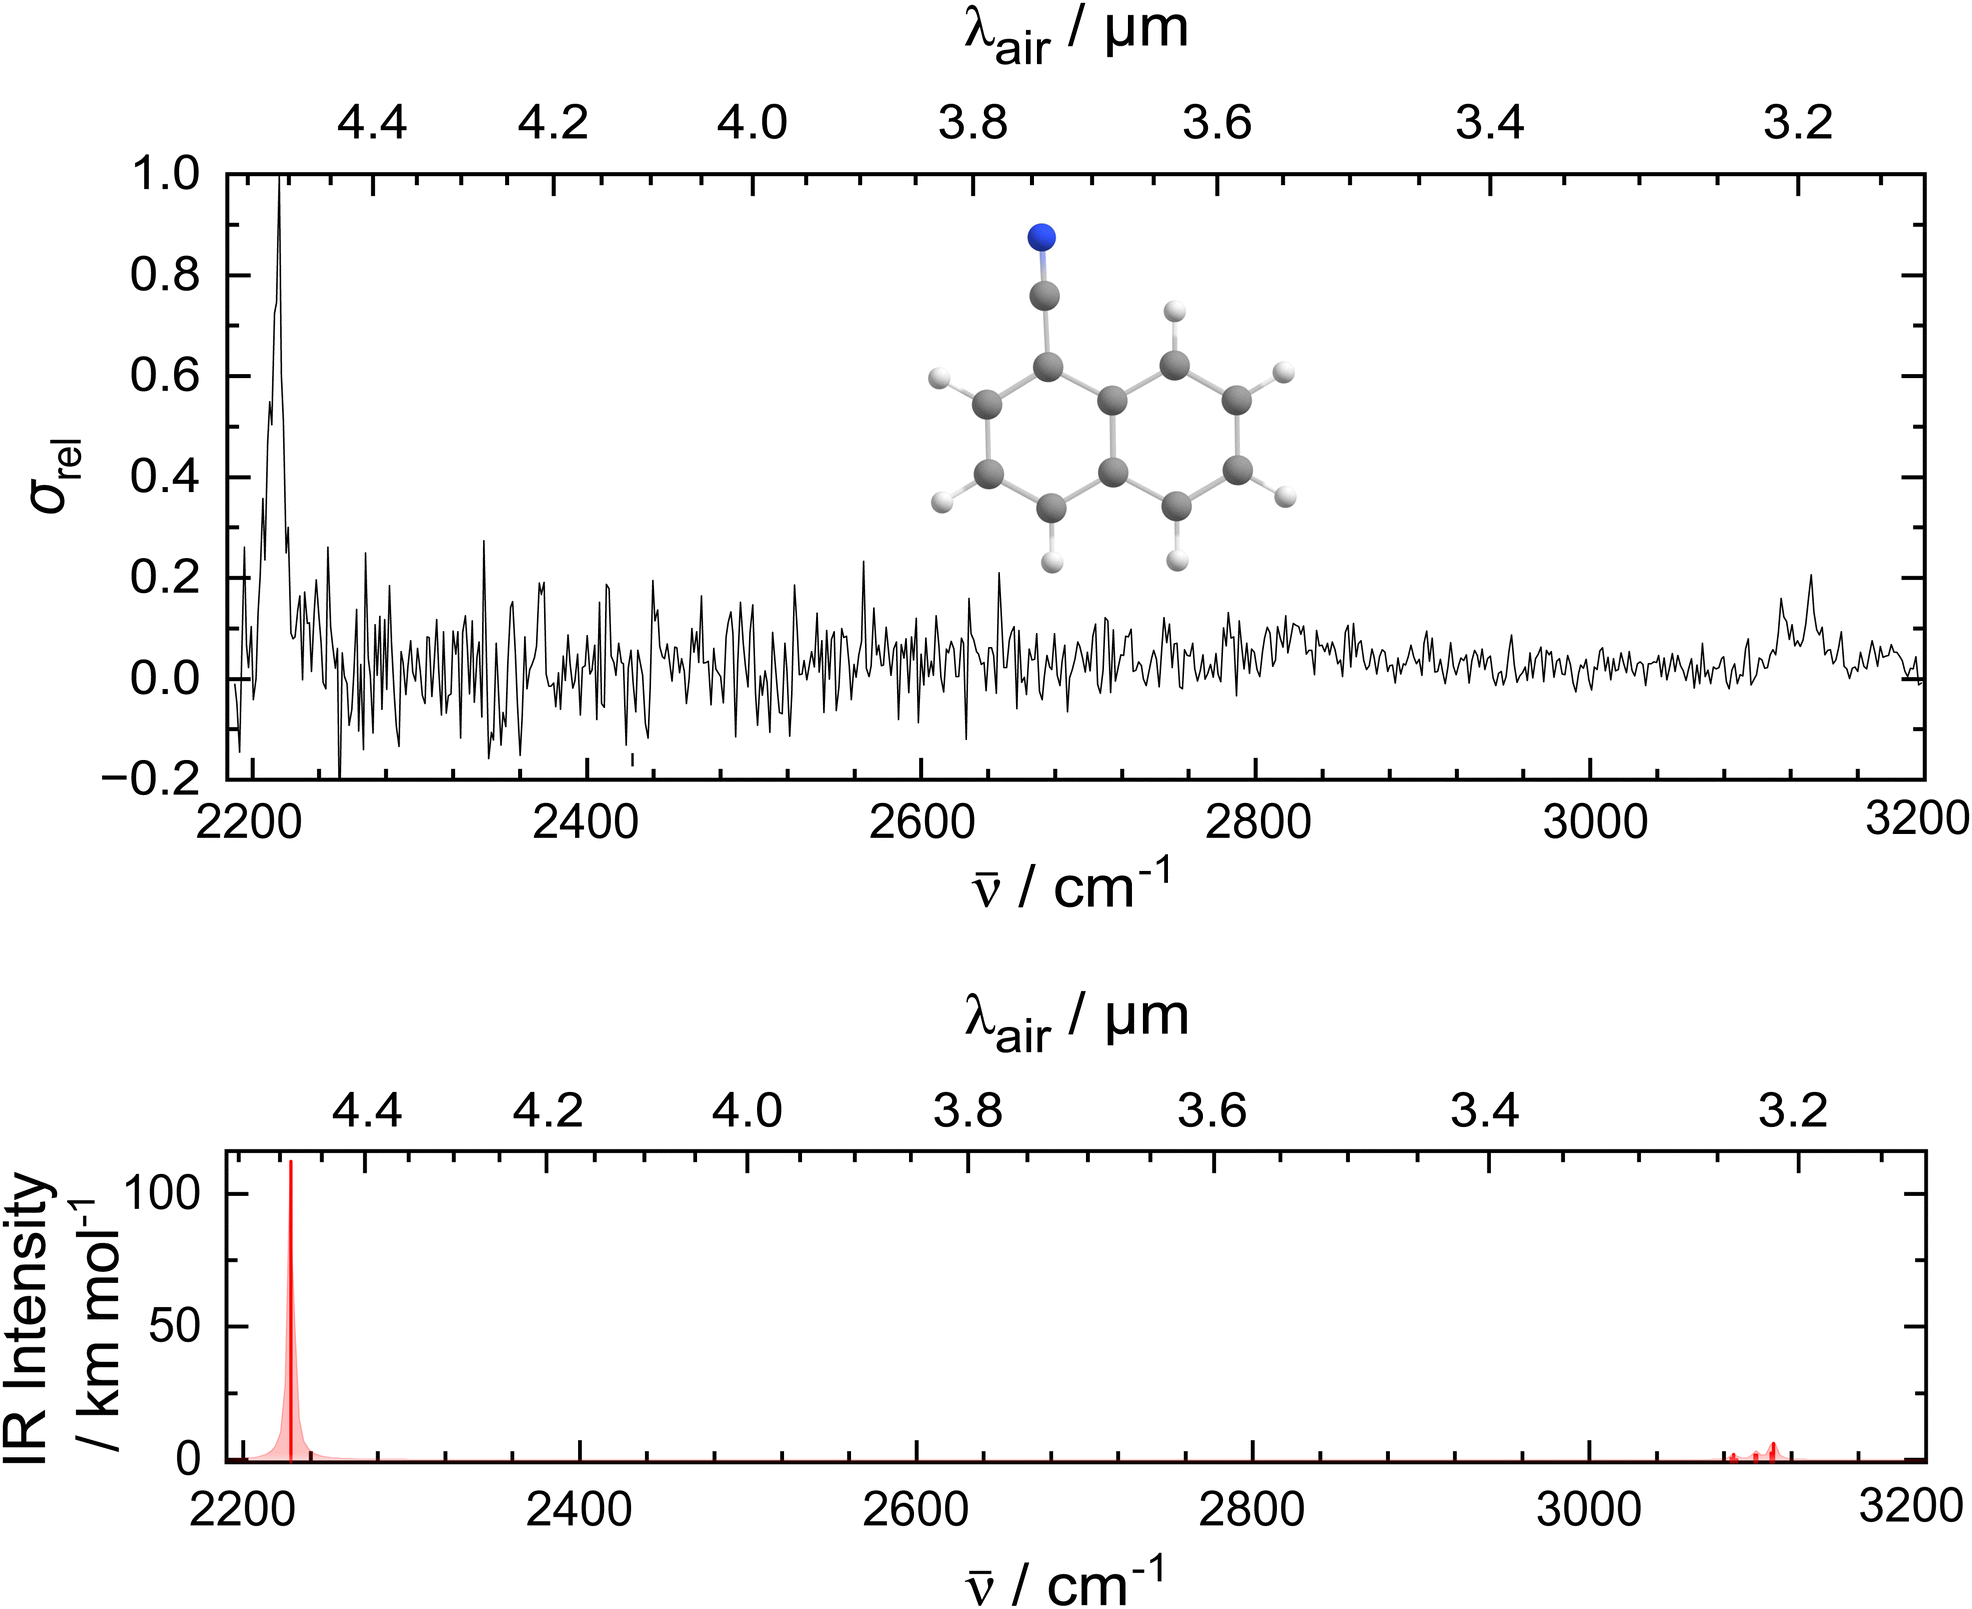 | ||
| Fig. 1 Photofragmentation spectrum of 1-CNN+–He recorded at a bandwidth of 3.7 cm−1. The feature at 2214.7 cm−1 has been attributed to the CN-stretch, whilst the features at 3114.6 cm−1 and 3131.1 cm−1 are due to CH-stretching modes. The bottom figure shows the harmonic calculation at the DFT level with B3LYP/6-311+G(d,p) using a 0.9679 scaling factor. The vibrational temperature was set to 4 K. The frequencies were convoluted with a Lorentzian function with a FWHM of 4 cm−1. | ||
Quantum chemical calculations were performed at the DFT level, and compared to the experimental IR spectrum in the bottom panel of Fig. 1. The computed IR spectrum of the bare ion is in good agreement with the experimental data: it places the CN-stretch at 2227.6 cm−1 and predicts a number of transitions in a narrow frequency range leading to CH-stretches at 3085.1, 3099.1 and 3109.1 cm−1. The theoretically projected ratio between the intensity of the vibrational modes is consistent with the experimentally observed IR bands.
In Table 1, the experimental and convoluted theoretical band positions are listed. Shifts between experiment and theory in the order of 10 cm−1 are found for the CN-stretch, while those for the CH features are up to a factor of 2 larger and opposite in sign.
| Experiment | B3LYP/6-311+G(d,p) | |
|---|---|---|
| 1-CNN+–He | 1-CNN+ | 1-CNN+–He |
| 2214.7 | 2227.6 | 2229.2 |
| 2226.7 | — | — |
| — | 3085.1 | 3082.2 |
| 3114.6 | 3099.1 | 3096.6 |
| 3131.1 | 3109.1 | 3108.0 |
In Fig. 2, the vibrational bands of the 1-CNN+–He complex are shown with higher spectral resolution by using 10−5 μm step size in the measurements. The top panel shows the absorptions originating from the CH-stretching modes. Besides the peaks at 3114.6 cm−1 and 3131.1 cm−1, a shoulder appears in the lower frequency region, and there may be a weaker band in between the two notable peaks. Due to the low signal-to-noise ratio in this part of the experimental spectrum, it is difficult to assess whether they are real IR features. Additionally, the CN-stretch is measured using a narrower bandwidth setting of the OPO (1.7 cm−1) and plotted on the bottom panel of Fig. 2. The experimental data are fitted with Lorentzian functions as these best reproduce the experimental shape. This may be due to lifetime broadening in the dissociation process. The fit places the stronger band at 2214.7 cm−1 with 4.0 cm−1 FWHM, and a weaker peak appears at 2226.7 cm−1 with 4.5 cm−1 FWHM. Additional anharmonic calculations were performed to analyse the vibrational features that cannot be explained by harmonic calculations. The side band of the CN-stretch could be attributed to anharmonic effects, like combination modes of fundamental vibrations or overtones. We explored this option as shown in the ESI.† The calculated combination modes of 1-CNN+ cannot explain the low intensity shoulder of the CN-stretch observed in the experiment. Alternatively, as it has been suggested for weak side bands in earlier reports on the IR spectrum of the aniline+− Ar complex,42 a mode arising from the van der Waals interaction between the tag and the bare ion could be responsible for the peak at 2226.7 cm−1. Higher level anharmonic calculations on the He complex may give further insight.
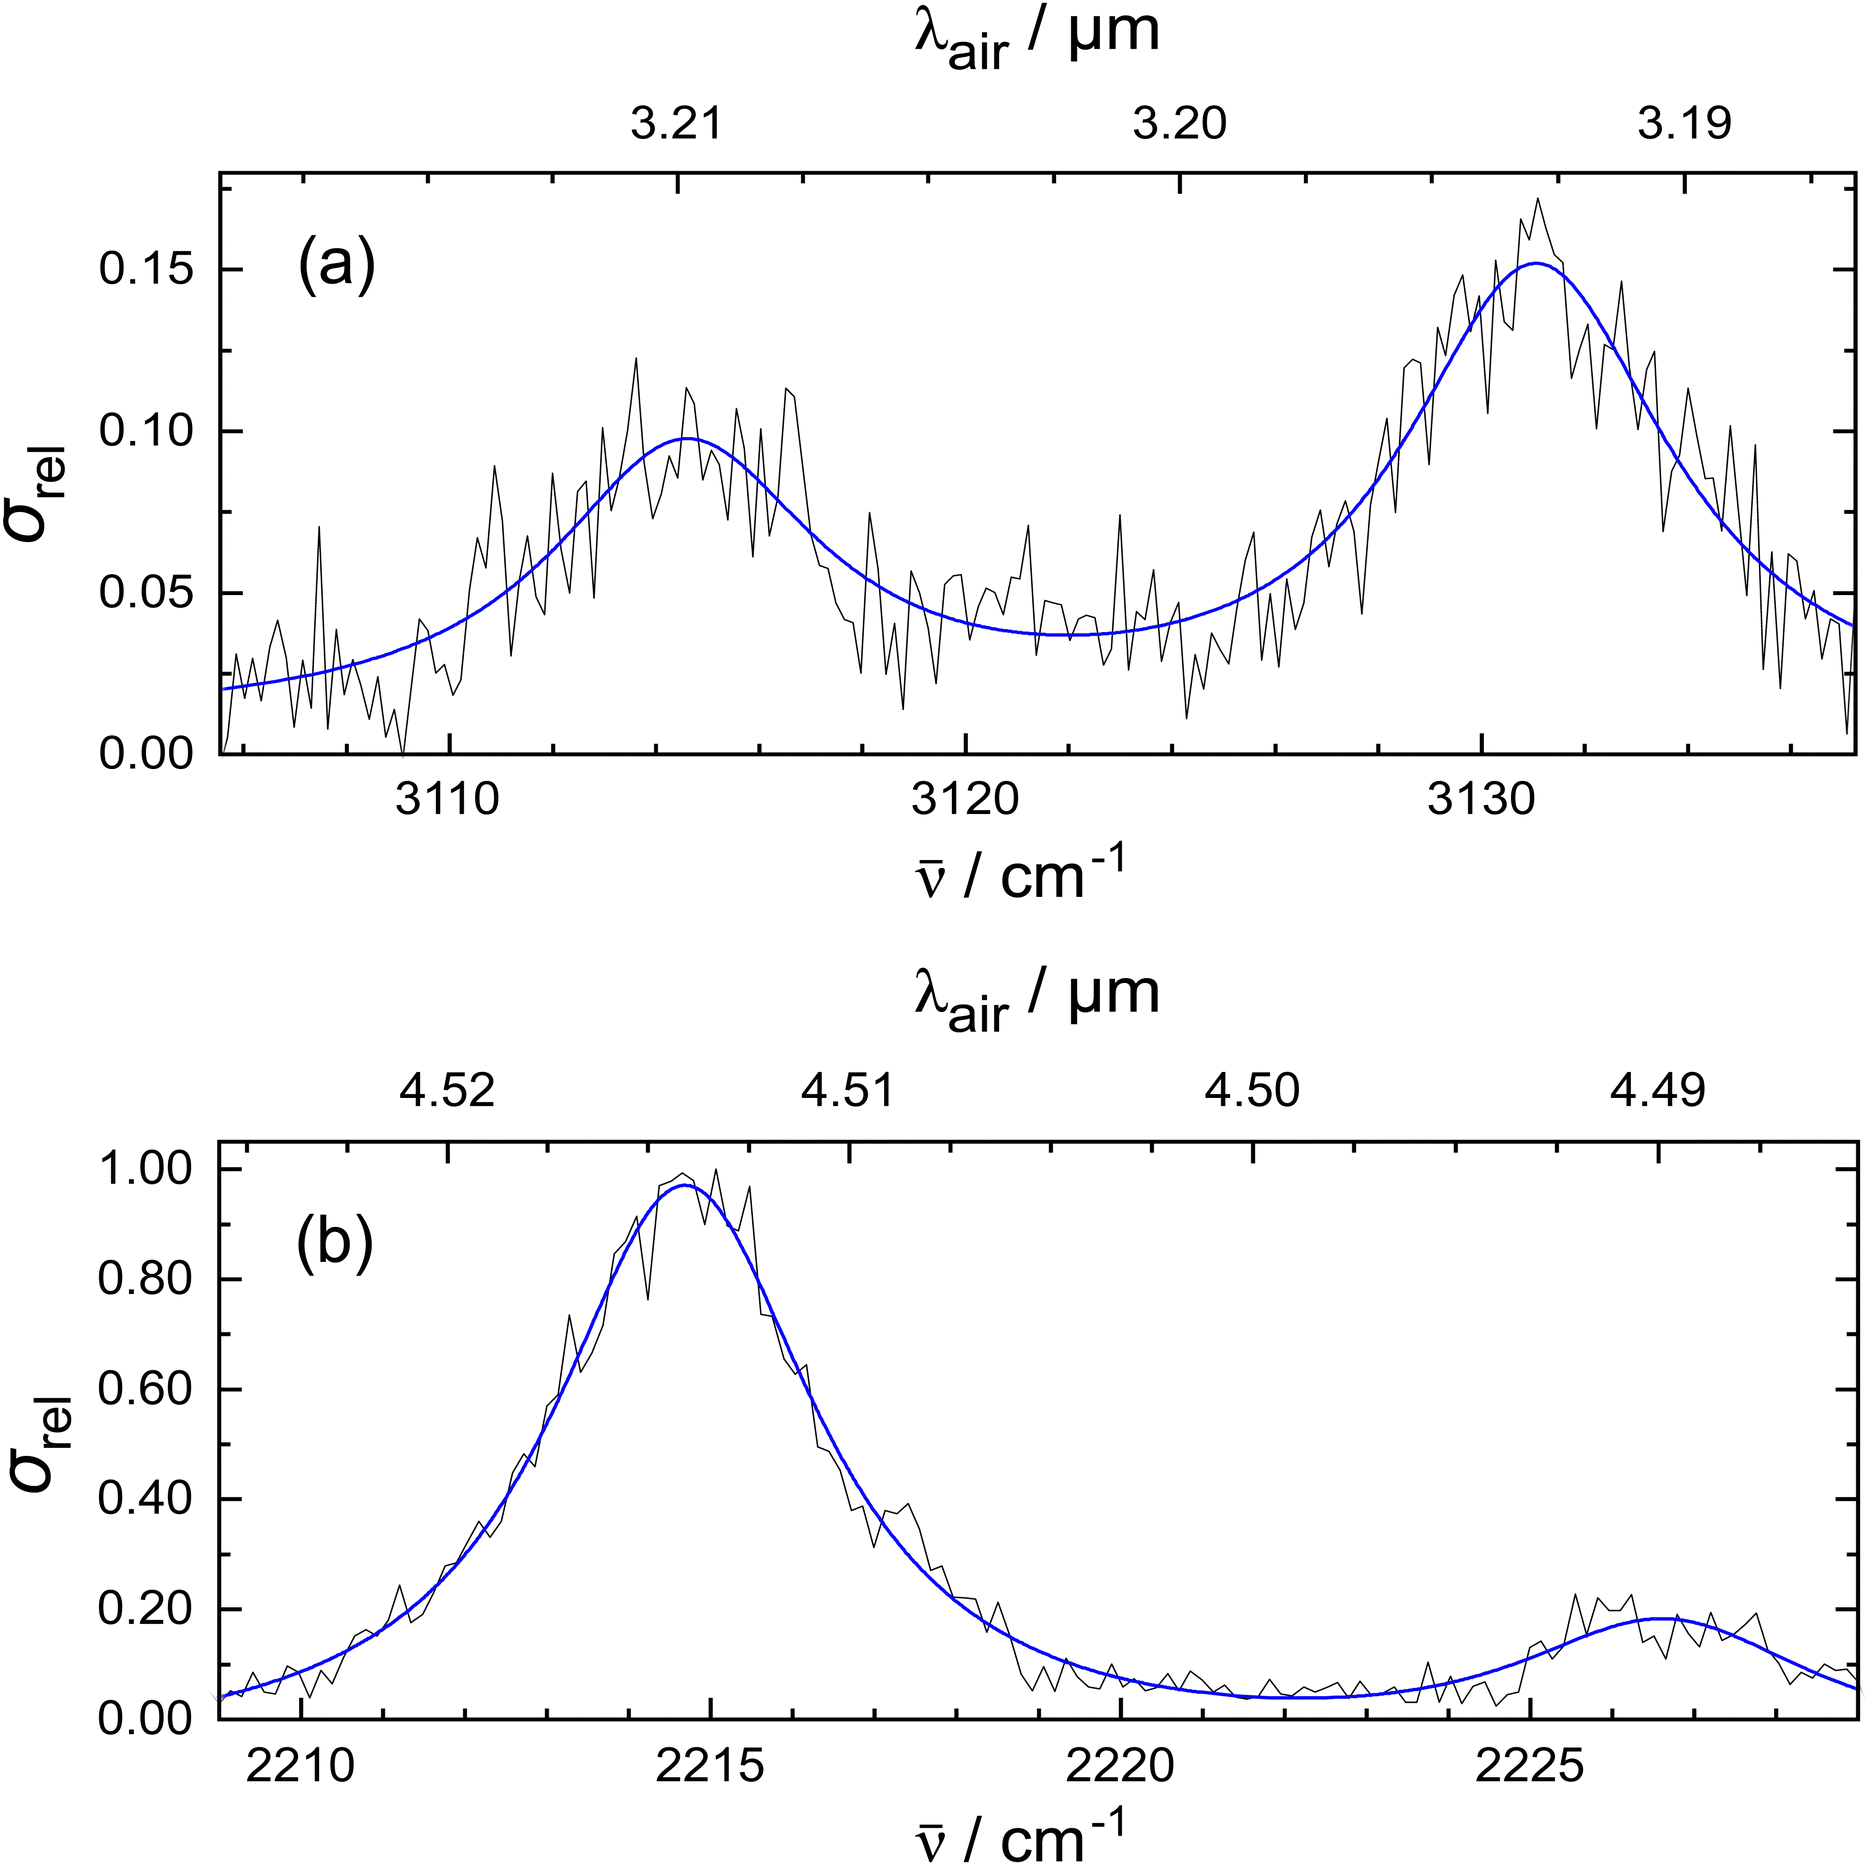 | ||
| Fig. 2 (a) Photofragmentation spectrum of 1-CNN+–He in the CH-stretch region recorded with a bandwidth of 3.7 cm−1. The experimental data are fitted by Lorentzian functions (blue). The CH-stretches are centered at 3114.6 and 3131.1 cm−1 with FWHM of 6.4 and 6.3 cm−1, respectively. (b) Photofragmentation spectrum of 1-CNN+–He in the CN-stretch region recorded with a bandwidth of 1.7 cm−1. Lorentzian functions (blue) are fitted to the experimental data. The CN-stretch peak is centred at 2214.7 cm−1 with a FWHM of 4.0 cm−1. A smaller feature appears at 2226.7 cm−1 with FWHM 4.5 cm−1. | ||
To investigate the effect of He tagging on the vibrational spectrum, measurements were performed with 2 He atoms attached to 1-CNN+. For this experiment, the m/z 161 mass channel was monitored. In Fig. 3, the CN-stretch is plotted using one and two He tags. From 1-CNN+–He to 1-CNN+–He2 a blueshift of 0.4 cm−1 is observed. Helium atom as a tag is known to perturb the spectrum of the bare ion relatively mildly when compared to other tags such as Ar or Ne.43,44 If the shift is linear with the number of He atoms, this would imply that the bare 1-CNN+ absorbs at 2214.3 cm−1.
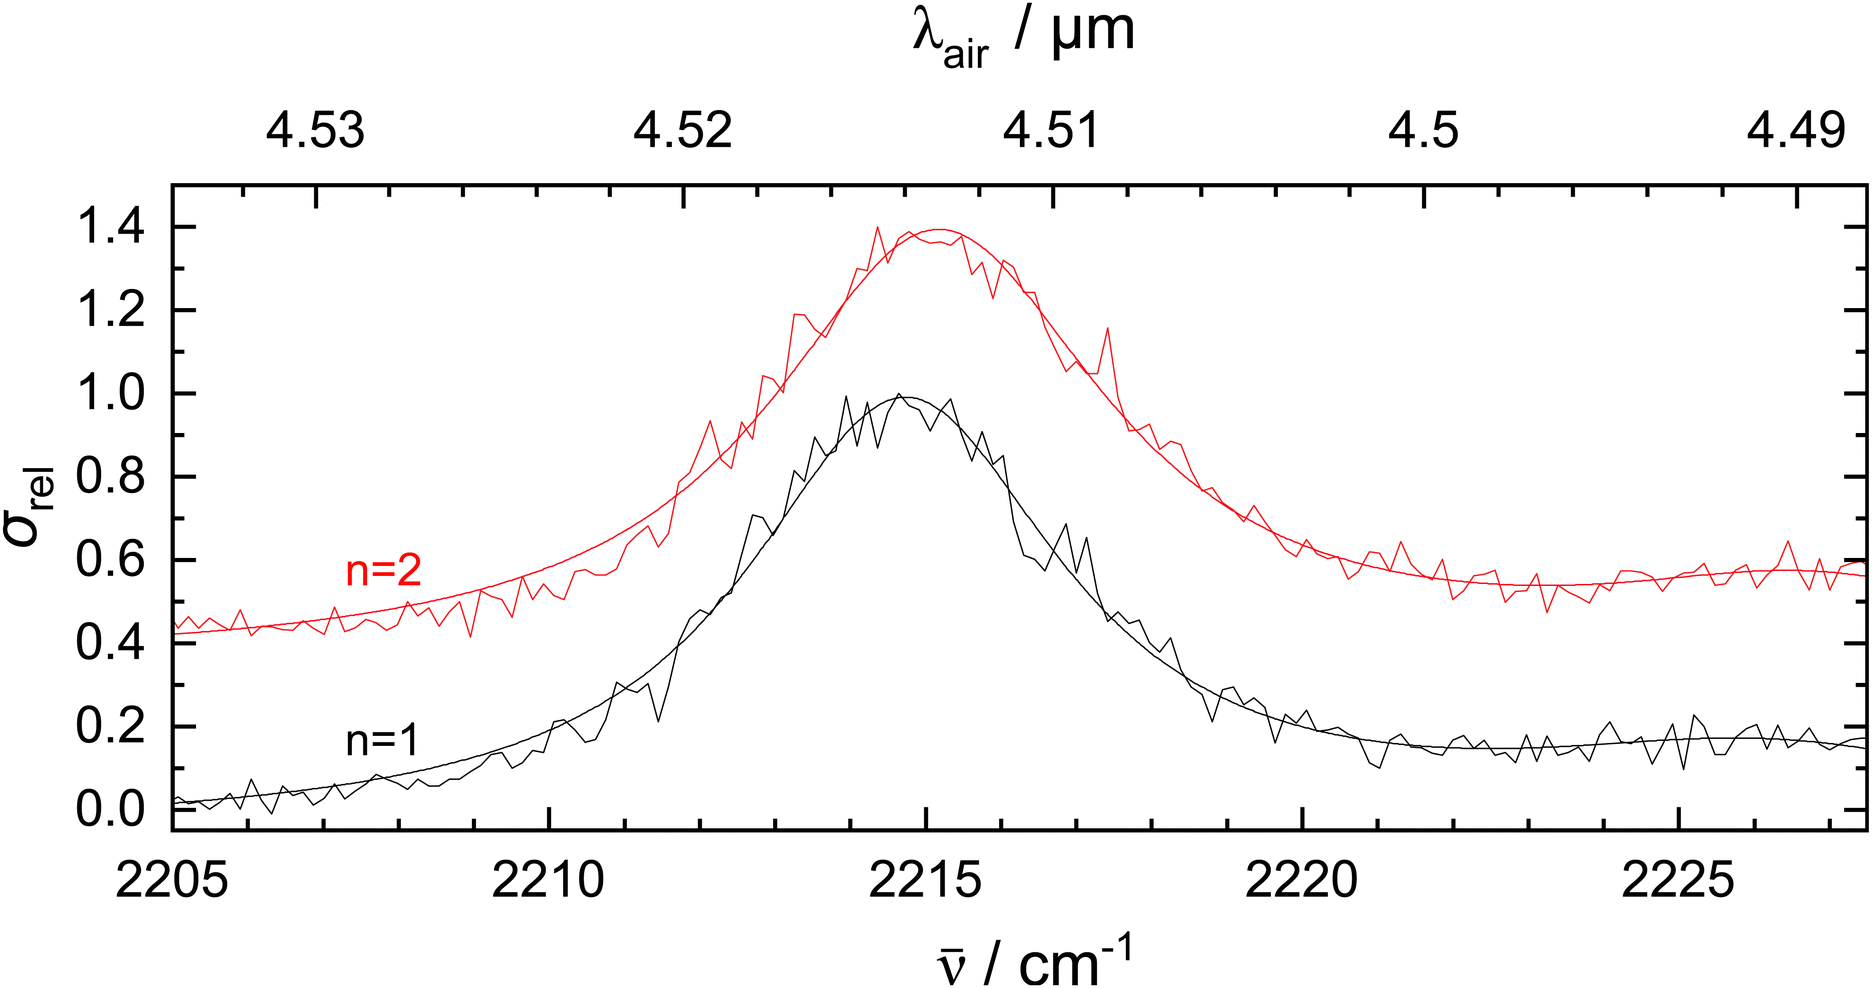 | ||
| Fig. 3 Comparison of the CN-stretch absorption for 1-CNN+–He2 (red) and 1-CNN+–He (black). Both spectra were recorded with a bandwidth of 1.7 cm−1 by using 10−5 μm step size. A 0.4 cm−1 blueshift was observed for the CN-stretch from 1-CNN+–He to 1-CNN+–He2. The experimental data were fitted with Lorentzian functions to determine the peak positions and shift. | ||
The effect of He tagging is further studied theoretically and the vibrational spectra of the bare ion and complex are plotted in Fig. S3, ESI.† The vibrational spectrum of 1-CNN+–He was calculated at the same level of theory as the bare ion, but in order to account for the weak interaction between the He atom and 1-CNN+, empirical dispersion was added manually to the computation. The He atom and 1-CNN+ ion can have many possible configurations, but in this article we only present the lowest energy isomer. The geometry optimized structure of the complex is presented in Fig. S3, ESI.† The He is likely to be placed on top of the aromatic ring containing the N atom. Higher energy configurations include the He placed on top of the other aromatic ring and in the molecular plane. Interestingly, placing the He atom in the vicinity of the N atom does not produce a stable configuration. We notice a slight blue shift (1.6 cm−1) in the CN-stretch band position from 1-CNN+ to 1-CNN+–He as an effect from the He tag. The computed shift is slightly larger but the same order of magnitude as the experimental value of 0.4 cm−1 observed from 1-CNN+–He to 1-CNN+–He2 in Fig. 3. Further quantitative analysis of the shift using theoretical methods is beyond the scope of this study.
4 Astrochemical implications
Cyano-PAH structures such as 1-CNN might be present in carbon-rich stellar envelopes (CSE) and subsequently proto-planetary nebulae (PPNe) since C2H2 and HCN, the potential building blocks of these molecules, are both predicted to be abundant in these environments.45 No molecular cations have been identified in CSE, and the contribution of PAH cations compared with neutrals, large PAHs, and small grains is difficult to assess in PPNe spectra (see, for example, ref. 46 and 47).Based on a recent study by Stockett et al., small cationic cyano-PAHs may also be able to survive in the ISM by stabilisation due to recurrent fluorescence, a radiative relaxation process via ergodically populated electronic excited states.32
The characteristic absorption range for the CN fundamental transition of neutral aromatic nitriles has been reported in literature as 4.46–4.50 μm.48 In contrast, harmonic DFT calculations of cyano-PAHs in neutral and cationic forms with 2–3 aromatic rings have predicted the CN-stretch falls in the 4.74–4.79 μm region, as catalogued in the NASA Ames PAH IR Spectroscopic Database.49–51 In the case of large PAHs containing 35–45 C atoms, with a singly-substituted CN group, the CN-stretch has been proposed to fall in the 4.34–4.39 μm range.52
There is a drastic change in the vibrational spectrum of 1-CNN upon ionisation. The calculated vibrational spectrum of 1-CNN+ is compared to 1-CNN in the ESI.† As highlighted in the Introduction, in the case of 1-CNN, we observe a relatively intense CH-stretch and weak CC-stretching features. Compared to 1-CNN, the already weak CH-stretch is halved in intensity in the case of 1-CNN+. The CN-stretch is a prominent peak in both spectra, however, it is twice as intense in the spectrum of ionised 1-CNN.
The gas-phase laboratory measurements presented here indicate the CN-stretch for 1-CNN+ is at 4.516 μm, outside the predicted wavelength range for CN-stretching frequencies. Observations from the James Webb Space Telescope (JWST) are now facilitating higher-resolution measurements in the 1–5 μm region.52 There is evidence of emission features in the 4.51–4.52 μm region in observation toward young planetary nebulae BD+303639 and NGC7027.52 In previous studies, some strong emission lines in this region were observed from M17 and from Orion Bar.34,53 It should be noted that our measurement concern the absorption of cold 1-CNN+–He, and therefore differences between the band profiles of this complex and emission of UV pumped 1-CNN+ are expected. See, for example, modelling an infrared emission band attributed to PAHs, reported recently in ref. 54.
One complication toward unambiguous CN-stretch assignments are the aromatic and aliphatic CD-stretching modes that have been calculated at 4.30–4.54 μm and 4.54–4.75 μm, respectively.53 Observation of a 4.65 μm band in M17 is attributed to CD-stretch, but interestingly no companion CD-stretch that has been predicted to be at 4.40 μm is seen.34,52 PAHs are predicted to become enriched with deuterium via H-exchange reactions in UV-rich environments due to the lower zero-point energy of C–D bonds compared to C–H bonds.55 However, in CSE and PNe regions, deuterium will be in low abundance since it is readily consumed by stars during nucleosynthesis.34,56 Therefore, emission features in the 4.5 μm region from measurements in CSE and PPNe regions, where deuterium is in low abundance, would likely be dominated by cyano-PAHs rather than deuterated-PAHs.
The CH-stretch peaks for 1-CNN+ have been observed between 3.19–3.22 μm. This is in contrast to the location of the CH-stretch of other PAHs which has been located at 3.29 μm.52 Previous theoretical studies comparing neutral and cationic PAHs have shown changes in both the intensity and peak positions of the CH-stretch.57 In the laboratory spectrum, the CH-stretches of 1-CNN+ appear as very weak features that would be difficult to distinguish in an observational data set and are probably not worth investigating further for detection.
5 Conclusions
Mid-IR spectrum of 1-CNN+ obtained by messenger tagging spectroscopy is presented in this article and complemented with theoretical calculations at the DFT level. Two main vibrational features are present in the 1-CNN+ spectrum: a strong band at 2214.7 cm−1 assigned to the CN-stretch and weaker peaks attributed to CH-stretching modes of 1-CNN+ at 3114.6 cm−1 and 3131.1 cm−1. The effect of He tagging on the CN-stretch position is studied experimentally and computationally. Theory predicts a small 1.6 cm−1 blueshift going from 1-CNN+ to 1-CNN+–He. This is similar in magnitude and direction to the 0.4 cm−1 shift observed experimentally from 1-CNN+–He to 1-CNN+–He2. Thus the 1-CNN+ absorption is expected to be around 2214.3 cm−1.In the astronomical context, the CN-stretch of nitogen containing PAH derivatives could be responsible for IR features in the emission spectra observed by JWST in PAH-rich regions in the 1–5 μm region.52 Previous studies predicted the CN-stretch of small cyano-PAHs in the 4.34–4.39 μm wavelength range.52 In this contribution, we show that for low temperature, gaseous 1-CNN+ the wavelength of the CN-stretch is in fact at 4.516 μm. The peak position coincides with the frequency range predicted for CD-stretches of deuterium containing aromatic molecules. If cyano-PAHs are responsible for emission attributed previously to deuterated PAHs, it would explain the absence of aromatic CD-stretches in observational studies.
Therefore, this may motivate further studies of the mid-IR spectrum of PNe, in particular the region of 4.51–4.52 μm where the CN-stretch frequency has been shown to be the dominant feature of the mid-IR spectrum of 1-CNN+.
Conflicts of interest
There are no conflicts to declare.Acknowledgements
The authors acknowledge financial assistance from the Royal Society (grant numbers RGF/EA/181035, RF/ERE/210238, URF/R1/180162) and Engineering and Physical Sciences Research Council (grant number EP/W03753X/1). The article is based upon work from COST Action CA21126 – Carbon molecular nanostructures in space (NanoSpace), supported by COST (European Cooperation in Science and Technology). This work has made use of the resources provided by the Edinburgh Compute and Data Facility (ECDF) (https://www.ecdf.ed.ac.uk/).References
- F. C. Gillet, W. J. Forrest and K. M. Merrill, Astrophys. J., 1973, 187, 87 CrossRef.
- R. W. Russell, B. T. Soifer and K. M. Merrill, Astrophys. J., 1977, 213, 66 CrossRef CAS.
- W. W. Duley and D. A. Williams, Mon. Not. R. Astron. Soc., 1981, 196, 269 CrossRef CAS.
- A. Léger and J. L. Puget, Astron. Astrophys., 1984, 137, L5–L8 Search PubMed.
- L. J. Allamandola, A. G. G. M. Tielens and J. R. Barker, Astrophys. J., 1985, 290, L25 CrossRef CAS.
- A. G. G. M. Tielens, Annu. Rev. Astron. Astrophys., 2008, 46, 289–337 CrossRef CAS.
- S. Kwok and Y. Zhang, Nature, 2011, 479, 80 CrossRef PubMed.
- J. R. H. Buss, M. Cohen, A. G. G. M. Tielens, M. W. Werner, J. D. Bregman, F. C. Witteborn, D. Rank and S. A. Sandford, Astrophys. J., 1990, 365, L23 CrossRef.
- A. Webster, Nature, 1991, 352, 412 CrossRef CAS.
- S. Schlemmer, D. J. Cook, J. A. Harrison, B. Wurfel, W. Chapman and R. J. Saykally, Science, 1994, 265, 1686–1689 CrossRef CAS PubMed.
- D. J. Cook, S. Schlemmer, N. Balucani, D. R. Wagner, B. Steiner and R. J. Saykally, Nature, 1996, 380, 227–229 CrossRef CAS PubMed.
- J. Cami, J. Bernard-Salas, E. Peeters and S. E. Malek, Science, 2010, 329, 1180–1182 CrossRef CAS PubMed.
- K. Sellgren, M. W. Werner, J. G. Ingalls, J. D. T. Smith, T. M. Carleton and C. Joblin, Astrophys. J., 2010, 722, L54 CAS.
- D. Gerlich, J. Jašík, S. V. Strelnikov and J. Roithová, Astrophys. J., 2018, 864, 62 CrossRef.
- J. Palotás, J. Martens, G. Berden and J. Oomens, Nat. Astron., 2020, 4, 240 CrossRef.
- J. Palotás, J. Martens, G. Berden and J. Oomens, J. Phys. Chem. A, 2022, 126, 2928 CrossRef PubMed.
- G.-L. Hou, O. V. Lushchikova, J. M. Bakker, P. Lievens, L. Decin and E. Janssens, Astrophys. J., 2023, 952, 13 CrossRef.
- J. Cernicharo, A. M. Heras, A. G. G. M. Tielens, J. R. Pardo, F. Herpin, M. Guélin and L. B. F. M. Waters, Astrophys. J., 2001, 546, L123 CrossRef CAS.
- S. E. Malek, J. Cami and J. Bernard-Salas, Astrophys. J., 2012, 744, 16 CrossRef.
- K. E. Kraemer, G. C. Sloan, J. Bernard-Salas, S. D. Price, M. P. Egan and P. R. Wood, Astrophys. J., 2006, 652, L25 CrossRef CAS.
- D. A. García-Hernández, P. García-Lario, J. Cernicharo, D. Engels and J. V. Perea-Calderón, J. Phys.: Conf. Ser., 2016, 728, 052003 CrossRef.
- B. A. McGuire, Astrophys. J., Suppl. Ser., 2018, 239, 17 CrossRef CAS.
- K. Wohlfart, M. Schnell, J.-U. Grabow and J. Küpper, J. Mol. Spectrosc., 2008, 247, 119 CrossRef CAS.
- E. Fliege, G. Bestmann, R. Schwarz and H. Dreizler, Z. Naturforsch., A: Phys., Phys. Chem., Kosmophys., 1981, 36, 1134 Search PubMed.
- K. Vormann, U. Andresen, N. Heineking and H. Dreizler, Z. Naturforsch., A: Phys. Sci., 1988, 43, 283 CrossRef CAS.
- G. Wlodarczak, J. Burie, J. Demaison, K. Vormann and A. G. Császár, J. Mol. Spectrosc., 1989, 134, 297 CrossRef CAS.
- B. A. McGuire, R. A. Loomis, A. M. Burkhardt, K. L. K. Lee, C. N. Shingledecker, S. B. Charnley, I. R. Cooke, M. A. Cordiner, E. Herbst, S. Kalenskii, M. A. Siebert, E. R. Willis, C. Xue, A. J. Remijan and M. C. McCarthy, Science, 2021, 371, 1265–1269 CrossRef CAS PubMed.
- D. McNaughton, M. K. Jahn, M. J. Travers, D. Wachsmuth, P. D. Godfrey and J.-U. Grabow, Mon. Not. R. Astron. Soc., 2018, 476, 5268–5273 CrossRef CAS.
- M. C. McCarthy and B. A. McGuire, J. Phys. Chem. A, 2021, 125, 3231–3243 CrossRef CAS PubMed.
- J. H. S. Green and D. J. Harrison, Spectrochim. Acta, Part A, 1976, 32, 1279 CrossRef.
- A. G. Császár and G. Fogarasi, Spectrochim. Acta, Part A, 1989, 45, 845 CrossRef.
- M. H. Stockett, J. N. Bull, H. Cederquist, S. Indrajith, M. Ji, J. E. Navarro Navarrete, H. T. Schmidt, H. Zettergren and B. Zhu, Nat. Commun., 2023, 14, 395 CrossRef CAS PubMed.
- F. C. Daly, J. Palotás, U. Jacovella and E. K. Campbell, Astron. Astrophys., 2023, 677, A128 CrossRef CAS.
- E. Peeters, L. J. Allamandola, J. C. W. Bauschlicher, D. M. Hudgins, S. A. Sandford and A. G. G. M. Tielens, Astrophys. J., 2004, 604, 252 CrossRef CAS.
- K. Chatterjee and O. Dopfer, J. Chem. Phys., 2018, 149, 174315 CrossRef PubMed.
- D. B. Rap, A. Simon, K. Steenbakkers, J. G. Schrauwen, B. Redlich and S. Brünken, Faraday Discuss., 2023, 245, 221–244 RSC.
- S. R. Langhoff, J. Phys. Chem., 1996, 100, 2819 CrossRef CAS.
- E. Campbell, M. Holz, J. Maier, D. Gerlich, G. Walker and D. Bohlender, Astrophys. J., 2016, 822, 17 CrossRef.
- S. Grimme, A. Hansen, J. G. Brandenburg and C. Bannwarth, Chem. Rev., 2016, 116, 4911–5688 CrossRef PubMed.
- M. P. Andersson and P. Uvdal, J. Phys. Chem. A, 2005, 12, 2937–2941 CrossRef PubMed.
- M. J. Frisch, G. W. Trucks, H. B. Schlegel, G. E. Scuseria, M. A. Robb, J. R. Cheeseman, G. Scalmani, V. Barone, G. A. Petersson, H. Nakatsuji, X. Li, M. Caricato, A. V. Marenich, J. Bloino, B. G. Janesko, R. Gomperts, B. Mennucci, H. P. Hratchian, J. V. Ortiz, A. F. Izmaylov, J. L. Sonnenberg, D. Williams-Young, F. Ding, F. Lipparini, F. Egidi, J. Goings, B. Peng, A. Petrone, T. Henderson, D. Ranasinghe, V. G. Zakrzewski, J. Gao, N. Rega, G. Zheng, W. Liang, M. Hada, M. Ehara, K. Toyota, R. Fukuda, J. Hasegawa, M. Ishida, T. Nakajima, Y. Honda, O. Kitao, H. Nakai, T. Vreven, K. Throssell, J. A. Montgomery, Jr., J. E. Peralta, F. Ogliaro, M. J. Bearpark, J. J. Heyd, E. N. Brothers, K. N. Kudin, V. N. Staroverov, T. A. Keith, R. Kobayashi, J. Normand, K. Raghavachari, A. P. Rendell, J. C. Burant, S. S. Iyengar, J. Tomasi, M. Cossi, J. M. Millam, M. Klene, C. Adamo, R. Cammi, J. W. Ochterski, R. L. Martin, K. Morokuma, O. Farkas, J. B. Foresman and D. J. Fox, Gaussian 16, Revision A.03, 2016 Search PubMed.
- H. Piest, G. von Helden and G. Meijer, J. Chem. Phys., 1999, 110, 2010–2015 CrossRef CAS.
- J. Roithová, A. Gray, E. Andris, J. Jasik and D. Gerlich, Acc. Chem. Res., 2016, 49, 223–230 CrossRef PubMed.
- E. K. Campbell, M. Holz and J. P. Maier, Astrophys. J., Lett., 2016, 826, L4 CrossRef.
- D. M. Hudgins, C. W. Bauschlicher, Jr. and S. A. Sandford, Astrophys. J., 2008, 673, 445 CrossRef.
- S. Foschino, O. Berné and C. Joblin, Astron. Astrophys., 2019, 632, A84 CrossRef CAS PubMed.
- C. Joblin, R. Szczerba, O. Berné and C. Szyszka, Astron. Astrophys., 2008, 490, 189–196 CrossRef CAS.
- R. M. Silverstein and F. X. Webster, Spectrometric Identification of Organic Compounds, John Wiley, New York, 6th edn, 1963 Search PubMed.
- C. W. Bauschlicher, Jr., Chem. Phys., 1998, 234, 87–94 CrossRef.
- C. W. Bauschlicher, A. Ricca, C. Boersma and L. J. Allamandola, Astrophys. J., Suppl. Ser., 2018, 234, 32 CrossRef.
- A. L. Mattioda, D. M. Hudgins, C. Boersma, C. W. Bauschlicher, A. Ricca, J. Cami, E. Peeters, F. S. de Armas, G. P. Saborido and L. J. Allamandola, Astrophys. J., Suppl. Ser., 2020, 251, 22 CrossRef CAS.
- C. Boersma, L. J. Allamandola, V. J. Esposito, A. Maragkoudakis, J. D. Bregman, P. Temi, T. J. Lee, R. C. Fortenberry and E. Peeters, Astrophys. J., 2023, 959, 74 CrossRef.
- D. M. Hudgins, C. W. Bauschlicher, Jr. and S. A. Sandford, Astrophys. J., 2004, 614, 770–780 CrossRef CAS.
- C. J. Mackie, A. Candian, T. J. Lee and A. G. Tielens, Theor. Chem. Acc., 2021, 140, 124 Search PubMed.
- S. D. Wiersma, A. Candian, J. M. Bakker, J. Martens, G. Berden, J. Oomens, W. J. Buma and A. Petrignani, Astron. Astrophys., 2020, 635, A9 CrossRef CAS.
- D. H. Weinberg, Astrophys. J., 2017, 851, 25 CrossRef.
- A. Pathak and S. Rastogi, Spectrochim. Acta, Part A, 2007, 67, 898–909 CrossRef PubMed.
Footnote |
| † Electronic supplementary information (ESI) available. See DOI: https://doi.org/10.1039/d3cp05784d |
| This journal is © the Owner Societies 2024 |