 Open Access Article
Creative Commons Attribution 3.0 Unported Licence
Comment on “Universal features in the lifetime distribution of clusters in hydrogen-bonding liquids” by I. Jukić, M. Požar, B. Lovrinčević and A. Perera, Phys. Chem. Chem. Phys., 2021, 23, 19537
Joanna
Grelska

A. Chełkowski Institute of Physics, University of Silesia in Katowice, 75 Pułku Piechoty 1, 41-500 Chorzów, Poland. E-mail: joanna.grelska@us.edu.pl
First published on 30th January 2024
Abstract
In the article published by Jukić et al. [I. Jukić et al., Phys. Chem. Chem. Phys., 2021, 23, 19537], the authors discovered a specific lifetime distribution of hydrogen bonds in some pure hydrogen-bonding liquids. The distribution derived by computer simulations in the range of 0–0.15 ps consists of three characteristic peaks. They call the first maximum the ‘dimer peak’, the second the ‘cluster peak’, and the third the ‘topology peak’. In the article in question, mostly linear- and circular-cluster-forming mono-ols were simulated to show that the third peak is universal in these H-bonding substances. Moreover, the topology of the clusters, which was wrongly assumed to be detected in the tertiary lifetime peak, is instead seen in the distribution of the first maximum.
The hydrogen bonding mechanism is found in many essential substances that compose living organisms. Hence, it is of primary importance to characterize all the features of the hydrogen-bonding process in detail. In ref. 1, the authors presented a previously unknown feature of the lifetime distribution of hydrogen bonds in the picosecond range calculated via computer simulations. The specific distribution was assigned to molecular H-bonded dimers located both within and outside the clusters. The authors examined various hydrogen-bonded systems, namely, monohydroxy alcohols and water, and obtained universal hydrogen-bond lifetime maxima, which are summarized in Fig. 1.
 | ||
| Fig. 1 Reproduced from ref. 1 with permission from the PCCP Owner Societies. Illustration summarizing the correspondence between H-bond lifetime characteristic peaks. | ||
The presented distribution plot (Fig. 1) was obtained with a fixed angle restriction (O–H–O <30°) and changing hydrogen-bonding distances. The authors in ref. 1 described the first maximum seen at the H-bond distance cutoff of 2.5 Å as the ‘dimer peak’. The ‘dimer peak’ at short distances reflects short-lived, tightly hydrogen-bonded dimers with a high probability of occurrence, and at larger cutoff distances (3.5 Å), it shows dimers that live longer but are less probable.
However, at a cutoff of around 2.9 Å, the authors of ref. 1 note the appearance of two additional peaks, which have stable positions up to the cutoff distance of 3.5 Å. They called the second peak at 0.02 ps the ‘cluster peak’ originating from dimers involved in clusters (larger hydrogen-bonded structures), and the third peak at 0.05 ps the ‘topology peak’ originating from the topology of these clusters.
The conclusions of the discussed article are also employed in another article by the same authors2 concerning water–alcohol mixtures. There, the authors also indicate that the tertiary peak corresponds to the topology of clusters, whether these are chain, loop or lasso clusters found in mono-ols.
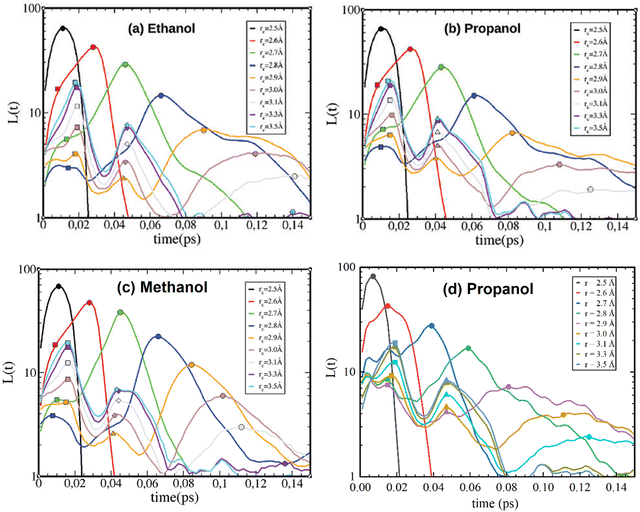
The present work aims to verify the origin of the tertiary peak through investigation of mono-ols that form either mainly linear (chain-like) or circular (loop) clusters. First, in order to verify the accuracy of the methodology, the lifetime distribution of 1-propanol was calculated and compared with the authors’ result in ref. 1. Similarly, computer simulations were carried out in the GROMACS package3–5 with a time step 0.002 ps of a production run of 300 ps. The systems were simulated in NVT ensembles with a known density at room conditions, and a production run of 2 ns was used. Topology files were created using the Antechamber module (AmberTool21),6 and the GAFF force field was applied.7 The program gmxhbond with the -life option (within the GROMACS package) was used for the calculation of H-bond lifetime distributions. The obtained results (Fig. 2d) were satisfyingly consistent with the results for propanol (Fig. 2b) from ref. 1.
 | ||
| Fig. 2 Reproduced from ref. 1 with permission from the PCCP Owner Societies. H-bond lifetime distribution for OPLS ethanol (a), propanol (b), and methanol (c), with reference to H-bonding distances. Lifetime distribution of GAFF propanol calculated in this paper (d). | ||
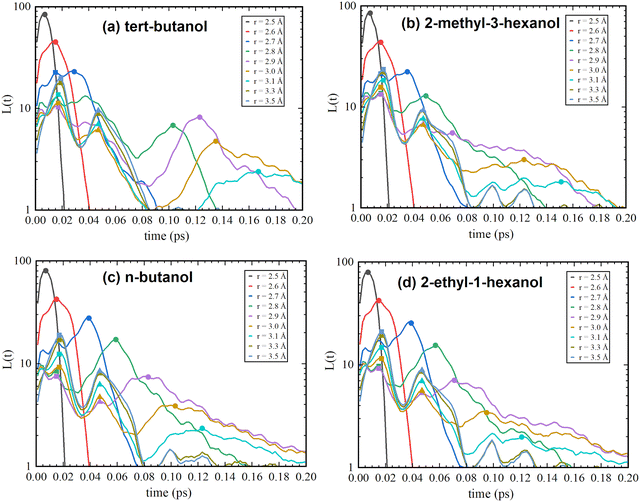
Therefore, the described methodology was used for the investigation of linear- and globular-cluster-forming mono-ols. Namely, n-butanol, which was previously reported to have mainly linear clusters, and its isomer, tert-butanol, with predominantly circular-like clusters,8 are presented in Fig. 3c and a. Additionally, 2-ethyl-1-hexanol, which forms mostly linear clusters, and 2-methyl-3-hexanol,9 which forms mostly globular clusters, were calculated (Fig. 3d and b). At first glance, one can notice that the positions and shapes of the secondary and tertiary peaks are the same as those reported for mono-ols in ref. 1 and do not change within different cluster-forming substances. However, presenting data over a wider range, up to 0.2 ps, helps one to notice another relationship. One can see that small peaks (oscillations) appear in the range 0.08–0.2 ps, but they were not further discussed, as the authors of ref. 1 assigned them to the impact of alkyl tails surrounding the OH groups, which do not significantly vary among the various probed mono-ols.
 | ||
| Fig. 3 H-bond lifetime distributions determined in the present work of tert-butanol (a), 2-methyl-3-hexanol (b), n-butanol (c), and 2-ethyl-1-hexanol (d). | ||
What is worth noting is that the first peak with increasing distance cutoff (around 3 Å) moves toward the shorter time distribution for n-butanol and 2-ethyl-1-hexanol compared to tert-butanol and 2-methyl-3-hexanol. tert-Butanol and 2-methyl-3-hexanol, which have predominantly circular clusters in the systems, exhibit longer time distributions for the first lifetime maximum. This leads to a simple conclusion: dimers in circular clusters live longer than in linear ones, and this feature is seen in the first ‘dimer peak’.
Moreover, this relation can also be noticed in ref. 1. Although it was reported that molecular aggregates in liquid methanol, ethanol, and propanol can take different shapes, from cyclic to branched structures,10 in the Supporting Information of ref. 1, one can see the cluster size distribution and the indication that ethanol is more likely than methanol to create cyclic clusters that consist of around five molecules. That observation results in the mentioned position of the first peak – at a cutoff distance 3 Å, it moves toward longer lifetimes for ethanol in comparison to methanol (see Fig. 2a and c).
To sum up, it was simply shown that the tertiary peak, called the ‘topology peak’ in the H-bond lifetime distribution in ref. 1, does not depend on the type of clusters formed in the mono-ols. On the contrary, it is universal in mono-ols, but the other feature related to the first maximum, the ‘dimer peak’ in ref. 1, was noted to depend on the cluster shape – dimers in the circular-cluster-forming substances tend to live longer than in linear ones. Therefore, there is doubt as to whether the description of the lifetime distribution peaks used in ref. 1 is correct.
Conflicts of interest
There are no conflicts to declare.Acknowledgements
The author acknowledges the support from the National Science Center, Poland (grant no. UMO-2019/35/B/ST3/02670) and computational time at PL-Grid, Poland (grant no. PLG/2022/015982).References
- I. Jukić, M. Požar, B. Lovrinčević and A. Perera, Universal Features in the Lifetime Distribution of Clusters in Hydrogen-Bonding Liquids, Phys. Chem. Chem. Phys., 2021, 23, 19537 RSC.
- I. Jukić, M. Požar, B. Lovrinčević and A. Perera, Lifetime Distribution of Clusters in Binary Mixtures Involving Hydrogen Bonding Liquids, Sci. Rep., 2022, 12, 9120 CrossRef PubMed.
- M. J. Abraham, T. Murtola, R. Schulz, S. Páll, J. C. Smith, B. Hess and E. Lindahl, GROMACS: High Performance Molecular Simulations through Multi-Level Parallelism from Laptops to Supercomputers, SoftwareX, 2015, 1–2, 19 CrossRef.
- S. Páll, M. J. Abraham, C. Kutzner, B. Hess and E. Lindahl, Tackling Exascale Software Challenges in Molecular Dynamics Simulations with GROMACS, in Solving Software Challenges for Exascale, ed. S. Markidis and E. Laure, Springer International Publishing, Cham, 2015, vol. 8759, pp. 3–27 Search PubMed.
- S. Pronk, et al., GROMACS 4.5: A High-Throughput and Highly Parallel Open Source Molecular Simulation Toolkit, Bioinformatics, 2013, 29, 845 CrossRef CAS PubMed.
- D. A. Case, H. M. Aktulga, K. Belfon, I. Y. Ben-Shalom, S. R. Brozell, D. S. Cerutti, T. E. Cheatham III, G. A. Cisneros, V. W. D. Cruzeiro, T. A. Darden, R. E. Duke, G. Giambasu, M. K. Gilson, H. Gohlke, A. W. Goetz, R. Harris, S. Izadi, S. A. Izmailov, C. Jin, K. Kasavajhala, M. C. Kaymak, E. King, A. Kovalenko, T. Kurtzman, T. S. Lee, S. LeGrand, P. Li, C. Lin, J. Liu, T. Luchko, R. Luo, M. Machado, V. Man, M. Manathunga, K. M. Merz, Y. Miao, O. Mikhailovskii, G. Monard, H. Nguyen, K. A. O’Hearn, A. Onufriev, F. Pan, S. Pantano, R. Qi, A. Rahnamoun, D. R. Roe, A. Roitberg, C. Sagui, S. Schott-Verdugo, J. Shen, C. L. Simmerling, N. R. Skrynnikov, J. Smith, J. Swails, R. C. Walker, J. Wang, H. Wei, R. M. Wolf, X. Wu, Y. Xue, D. M. York, S. Zhao and P. A. Kollman, Amber 2021, AmberTools21, University of California, San Francisco, 2021 Search PubMed.
- J. Wang, R. M. Wolf, J. W. Caldwell, P. A. Kollman and D. A. Case, Development and Testing of a General Amber Force Field, J. Comput. Chem., 2004, 25, 1157 CrossRef CAS PubMed.
- J. Grelska, K. Jurkiewicz, A. Burian and S. Pawlus, Supramolecular Structure of Phenyl Derivatives of Butanol Isomers, J. Phys. Chem. B, 2022, 126, 3563 CrossRef CAS PubMed.
- M. Wikarek, S. Pawlus, S. N. Tripathy, A. Szulc and M. Paluch, How Different Molecular Architectures Influence the Dynamics of H-Bonded Structures in Glass-Forming Monohydroxy Alcohols, J. Phys. Chem. B, 2016, 120, 5744 CrossRef CAS PubMed.
- A. Vrhovšek, O. Gereben, A. Jamnik and L. Pusztai, Hydrogen Bonding and Molecular Aggregates in Liquid Methanol, Ethanol, and 1-Propanol, J. Phys. Chem. B, 2011, 115, 13473 CrossRef PubMed.
| This journal is © the Owner Societies 2024 |
