
 Open Access Article
 This Open Access Article is licensed under a
 Creative Commons Attribution 3.0 Unported Licence
Interplay between transition-metal K-edge XMCD, slight structural distortions and magnetism in a series of trimetallic (CoxNi(1−x))4[Fe(CN)6]3/8 Prussian blue analogues†
Adama
N’Diaye
a,
Amélie
Bordage
 a,
Lucie
Nataf
b,
François
Baudelet
b,
Eric
Rivière
a and
Anne
Bleuzen
*a
a,
Lucie
Nataf
b,
François
Baudelet
b,
Eric
Rivière
a and
Anne
Bleuzen
*a
aInstitut de Chimie Moléculaire et des Matériaux d'Orsay, Université Paris-Saclay, CNRS, 91405 Orsay, France. E-mail: anne.bleuzen@universite-paris-saclay.fr
bSynchrotron SOLEIL, L’Orme des Merisiers, St Aubin, BP 48, 91192 Gif sur Yvette, France
First published on 3rd May 2024
Abstract
The magnetic properties of a series of trimetallic (Co,Ni)Fe Prussian blue analogues (PBAs) were investigated by SQUID magnetometry and X-ray magnetic circular dichroism (XMCD) at the three transition metal (TM) K-edges. In turn, the PBA trimetallic series was used as a tool in order to better understand the information contained in TM K-edge XMCD and particularly the chemical nature of the probed species (extended sub-lattice or localized entities). The results show that the magnetic behavior of the compounds is dictated by competing exchange interactions between the Co–Fe and Ni–Fe pairs, without spin frustration. They also show that XMCD at the TM K-edge is a local atomic probe of the element at the N side of the cyanide bridge and a local probe of the absorbing atom and its first magnetic neighbors on the C side of the bridge. At last, XMCD at the TM K-edge turns out to be highly sensitive to very small structural distortions.
Introduction
X-ray magnetic circular dichroism (XMCD) at the transition metal (TM) K-edge is less frequently used than XMCD at the TM L2,3 edges as a local magnetic probe. Indeed, in contrast to XMCD at the L2,3 edges of TMs, for which quantitative information can be extracted from the sum rules1–3 and the spectra can be well-reproduced by crystal field multiplet calculations,4 the interpretation of the XMCD signals at the TM K-edge remains unsatisfactory despite many efforts towards the quantitative interpretation and the reproduction of the signals.5–15 Yet, XMCD at the TM K-edge is the preferred technique to probe magnetism under pressure for instance.16–21 The literature on XMCD at the TM K-edge mostly deals with the study of metals,22 metal alloys23 and intermetallics,24,25 while works dealing with the study of molecular compounds are scarcer.Most studies of molecular compounds by XMCD at the TM K-edge deal with the investigation of Prussian blue analogues (PBAs). Noticeably, in the search for room-temperature molecular-based magnets, Verdaguer and his team used this technique in the 90's as a probe of the exchange interactions in PBAs: they related the sign of the TM K-edge XMCD signal to the orientation of the magnetic moment carried by the absorbing atom with respect to the applied magnetic field.26–33 Since then, only qualitative information has been extracted from these signals.
Therefore, we are engaged in the project aiming at disentangling the physical effects at the origin of the TM K-edge XMCD signals. We have been developing an original experimental approach aiming at making TM K-edge XMCD a real quantitative tool for molecular chemists.34–38 Our strategy, presented in previous works,35–38 uses the versatile chemistry of PBAs exhibiting the well-known face-centered cubic (fcc) structure, the unit cell of which is shown in Fig. 1 (for p = 4 and q = 8/3) and the chemical composition per unit cell is given by Ap[B(CN)6]q·nH2O, where A and B are two TM ions. The large variety of TM ions that can thus be combined in isostructural compounds allow for the independent variation of the magnetic orbitals on both A and B sites. This enables the analysis of the effect of a change of each of them on both TM K-edge XMCD signals. Thus, the analysis of the TM K-edge XMCD signals of two series of PBAs of chemical formula AII4[FeIII(CN)6]3/8·nH2O (A2+ = Mn2+, Co2+, Ni2+, Cu2+) and AII4[CrIII(CN)6]3/8·nH2O (A2+ = Mn2+, Fe2+, Co2+, Ni2+) showed that TM K-edge XMCD was very sensitive to orbital symmetry and allowed us to relate the main 1s → 4p contribution of the XMCD signal to the electronic structure and the magnetic behavior of (i) the probed ion on the N side of the cyanide bridge and (ii) the probed ion and its magnetic neighbors on the C side. Furthermore, an expression for the intensity of this main 1s → 4p contribution was unprecedently derived for the sixteen XMCD signals (at both TM K-edges of the eight PBAs) of the two series.36,38 This study also showed that XMCD at the TM K-edge can provide both original local structural and magnetic information, which, combined with macroscopic magnetic measurements, allowed for an unprecedented in-depth analysis of the magnetic behaviors of the two bimetallic series of PBAs.
 | ||
| Fig. 1 Scheme of the unit cell of a Prussian blue analogue with the chemical formula A4[B(CN)6]2.7·xH2O. Yellow circles stand for the B3+ ion, light grey circles the A2+ ions, dark grey the carbon atoms, blue the nitrogen atoms, and red the oxygen atoms. The hydrogen atoms of the water molecules bonded to the A2+ ions as well as the zeolitic water molecules are omitted for clarity. | ||
In this work, we now focus on a series of trimetallic PBAs. Twenty-five years ago, trimetallic PBAs generated interest because of their intriguing magnetic behaviors and particularly magnetic pole inversions due to competitive exchange interactions between the TM ions39–47 and also, later on, some photo-switching properties;48–50 their magnetic properties were essentially investigated by SQUID magnetometry at the macroscopic level. In our on-going commitment to promote TM K-edge XMCD as a regular local probe of TM magnetic moment in molecular compounds, these systems offer the opportunity to go ahead. On the one hand, such study of trimetallic PBAs is an opportunity to test the relevancy of TM K-edge XMCD for the study of the magnetic properties of more complex systems than bimetallic PBAs. On the other hand, with the aim to better understand the information contained in the XMCD signals, one can analyze the effect on the XMCD signal at the three TM K-edges of the replacement of one ion by another in varying amounts in the same sublattice of one PBA; this should provide information on the nature of the species probed (extended on a sublattice level or localized at the atomic scale). Among trimetallic PBAs, the series of chemical formula (CoxNi(1−x))4[Fe(CN)6]8/3·nH2O (where x is the mole fraction of Co ions on the A site of the alkali cation free NiFe PBA), called the CoxNi(1−x)Fe series in the following, has been chosen. The preparation of the samples and their characterization are given in the experimental part and the ESI† (S1–S3). For this study, K-edge XMCD has a great advantage compared with L-edge XMCD, which is yet a direct local probe of the 3d levels: the former is bulk sensitive like SQUID magnetometry and therefore little sensitive to surface effects. Surface effects, which are yet poorly understood in PBAs, can be detected by surface sensitive techniques such as L-edge XMCD. Thus, the parent Rb-containing photo-switchable RbCoFe PBA of chemical formula Rb2Co4[Fe(CN)6]3.3·11H2O was already studied by L-edge XMCD.51 This study revealed weak ferromagnetic interaction at the surface of the ferrimagnetic photoexcited state of RbCoFe.51 The addition to the XMCD signal of yet poorly understood surface effects could blur the information being sought here, making K-edge XMCD the most appropriate choice for this study. At last, it has also to be mentioned that neither experimental nor theoretical studies on the relative orientation of the magnetic moments on the A and B sites of the CoxNi(1−x)Fe series are available in the literature.
Results
Magnetic measurements
The magnetization curves versus the magnetic field at 4 K, temperature at which the XMCD measurements were performed, are shown in Fig. 2 for the samples of the CoxNi(1−x)Fe series.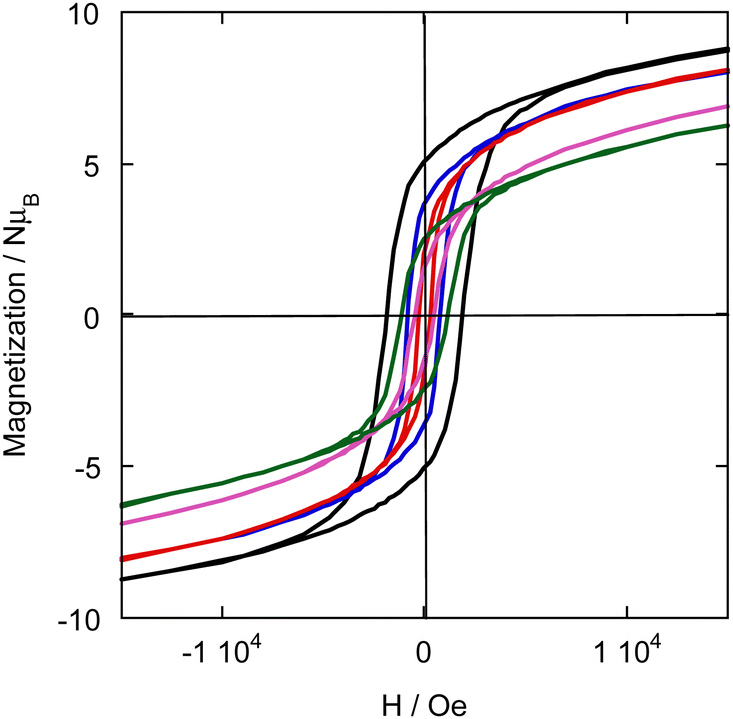 | ||
| Fig. 2 Magnetic field dependence of the magnetization at 4 K of CoFe (green), Co0.7Ni0.3Fe (pink), Co0.56Ni0.44Fe (red), Co0.35Ni0.65Fe (blue), and NiFe (black). | ||
The field cooled (FC) and zero field cooled (ZFC) magnetization curves, as well as the temperature dependence of the inverse of magnetic molar susceptibilities, are given in S2 and S3 (ESI†). The magnetic ordering temperature TC/N was determined as the temperature of a minimum in the derivative of the FC magnetization curve (dMFC(T)/dT; S2, ESI†). The Weiss (θ) magnetic constant was extracted from the plots of the inverse of the molar susceptibility versus temperature by fitting a Curie–Weiss law to the curves (S3, ESI†). All these magnetic data as well as the coercive field (HC) at 4 K and the magnetization value at 4 K and 4 T are gathered in Table 1.
| T C/N (K) | θ (K) | H c (×10−4 T) | M (4 T) (NμB) |
M
sat![[thin space (1/6-em)]](https://www.rsc.org/images/entities/char_2009.gif) calc powder mixture (NμB) calc powder mixture (NμB) |
M sat calc (NμB) | |
|---|---|---|---|---|---|---|
| CoFe | 14 | −9 | 1240 | 8.3 | 9.3 | 9.3 |
| Co0.7Ni0.3Fe | 12 | −0.25 | 500 | 8.9 | 9.7 | 3.3 |
| Co0.56Ni0.44Fe | 12 | 8.3 | 250 | 9.7 | 9.9 | 0.5 |
| Co0.35Ni0.65Fe | 16 | 14 | 750 | 9.4 | 10.2 | 3.7 |
| NiFe | 22 | 32 | 2000 | 10.1 | 10.7 | 10.7 |
The FC/ZFC magnetization curves (S2, ESI†) show the classical profile of PBA magnets and they show that at 4 K, temperature at which the XMCD signals were recorded, all compounds are in a magnetically ordered state. The single X-ray diffraction peak for each reflection (S1), the unique minimum exhibited by the dMFC(T)/dT curve (S2, ESI†) and the profile of the magnetic field dependence of the magnetization (Fig. 2) show that all compounds are made of a homogeneous PBA phase mixing the Ni2+ and Co2+ ions at the atomic scale. The presence of several phases richer in one or the other ion can be excluded.
As a first approximation, for TM ions of the first row, magnetic moments are considered originating from the spin angular momentum only. In the magnetically ordered states of PBAs, the orientation of the magnetic moments with regard to an applied external magnetic field can thus generally be predicted from the total spin quantum number of the ions and from the sign of J. In bimetallic PBAs, the magnetic moment of the ion with the largest total spin quantum number aligns in the direction of the magnetic field and the second one is parallel (J > 0) or antiparallel (J < 0) to the former depending on the sign of J. In such compounds where exchange interactions prevail, the sign of θ directly gives the sign of J. Thus, CoFe is a ferrimagnet: the magnetic moment carried by the Co2+ ion aligns in the direction of the applied magnetic field and the one of the Fe3+ ion in the opposite direction (Fig. 3a).36 In contrast, NiFe is a ferromagnet: the magnetic moments carried by both the Ni2+ and the Fe3+ ions align in the direction of the applied magnetic field (Fig. 3b).36
 | ||
| Fig. 3 Scheme of the orientation of the magnetic moment borne by the TM ions in an applied magnetic field H for (a) CoFe, (b) NiFe and (c) the CoxNi(1−x)Fe series by considering the same magnetic behavior as in the MnxNi(1−x)Cr series.39–42 (d) Experimental magnetization value at 4 K and 4 T (red circle) for the CoxNi(1−x)Fe series and Msat values as a function of x calculated from eqn (1) (white diamond) and for the corresponding mixture of the CoFe and NiFe PBA powders (white circle). | ||
In trimetallic PBAs containing two different metal ion pairs with different nature of exchange interactions (antiferro- and ferromagnetic) between them, the situation is more complex. As mentioned in the introductory part, several examples of magnetic studies of trimetallic PBAs exist in the literature and especially the PBA series of chemical formula (MnxNi(1−x))4[Cr(CN)6]8/3·nH2O,39–42 called the MnxNi(1−x)Cr series in the following. This trimetallic PBA series is comparable to our series as the extreme compounds MnCr and NiCr are also respectively ferrimagnet and ferromagnet. For this MnxNi(1−x)Cr series, the saturation magnetization was well predicted along the series by considering the same exchange interaction as in the extreme bimetallic compounds between the same pairs of ions. In the same way, we tried to predict the saturation magnetization value for one unit cell for the compounds of the CoxNi(1−x)Fe series by considering the same exchange interaction as in the bimetallic extreme PBAs between the same ion pairs (Fig. 3c) using eqn (1) in NμB units, where N is the Avogadro constant, μB the Bohr magneton and g the electron g-factor (g = 2) and which is equivalent to the equation used in ref. 39–42:
| Msatcalc = g|4(xSCo − (1 − x)SNi) − 8/3SFe| | (1) |
calc) are given in Table 1 and plotted as a function of x in Fig. 3d, where they are compared to the experimental magnetization values at 4 T and the values calculated for the corresponding mixture of the CoFe and NiFe PBA powders. Even if the saturation is not reached at 4 T, Fig. 3d clearly shows that eqn (1) fails to predict the experimental saturation magnetization in our CoxNi(1−x)Fe series. The magnetic behavior of our CoxNi(1−x)Fe series is therefore different from that of the MnxNi(1−x)Cr one described in ref. 39–42. To get a better insight into this original magnetic behavior, the compounds of the CoxNi(1−x)Fe series were investigated by XMCD at the Co, Ni and Fe K-edges to probe the local magnetic moment on each TM ion.
XMCD at the Co and Ni K-edges
The XMCD signals at the Co and Ni K-edges for the CoxNi(1−x)Fe series are shown in Fig. 4a and b respectively.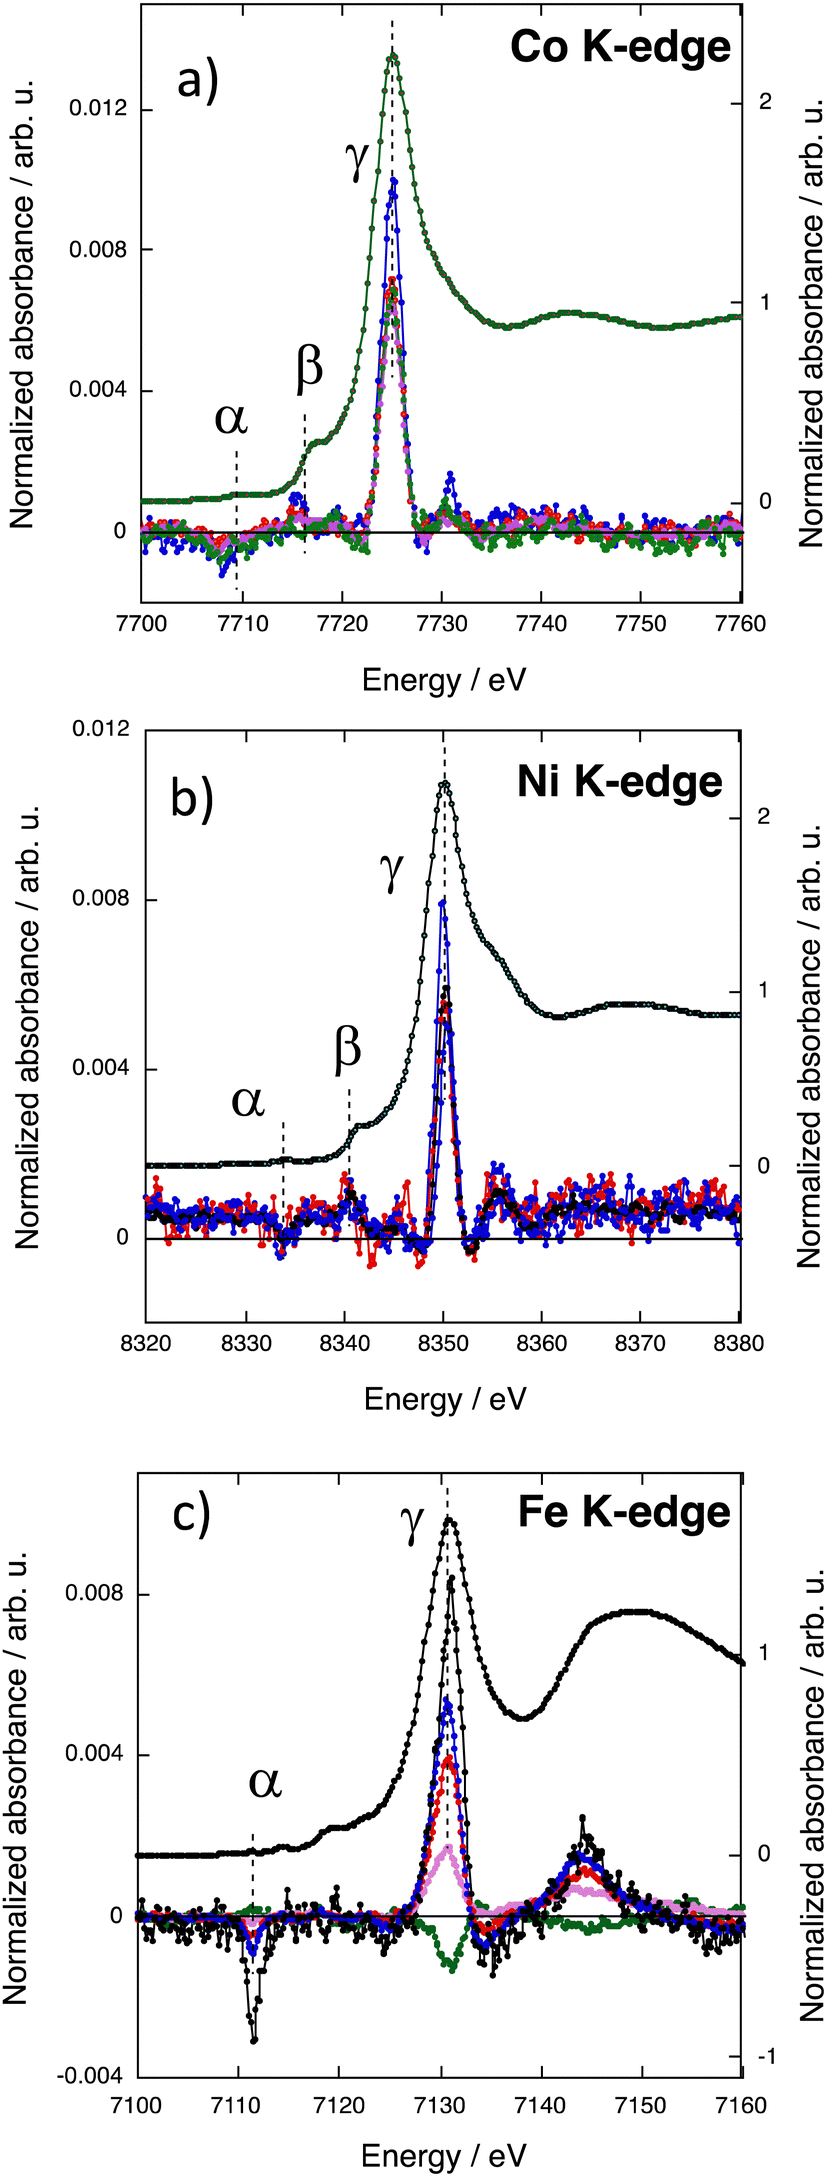 | ||
| Fig. 4 XMCD signals of CoFe (green), Co0.7Ni0.3Fe (pink), Co0.56Ni0.44Fe (red), Co0.35Ni0.65Fe (blue), and NiFe (black) (a) at the Co K-edge, (b) at the Ni K-edge and (c) at the Fe K-edge. | ||
The Co and Ni ions occupy the same site of the fcc PBA structure, called the A site above and in ref. 36. For this A site, the contributions to the signal over the edge and pre-edge regions were already assigned and discussed in ref. 36 and 38. For all compounds, over the pre-edge and edge regions, the XMCD signal exhibits one main contribution (γ) and two other contributions of significantly smaller intensity (α and β), all situated at the same energies along the series. The α contribution can be assigned to the electric-dipole forbidden 1s → 3d transitions and explained by the low symmetry of the site and associated 3d–4p orbital mixing. The β contribution can be assigned to the 1s → t1uCNπ* transitions. The two latter contributions will not be further discussed here. The main contribution to the XMCD signal (γ) at the Co K-edge (Fig. 4a) and at the Ni K-edge (Fig. 4b) can be assigned to the electric-dipole allowed 1s → 4p transitions. For one given K-edge, its intensity is very close from one compound to the other and very close to that of the corresponding bimetallic PBA, except the one of Co0.35Ni0.65Fe, which is significantly higher at both edges (blue curves). It is now well established that the sign of the main contribution to the XMCD signal in PBAs is directly related to the nature of the exchange interaction between the TM, i.e. to the direction of the magnetic moment of the probed atom with regard to the applied magnetic field.18,30,31,36,38 The same sign and the same intensity of the main contribution for CoFe, Co0.7Ni0.3Fe and Co0.56Ni0.44Fe at the Co K-edge on the one hand and for NiFe, Co0.7Ni0.3Fe and Co0.56Ni0.44Fe at the Ni K-edge on the other hand shows that the magnetic moment borne by the Co(Ni) ions as well as its direction is the same as that of the Co(Ni) ion in the corresponding bimetallic PBA, in line with the magnetic data. One can therefore conclude that, as in the corresponding bimetallic PBA, the magnetic moment of the Co(Ni) ions is aligned in the direction of the magnetic field.
The intensity of the main contribution to the XMCD signal of Co0.35Ni0.65Fe is significantly higher (25–30%) than that of all other compounds at both the Co and Ni K-edges. This different behavior of Co0.35Ni0.65Fe arises from different local features of the Co and Ni ions in this compound. The magnetic measurements do not reveal neither a different electronic structure of the Co2+ and Ni2+ ions in Co0.35Ni0.65Fe nor a discontinuity in the macroscopic magnetic properties of this compound along the series. Nevertheless, structural strains and slight distortions of the ion coordination sphere could arise from the different sizes of the Co2+ and Ni2+ ions associated in the same A site of the PBA structure. The XRD patterns (S1) show that all compounds crystallize with the same fcc PBA structure and only the lattice constant varies. The variation of the lattice constant value with the percentage of Co2+ ions in the A site (Co%) is shown in Fig. S4 (ESI†). The lattice constant varies linearly with Co% for CoFe, Co0.70Ni0.30Fe and Co0.56Ni0.44Fe, indicating that up to the replacement of 44% of Co2+ ions by the smaller Ni2+ ones, the PBA structure accommodates both ions by a decrease of the lattice constant. Nevertheless, one can also see that the lattice constant of NiFe deviates from this linear variation as well as that of Co0.35Ni0.65Fe. When the Co% reaches a certain threshold between 56 and 35%, the replacement of Co2+ ions by the Ni2+ ones can no more be compensated by a single lattice constant decrease. The size of both cations being different, one too small (Ni2+) and the other one too large (Co2+) for the ideal face centered cubic lattice, the structural distortion would be local and different for both ions. Network strains likely develop, slightly distorting the coordination spheres of the Co2+ and Ni2+ ions and enhancing the deviation from the pure Oh symmetry of the local structure of the ions either with a slight displacement of the ion from the crystallographic site and/or a slight tilt of the coordination polymer. Such a local distortion of the A site, by reinforcing the intra-site 3d–4p orbital mixing, could explain the higher intensity of the main contribution to the XMCD signal of Co0.35Ni0.65Fe at the Co and Ni K-edges.
XMCD at the Fe K-edge
The XMCD signals of the CoxNi(1−x)Fe series at the Fe K-edge are shown in Fig. 4c. All the spectra exhibit the same contributions. Over the pre-edge and edge regions, the α and γ contributions can be assigned to the 1s → 3d and the 1s → 4p transitions respectively.38 It is striking that the intensity of the γ contribution at the Fe K-edge varies strongly with the Co%. We already showed in ref. 38 that the γ contribution at the TM K-edge at the B site is sensitive to the nature of the ion in the A site, on the contrary to the A site, which is not sensitive to the ions in the B site; this difference between both sites is explained by the different symmetries of the sites.38 In ref. 38, we showed that the intensity of the main contribution to the XMCD signal at the Fe K-edge is well reproduced by eqn (2).| IFe = (1 ± SA) × (1/3) × Pexp | (2) |
| IFe = (1 + (1 − x)SNi − xSCo) × (1/3) × Pexp | (3) |
 | ||
| Fig. 5 Experimental (Iexp) versus calculated (Icalc) intensity using eqn (3) (blue open squares; error bar ±0.001) compared to Iexpversus Icalc for the sixteen XMCD signals of the AFe PBAs (A = Cu2+, Ni2+, Co2+, Mn2+) and the ACr PBAs (A = Ni2+, Co2+, Fe2+, Mn2+) previously investigated in ref. 36 and 38 (black dots). | ||
Discussion
Input of this work on the understanding of the magnetic properties of PBAs
The behavior of the magnetic moments carried by all three TM ions (Co2+, Ni2+ and Fe3+) can be proposed from the XMCD investigation at the three TM K-edges.Very close main contributions to the XMCD signal at the Co and Ni K-edges for Co0.70Ni0.30Fe, Co0.56Ni0.44Fe, CoFe and NiFe indicate that the magnetic moments carried by both ions exhibit the same behavior as in the extreme bimetallic compounds CoFe and NiFe. This means that the magnetic moments of the Co2+ and Ni2+ ions are aligned in the direction of the applied magnetic field. This is in agreement with the experimental values of the magnetization at 4 T, significantly higher than those calculated using eqn (1) considering antiparallel magnetic moments for the Co2+ and Ni2+ ions, as was the case for the Mn2+ and Ni2+ ions along the MnxNi(1−x)Cr series in ref. 39–42. The magnetic moments really borne by the Co2+ and Ni2+ ions are schematized as plain blue and plain green arrows in Fig. 6.
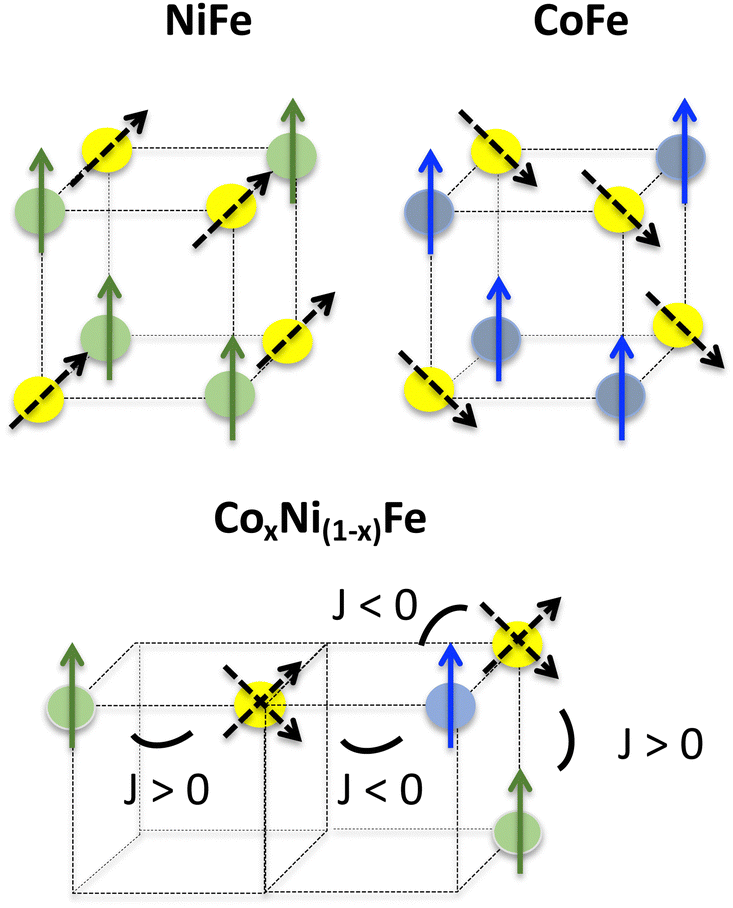 | ||
| Fig. 6 Scheme of the proposed orientations of the magnetic moments for an octant of the fcc PBA structure. The Ni2+, Co2+ and Fe3+ ions are represented by green, blue and yellow spheres, respectively, and their magnetic moments by plain green, plain blue and dotted black arrows. The orientations of the magnetic moment with regard to the crystallographic axes are those proposed in ref. 38. The proposed alignment of the Fe magnetic moments along the 〈111〉 directions is in line with a slight trigonal distortion of the Fe(CN)6 entities52 and a strong spin–orbit coupling. It has to be noted that the proposed spin-canted magnetic structure of the Fe ions remains a hypothesis or one of the possible models. | ||
In the case of the Fe K-edge, the variation of the intensity of the main contribution to the XMCD signal is well reproduced by eqn (3). As mentioned above, this suggests that the behaviour of the Fe3+ ion magnetic moment in the trimetallic compounds is the same as that of the latter in the extreme bimetallic compounds, antiferromagnetically coupled with the Co2+ ions and ferromagnetically coupled with the Ni2+ ones but weighted by the amount of Co2+ and Ni2+ ions in the compounds. Such a magnetic situation could lead to spin frustration in the PBAs, especially since NiFe and CoFe present close strength of exchange interactions between the two ions in both ion pairs.‡53 A frustration parameter given by f = |θ|/TC/N has been introduced to evaluate the frustration degree and the condition |θ|/TC/N > 10 has been proposed as a criterion for the presence of frustration.54 This empirical criterion was proposed assuming that magnetic interactions are on an energy scale set by the exchange energy54 and thus, without spin frustration, |θ| is expected to be close to the magnetic ordering temperature value. |θ| encompasses any deviation from the Curie law. In our case, deviation from the Curie law can reasonably be assigned to exchange interactions, but spin–orbit coupling can also play a non-negligible role. Assuming that neither NiFe nor CoFe exhibits spin frustration, the linear variation of the Curie–Weiss constant with the Co ion mole fraction percentage (x) along the series of compounds (Fig. S5, ESI†) shows that no significant effects other than those already operating in CoFe and NiFe are detectable along the series of compounds. Thus, along the CoxNi(1−x)Fe series, the linear variation of θ with x (Fig. S5, ESI†), the low value of the f parameter (f < 1.5) for all compounds, the classical profile of the FC and ZFC magnetization curves, as well as the orientation of each pair of spins consistent with the sign of the corresponding J constant, allow us to rule out the presence of spin frustration in the compounds of the series, as it was the case for the MnxNi(1−x)Cr series previously studied.39 From the variation of the intensity of the Fe K-edge XMCD signal (eqn (3)) along the CoxNi(1−x)Fe series, we propose an orientation of the magnetic moments carried by the Fe3+ ions with regard to that of the applied magnetic field dictated by the weighted amount of both the Ni2+ and Co2+ ions in the A sub-lattice, without spin frustration. The direction and orientation of the magnetic moment borne by the Fe3+ ions under the influence of Co2+ or Ni2+ ions are schematized as black doted arrows in Fig. 6.
The main difference between the comparable MnxNi(1−x)Cr PBA series and our CoxNi(1−x)Fe series is that, in the former, the orientation of the magnetic moments at low temperature is directly dictated by the exchange interaction between the two ions in each pair (Ni–Cr and Mn–Cr). On the contrary, in our series the magnetic moments of the Co2+ and Ni2+ ions at the A site both align in the direction of the magnetic field despite the different nature of exchange interactions with the Fe3+ ion that they surround, and then, the orientation of the magnetic moment carried by the Fe3+ ions is dictated by the exchange interactions between the two ions in both pairs (Ni–Fe and Co–Fe), the average orientation being dictated by the relative amount of both Co2+ and Ni2+ ions. These different magnetic behaviors of the MnxNi(1−x)Cr and CoxNi(1−x)Fe PBA series arise from different magnetic behaviors of the TM ions listed below. First, due to the higher number of unpaired electrons in the t2g orbitals for the Cr3+ ions (3 against 1 for the Fe3+ ions), the exchange interactions with the surrounding ions (Mn2+ and Ni2+) are stronger in the MnxNi(1−x)Cr series than in the CoxNi(1−x)Fe series. Second, due to the slightly different geometries of the M(CN)6 entities, octahedral for Cr(CN)6 and slightly trigonally distorted for Fe(CN)6 with strong spin–orbit coupling (see ref. 38), the directions of the magnetic moments borne by the TM ion in these entities are different: aligned along the same 〈100〉 directions as those of the TM ions on the A site for the Cr(CN)6 entities, while for the Fe(CN)6 entities aligned along the 〈111〉 directions, different from those of the magnetic moments carried by the ions on the A site. Third, ref. 55 showing a comparable behavior of the Cu0.73Mn0.77[Fe(CN)6]·zH2O compound to those of the MnxNi(1−x)Cr series, a stronger magnetic anisotropy of the Co2+ and Ni2+ ions in the CoxNi(1−x)Fe series than that of the Mn2+ and Ni2+ ions in the MnxNi(1−x)Cr series can also be mentioned.38 At last, one can also not exclude the role of the exchange interactions between TM second neighbors more important than those considered so far.
Input of this work on the understanding of XMCD at the transition metal K-edge for the study of molecular materials
The case of the B site is different because our previous work showed that the 1s → 4p XMCD signal at the K-edge of the ions on the B site of PBAs contains not only information on the ions or the sublattice of the ions on the B site but also on the ions on the A site.38 In order to determine whether XMCD at the K-edge of ions at the B site of PBAs is a local probe of the ion on the B site and its TM neighbors or a more extended probe, 50% of the Fe(CN)6 entities were replaced by the Cr(CN)6 ones in NiFe. This compound is called NiCr0.50Fe0.50 in the following and its X-ray diffraction pattern, FC-ZFC magnetization curves and magnetic field dependence of the magnetization at 4 K are shown in S6–S8. The XMCD signals of NiCr0.50Fe0.50 were compared to those of NiFe and the NiCr PBA (called NiCr) of chemical formula Ni4[Cr(CN)6]8/3·17H2O, the synthesis and characterization of which are both presented in ref. 36. Fig. 7a shows the XMCD signals at the Ni K-edge of NiFe, NiCr0.50Fe0.50 and NiCr. As expected, the signals are the same. XMCD at the TM ion on the A site of PBAs is a local probe of the ion, which is in a very close environment in the three PBAs, with definitely no influence from the TM ions in the B sites. Fig. 7b and c show the XMCD signals of NiCr0.50Fe0.50 compared to those of NiCr at the Cr K-edge and of NiFe at the Fe K-edge, respectively. The XMCD signal of NiCr0.50Fe0.50 is the same as that of NiCr at the Cr K-edge and the same as that of NiFe at the Fe K-edge. This result shows that, as at the K-edge of the TM ions on the A site, XMCD at the K-edge of the TM ions on the B site is not sensitive to the replacement of part of them and is therefore a local probe of the ion at the B site and its first metallic neighbors.
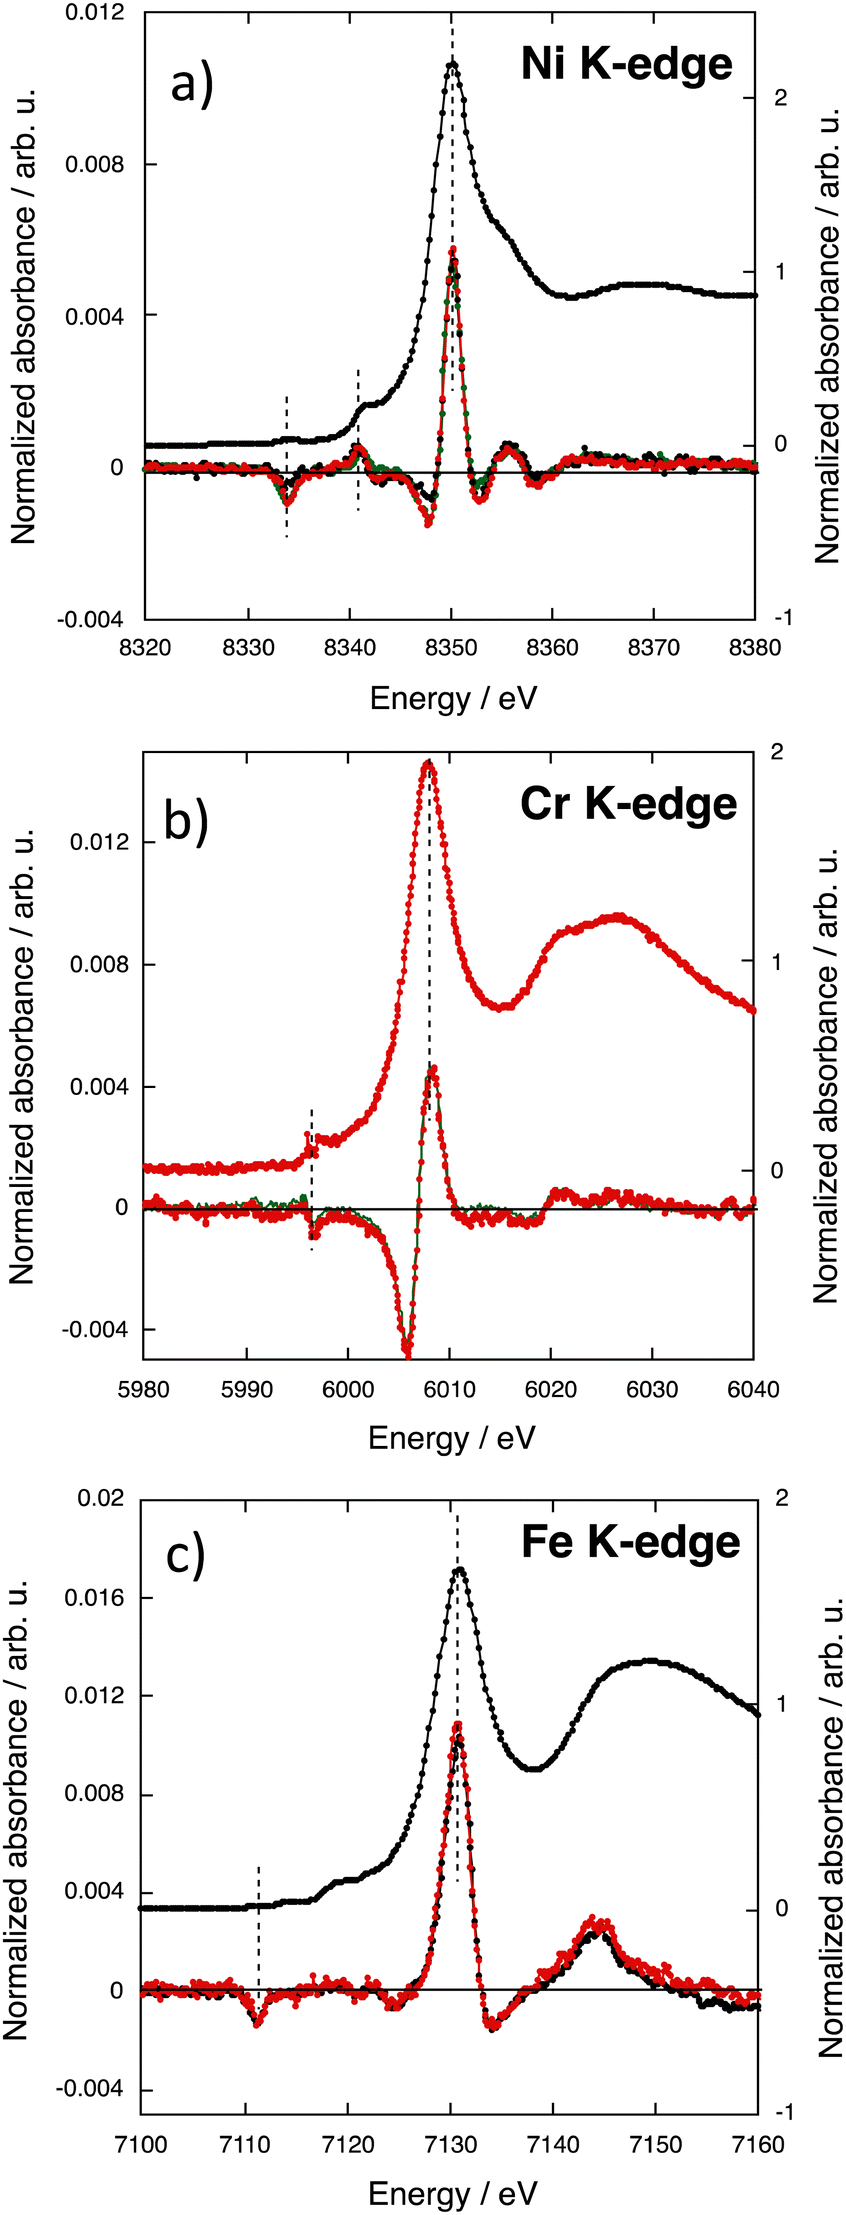 | ||
| Fig. 7 (a) XMCD signals at the Ni-K edge of NiFe (black), NiCr0.50Fe0.50 (red) and NiCr (green) and XANES at the Ni K-edge of NiFe (black); (b) XMCD signals at the Cr K-edge of NiCr0.50Fe0.50 (red) and NiCr (green) and XANES at the Cr K-edge of NiCr0.50Fe0.50 (red); (c) XMCD signals at the Fe K-edge of NiCr0.50Fe0.50 (red) and NiFe (black) and XANES at the Fe K-edge of NiFe (black). | ||
 | ||
| Fig. 8 (a) XANES spectra at the Fe K-edge of Co0.35Ni0.65Fe (blue), CoFe (green) and NiFe (black); (b) XANES spectra at the Ni K-edge of Co0.35Ni0.65Fe (blue) and NiFe (black) (c) XANES spectra at the Co K-edge of Co0.35Ni0.65Fe (blue) and CoFe (green). | ||
Experimental
A series of five (CoxNi(1−x))4[Fe(CN)6]8/3·nH2O PBAs (called CoxNi(1−x)Fe) were synthesized. EDS analysis, powder X-ray diffraction and magnetic measurements were performed using the devices of the ICMMO instrumentation platform. The syntheses and characterizations of the two extreme compounds CoFe and NiFe were presented in ref. 36.Sample preparation
The three PBAs were synthesized by drop-by-drop addition of two precursors in aqueous solutions: a 400 mL aqueous solution of potassium hexacyanoferrate(III) K3[Fe(CN)6] (c = 2.5 × 10⁻³ mol L−1) was added to a 100 mL aqueous solution of a mixture of Co(NO3)2 and Ni(NO3)2 salts (ctot = 50 × 10−3 mol L−1). The precipitates were washed with distilled water and centrifuged three times at 8000 rpm and finally allowed to dry in air at room temperature.Energy dispersive spectroscopy (EDS) analysis
The chemical formulas of the three trimetallic PBAs were determined by EDS analysis, using an EDS spectrometer installed on a ZEISS Sigma HD microscope. Data processing was done using the IDFix EDS analysis software. The results are given in S1 (ESI†) for the CoxNi(1−x)Fe series.Powder X-ray diffraction (XRD)
Powder XRD data were collected with a Philips X’Pert diffractometer (Cu Kα1 radiation) at room temperature. All diagrams were recorded over the 10–70° 2θ angle range with steps of 0.01°. An aluminum sample holder was used for all measurements. The cell parameters were extracted by a Le Bail refinement procedure (using the Fullprof software), considering an Fm3m space group. The XRD patterns and corresponding cell parameters of the CoxNi(1−x)Fe series are given in S1 (ESI†).SQUID magnetometry
Magnetic properties were investigated using a quantum device XL-7 SQUID magnetometer. 5.6 mg of PBA powder was placed in a capsule and 17 mg of eicosane were added to ensure that the particles would not move with the application of the magnetic field. Field cooled-zero field cooled (FC-ZFC) measurements were performed over the 2—100 K temperature range under a 30 Oe magnetic field (S2, ESI†). In order to determine the Weiss temperature (θ), the magnetization was measured as a function of temperature up to 300 K under a 5000 Oe magnetic field; the experimental curves were fitted using a Curie–Weiss law (S3, ESI†). Finally, the magnetic field dependence of magnetization was recorded at 4 K for a magnetic field varying between −40000 Oe (−4 T) and 40000 Oe (4 T).
Transition metal K-edge XAS
X-ray absorption spectra in the transmission mode were recorded for the CoxNi(1−x)Fe series at the three K-edges on the SAMBA beamline56 at SOLEIL (Gif sur Yvette, France). We used a Si(220) monochromator and recorded the spectra in a continuous mode. Measurements were performed at room temperature on pellets. We carefully checked that no radiation damage occurred. Following the measurements, the spectra were energy-calibrated and conventionally normalized using the ATHENA software.57TM K-edge XMCD
Co, Ni and Fe K-edge X-ray absorption near-edge structure (XANES) spectra and XMCD signals were recorded in the transmission mode using the dispersive setup of the ODE beamline58,59 at SOLEIL synchrotron (Gif sur Yvette, France). Detailed information is given about the measurements and normalization procedure in ref. 35, and so only the main ones are reminded here. The circular polarization rate is the same for all the edges. The Si(311) polychromator was chosen to achieve the highest possible resolution in the white line region of the spectra. Then, it is critical (i) to be well below the Curie temperature of the eight investigated PBAs, and (ii) to avoid any artifact in the intensity related to a change in the temperature, we carefully performed the measurements at 4 K. The largest external magnetic field (1.3 T) that can be reached when the cryostat was used was applied alternatively parallel and antiparallel to the direction of the photon beam. The samples were placed in a diamond anvil cell (DAC) and, to minimize the absorption of the beam while retaining a brilliant enough flux to be able to perform the measurements, the diamonds of the DAC were replaced by Plexiglas strips. No radiation damage occurred thanks to attenuators of appropriate thickness. A metallic foil was recorded at both edges for energy calibration. We normalized the XANES spectra and XMCD signals using the procedure described in ref. 35.Conclusions
The study of the trimetallic CoxNi(1−x)Fe PBA series by TM K-edge XMCD at the Co, Ni and Fe K-edges and SQUID magnetometry shows that their magnetic structures can be explained by exchange interactions of the same sign as seen in the corresponding binary PBAs and spin frustration is not expected to occur.Local structural distortions are likely to occur at certain compositions that cannot be detected by XAS but can be detected by XMCD, indicating that K-edge XMCD could be an extremely sensitive probe of slight structural distortions.
The use of the trimetallic CoxNi(1−x)Fe PBA series as a tool to better understand the TM K-edge XMCD in PBAs shows that K-edge XMCD is a local atomic probe of the TM atoms probed in this PBA series, despite the spatially extended character of the probed 4p orbitals. At the A site, TM K-edge XMCD is an atomic probe of only the probed element. At the B site, due to the deviation from centro-symmetry of the A site and the associated 3d–4p mixing,38 XMCD at the TM K-edge is a local probe of the probed element but also of its first magnetic neighbors.
The Prussian blue analogues have been chosen as model compounds to better understand TM K-edge XMCD, because some electronic and structural parameters can be selectively varied and were successfully related to XMCD features. The next step will be to extend the interpretation of the TM K-edge XMCD signals of PBAs to (i) other molecular magnetic materials and (ii) materials whose electronic structures are well-described in terms of molecular orbitals. Another step will be to get direct experimental evidence of our hypothesis on the relative orientation of the magnetic moments and crystallographic axes (ref. 36 and 38 and this work). Resonant X-ray scattering using circularly polarized X-rays or neutron diffraction could be performed to get such evidence.
Author contributions
The authors are sad to specify that their colleague, co-author and friend, François Baudelet, passed away on January 28th, 2022. He carried out the experiments during two synchrotron beamtimes for the results presented here and was deeply involved in the interpretation of the data. The manuscript was written through the contribution of all other authors, who have given approval to the final version of the manuscript.Conflicts of interest
There are no conflicts to declare.Acknowledgements
Financial support was provided for the whole TM K-edge XMCD project and the PhD grant of A. N’Diaye by ANR MagDiDi (ANR-17-CE29-0011), Paris-Saclay University and the CNRS. The authors acknowledge SOLEIL for the provision of the synchrotron radiation facility on the ODE beamline through proposals 20190412 and 20201335 and on the SAMBA beamline through proposal 20180264.Notes and references
- B. T. Thole, P. Carra, F. Sette and G. van der Laan, Phys. Rev. Lett., 1992, 68, 1943 CrossRef CAS PubMed.
- P. Carra, B. T. Thole, M. Altarelli and X. Wang, Phys. Rev. Lett., 1993, 70, 694 CrossRef CAS PubMed.
- C. T. Chen, Y. U. Idzerda, H.-J. Lin, N. V. Smith, G. Meigs, E. Chaban, G. H. Ho, E. Pellegrin and F. Sette, Phys. Rev. Lett., 1995, 75, 152 CrossRef CAS PubMed.
- R. Moroni, C. Cartier dit Moulin, G. Champion, M.-A. Arrio, P. Sainctavit, M. Verdaguer and D. Gatteschi, Phys. Rev. B: Condens. Matter Mater. Phys., 2003, 68, 064407 CrossRef.
- A. Rogalev and F. Wilhelm, Phys. Metals Metallography, 2015, 116, 1285 CrossRef.
- J. I. Igarashi and K. Hirai, Phys. Rev. B: Condens. Matter Mater. Phys., 1996, 53, 6442 CrossRef CAS PubMed.
- N. Bouldi, N. J. Vollmers, C. G. Delpy-Laplanche, Y. Joly, A. Juhin, P. Sainctavit, C. Brouder, M. Calandra, L. Paulatto, F. Mauri and U. Gerstmann, Phys. Rev. B, 2017, 96, 085123 CrossRef.
- H. Ebert, Solid State Commun., 1996, 100, 677 CrossRef CAS.
- S. Stähler, G. Schütz and H. Ebert, Phys. Rev. B, 1993, 47, 818 CrossRef PubMed.
- H. J. Gotsis and P. A. Strange, J. Phys.: Condens. Matter, 1994, 6, 1409 CrossRef CAS.
- G. Y. Guo, J. Phys.: Condens. Matter, 1996, 8, L747 CrossRef CAS.
- C. Brouder and M. Hikam, Phys. Rev. B: Condens. Matter Mater. Phys., 1991, 43, 3809 CrossRef PubMed.
- C. Brouder, M. Alouani and K. H. Bennemann, Phys. Rev. B: Condens. Matter Mater. Phys., 1996, 54, 7334 CrossRef CAS PubMed.
- C. R. Natoli, M. Benfatto and S. Doniach, Phys. Rev. A: At., Mol., Opt. Phys., 1986, 34, 4682 CrossRef PubMed.
- Y. Joly, O. Bunau, J. E. Lorenzo, R. M. Galéra, S. Grenier and B. Thompson, J. Phys.: Conf. Ser., 2009, 190, 012007 CrossRef.
- R. Torchio, O. Mathon and S. Pascarelli, Coord. Chem. Rev., 2014, 277–278, 80 CrossRef CAS.
- F. Baudelet, S. Pascarelli, O. Mathon, J.-P. Itié, A. Polian, M. d’Astuto and J.-C. Chervin, J. Phys.: Condens. Matter, 2005, 17, S957 CrossRef CAS.
- J.-D. Cafun, J. Lejeune, J.-P. Itié, F. Baudelet and A. Bleuzen, J. Phys. Chem. C, 2013, 117, 19645 CAS.
- N. Ishimatsu, T. Shichijo, Y. Matsushima, H. Maruyama, Y. Matsuura, T. Tsumuraya, T. Shishidou, T. Oguchi, N. Kawamura, M. Mizumaki, T. Matsuoka and K. Takemura, Phys. Rev. B: Condens. Matter Mater. Phys., 2012, 86, 104430 CrossRef.
- R. Torchio, Y. O. Kvashnin, S. Pascarelli, O. Mathon, C. Marini, L. Genovese, P. Bruno, G. Garbarino, A. Dewaele, F. Occelli and P. Loubeyre, Phys. Rev. Lett., 2011, 107, 237202 CrossRef CAS PubMed.
- R. Torchio, A. Monza, F. Baudelet, S. Pascarelli, O. Mathon, E. Pugh, D. Antonangeli and J.-P. Itié, Phys. Rev. B: Condens. Matter Mater. Phys., 2011, 84, 060403(R) CrossRef.
- G. Schütz, W. Wagner, W. Wilhelm, P. Kienle, R. Zeller, R. Frahm and G. Materlik, Phys. Rev. Lett., 1987, 58, 737 CrossRef PubMed.
- J. P. Rueff, R. M. Galéra, C. Giorgetti, E. Dartyge, C. Brouder and M. Alouani, Phys. Rev. B: Condens. Matter Mater. Phys., 1998, 58, 12271 CrossRef CAS.
- J. Herrero-Albillos, F. Bartolomé, L. M. Garcia, P. Cerbuna, F. Casanova, A. Labarta and X. Batlle, Phys. Rev. B: Condens. Matter Mater. Phys., 2007, 75, 187402 CrossRef.
- M. A. Laguna-Marco, C. Piquer and J. Chaboy, Phys. Rev. B: Condens. Matter Mater. Phys., 2009, 80, 144419 CrossRef.
- V. Gadet, T. Mallah, I. Castro, M. Verdaguer and P. Veillet, J. Am. Chem. Soc., 1992, 114, 9213 CrossRef CAS.
- T. Mallah, S. Thiébaut, M. Verdaguer and P. Veillet, Science, 1993, 262, 1554 CrossRef CAS PubMed.
- S. Ferlay, T. Mallah, R. Ouahès, P. Veillet and M. Verdaguer, Nature, 1995, 378, 701 CrossRef CAS.
- T. Mallah, S. Ferlay, C. Auberger, C. Hélary, F. L’Hermite, R. Ouahès, J. Vaissermann, M. Verdaguer and P. Veillet, Mol. Cryst. Liq. Cryst., 1995, 273, 141 CrossRef.
- M. Verdaguer, T. Mallah, C. Hélary, F. L’Hermite, P. Sainctavit, M.-A. Arrio, D. Babel, F. Baudelet, E. Dartyge and A. Fontaine, Phys. B, 1995, 208–209, 765 CrossRef.
- E. Dujardin, S. Ferlay, X. Phan, C. Desplanches, C. Cartier dit Moulin, P. Sainctavit, F. Baudelet, E. Dartyge, P. Veillet and M. Verdaguer, J. Am. Chem. Soc., 1998, 120, 11347 CrossRef CAS.
- J. M. Herrera, A. Bachschmidt, F. Villain, A. Bleuzen, V. Marvaud, W. Wernsdorfer and M. Verdaguer, Phil. Trans. R. Soc. A, 2008, 366, 127 CrossRef CAS PubMed.
- G. Champion, V. Escax, C. Cartier dit Moulin, A. Bleuzen, F. Villain, F. Baudelet, E. Dartyge and M. Verdaguer, J. Am. Chem. Soc., 2001, 123, 12544 CrossRef CAS PubMed.
- A. Bordage, L. Nataf, F. Baudelet and A. Bleuzen, J. Phys.: Conf. Ser., 2016, 712, 012109 CrossRef.
- A. N’Diaye, A. Bordage, L. Nataf, F. Baudelet, T. Moreno and A. Bleuzen, J. Synchrotron Rad., 2021, 28, 1127 CrossRef PubMed.
- A. N’Diaye, A. Bordage, L. Nataf, F. Baudelet, E. Rivière and A. Bleuzen, Inorg. Chem., 2022, 61, 6326 CrossRef PubMed.
- A. Bordage, A. N’Diaye and A. Bleuzen, C. R. Chimie, 2022, 25, 281 CrossRef CAS.
- A. N’Diaye, A. Bordage, L. Nataf, F. Baudelet, E. Rivière and A. Bleuzen, ACS Omega, 2022, 7, 36366 CrossRef PubMed.
- S.-I. Ohkoshi, T. Iyoda, A. Fujishima and K. Hashimoto, Phys. Rev. B: Condens. Matter Mater. Phys., 1997, 56, 11642 CrossRef CAS.
- S.-I. Ohkoshi, O. Sato, T. Iyoda, A. Fujishima and K. Hashimoto, Inorg. Chem., 1997, 36, 268 CrossRef CAS.
- S.-I. Ohkoshi, S. Yorozu, O. Sato, T. Iyoda, A. Fujishima and K. Hashimoto, Appl. Phys. Lett., 1997, 70, 1040 CrossRef CAS.
- S.-I. Ohkoshi, O. Sato, A. Fujishima and K. Hashimoto, J. Am. Chem. Soc., 1998, 120, 5349 CrossRef CAS.
- S.-I. Ohkoshi and K. Hashimoto, Phys. Rev. B: Condens. Matter Mater. Phys., 1999, 60, 12820 CrossRef CAS.
- S.-I. Ohkoshi and K. Hashimoto, J. Am. Chem. Soc., 1999, 121, 10591 CrossRef CAS.
- A. Widmann, H. Kahlert, I. Petrovic-Prelevic, H. Wulff, J. V. Yakhmi, N. Bagkar and F. Scholz, Inorg. Chem., 2002, 41, 5706 CrossRef CAS PubMed.
- A. Kumar and S. M. Yusuf, Phys. B, 2005, 362, 278 CrossRef CAS.
- L. Egan, K. Kamenev, D. Papanikolaou, Y. Takabayashi and S. Margadonna, J. Am. Chem. Soc., 2006, 128, 6034 CrossRef CAS PubMed.
- D. M. Pajerowski, J. E. Gardner, D. R. Talham and M. W. Meisel, J. Am. Chem. Soc., 2009, 131, 12927 CrossRef CAS PubMed.
- D. M. Pajerowski, T. Yamamoto and Y. Einaga, Inorg. Chem., 2012, 51, 3648 CrossRef CAS PubMed.
- F. J. Luque, I. A. Kowalik, J. P. Prieto-Ruiz, M. A. Nino, H. Prima-Garcia, F. M. Romero, D. Arvanitis, E. Coronado, R. Miranda and J. J. de Miguel, J. Mater. Chem. C, 2018, 6, 8171 RSC.
- S. F. Jafri, M.-A. Arrio, A. Bordage, R. Moulin, A. Juhin, C. Cartier dit Moulin, E. Otero, P. Ohresser, A. Bleuzen and P. Sainctavit, J. Inorg. Chem., 2018, 57, 7610 CrossRef CAS PubMed.
- M. Atanasov, P. Comba, C. A. Daul and A. Hauser, J. Phys. Chem. A, 2007, 111, 9145 CrossRef CAS PubMed.
- J. S. Smart, Effective Field Theory of Magnetism, W. B. Saunders Company, Philadelphia and London, 1966 Search PubMed.
- J. E. Greedan, J. Mater. Chem., 2001, 11, 37 RSC.
- A. Kumar, S. M. Yusuf, L. Keller and J. V. Yakhmi, Phys. Rev. Lett., 2008, 101, 207206 CrossRef PubMed.
- V. Briois, E. Fonda, S. Belin, L. Barthe, C. La Fontaine, F. Langlois, M. Ribens and F. Villain, UVX 2010 EDP Sci., 2011, 41 Search PubMed.
- B. Ravel and M. Newville, J. Synchrotron Rad., 2005, 12, 537 CrossRef CAS PubMed.
- F. Baudelet, Q. Kong, L. Nataf, J.-D. Cafun, A. Congedutti, A. Monza, S. Chagnot and J.-P. Itié, High Press. Res., 2011, 31, 136 CrossRef.
- F. Baudelet, L. Nataf and R. Torchio, High Press. Res., 2016, 36, 429 CrossRef CAS.
Footnotes |
| † Electronic supplementary information (ESI) available. See DOI: https://doi.org/10.1039/d3cp04749k |
| ‡ The absolute value of the ratio between the magnetic coupling constant between both NiFe (JNiFe) and CoFe (JCoFe) ions pairs can be estimated within the mean-field approach by considering dominant exchange interaction between neighboring TM ions.53 Indeed, the proportional relationship between TC/N, the magnetic ordering temperature, z the number of magnetic neighbors and J the magnetic coupling constant for a given PBA is given by: TC/N ∝ zJ. The number of magnetic neighbors being the same in NiFe and CoFe, this approximation gives the value of 1.6 for |JNiFe/JCoFe|, indicative of exchange interactions with close strengths between both pairs of ions. Such close strength of exchange interactions of different nature in the same PBA network could give rise to spin frustration. |
| This journal is © the Owner Societies 2024 |