
 Open Access Article
 This Open Access Article is licensed under a
 Creative Commons Attribution 3.0 Unported Licence
Impurity retention and pharmaceutical solid solutions: visualizing the effect of impurities on dissolution and growth using dyed crystals†
Anne
Nong
a,
Claire
Schleper
a,
Abigail
Martin
a,
Mitchell
Paolello
a,
Fredrik L.
Nordstrom
 b and
Gerard
Capellades
*a
b and
Gerard
Capellades
*a
aDepartment of Chemical Engineering, Rowan University, Glassboro, New Jersey 08028, USA. E-mail: capellades@rowan.edu
bMaterial & Analytical Sciences, Boehringer-Ingelheim, Ridgefield, Connecticut 06877, USA
First published on 18th September 2024
Abstract
Pharmaceutical solid solutions are gaining increased interest as alternatives to salts and co-crystals for the enhancement of drug solubility and dissolution kinetics. Industrially, they are also responsible for the entrapment of potentially toxic impurities in drug substances. The accidental incorporation of process impurities into the lattice of a growing crystal, or the intentional incorporation of an additive, can vastly alter the product's properties. Reported effects include solubility enhancements, changes in melting point, shifting polymorph stabilities, growth inhibition, and change in crystal habit, among others. This work combines the fields of impurity rejection, solid solutions, and dyeing crystals, to provide visual evidence of those effects, and to further demonstrate how impure regions in a single crystal can present vastly different behaviors to the purified regions of the same crystal. The work revolves around four model host–guest pairs, two of them previously unreported. These include mixed crystals of acetaminophen with curcumin, sulforhodamine B, and acid fuchsin, as well as potassium sulfate dyed with acid fuchsin. Results challenge common assumptions in the study of multicomponent crystals, demonstrating how neglecting composition anisotropy may lead to misdiagnosing solid solutions as surface adsorbed impurities in impurity retention diagnostics, and how neglecting the habit-modifying effects of dissolved impurities may lead to the use of erroneous models for growth inhibition. At the same time, we present opportunities for the development of novel impurity rejection and crystal engineering strategies, aiding the growth of anisotropic crystals with properties that can be fine-tuned in continuum.
Introduction
Solid solutions and pharmaceutical manufacturing
Pharmaceutical products delivered in oral forms like tablets or capsules most often contain crystalline Active pharmaceutical ingredients (APIs). APIs or drug substances are isolated from industrial crystallization processes that start with a mixture of the synthesized material together with process impurities. Even a relatively simple synthesis involving five reaction steps can lead to the formation of more than 60 organic impurities, as a combination of unreacted raw materials, intermediates, and by-products.1,2 Most of these impurities are structurally similar to the API and they can readily incorporate into its lattice as guests, affecting critical solid-state properties of the final product.Beyond the potentially toxic effects that process impurities retained in pharmaceuticals can have on the patient, their existence also poses processing concerns, most notably: (1) impurities tend to increase the solubility of the crystallizing material, leading to yield losses;3–7 (2) interactions between the impurity and the growing product can inhibit the rate of crystal growth,8–11 further decreasing the attainable yields and particle sizes; (3) impurities can also modify the most stable crystal habit,12–15 sometimes leading to morphologies that pose filtration or formulation challenges;16,17 and (4) the appearance of new impurities in manufacturing can shift the stability of certain polymorphs,18–20 thus hindering the formation of the target crystal form that is required for that pharmaceutical. While polymorph shifts have also been explained through a change in surface energy penalties through size and habit modifications,21 most of the aforementioned effects are frequently tied to the presence of impurities or additives. These processing challenges are not limited to crystallization of APIs, but also to the isolation and purification of process intermediates by crystallization.
Several impurity retention mechanisms have been identified in the academic literature, including those based on lattice incorporation (like solid solutions and co-crystals), surface adsorption, mother liquor inclusion, or simultaneous precipitation.22–24 The extent to which impurities will affect the drug's properties, as well as methods for their rejection from the final product, highly depend on the mechanism at play. In a recent study, we combined data from 52 product-impurity pairs, mostly from development pipelines across two major pharmaceutical companies, to find which impurity mechanisms were primarily responsible for the retention of process impurities to industrially concerning levels (0.1% or higher). The formation of solid solutions between product and impurity was the main mechanism, present in 79% of the studied cases, followed by simultaneous precipitation of the product and impurity.25
On a brighter side, the intentional incorporation of an additive into a pharmaceutical's lattice provides opportunities for crystal engineering. Molecular solid solutions have been used to enhance solubility and dissolution rates of multiple drugs,26–29 and their ability to switch polymorph stabilities can be used to access forms that are otherwise difficult to isolate.18 In many ways, pharmaceutical solid solutions bring both challenges and opportunities. Beyond pharmaceuticals, solid solutions have been used in the design of thermosalient crystals as thermal actuators,30 in the design of gas separation systems,31 and in laser manufacturing;32,33 examples are thoroughly described elsewhere.34 Overall, better understanding of the synthesis and behavior of crystalline solid solutions can lead to novel applications in several fields.
Definitions: are dyed crystals solid solutions?
At this point, it is important to clarify what is meant by organic crystalline solid solutions (hereby simply called solid solutions), as different definitions for mixed crystals have been observed in past and recent literature.25,34–37 Recognizing that not all solid solutions are crystalline, in this work, we refer to the following as solid solutions: (1) crystalline systems with two or more components in their lattice, where a main component (“host”) incorporates a guest molecule; (2) the guest's retention is not bound by a fixed stoichiometric ratio, but can incorporate at different levels that can be varied in continuum; (3) their lattice structure and X-ray diffraction (XRD) pattern resemble those of the pure host, aside from gradual small shifts in XRD peaks observed due to the presence of the guest;6,38–40 and (4) incorporation of the guest in the host's lattice has a thermodynamic driving force. In other words, the latter means that miscibility is not limited by growth conditions but can also be achieved by aging pure powders in solution or by e.g. mechanochemistry. Note that this point should not exclude solid solutions formed in metastable host structures, as long as there is a drive for spontaneous guest incorporation in that structure.Within those requirements, one could debate whether crystals with small amounts of entrapped guests qualify as solid solutions, as well as to whether a perfect substitution of a guest molecule in a host's site within the lattice is required to fit within this definition. These are partly supported by the assumption that solid-state miscibility is tied to structural similarity between host and guest;35 as explored in recent work, crystal isomorphicity for host and guest is not a pre-requisite for the formation of solid solutions.41,42 Further distinction can come when we consider not just similarity in crystalline structures, but also in molecular structures. While fitting large guest molecules inside a small-molecule lattice is hindered by significant enthalpic penalties, there is always an entropic gain towards generating a multicomponent lattice.37 Part of what this work is set to visually demonstrate is that most systems can form solid solutions with partial miscibility, and that while structural similarity will define the extent of that entrapment, it is certainly not a pre-requisite for some degree of miscibility. In fact, studies on K2SO4 crystals dyed with acid fuchsin (extremely different systems) revealed that this pair has the characteristics of a solid solution, where the much larger acid fuchsin molecule simply substitutes for multiple sites in the K2SO4 lattice.43 The degree of entrapment is limited, to as low as 1 acid fuchsin molecule for every 1000 unit cells of the salt. Indeed, if the system did not present color, the incorporation of the dye may have been overlooked by most concentration assays. Partial miscibility also happens with seemingly immiscible liquids like water and heptane; everything is miscible to some degree, and the question is where the line is drawn.
Motivation for this study
An important consideration that is often ignored in solid solution studies is the fact that guest retention is anisotropic. For example, guests can preferably interact with specific faces of the growing crystal, sometimes leading to the well-known hourglass inclusions visualized in dyed crystals.44,45 Changes in liquid composition and supersaturation during crystal growth can also lead to varying guest levels between the core and shell of a growing crystal.46 In essence, this implies that a pure host lattice as well as a solid solution can and often coexist in the same crystal. Powder-based studies of solid solutions investigate the average behavior of a large population of crystals with different degrees of entrapment, both between and within crystals. In this context, it is beneficial to take a deep-dive into the behavior of single crystals, ideally those where guests present color, to ensure that powder-based methods are not ignoring critical behaviors and relying on assumptions that would only apply to pure or homogeneous crystals.This work seeks to provide visual evidence of the effect that small amounts of lattice impurities can have on the host's growth and dissolution behaviors. The focus is on mixed crystals that use dyes as the model guests, to better visualize how anisotropic impurity incorporation is tied to anisotropic behaviors within a single crystal. Model systems include the well-known K2SO4–acid fuchsin system reported by Vetter et al.47 and the acetaminophen–curcumin system that we recently reported.48 Beyond those, we are expanding the work with two previously unreported systems: solid solutions of acetaminophen with sulforhodamine B and with acid fuchsin.
The manuscript starts by investigating the incorporation of variable levels of guest within the host crystal, owing to a change in the growth environment as well as surface properties of the crystal including fracture points. Then, the rapid dissolution of the solid solution regions of the crystal is visually demonstrated. This behavior is studied in the context of thermodynamic habit modifications, as well as solubility differences between the pure crystal and the solid solution. The effect of those impurities on the host's melting point are also investigated, together with the ternary equilibrium for a select system. Finally, we discuss the role of lattice impurities enhancing crystal fragility.
Experimental
Materials
Acetaminophen (ACM, >98%) was purchased as a white powder from TCI America. Anhydrous potassium sulfate (K2SO4, >99%) was purchased from VWR chemicals. Three organic dyes were investigated as guests: curcumin (CUR) was purchased as an orange powder from TCI America; sulforhodamine B (SB) was purchased as a purple powder from Biotium; acid fuchsin (AF) was purchased as a dark red powder from Thermo Scientific Chemicals. Note that many of these dyes are used for applications where purity is less important, and it is not often reported by the manufacturer. Based on HPLC analysis, we estimate the purities of CUR, SB, and AF to be >99%, 98%, and 73%, respectively. The molecular structure for all the organic compounds is provided in Fig. 1, showing that they present significant differences in functional groups and molecular size. | ||
| Fig. 1 Molecular structures of the organic model compounds used for this study. ACM is the host molecule, while CUR, SB, and AF are guests. | ||
Growth of single crystals
Single crystal samples were grown via cooling crystallization in sealed 50 mL containers. In a typical experiment, powder mixtures were prepared containing the host, guest, and solvent, and heated until the solids fully dissolved (usually around 40 °C). The solutions were then cooled to 25 °C and aged for one week before harvesting the crystals. All the solutions were prepared to be only slightly supersaturated so that they would remain metastable during cooling to 25 °C, allowing all growth to happen at constant temperature.Acetaminophen–curcumin (ACM–CUR) crystals were grown from ethanol, with starting concentrations of appr. 240 mg ACM per g ethanol (appr. 20% supersaturation at 25 °C). CUR contents were limited by its very low solubility and varied between 0–0.4 mg g−1 ethanol, depending on the sample. Overall, crystals were grown under very small curcumin concentrations, below 0.2 wt% purity (solvent-free basis) in the starting solution.
Acetaminophen–sulforhodamine B (ACM–SB) and acetaminophen–acid fuchsin (ACM–AF) crystals were grown from aqueous solutions, with starting ACM concentrations of appr. 18.6 mg g−1 water. SB and AF concentrations fell within 0–1.9 mg g−1 water, equivalent to 0–10 wt% guest in the starting solution on a solvent-free basis.
The growth of potassium sulfate–acid fuchsin (K2SO4–AF) crystals was conducted following similar fractions of host and guest as those used in Kahr et al.49 Crystal growth was achieved with K2SO4 concentrations of appr. 150 mg g−1 water. AF concentrations fell within 0–3 mg g−1 water, equivalent to 0–2% guest in the starting solution.
Once growth was complete, the mother liquor was decanted, and the single crystals were dried with a paper towel. Samples were not washed to avoid preferential dissolution of impure regions within the crystal. Microscope images of the grown single crystals were obtained using a TOMLOV LCD digital microscope, and the impurity content of representative crystals within a batch was measured via high-performance liquid chromatography (HPLC).
Single crystal dissolution tests
The grown single crystals were suspended in deionized water in a 50 mL beaker with magnetic stirring. To ensure that the crystals remain in place and to prevent breakage or chipping, they were held in the beaker over a stainless-steel mesh (bought as a sink strainer with 12.7 mm diameter and appr. 200 μm mesh size), away from the mixer. Dissolution tests took place at ambient conditions. Pictures of the dissolving crystals were taken at regular intervals using a phone camera.To quantify the relative rates at which the product and impurity leave the crystal, images of the dissolving material were analyzed using the open-source software ImageJ, comparing the relative rates at which the total crystal area and the total dyed area decrease over time. To prevent area measurement errors from inconsistent magnifications, the total length of 4 consecutive mesh gaps was used as a reference to set the image scale. To identify the % of the crystal area that is colored with dye, ImageJ's color threshold function was employed with constant parameters. This function presents some bias in distinguishing the mesh grid from the dyed portions of the crystal, especially when studying the ACM–CUR system. Instead, the most accurate estimations were obtained with SB and AF due to the characteristic color of those guests. Specific settings for color thresholding are provided as ESI† materials, together with examples of analyzed crystals.
Solubility tests
To approximate the maximum solubility boost given to ACM by a particular guest (CUR, SB, or AF), saturated suspensions of each dye were prepared by suspending an excess of the dye in deionized water. After aging for 24 hours at 20 °C, the suspensions were filtered, obtaining saturated solutions for each of the three dyes. Then, excess ACM powder was added to those solutions, and it was left to equilibrate at 20 °C for one week. At the end of this aging period, the mother liquor was filtered through a 0.45 μm syringe filter and analyzed for ACM concentration using HPLC. Solids were collected using centrifugation in Eppendorf tubes with built-in filters, using two successive centrifugation steps to maximize the amount of solution removed. Each experiment was replicated at least three times, and ACM concentrations were averaged to obtain the solubility value.Analysis of ternary equilibrium
Ternary equilibrium data was obtained for the ACM–AF solid solution, following methods described in detail by Nordstrom and co-workers.5,20 Briefly, commercial powders of ACM and AF were ground separately, and then suspended in water at 20 °C, with a total concentration of 250 mg solutes per g water. The exact concentrations for ACM and AF were varied across 15 values between 0% AF and 100% AF (all in mass and solvent-free basis). For example, a sample containing 20% AF would have 200 mg ACM per g water and 50 mg AF per g water. As the solubility of both solutes falls below 250 mg g−1 water, all samples led to suspensions at 20 °C. These suspensions were aged for at least one week under magnetic stirring and temperature control (jacketed bath); here, the previous grinding of the solids is important to maximize contact area between the solids and liquid and facilitate reaching solid-state equilibrium within a reasonable time frame. After the aging period, samples of the liquid phase were collected through a 0.45 μm syringe filter, and solids were collected via centrifugation in Eppendorf tubes with built-in filters. Assays for ACM and AF content were based on HPLC.High-performance liquid chromatography (HPLC)
HPLC analysis was conducted on a ThermoFisher HPLC with a C18 column (4.6 × 250 mm, 5 μm) at a column temperature of 25 °C, pump flow rate of 1.5 mL min−1, injection volume of 10 μL, and a run time of 15 min. The mobile phase consisted of a gradient of methanol/water. The aqueous solvent was adjusted to a pH of 2 with o-phosphoric acid. To maximize signal for the different dyes, we used a DAD UV-vis detector and utilized the visible range wavelengths for the dye impurities. Detection wavelengths for ACM, CUR, SB, and AF were 220 nm, 425 nm, 550 nm, and 550 nm, respectively.Differential scanning calorimetry (DSC)
DSC analysis was conducted on a TA Instruments Discovery 2500. Samples were placed into hermetically sealed Tzero aluminum pans. Thermograms were collected at constant heating rates of 2 °C min−1 for the temperatures of interest.Crystal fracture analysis
Testing was conducted on a TA XT Plus Texture Analyzer equipped with a TA-17 30° stainless steel cone probe. TA settings were as follows: return to start, compression, 0.1 mm s−1 pre-test speed, 0.01 mm s−1 test speed, 0.5 mm s−1 post-test Speed, Force Target Mode, 100 N Force, Auto Trigger, and 0.05 N Trigger Force. Crystals were centered under the cone probe to begin the test. Runs were ended when a sharp decline in the applied force was reported, which was typically preceded by an audible crack.Results & discussion
Dyed crystals
Images of the collected single crystals are provided in Fig. 2, including two different retention levels for each host–guest pair. The retention of the guest molecule is non-stoichiometric, presenting variable levels that are correlated with the starting content of that guest in the growth solution. There is also no visible change in X-ray diffraction pattern, with the acetaminophen crystals corresponding to the monoclinic form. | ||
| Fig. 2 Example images of the grown single crystals, containing ACM and K2SO4 as the main hosts, and CUR, SB, and AF as the investigated guests. From top to bottom, images include the pure host, host with small levels of incorporated guest, and host with a larger level of incorporated guest. | ||
To validate that those guests are incorporated inside the crystal and not adsorbed on the surface, individual samples were cut with a razor blade, confirming that impurity retention is internal. While surface adsorption is conceptually considered a retention mechanism in crystallization literature, none of the grown crystals in this work were clean crystals with an adsorbed layer of impurity.
Guest levels in those crystals are very small and barely detectable using HPLC, even though those impurities have strong absorptions in the visible range. Our best estimate, based on HPLC analysis, is that those are under 300 ppm for all crystals in Fig. 2. Impurities that are retained at these small levels are often ignored during pharmaceutical crystallization development, especially as their content in the final product falls below a threshold provided by regulatory agencies.
Face selectivity & composition anisotropy
K2SO4–AF crystals in Fig. 2 present the typical hourglass-shaped incorporation as reported by Kahr and co-workers.43 Similar behaviors were observed for the ACM solid solutions, including the characteristic hourglass shape observed in some ACM–CUR crystals and ACM–SB crystals. Hourglass-like incorporation for the ACM solid solutions is neither as marked nor as reproducible as for the K2SO4–AF system.The clear face dependence and anisotropic retention behaviors observed for all systems hint some challenges for the study of impurity retention in crystallization: the extent of lattice incorporation of a guest in a growing crystal can't always be accurately predicted through solid-state miscibility, as both kinetics and mass transfer play a role favoring incorporation in specific regions of the crystal. For example, environments that lead to preferential growth of a given face (e.g. via a certain solvent, supersaturation, or a second competing impurity that modifies habit) can lead to preferential incorporation or rejection of a given impurity. In other words, morphology and purity are not independent.
Another important consideration during the growth of crystals from impure solutions is related to crystal fracture. Some degree of crystal breakage (even through crystal chipping) is inevitable in industrial crystallization, owing to collisions between crystals and other surfaces in the stirred tank, including impellers, walls, baffles, probes, etc. Broken crystals will quickly regenerate to repair chipped faces and to recover their preferred crystal habit.50 If that regeneration happens in an impure solution, the deposited layer of solute will be contaminated with that impurity. Fig. 3 shows an example of this phenomenon, for ACM–SB crystals. A fractured ACM crystal that had been grown in the absence of SB was placed in a slightly supersaturated ACM solution containing 0.3 mg mL−1 SB. On equilibration, the fractured areas of the ACM crystal were regenerated with incorporated SB.
 | ||
| Fig. 3 Breakage-driven composition anisotropy for ACM–SB. A fractured ACM crystal repairs in a solution containing SB. An unfractured ACM–SB crystal fully grown in a SB solution is presented for comparison. | ||
Rapid release of impurities during dissolution
A noticeable observation that inspired this work was reported by Wang et al. in 2021.51 In their paper, they studied the lattice incorporation of structurally similar impurities in salicylic acid crystals, and the dissolution behavior of those impure crystals. They observed that impurities were preferentially entrapped early on during crystal growth, generating impure cores surrounded by a pure crystal shell. Upon exposure to an undersaturated solution, the exposed impure cores dissolved first, turning those crystals into hollow tubes.To investigate whether Wang's observations translate to different impure systems, our dyed crystals were suspended in pure water and their dissolution was observed. Fig. 4 shows an example of the dissolution behavior of the ACM–CUR system in water at ambient conditions. Note how the crystal starts presenting an hourglass-like retention for CUR and ends as a pure crystal without visible CUR levels. The guest is fully released from the crystal before the host finishes dissolving.
 | ||
| Fig. 4 Dissolution behavior of an ACM–CUR crystal in water. CUR is present as a yellow impurity in the otherwise colorless ACM crystal. For the last image, the contour of the pure crystal has been highlighted in teal to facilitate visualization. | ||
An interesting fact to highlight is that the solubility of ACM in water is at least 10![[thin space (1/6-em)]](https://www.rsc.org/images/entities/char_2009.gif) 000 times higher than that for CUR, which has negligible solubilities <8 ppm.52 Despite that difference, it was CUR that released first upon exposure to pure water. This behavior may be indicative that the affinity of the impurity for the solvent is not a significant factor driving the preferential dissolution. Instead, we are comparing two types of host lattice: one that is pure, against one that incorporated impurities.
000 times higher than that for CUR, which has negligible solubilities <8 ppm.52 Despite that difference, it was CUR that released first upon exposure to pure water. This behavior may be indicative that the affinity of the impurity for the solvent is not a significant factor driving the preferential dissolution. Instead, we are comparing two types of host lattice: one that is pure, against one that incorporated impurities.
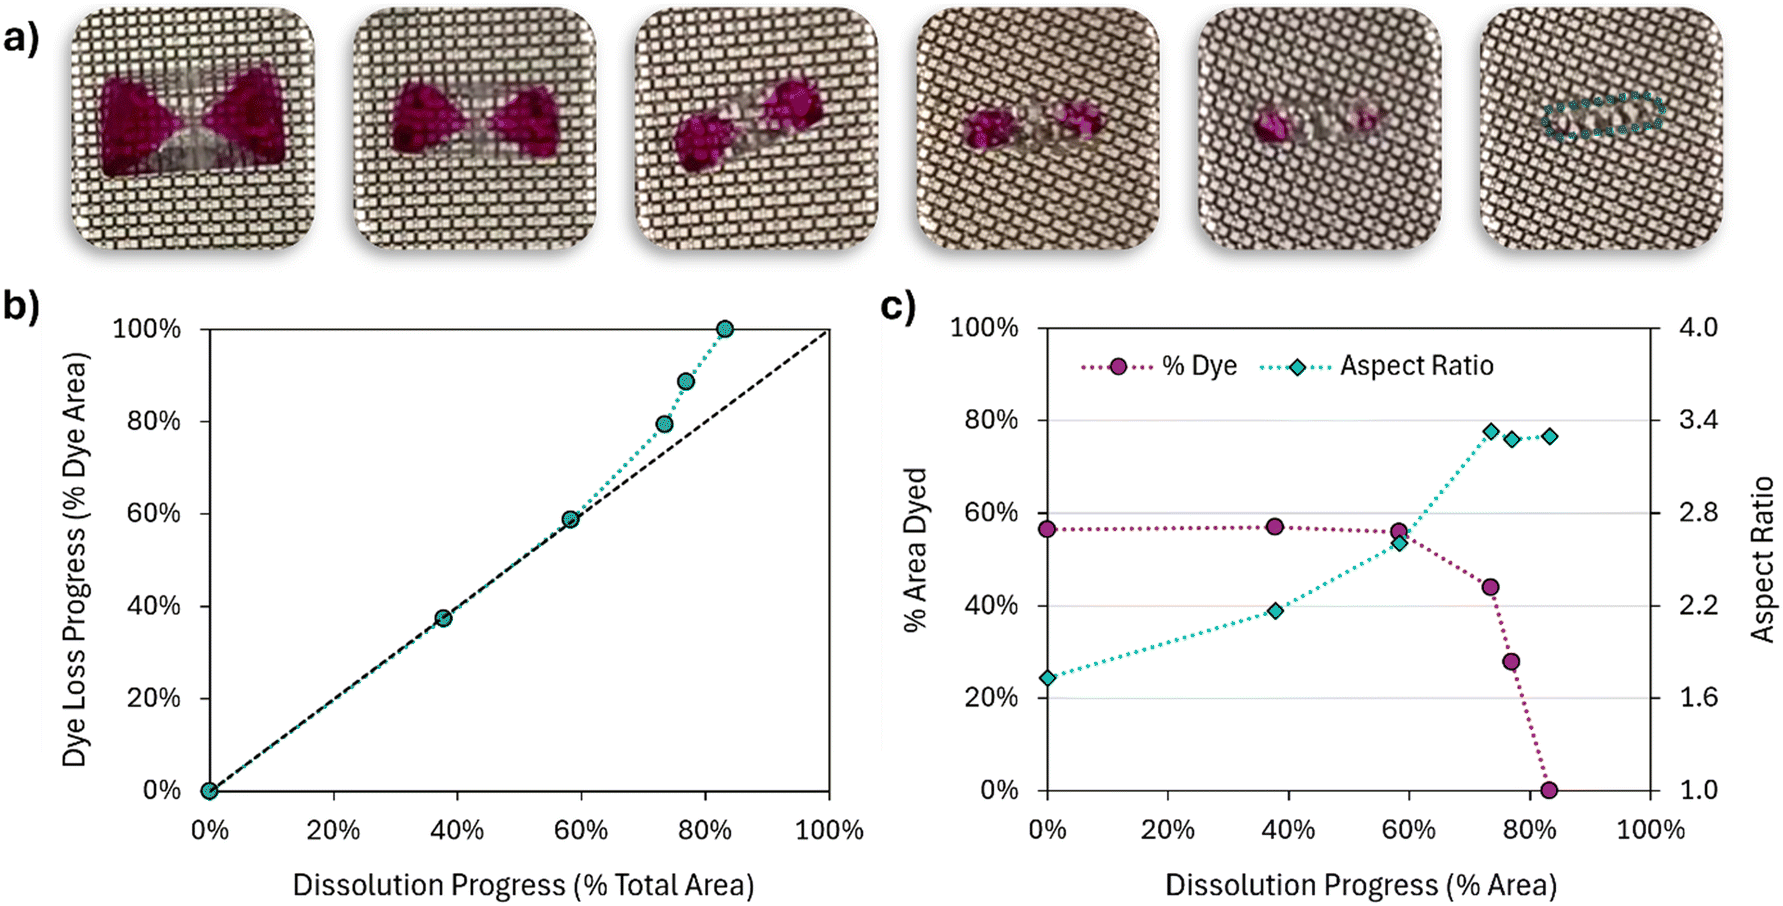
Fig. 5a shows the dissolution behavior of an ACM–SB crystal in water. To discard the possibility that faster dissolution in Fig. 4 is tied to the specific face and not to the presence of the impurity, this sample was selected as a crystal where guest incorporation occurs in a seemingly random manner, without forming an hourglass inclusion. Consistent with Fig. 4, impure regions of the crystal dissolve faster than the pure regions. The only exception is a linear pink layer located at the center of the crystal, which does not significantly change in size until the crystal dissolves enough for it to be exposed to the solvent (last two pictures in Fig. 5a). Then, it quickly dissolves from the crystal. Again, these results suggest that, as long as they are exposed, impure regions of a crystal will present faster dissolution.
 | ||
| Fig. 5 Dissolution of an ACM–SB crystal in water. a) Images at representative points of the dissolution process. In order, those were taken at the start of the experiment, and 1 h, 2 h, 3 h, 4 h, and 5.5 h later. Each image corresponds to a data point in b) and c). For the last image, the contour of the crystal has been highlighted in teal. b) Relationship between the extent of dye loss and the extent of crystal dissolution, estimated from image analysis of the total 2D area of the crystal (x axis) and the stained 2D area (y axis). c) Absolute values of the % of crystal area that is dyed and the aspect ratio of the crystals, at different points of the dissolution process. Aspect ratio is taken as the ratio of the larges and shortest distances between two faces. | ||
Fig. 5b shows the relative dissolution profiles of the crystal and of SB, roughly calculated as the decay from their starting 2D area in the crystal image. Note how appr. 90% of the impurity is released from the crystal by the time the overall sample has only dissolved by 40%. This raises an important issue with current diagnostics for impurity retention mechanisms: existing workflows set to identify impurity retention mechanisms rely on powder dissolution studies, where the impure powder is exposed to increasing amounts of solvent and the release of the impurity is studied as a function of the amount of powder dissolved. Perhaps due to the unintended assumption that lattice incorporation is homogeneous throughout a crystal, a common consideration is to conclude that if the impurity is released early in the dissolution test, it must be that it is adsorbed at the surface of the crystals. The profile in Fig. 5b would be a perfect example of what, in the absence of dye and as a powder-based study, would have been considered as surface-adsorbed impurities by most existing diagnostics. It is perhaps not surprising that the literature in organic solid solutions is not just very small, but also highly disconnected from that on impurity rejection. These results, combined with the fact that surface adsorption alone would be hardly detectable in common pharmaceutical studies,25 provide further evidence that solid solutions may have been misdiagnosed as surface impurities for a long time.
Another view of the dye dissolution kinetics is provided in Fig. 5c, by analysis of the crystal aspect ratio during dissolution. Initially, 80% of the crystal footprint was dyed, and a steep decline is observed in the early stages of dissolution. The shape of this decline is analogous to Fig. 5b, where it is instead expressed as a positive loss in the dye content of the crystal. For this experiment, the crystal aspect ratio (Fig. 5c) is mostly retained throughout the dissolution process, with no significant changes in crystal morphology.
To validate that the dissolution behavior of ACM crystals is generalizable to other well-known systems, the single crystal dissolution experiments were reproduced with K2SO4–AF. Images of the dissolving crystal can be found in Fig. 6a. The behavior agrees with the observations for ACM–CUR, ACM–SB, and Wang's observations with salicylic acid: the sample starts with a significant amount of lattice-incorporated impurity that fully releases before the crystal is completely dissolved.
 | ||
| Fig. 6 Dissolution of a K2SO4–AF crystal in water. a) Images at representative points of the dissolution process. In order, those were taken at the start of the experiment, and 5 min, 10 min, 13 min, 15 min, and 17 min later. Each image corresponds to a data point in b) and c). For the last image, the contour of the crystal has been highlighted in teal. b) Relationship between the extent of dye loss and the extent of crystal dissolution, estimated from image analysis of the total 2D area of the crystal (x axis) and the stained 2D area (y axis). c) Absolute values of the % of crystal area that is dyed and the aspect ratio of the crystals, at different points of the dissolution process. Aspect ratio is taken as the ratio of the larges and shortest distances between two faces. | ||
Where K2SO4–AF differs from ACM–SB is in the trends for dye release. As quantified in Fig. 6b, loss of dye content progresses at the same rate as the overall dissolution of the crystal until the sample is appr. 60% dissolved. It is only in the last three pictures that the dyed area of the crystal meaningfully drops (Fig. 6c), and the trends in Fig. 6b start resembling the shape observed in Fig. 5b. This behavior seems to be paired with a change in aspect ratio during dissolution, from a starting value of appr. 1.7 to a value that plateaus at appr. 3.3. When grown in water, pure K2SO4 crystals presented an aspect ratio of 2.89 ± 0.26 (as mean ± 95% confidence intervals from a batch of appr. 15 crystals). Grown in the presence of 0.3% AF, the aspect ratio reduces to 1.75 ± 0.24. The change in aspect ratio with increasing AF content can also be visualized in Fig. 2, and it is consistent with prior observations by Kahr and co-workers.43,53
While the experiment in Fig. 5 was conducted with an ACM solid solution that presented a nearly identical morphology to a pure ACM crystal grown from water, this was not the case for the K2SO4 dissolution test in Fig. 6. A possible explanation for the trends observed in Fig. 6 could be a change in the most thermodynamically favorable habit when the impure crystal is placed back in pure water (i.e. back in the absence of dissolved AF). Individual faces within a crystal have been shown to present different activities for dissolution and growth (sometimes expressed as different solubilities), owing to different surface free energies in their surrounding environment;54 these activities will be altered by the composition of the surrounding liquid, being through a change in solvent composition or through the presence of an additive or impurity.55 Further research may be needed in this area, as the observed effects are less apparent when crystals are dissolving at near-equilibrium conditions. This will be discussed in more detail in later contributions.
Overall, the rapid release of impurities during drug dissolution brings additional formulation challenges. If, instead of dyes, those were a toxic impurity, it would be quickly released in the gastrointestinal tract following drug administration, leading to a spike in blood concentration for the toxic compound. Even in the scenario where the impurity is not harmful, anisotropic incorporation of a guest in the API's lattice can change its dissolution profile and thus its pharmacokinetic profile. Considering that lattice incorporation is the primary mode of impurity retention in pharmaceutical products,25 this behavior may warrant further investigation in the formulation and pharmacological fields.
Surface poisoning, or change in crystal habit?
When looking at the different aspect ratios for K2SO4 crystals grown from pure solvent and AF solutions (Fig. 2), one may be tempted to conclude that the shorter aspect ratio of the impure crystals is due to growth inhibition around the regions where AF preferentially interacts with the crystal (i.e. the dyed faces). This may be attributed to poisoning of growth sites by the adsorbed AF, allowing the pure faces to grow freely while hindering growth of the faces that end up stained (kinetic inhibition). In contrast, results in Fig. 6 hint at a thermodynamic inhibition through a change in the most favorable crystal habit, driven by the presence of impurity in solution.To further investigate this phenomenon, one can place a K2SO4–AF crystal presenting hourglass inclusions to further grow in a supersaturated K2SO4 solution that contains no AF. If what is observed is a change in crystal habit driven by the liquid composition, the new environment will favor the growth of a longer aspect ratio. Fig. 7 shows an K2SO4–AF crystal that was aged for 48 hours in an aqueous solution containing 112 mg g−1 K2SO4 and no AF. At the aging temperature of 20 °C, the liquid is only slightly supersaturated, allowing for a very slow growth. Note how only the faces containing impurity have grown further. The untainted faces presented negligible growth in comparison. Much like it happened during the dissolution tests in Fig. 6, the crystals tried to change their crystal habit first.
 | ||
| Fig. 7 K2SO4–AF crystal isolated in two successive growth steps: the initial crystal is grown from solutions containing 0.3% AF, generating the hourglass-like AF inclusion; build-up of the pure lattice layer is obtained after 48 hours aging in a supersaturated solution containing no AF. | ||
These results suggest that studies dealing with the inhibition of crystal growth by impurities from a purely kinetic lens (e.g. kinetic surface adsorption models) may need to also account for the effect of dissolved impurities in thermodynamically changing the most stable morphology.
Effect of impurities on solubility & melting point
The observed rapid release of lattice impurities during host dissolution could be attributed to a higher solubility presented by the impure lattice. In partial solid solutions, we expect a gradual increase in solubility with the amount of impurity retained in the lattice, which is at the same time dependent on the total amount of impurity present in the system.5,7 The thermodynamic basis for this behavior can be seen from a ternary phase diagram (ESI† materials), and it is explained in more detail in prior publications.25,48,56 As the impurity content in solution increases, the system eventually reaches an invariant point, where both the product and impurity have constant concentrations in the liquid, owing to their respective solubilities. At this point, we have reached the maximum level of lattice guest incorporation for that solvent: to incorporate more impurities in the host's lattice, we would need to reach higher impurity contents in the liquid; however, that is no longer possible under equilibrium conditions as the impurity is saturated in the liquid and any excess powder simply remains suspended.As shown in Fig. 8, the investigated dyes do have a solubility-boosting effect for ACM, reaching values as high as an 80% solubility increase in the presence of AF. The solubility increase for SB was 55%, while the effect of CUR was not significant. Especially as we account for the very small dye contents in those crystals, these enhancements are generally higher than those found for structurally similar impurities,4,6,7 potentially owing to the significant lattice distortion that the large guest molecule can exert on the ACM lattice.
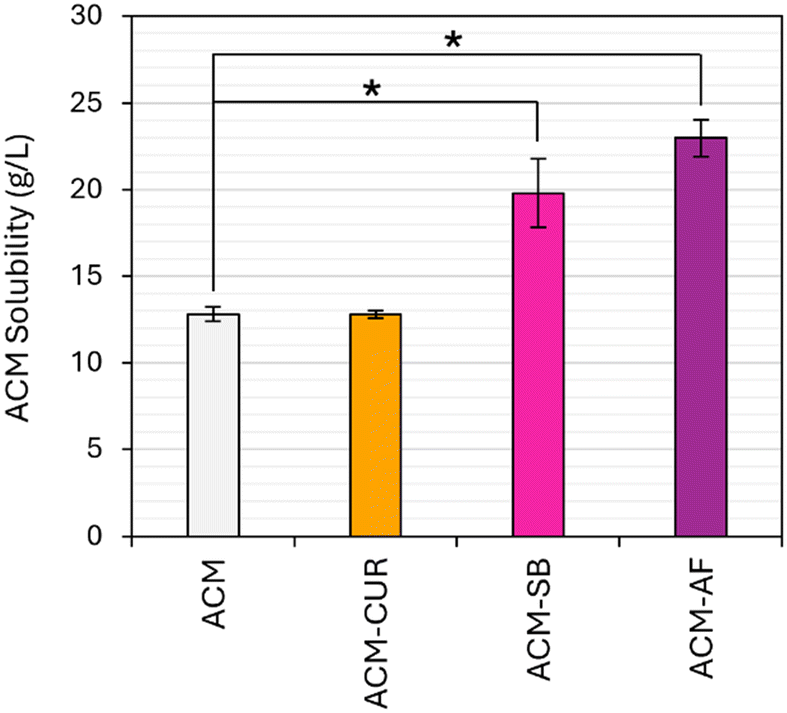 | ||
| Fig. 8 ACM solubility at 20 °C, in saturated aqueous solutions for CUR, SB, and AF. Error bars correspond to the 95% confidence intervals from triplicate samples. Samples connected by * indicate statistical difference based on a two-tailed t-test at 95% confidence. | ||
The fact that ACM–CUR didn't show a significant change in solubility, despite the observations in Fig. 4, hints that a higher solubility may not be the primary reason behind the faster dissolution kinetics observed in impure lattice regions. Here, it is important to note that the solubilities in Fig. 8 are in saturated solutions of the corresponding dye. AF contents in those solutions were at the order of 150 g L−1, and SB contents were at the order of 20 g L−1. Meanwhile, CUR has a negligible solubility in water,52 making it much less readily available than the other two guests. There is a possibility that the observed solubility increases are partly because of the role that the dissolved dye plays changing the liquid solution's properties, and not solely due to their effect as a lattice-incorporated guest. These two contributions are difficult to decouple, as impurity concentrations in the liquid and in the solids are correlated via the ternary equilibrium, and trying to measure the solubility of the impure crystal on a pure solvent will lead to a change in solid purity via preferential impurity dissolution (Fig. 4 to 6).
An alternative study would involve investigating the effects of those dyes on lattice distortion beyond solubility, by measuring a change in melting point through DSC analysis. The solubility of organic crystals is tightly related to their melting point via the ideal solubility expression,57 with crystal forms that present higher solubilities also presenting lower melting points. Ultimately, that melting point is an expression of how much that lattice wants to remain in the solid state. Fig. 9 shows DSC thermograms for ACM–CUR and ACM–AF, grown at variable dye concentrations from 0% to saturation (appr. 0.2%) for CUR, and from 0% to 10% for AF. These are plotted together with rough estimates of the crystal lattice purity, obtained by HPLC analysis of single crystals grown at the same conditions. Note that ACM–CUR was grown from ethanol, despite the fact that Fig. 8 solubilities are in water. Growing single crystals of ACM–CUR using water as the solvent extremely limits the amount of CUR that can incorporate in the lattice; thus, results in Fig. 9 are a more extreme scenario that allows us to have comparative levels of guest entrapment for both ACM–AF and ACM–CUR.
 | ||
| Fig. 9 DSC thermograms for pure ACM, and for its solid solutions with CUR and AF, including approximate lattice contents for the corresponding dye. | ||
Results in Fig. 9 are consistent with the solubility observations in Fig. 8: the ACM–CUR system presents little changes in both melting point and solubility, even when it incorporates at similar levels than the other dyes. These results seem to disagree with the faster dissolution observed in Fig. 3, which may indicate that this behavior can't be explained solely by a larger solubility in the dyed regions of the crystal. A potential explanation may be found in the ternary equilibrium between the host, guest, and solvent. ACM–CUR crystals were grown in solutions that contained CUR near its saturation point, and the extent of lattice incorporation for CUR was correlated with its content in solution. There is a direct equilibrium between the CUR content in the liquid and the CUR content in the solid's lattice. When the impure crystals were placed back in pure water, they found a liquid that contains no CUR. In this context, one would expect a thermodynamic driving force towards the preferential dissolution of CUR into this liquid, at-tempting to establish a new equilibrium between the CUR contents in the liquid and solid states.
For ACM–AF, crystals grown with 10% AF in solution present a drop of melting point of appr. 10 °C (if we take it as the onset of melting), despite being 99.98% pure and containing just 0.02% of the dye in their lattice. Again, these large effects may be explained by a significant lattice distortion caused by the large AF molecules. Similar and larger drops in melting point have been observed in solid solutions,58 but to our knowledge, not for ppm-levels of guest incorporation.
Ternary equilibrium for the ACM–AF system
A common method to investigate the relationship between lattice impurity content and solubility enhancements involves building solvent-free solid–liquid equilibrium diagrams, by suspending known amounts of pure host and guest in the desired solvent, aging them until they reach solid-state equilibrium, and then analyzing the solids purity as well as the saturated liquid composition. Accurate measurements of the powder purity require an efficient separation of those solids from the surrounding liquid, typically achieved via centrifugation. For those experiments, washing the solids is ill-advised, as it may lead to preferential dissolution of impurities as shown in Fig. 4–6. Instead, one can quantify the loss on drying (solvent content) of the centrifuged solids and use it in a mass balance in combination with the known impurity concentration in the liquid. This allows to separate how much of the solids' impurity content is lattice-incorporated, from how much comes from the surrounding liquid.Similar methods have been successfully implemented for multiple systems, notably solid solutions of salicylic acid,7,19,20,59 where impurity lattice contents are at the order of 1–10% and their contents in the saturated liquid are at the order of 10 g kg−1 (1%). However, it was not possible to achieve a similar resolution for the dyed crystals investigated in this work. Note that the impurity levels in our solids are at the order of 100 ppm (0.01%), while the liquid contains concentrations that can be as high as 160 g kg−1 (16%) for AF. Even if we managed to isolate powders that are e.g. 99% dry, that 1% liquid would be 16% impurity, making the wet powder contain 0.16% impurity only from the surrounding liquid. In this context, estimating changes in lattice content at the 0.01% level comes with too much error. Instead, we built our diagram as a function of the total impurity content in the starting solution, knowing that the content in the solids is proportional to it. With the knowledge that solid-state miscibility is very limited, one can build an approximate ternary phase diagram for the system, based on the data from Fig. 10 that is set as a 2D cut of the ternary equilibrium at a solvent composition of 20%. This is covered in more detail in the ESI† materials.
 | ||
| Fig. 10 Solvent-free ternary equilibrium diagram for ACM and AF in water, built with a constant total concentration of 250 mg per g solvent. The x axis represents the total, solvent-free AF content in the starting sample, and the y axis represents concentrations in the equilibrated liquid. α and β correspond to the ACM–AF and AF-ACM solid solutions, respectively. Continuous lines should not be treated as regression fits. Their function is to facilitate readability of the general trends and regions expected in this type of diagram. | ||
Fig. 10 presents the three major regions expected in this type of diagram: (1) an α region, where only the ACM lattice can be found in suspension and AF is undersaturated; here, the liquid ACM concentration corresponds to its solubility, (2) an α + β region, corresponding to the invariant point in the ternary phase diagram, where both ACM and AF can be found as co-existing precipitates; this region presents the highest AF lattice entrapment and solubility enhancement, and (3) a β region, where ACM is fully dissolved and only AF is present as a suspended solid (with lattice-incorporated ACM). Here, the terms α and β are used to refer to solid solutions rather than pure compounds.
This diagram shows how the observed effects on solubility are directly proportional to the AF content in the sample, following the same trends seen in other organic solid solutions with structurally similar impurities.7,19,20,59 Note that these results were not obtained by crystal growth, but by suspending pure ACM powder in solution and letting AF slowly incorporate in the lattice: there is a thermodynamic driving force for the AF incorporation. The fact that both retention and solubility effects can be varied in continuum, and that they can be accessed not just by growth but also by aging saturated suspensions, shows that this system is a thermodynamically driven solid solution, despite the structural dissimilarity between host and guest, and despite the limited extent of incorporation.
While a study of the AF-ACM system was not the main focus of this work, note that solubility enhancements are also observed for the AF system in the presence of ACM (90–100% AF region in Fig. 10). The appr. 14% enhancement in solubility in β is much smaller than the appr. 80% enhancement observed for α. Potential explanations for this difference could rely on different lattice distortions expected when fitting a large molecule in a small molecule's lattice, compared to fitting a small molecule in a large molecule's lattice. Alternatively, this could also be related to the accessible ACM contents in solution, which are an order of magnitude smaller than those for AF due to their very different solubilities.
While results in Fig. 10 are based on total AF content and not lattice content, the two can be paired through analysis of single crystals. This method is preferred due to the aforementioned challenges with quantifying lattice AF contents in powders; by growing single crystals instead, they can be manually dried with a paper towel, and average purities can be obtained by analyzing several crystals within each batch. Fig. 11 shows how different levels of AF in the starting solution translate to different degrees of lattice incorporation for the ACM–AF solid solution.
 | ||
| Fig. 11 Relation between starting AF content in solution and its entrapment in the ACM lattice during crystal growth. Error bars correspond to 95% confidence intervals for the analysis of multiple crystals within the same batch. | ||
It is important to put Fig. 11 in context with the observations in Fig. 9 and 10. AF can incorporate into ACM lattices until the invariant point is reached at appr. 78% AF content in the starting liquid. In that scenario, we observe an 80% increase in ACM solubility from 12.8 g L−1 to 23.0 g L−1. However, the entrapment at 200 ppm levels and the accompanying drop in melting point (Fig. 9) happen at AF contents of just 10% in the starting solution, for which the ACM solubility has only increased by 8.5%, from 12.8 g L−1 to 13.9 g L−1 (Fig. 10). The change in melting point by almost 10 °C is not the worst-case scenario, and an 80% solubility increase would require AF contents beyond 200 ppm. Exact values are difficult to measure, as it was not possible to grow large single crystals with defined faces for ACM–AF from solutions with starting AF contents above 10%. This is discussed in more detail below.
Impurity effects on crystal fragility
Fig. 12 shows examples of ACM–AF crystals grown from solutions containing different amounts of AF (from 1% to 10%). Samples grown below 5% AF present clean faces and a morphology that is characteristic of the pure monoclinic ACM. At 5% AF, a given batch would contain a mixture of crystals with defined facets, and crystals that start looking like conglomerates as shown in Fig. 12. Beyond 5% AF, crystals were few (owing to the increased solubility), generally small, and very fragile to the touch. | ||
| Fig. 12 Force required to break single crystals of ACM–AF, as a function of their AF lattice content. All samples came from batches containing starting AF contents between 1 wt% and 10 wt% (solvent-free). Images of representative crystals are provided for each batch. | ||
To quantify this fragility, single crystals from each batch were subjected to fracture testing, using pure ACM crystals grown with the same procedure as the blank sample. As shown in Fig. 12, ACM–AF crystals containing more than 50 ppm of AF in their lattice presented significantly higher fragilities than those grown pure or with small amounts of incorporated AF. In some cases, the average force of fracture was reduced by nearly an order of magnitude.
This behavior is not unique to ACM–AF either: incorporating AF into K2SO4 crystals also leads to a loss of morphology and increased fragility. Fig. 13 shows images of different batches of K2SO4–AF crystals, grown with variable levels of AF. The characteristic hourglass inclusions are typically obtained for samples grown with AF contents between 0.1% and 0.5%, albeit with different dye intensities. As the AF content increases, however, there is a loss on the overall composition anisotropy, followed by a loss of defined faces and an increase in fragility. Similar results have been found in recent literature, including the growth of benzamide crystals in the presence of additives, some of which also form solid solutions.12
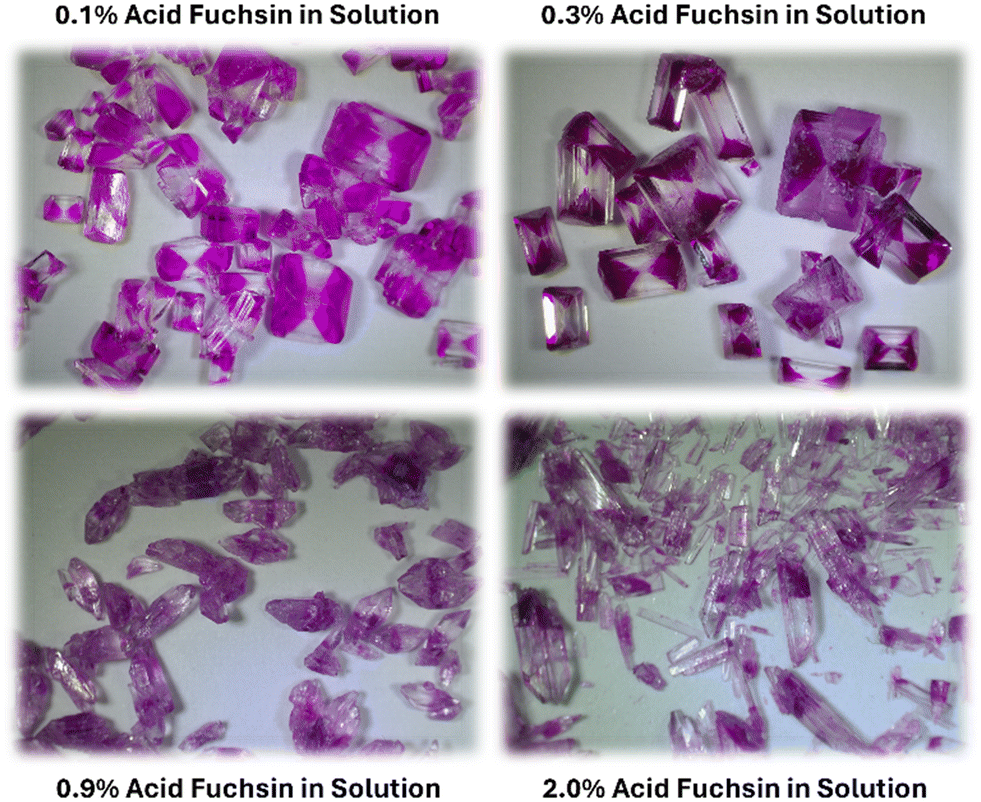 | ||
| Fig. 13 K2SO4 crystals grown under different starting contents for AF. Percentages are given as wt% on a solvent-free basis, as the amount of AF relative to the amount of K2SO4 in the starting solution. | ||
In industrial crystallization, the presence of certain impurities often prevents the growth of large crystals. This is most commonly attributed to an inhibition of crystal growth kinetics by those impurities. Whether that inhibition is purely through poisoning of growth sites, or also affected by a change in solubility, is likely system dependent. Results from Fig. 12 and 13 also bring a new factor: powders presenting small particle sizes can also be explained via breakage of fragile crystals, especially for crystal growth experiments in stirred tanks. This phenomenon may of course be limited by the fact that powders from crystallization processes generally contain crystals of a much smaller size, that do not tend to collide with impellers/walls and break as easily as larger crystals would.
For preparative growth of single crystals, results from Fig. 12 and 13 may partially explain why certain systems are difficult to grow to a large crystal size. As APIs become larger molecules with more complex crystalline structures, understanding the role of impurity entrapment (including solvents) on crystal growth may be critical to meet the required crystal quality attributes in future drug substances.
Finally, note that APIs isolated by crystallization are typically analyzed to make sure that they meet particle size specifications for formulation and for a target dissolution rate. Following this analysis, they are sent to formulation, where the powders are often compressed into tablets. An increase in crystal fragility, owing to a spike in impurity content in a given batch, could lead to API breakage during tablet compression, affecting the particle size of the formulated product, and thus its dissolution profile. This is, again, another phenomenon worth investigating in more detail.
Conclusions
Crystalline solid solutions offer both challenges and opportunities in pharmaceutical manufacturing: from the accidental incorporation of impurities in growing crystals, to the use of additives to control dissolution and polymorphism. However, studies involving multicomponent crystals are often based on powders or on single crystals with colorless impurities, for which composition anisotropy is difficult to assess.This work leveraged the use of dyes as model impurities to investigate how anisotropic guest incorporation translates into anisotropic growth and dissolution behaviors. The faster dissolution observed for impure lattice regions across all systems hints at challenges misdiagnosing solid solutions as surface impurities in current powder-based dissolution tests. Moreover, we have shown how habit modifications can prevail over the tendency of the crystal to reject the guest from its lattice. This role of dissolved impurities on modifying crystal habit has been exploited to generate crystals with unique impurity gradients. We have also provided further evidence that the behavior of dyed crystals matches that expected for solid solutions, despite the lack of structural similarity between host and guest and the very limited extent of lattice incorporation. The solubility boosts observed at ppm-levels of impurity also show potential for the use of large, structurally dissimilar guests to increase solubilities of poorly soluble drugs. Finally, we have visualized the role that small amounts of impurities can play on crystal fragility and on preventing the growth of single crystals with defined faces, which has implications in both preparative crystal growth and in drug formulations.
Overall, this work aimed to provide visual, thought-provoking evidence of the intricacies that solid solutions with composition anisotropy bring to the study of crystalline powders, together with a summary of parallel examples found in literature for solid solutions of structurally similar compounds and colorless hosts. As a purification process, crystallization inherently deals with systems that contain multiple solutes. Despite this fact, the study of solid solutions is still in its infancy. Further research into these behaviors will lead to the development of novel diagnostics for impurity retention, new methods to reject process impurities from crystallized products, as well as new crystal engineering strategies that leverage the untapped potential offered by a non-stoichiometric, anisotropic guest incorporation.
Data availability
All data generated and analyzed in this study are included in the article and its ESI.† Additional images and analysis files can be provided through reasonable request to the corresponding author.Author contributions
A. N.: investigation, formal analysis, validation, writing – review & editing; C. S.: investigation, methodology, formal analysis, writing – review & editing; A. M.: investigation, writing – review & editing; M. P.: investigation, writing – review & editing; F. L. N.: conceptualization, funding acquisition, methodology, supervision, writing – review & editing; G. C.: conceptualization, funding acquisition, methodology, project administration, supervision, visualization, writing – original draft.Conflicts of interest
There are no conflicts to declare.Acknowledgements
This work was supported by the US National Science Foundation (NSF) Engineering Research Initiation (ERI) program through Award No. CBET-2301629, and by the NSF Faculty Early Career Development program (CAREER) through Award No. DMR-2339644. Additional financial support by Boehringer-Ingelheim pharmaceuticals is also gratefully acknowledged. Dr. Shubhajit Paul at Boehringer Ingelheim is acknowledged for his support with the crystal fracture testing.Notes and references
- C. Armstrong, Y. Miyai, A. Formosa, D. Thomas, E. Chen, T. Hart, V. Schultz, B. K. Desai, A. Y. Cai, A. Almasy, K. Jensen, L. Rogers and T. Roper, Org. Process Res. Dev., 2021, 25, 1524–1533 CrossRef.
- G. Capellades, H. Wiemeyer and A. S. Myerson, Cryst. Growth Des., 2019, 19, 4008–4018 CrossRef.
- M. Skouri, B. Lorber, R. Giegé, J. P. Munch and J. S. Candau, J. Cryst. Growth, 1995, 152, 209–220 CrossRef.
- F. L. Nordstrom, M. Paolello, N. Yao, T. Armiger, Q. Jiang, J. Nicholson, J. Kratz, M. Toresco, A. Lipp, S. Witte, M. Henry, C. S. Shultz, E. Sirota and G. Capellades, Org. Process Res. Dev., 2024, 28, 388–403 CrossRef.
- S. S. Mohajerani, F. Ricci and F. L. Nordstrom, CrystEngComm, 2023, 25, 2607–2617 RSC.
- N. Taratin, H. Lorenz, D. Binev, A. Seidel-Morgenstern and E. Kotelnikova, Cryst. Growth Des., 2015, 15, 137–144 CrossRef CAS.
- Y. Wang, F. Ricci, B. Linehan and F. L. Nordstrom, Phys. Chem. Chem. Phys., 2024, 26, 3069–3080 RSC.
- S. Dobberschütz, M. R. Nielsen, K. K. Sand, R. Civioc, N. Bovet, S. L. S. Stipp and M. P. Andersson, Nat. Commun., 2018, 9, 1–6 CrossRef.
- R. J. Davey, J. Cryst. Growth, 1976, 34, 109–119 CrossRef CAS.
- R. Darkins, A. Broad, D. M. Duffy and I. J. Ford, J. Cryst. Growth, 2022, 598, 126878 CrossRef CAS.
- N. Kubota, Cryst. Res. Technol., 2001, 36, 749–769 CrossRef CAS.
- C. A. Offiler, C. P. Fonte, W. Kras, P. Neoptolemou, R. J. Davey, T. Vetter and A. J. Cruz-Cabeza, Cryst. Growth Des., 2022, 22, 6248–6261 CrossRef CAS.
- Z. Berkovitch-Yellin, L. Addadi, M. Idelson, M. Lahav and L. Leiserowitz, Angew. Chem., Int. Ed. Engl., 1982, 21, 1336–1345 CrossRef.
- A. G. Shtukenberg, M. D. Ward and B. Kahr, Chem. Rev., 2017, 117, 14042–14090 CrossRef CAS PubMed.
- A. Borsos, A. Majumder and Z. K. Nagy, Cryst. Growth Des., 2016, 16, 555–568 CrossRef CAS.
- M. Azad, G. Capellades, A. B. Wang, D. M. Klee, G. Hammersmith, K. Rapp, D. Brancazio and A. S. Myerson, AAPS PharmSciTech, 2021, 22, 98 CrossRef CAS PubMed.
- M. A. Lovette and M. F. Doherty, Cryst. Growth Des., 2013, 13, 3341–3352 CrossRef CAS.
- W. Kras, A. Carletta, R. Montis, R. A. Sullivan and A. J. Cruz-Cabeza, Commun. Chem., 2021, 4, 1–7 CrossRef.
- S. S. Mohajerani, M. Paolello, B. Linehan, F. Ricci, G. Capellades and F. L. Nordstrom, Cryst. Growth Des., 2024, 24, 4847–4861 CrossRef CAS.
- M. Paolello, S. S. Mohajerani, B. Linehan, F. Ricci, G. Capellades and F. L. Nordstrom, Cryst. Growth Des., 2024, 24, 2188–2201 CrossRef CAS.
- P. Sacchi, S. E. Wright, P. Neoptolemou, G. I. Lampronti, A. K. Rajagopalan, W. Kras, C. L. Evans, P. Hodgkinson and A. J. Cruz-Cabeza, Proc. Natl. Acad. Sci. U. S. A., 2024, 121, e2319127121 CrossRef CAS PubMed.
- G. Capellades, J. O. Bonsu and A. S. Myerson, CrystEngComm, 2022, 24, 1989–2001 RSC.
- S. J. Urwin, G. Levilain, I. Marziano, J. M. Merritt, I. Houson and J. H. Ter Horst, Org. Process Res. Dev., 2020, 24, 1443–1456 CrossRef.
- P. Agrawal, S. H. Rawal, V. R. Reddy, S. K. Viswanath and J. M. Merritt, Org. Process Res. Dev., 2023, 27, 610–626 CrossRef.
- F. L. Nordstrom, E. Sirota, C. Hartmanshenn, T. T. Kwok, M. Paolello, H. Li, V. Abeyta, T. Bramante, E. Madrigal, T. Behre and G. Capellades, Org. Process Res. Dev., 2023, 27, 723–741 CrossRef.
- E. Spoletti, V. Verma, C. Cappuccino and M. Lusi, Chem. Commun., 2023, 59, 14321–14324 RSC.
- C. Cappuccino, E. Spoletti, F. Renni, E. Muntoni, J. Keiser, D. Voinovich, B. Perissutti and M. Lusi, Mol. Pharmaceutics, 2023, 20, 2009–2016 CrossRef.
- A. H. Goldberg, M. Gibaldi and J. L. Kanig, J. Pharm. Sci., 1966, 55, 482–487 CrossRef.
- A. H. Goldberg, M. Gibaldi, J. L. Kanig and M. Mayersohn, J. Pharm. Sci., 1966, 55, 581–583 CrossRef.
- E. Nauha, P. Naumov and M. Lusi, CrystEngComm, 2016, 18, 4699–4703 RSC.
- E. Batisai, M. Lusi, T. Jacobs and L. J. Barbour, Chem. Commun., 2012, 48, 12171–12173 RSC.
- G. Babu Rao, P. Rajesh and P. Ramasamy, Appl. Phys. A: Mater. Sci. Process., 2016, 122, 1–8 CrossRef.
- M. Rifani, Y.-Y. Yin, D. S. Elliott, M. J. Jay, S.-H. Jang, M. P. Kelley, L. Bastin and B. Kahr, J. Am. Chem. Soc., 1995, 117, 7572–7573 CrossRef.
- M. Lusi, Cryst. Growth Des., 2018, 18, 3704–3712 CrossRef.
- A. I. Kitaigorodsky, Mixed Crystals, Springer, Heidelberg, 1984, vol. 33 Search PubMed.
- M. Lusi, CrystEngComm, 2018, 20, 7042–7052 RSC.
- A. Hill, W. Kras, F. Theodosiou, M. Wanat, D. Lee and A. J. Cruz-Cabeza, J. Am. Chem. Soc., 2023, 145, 20562–20577 CrossRef.
- M. Sadeghi, V. Tenberg, S. Münzberg, H. Lorenz and A. Seidel-Morgenstern, J. Mol. Liq., 2021, 340, 117315 CrossRef.
- V. Tenberg, M. Hokmabadi, A. Seidel-Morgenstern, H. Lorenz and M. Sadeghi, Ind. Eng. Chem. Res., 2023, 62, 753–761 CrossRef.
- E. Kotelnikova, R. Sadovnichii, L. Kryuchkova and H. Lorenz, Crystals, 2020, 10, 618 CrossRef.
- E. Schur, E. Nauha, M. Lusi and J. Bernstein, Chem. – Eur. J., 2015, 21, 1735–1742 CrossRef.
- A. J. Cruz-Cabeza, M. Lestari and M. Lusi, Cryst. Growth Des., 2018, 18, 855–863 CrossRef.
- W. M. Vetter, H. Totsuka, M. Dudley and B. Kahr, J. Cryst. Growth, 2002, 241, 498–506 CrossRef.
- B. Kahr and R. W. Gurney, Chem. Rev., 2001, 101, 893–951 CrossRef PubMed.
- B. Kahr and A. G. Shtukenberg, CrystEngComm, 2016, 18, 8988–8998 RSC.
- R. Teerakapibal, H. Li, B. Linehan and F. L. Nordstrom, Cryst. Growth Des., 2020, 20, 1716–1728 CrossRef.
- M. P. Kelley, B. Janssens, B. Kahr and W. M. Vetter, J. Am. Chem. Soc., 1994, 116, 5519–5520 CrossRef.
- F. L. Nordstrom, M. Paolello, N. Yao, T. Armiger, Q. Jiang, J. Nicholson, J. Kratz, M. Toresco, A. Lipp, S. Witte, M. Henry, C. S. Shultz, E. Sirota and G. Capellades, Org. Process Res. Dev., 2024, 28, 367–387 CrossRef.
- B. Kahr, J. K. Chow and M. L. Peterson, J. Chem. Educ., 1994, 71, 584–586 CrossRef.
- I. Bade, V. Verma, I. Rosbottom and J. Y. Y. Heng, Mater. Horiz., 2023, 10, 1425–1430 RSC.
- Y. Wang, H. Li, M. Raikes, B. Linehan, J. Robson and F. L. Nordstrom, Cryst. Growth Des., 2021, 21, 4100–4110 CrossRef.
- K. Suresh and A. Nangia, CrystEngComm, 2018, 20, 3277–3296 RSC.
- L. D. Bastin and B. Kahr, Tetrahedron, 2000, 56, 6633–6643 CrossRef.
- M. Saska and A. S. Myerson, AIChE J., 1987, 33, 848–852 CrossRef.
- D. Winn and M. F. Doherty, AIChE J., 2000, 46, 1348–1367 CrossRef.
- V. Tenberg, M. Sadeghi, A. Seidel-Morgenstern and H. Lorenz, Sep. Purif. Technol., 2022, 283, 120169 CrossRef CAS.
- A. S. Myerson, D. Edemir and A. Y. Lee, Handbook of Industrial Crystallization, Cambridge University Press, 2019 Search PubMed.
- Z. Zhang, L. Zhou, C. Xie, M. Zhang, B. Hou, H. Hao, L. Zhou, Y. Bao, Z. Wang and Q. Yin, J. Mol. Liq., 2020, 309, 112646 CrossRef CAS.
- F. L. Nordstrom, S. S. Mohajerani, B. Linehan and F. Ricci, Phys. Chem. Chem. Phys., 2022, 24, 26485–26498 RSC.
Footnote |
| † Electronic supplementary information (ESI) available: Image thresholding settings, overlay of dissolving crystals, phase diagram for ACM–AF. See DOI: https://doi.org/10.1039/d4ce00742e |
| This journal is © The Royal Society of Chemistry 2024 |