 Open Access Article
Inverse kinetic isotope effect of ammonia decomposition over Ru/CeO2 using deuterated ammonia†
Takuya
Suguro
,
Fuminao
Kishimoto
 *,
Sota
Kuramoto
,
William J.
Movick
and
Kazuhiro
Takanabe
 *
*
Department of Chemical System Engineering, School of Engineering, The University of Tokyo, 7-3-1 Hongo, Bunkyo-ku, Tokyo, Japan. E-mail: kfuminao@chemsys.t.u-tokyo.ac.jp; takanabe@chemsys.t.u-tokyo.ac.jp
First published on 5th July 2024
Abstract
This study investigated the ammonia decomposition mechanism over Ru/CeO2. Isotopic tests using ND3 revealed that the rate-determining step involves adsorbed nitrogen atoms on Ru. Moreover, an inverse kinetic isotope effect where ND3 decomposition was faster than NH3 was clearly observed. The origin of the inverse effect was explained by the lower D coverage on the catalyst surface compared to H coverage for mitigating the inhibition of ND3 activation.
Green hydrogen (H2) generated using renewable energy is attracting attention as a next-generation fuel that could replace fossil fuels.1–4 Studies have been examining the chemical conversion of H2 into the form of a hydrogen carrier, such as ammonia (NH3), which is easily liquefied, transported, and stored. A supply chain is envisioned in which green H2 is produced using renewable energy, chemically converted to NH3, and then transported to urban areas for use as fuel. When NH3 is used as a fuel, there are two possible cases: N2 and H2O production by direct transformation of NH3 and NH3 decomposition reaction to extract pure hydrogen and then using that as a fuel. Thanks to recent research on combustion equipment development, NH3 combustion engines with reduced NOx emissions are being realized.5 On the other hand, the NH3 decomposition process leads to pure H2, which can be widely used for conventional fuel cells or as chemical feedstocks.
NH3 can be decomposed using various metals.6–11 Ru shows outstanding performance for NH3 decomposition under high NH3 concentrations and shows optimal dissociative N2 adsorption energy.8–12 The various types of support materials were investigated for enhancing the NH3 decomposition performance over the Ru catalyst, e.g. CeO210,11 (with PrOx13), MgAl2O4,14 Al2O3,15 carbon nanotubes,16–18 carbon nanofiber,19 SiC,20 C12A7:e− (ref. 21), and MgO8,9 with various exposed crystal facets.22
The differences in ammonia decomposition kinetics in terms of the exposed facets of Ru23–25 have been investigated. Egawa et al. demonstrated NH3 and ND3 isotope tests at ultra-low ammonia pressure (∼10−5 kPa) over single-crystal surfaces of Ru (1110) and Ru (001), which showed the normal kinetic isotope effect (NH3 decomposition occurred faster than ND3 decomposition).23 The rate-determining step was N–H bond cleavage under such low ammonia pressure conditions. Tsai et al. demonstrated a temperature dependence of the reaction rate of Ru (0001) and showed that the associative desorption of N2 was the rate-determining step below 377 °C. The rate-determining step changed to cleavage of the N–H bonding at higher temperature.24 A study using density functional theory predicted that the formation of the molecular nitrogen would be the rate-determining step with Ru (0001) and Ru (111).25 The Temkin–Pyzhev model is widely accepted to express the ammonia decomposition kinetics and assumes that associative N2 desorption step is the rate-determining step.15,26 This model fits well with conditions where reaction inhibition by hydrogen is observed at low temperatures or high pressures.27 However, several other models of reaction kinetics show different rate-determining steps.28–30 Armenise et al. reported a microkinetic analysis of ammonia decomposition with a Langmuir–Hinshelwood approach and modeled the reaction to predict an integral reactor by assuming the rate-determining step to be N2 desorption and strong hydrogen and ammonia adsorption.31
Although isotope experiments are a powerful tool for examining rate-determining steps, to our best knowledge, there are hardly any reports on isotope tests in the pressure range where reaction inhibition by adsorbed molecules is observed. Antunes et al. demonstrated the normal kinetic isotope effect over supported Ru/Al2O3 at an ammonia partial pressure of 1.5 Pa.32 However, different ammonia partial pressures should result in different catalyst surface coverage and thus different kinetics.12
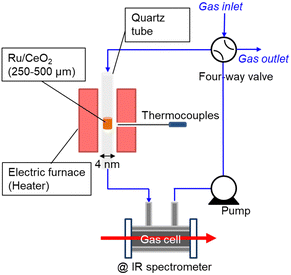
Therefore, this paper reports the kinetic isotope effect of ammonia decomposition reaction using ND3 at 1 kPa over Ru/CeO2 (TEM image is shown in Fig. S1, ESI†). Fig. 1 shows the experimental setup used for NH3 decomposition. The catalyst bed was placed in a quartz tube with an internal diameter of 4 mm and heated with an electric furnace. The temperature of the cylindrical catalyst bed was measured using a thermocouple located outside the quartz tube at the catalyst bed. The catalytic reaction was performed with a closed circulation configuration (gradient-less batch reactor). The quantity of the accumulated NH3 gas was estimated from the infrared absorption spectra passing through the in-line gas cell.
 | ||
| Fig. 1 Schematic diagram of the closed recirculation batch system for catalytic ammonia decomposition. | ||
Fig. S2(a) (ESI†) shows typical results of the NH3 decomposition at various temperatures over a supported Ru/CeO2 catalyst. Deposition of colloidal Ru nanoparticles (mean particle size ∼4 nm) on the CeO2 support was employed to eliminate particle-size effects among the different samples. For tests at higher temperature, the Ru-deposited CeO2 catalyst was diluted with pristine CeO2 to control the reaction rate. As shown in Fig. S2(b) (ESI†), the NH3 decomposition rates were obtained from the slope of the line connecting the several plotted points in Fig. S2(a) (ESI†).
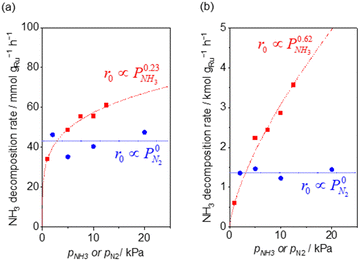
Fig. 2 shows the partial pressure dependence of ammonia decomposition over the supported Ru/CeO2 catalyst. The apparent kinetic order with respect to NH3 partial pressure was 0.23 at 200 °C, which gradually increased with the temperature, reaching 0.62 at 400 °C. Next, N2 was introduced into the initial gas composition to study its partial pressure dependence on the reaction rate. The N2 partial pressure was insensitive to the NH3 decomposition rate at both 200 and 400 °C (Fig. 2(b)).
 | ||
| Fig. 2 NH3 (red square) and N2 (blue circle) pressure dependence of ammonia decomposition rates (a) over 0.1 mg of 5 wt% Ru/CeO2 diluted with 9.9 mg of CeO2 within pellets at 200 °C and (b) over 1 mg pellets of 10× further dilution with CeO2 within the pellets at 400 °C. Initial conditions: ∼0.5 kPa NH3 balanced with Ar, total 101 kPa. Raw data are shown in Fig. S3 and S4 (ESI†). | ||
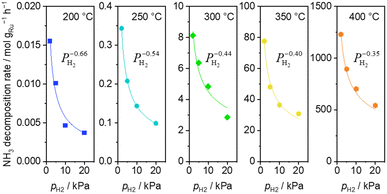
H2 introduction caused a decrease of the ammonia decomposition rate at 200–400 °C. Substantially negative order of −0.66 on H2 partial pressure was observed at 200 °C (Fig. 3). The inhibition effects by H2 became less severe with increasing temperature, reaching −0.35 at 400 °C.
 | ||
| Fig. 3 H2 pressure dependence of ammonia decomposition rates over 0.1 mg of 5 wt% Ru/CeO2 diluted with 9.9 mg of CeO2 within the pellets at 200 (blue square), 250 (light blue circle) and 300 °C (green diamond) and over 1 mg pellets of 10× further dilution with CeO2 within pellets at 350 (yellow pentagon) and 400 °C (orange pentagon) (5 kPa NH3, balanced by Ar). Raw data are shown in Fig. S5 (ESI†). | ||
Elementary reaction steps were examined for detailed analysis of the kinetics as follows:
 | (1) |
 | (2) |
 | (3) |
 | (4) |
 | (5) |
 | (6) |
 | (7) |
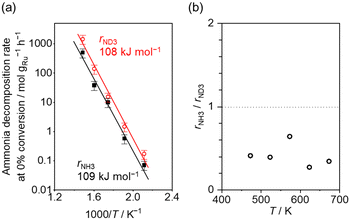
Fig. 4(a) shows the Arrhenius plot of NH3 and ND3 decomposition over the supported Ru/CeO2 catalyst. Notably, an inverse kinetic isotope effect was observed at all temperatures, where the decomposition rate of ND3 was greater than that of NH3. The apparent activation energy for NH3 and ND3 decomposition was almost identical (109 and 108 kJ mol−1). If N–H bond breaking (steps (2–4)) is involved in the rate-determining step, the activation energies should obviously be different. Therefore, the identical activation energy suggested that the rate-determining step should be steps (1), (5), (6) and (7), and most likely for associative N–N bonding formation (step (5)).
 | ||
Fig. 4 (a) Arrhenius plot of NH3 (black square) and ND3 (red circle) decomposition over 0.1 mg of 5 wt% Ru/CeO2 diluted with 9.9 mg of CeO2 within pellets below 300 °C and over 1 mg pellets of 10× further dilution with CeO2 within pellets above 400 °C. The initial gas ratio was Ar![[thin space (1/6-em)]](https://www.rsc.org/images/entities/char_2009.gif) : :![[thin space (1/6-em)]](https://www.rsc.org/images/entities/char_2009.gif) NH3 = 100 NH3 = 100![[thin space (1/6-em)]](https://www.rsc.org/images/entities/char_2009.gif) : :![[thin space (1/6-em)]](https://www.rsc.org/images/entities/char_2009.gif) 1 kPa or Ar/ND3 = 100 1 kPa or Ar/ND3 = 100![[thin space (1/6-em)]](https://www.rsc.org/images/entities/char_2009.gif) : :![[thin space (1/6-em)]](https://www.rsc.org/images/entities/char_2009.gif) 1 kPa. The raw data are shown in Fig. S6–S10 (ESI†). Error bars: 34.1% (1σ of Gaussian distribution). (b) Ratio of NH3 decomposition rate, rNH3, to ND3 decomposition rate, rND3, as a function of reaction temperature. Averaged rNH3/rND3 was 0.414 with a standard error of 0.062 (standard deviation = 0.139). 1 kPa. The raw data are shown in Fig. S6–S10 (ESI†). Error bars: 34.1% (1σ of Gaussian distribution). (b) Ratio of NH3 decomposition rate, rNH3, to ND3 decomposition rate, rND3, as a function of reaction temperature. Averaged rNH3/rND3 was 0.414 with a standard error of 0.062 (standard deviation = 0.139). | ||
Fig. 4(b) shows the ratio of NH3 and ND3 decomposition rates (rNH3/rND3) in the Arrhenius expression. The degree of kinetic isotope effect was independent of the reaction temperature and was almost constant (∼0.5). Aika and Ozaki studied the inverse kinetic isotope effect on NH3 synthesis (i.e., reverse reaction of NH3 decomposition). Strong inverse kinetic isotope effects were observed in the reaction of H2 and D2 with N2 over iron,33,34 molybdenum-based,35 or even Ru-based36,37 catalysts. The inverse kinetic isotope effects were explained by the larger equilibrium constant for ND3 decomposition relative to NH3 decomposition, which increased the empty sites for N2 activation.
Based on elementary steps (1)–(7), the overall reaction rate can be expressed as follows with an assumption of nitrogen triple bond formation in step (5) as the rate-determining step (adopted from Stoltze38).
 | (8) |
 | (9) |
 | (10) |
Assuming NH3 as the MARI, the order of the partial pressure dependence on H2 is still minus three. To be consistent with the zero order of N2 and the slightly negative order of H2 demonstrated by experiments, we derived the rate expression by assuming NH or NH2 species as the MARI, respectively:
 | (11) |
 | (12) |
From the experimental results, both the ammonia and hydrogen orders increased with increasing temperature. Typically, the surface reaction intermediates decreased as the temperature increases, meaning that the coverage term, θ*, becomes closer to zero at higher temperatures. Therefore, based on eqn (8), the dependence on ammonia partial pressure increases with increasing temperature under ammonia partial pressure. On the other hand, the effect of reaction inhibition by intentionally introduced hydrogen weakened as the temperature increased. This change can be explained by the change in MARI with increasing temperature. At high temperatures, MARI approaches N, and the apparent hydrogen partial pressure dependence is expected to approach zero, as shown in the equation below.
| −rNH3 = k5+ | (13) |
From the rate expression as eqn (11) or (12), one possibility for explanation of the inverse kinetic isotope effect is the difference of the equilibrium constant of H2 or D2 adsorption/desorption (K7). Kellner and Bell studied H2/D2 isotope effects on Fischer–Tropsch synthesis over supported Ru catalysts.39 They calculated the equilibrium constant of H2 and D2 adsorption on Ru from vibrational frequencies for molecular and atomically adsorbed H2 and D2 (derivation is shown in the ESI†). The ratio of the equilibrium constants of D2 adsorption and that of H2 adsorption (K7,D/K7,H) was less than 1 between 180 °C and 270 °C, or the equilibrium shifted more toward desorption for D2 than for H2. Based on rate expression (11) or (12), lower K7 leads to a higher overall reaction rate due to more active surface species for the forward reaction (less inhibition). Therefore, the difference in the adsorption equilibrium constants of H2 and D2 can be one possible explanation for the inverse kinetic isotope effect in the NH3 decomposition reaction over the Ru/CeO2 catalyst observed in this study, suggesting that the secondary kinetic isotope effect appears inversely.
In conclusion, kinetic analysis using Ru/CeO2 revealed that comparable apparent activation energies between NH3 and ND3 decomposition reactions (∼108 kJ mol−1) were obtained with an inverse kinetic isotope effect (rNH3/rND3 ∼ 0.5). The kinetic orders were zero with respect to N2 partial pressure and negative with respect to H2 partial pressure on the NH3 decomposition rate. The results suggest that the rate-determining step does not involve N–H or N–D-bond dissociation, but it likely involves N–N triple bond formation, of which the rate is strongly perturbed by the surface H(D) adsorption equilibrium from H2 and D2 to the Ru surface. The adsorption equilibrium constant for D2 is smaller than that for H2, resulting in lower D coverage than H coverage, which is advantageous for high N* coverage. It can be concluded that the observed isotope effect was the secondary kinetic isotope effect inversely influenced by H(D) surface coverage. A more comprehensive understanding of the kinetics can be attained with further studies on isotope effects under diverse conditions.
This work was financially supported by the Mohammed bin Salman Center for Future Science and Technology for Saudi-Japan Vision 2030 at The University of Tokyo (MbSC2030), and the Science and Technology Research Partnership for Sustainable Development (SATREPS) in collaboration between the Japan Science and Technology Agency (JST, JPMJSA2104) and Japan International Cooperation Agency (JICA).
Data availability
The data supporting this article have been included as part of the ESI.† Raw data for each experiment is available by contacting the corresponding author.Conflicts of interest
There are no conflicts to declare.Notes and references
- A. Klerke, C. H. Christensen, J. K. Nørskov and T. Vegge, J. Mater. Chem., 2008, 18, 2304–2310 RSC.
- S. Mukherjee, S. V. Devaguptapu, A. Sviripa, C. R. F. Lund and G. Wu, Appl. Catal., B, 2018, 226, 162–181 CrossRef CAS.
- K. E. Lamb, M. D. Dolan and D. F. Kennedy, Int. J. Hydrogen Energy, 2019, 44, 3580–3593 CrossRef CAS.
- N. Morlanés, S. P. Katikaneni, S. N. Paglieri, A. Harale, B. Solami, S. M. Sarathy and J. Gascon, Chem. Eng. J., 2021, 408, 127310 CrossRef.
- J. S. Cardoso, V. Silva, R. C. Rocha, M. J. Hall, M. Costa and D. Eusébio, J. Cleaner Prod., 2021, 296, 126562 CrossRef CAS.
- S. Brunauer, K. S. Love and R. G. Keenan, J. Am. Chem. Soc., 1942, 64, 751–758 CrossRef CAS.
- J. C. Ganley, F. S. Thomas, E. G. Seebauer and R. I. Masel, Catal. Lett., 2004, 96, 117–122 CrossRef CAS.
- C. Chen, K. Wu, H. Ren, C. Zhou, Y. Luo, L. Lin, C. Au and L. Jiang, Energy Fuels, 2021, 35, 11693–11706 CrossRef CAS.
- T. Su, B. Guan, J. Zhou, C. Zheng, J. Guo, J. Chen, Y. Zhang, Y. Yuan, W. Xie, N. Zhou, H. Dang, B. Xu and Z. Huang, Energy Fuels, 2023, 37, 8099–8127 CrossRef CAS.
- I. Lucentini, A. Casanovas and J. Llorca, Int. J. Hydrogen Energy, 2019, 44, 12693–12707 CrossRef CAS.
- I. Lucentini, G. García Colli, C. D. Luzi, I. Serrano, O. M. Martínez and J. Llorca, Appl. Catal., B, 2021, 286, 119896 CrossRef CAS.
- A. Boisen, S. Dahl, J. K. Nørskov and C. H. Christensen, J. Catal., 2005, 230, 309–312 CrossRef CAS.
- K. Yamazaki, M. Matsumoto, M. Ishikawa and A. Sato, Appl. Catal., B, 2023, 325, 122352 CrossRef CAS.
- D. Szmigiel, W. Raróg-Pilecka, E. Miśkiewicz, Z. Kaszkur and Z. Kowalczyk, Appl. Catal., A, 2004, 264, 59–63 CrossRef CAS.
- W. Zheng, J. Zhang, H. Xu and W. Li, Catal. Lett., 2007, 119, 311–318 CrossRef CAS.
- S. F. Yin, B. Q. Xu, W. X. Zhu, C. F. Ng, X. P. Zhou and C. T. Au, Catal. Today, 2004, 93, 27–38 CrossRef.
- S. F. Yin, Q.-H. Zhang, B.-Q. Xu, W.-X. Zhu, C.-F. Ng and C.-T. Au, J. Catal., 2004, 224, 384–396 CrossRef CAS.
- S. F. Yin, B. Q. Xu, S. J. Wang, C. F. Ng and C. T. Au, Catal. Lett., 2004, 96, 113–116 CrossRef CAS.
- S. Armenise, L. Roldán, Y. Marco, A. Monzón and E. García-Bordejé, J. Phys. Chem. C, 2012, 116, 26385–26395 CrossRef CAS.
- M. Pinzón, A. Romero, A. de Lucas Consuegra, A. R. de la Osa and P. Sánchez, J. Ind. Eng. Chem., 2021, 94, 326–335 CrossRef.
- F. Hayashi, Y. Toda, Y. Kanie, M. Kitano, Y. Inoue, T. Yokoyama, M. Hara and H. Hosono, Chem. Sci., 2013, 4, 3124–3130 RSC.
- H. Fang, S. Wu, T. Ayvali, J. Zheng, J. Fellowes, P.-L. Ho, K. C. Leung, A. Large, G. Held, R. Kato, K. Suenaga, Y. I. A. Reyes, H. V. Thang, H.-Y. T. Chen and S. C. E. Tsang, Nat. Commun., 2023, 14, 647 CrossRef CAS PubMed.
- C. Egawa, T. Nishida, S. Naito and K. Tamaru, J. Chem. Soc., 1984, 80, 1595 CAS.
- W. Tsai and W. H. Weinberg, J. Phys. Chem., 1987, 91, 5302–5307 CrossRef CAS.
- X. Lu, J. Zhang, W.-K. Chen and A. Roldan, Nanoscale Adv., 2021, 3, 1624–1632 RSC.
- S. Sun, Q. Jiang, D. Zhao, T. Cao, H. Sha, C. Zhang, H. Song and Z. Da, Renewable Sustainable Energy Rev., 2022, 169, 112918 CrossRef CAS.
- A. S. Chellappa, C. M. Fischer and W. J. Thomson, Appl. Catal., A, 2002, 227, 231–240 CrossRef CAS.
- W. Pyrz, R. Vijay, J. Binz, J. Lauterbach and D. J. Buttrey, Top. Catal., 2008, 50, 180–191 CrossRef CAS.
- S. Sayas, N. Morlanés, S. P. Katikaneni, A. Harale, B. Solami and J. Gascon, Catal. Sci. Technol., 2020, 10, 5027–5035 RSC.
- S. R. Kulkarni, N. Realpe, A. Yerrayya, V. K. Velisoju, S. Sayas, N. Morlanes, J. Cerillo, S. P. Katikaneni, S. N. Paglieri, B. Solami, J. Gascon and P. Castaño, Catal. Sci. Technol., 2023, 13, 2026–2037 RSC.
- S. Armenise, E. García-Bordejé, J. L. Valverde, E. Romeo and A. Monzón, Phys. Chem. Chem. Phys., 2013, 15, 12104–12117 RSC.
- R. Antunes, R. Steiner, L. Marot and E. Meyer, Int. J. Hydrogen Energy, 2022, 47, 14130–14140 CrossRef CAS.
- K. Aika and A. Ozaki, J. Catal., 1969, 13, 232–237 CrossRef CAS.
- K. Aika and A. Ozaki, J. Catal., 1970, 19, 350–352 CrossRef CAS.
- K. Aika and A. Ozaki, J. Catal., 1969, 14, 311–321 CrossRef CAS.
- Y. Izumi and K. Aika, J. Phys. Chem., 1995, 99, 10346–10353 CrossRef CAS.
- Y. Izumi, Y. Iwata and K. Aika, J. Phys. Chem., 1996, 100, 9421–9428 CrossRef CAS.
- P. Stoltze, J. Catal., 1988, 110, 1–10 CrossRef CAS.
- C. S. Kellner and A. T. Bell, J. Catal., 1981, 67, 175–185 CrossRef CAS.
Footnote |
| † Electronic supplementary information (ESI) available: Experimental methods, partial pressure dependence, and fitting result. See DOI: https://doi.org/10.1039/d4cc02372b |
| This journal is © The Royal Society of Chemistry 2024 |
