
 Open Access Article
 This Open Access Article is licensed under a Creative Commons Attribution-Non Commercial 3.0 Unported Licence
Ionic liquid-mediated ethosome for transdermal delivery of insulin†
Fahmida Habib
Nabila
 a,
Rashedul
Islam
a,
Islam Md
Shimul
b,
Muhammad
Moniruzzaman
c,
Rie
Wakabayashi
ade,
Noriho
Kamiya
ade and
Masahiro
Goto
*a
a,
Rashedul
Islam
a,
Islam Md
Shimul
b,
Muhammad
Moniruzzaman
c,
Rie
Wakabayashi
ade,
Noriho
Kamiya
ade and
Masahiro
Goto
*a
aDepartment of Applied Chemistry, Graduate School of Engineering, Kyushu University, 744 Motooka, Nishi-ku, Fukuoka 819-0395, Japan. E-mail: m-goto@mail.cstm.kyushu-u.ac.jp
bDepartment of Nutrition and Food Technology, Jashore University of Science and Technology, Jashore-7408, Bangladesh
cDepartment of Chemical Engineering, Universiti Teknologi PETRONAS, 32610 Seri Iskandar, Perak, Malaysia
dAdvanced Transdermal Drug Delivery System Center, Kyushu University, 744 Motooka, Nishi-ku, Fukuoka 819-0395, Japan
eDivision of Biotechnology, Center for Future Chemistry, Kyushu University, 744 Motooka, Nishi-ku, Fukuoka 819-0395, Japan
First published on 6th March 2024
Abstract
Herein, we report ethosome (ET) formulations composed of a safe amount of 1,2-dimyristoyl-sn-glycero-3-phosphatidylcholine (DMPC)-based ionic liquid with various concentrations of ethanol as a carrier for the transdermal delivery of a high molecular weight drug, insulin. The Insulin-loaded ET vesicles exhibited long-term stability compared to conventional DMPC ETs, showing significantly higher drug encapsulation efficiency and increased skin permeation ability.
In recent decades, there have been transformative developments in the use of nanovesicles in transdermal drug delivery (TDD). Ethosomes (ETs) are phospholipid vesicular systems, composed of phospholipids, ethanol, and water. These soft vesicles have gained prominence in TDD, surpassing traditional nanovesicles such as liposomes, because of their tensile nature with exceptional stratum corneum penetration capabilities.1–3 Ethanol, the key component, disrupts skin lipid bilayers by forming hydrogen bonds with the skin lipids and extracting fatty acids, which creates pathways for drug molecules to penetrate the skin.4 ETs have been extensively employed to enhance the transdermal penetration of a diverse range of drugs, including anti-cancer drugs, anti-viral drugs, non-steroidal anti-inflammatory drugs, anti-Parkinsonian agents, and hormonal agents.5,6 However, there are many limitations of this system, such as challenges with comparatively high molecular weight (MW) drugs, rigidity from conventional saturated phospholipids, a high phase-transition temperature, and low biocompatibility.7–9 Previous studies of ET systems have primarily focused on facilitating the penetration of low MW drugs.3,7 Optimizing the lipid bilayer composition is pivotal for overcoming the current limitations with higher MW drugs.10 For example, the introduction of unsaturated fatty acids in the liposomal system has been reported to lower the phase-transition temperature, while maintaining stability and fluidity, which can produce suitable nanovesicles for temperature-sensitive drugs, including higher MW insulin.8,11,12 Recently, incorporating an ionic liquid (IL) into liposomes has been shown to affect the toxicological profile and physicochemical properties. For example, introducing IL[bmim][Cl](1-butyl-3-methyl-imidazolium chloride) into liposomes made the system stable with lower microviscosity and higher cell viability compared to conventional liposomes.13 However, the inherent toxicity of first-generation imidazolium-based and other phosphonium-based ILs restrict their use in vesicular systems. Consequently, research is now predominantly focused on exploring new biocompatible ILs for vesicular drug delivery systems.14,15 Recently, new biocompatible lipid-based ionic liquids (LBILs) with excellent lipophilic character have been used to formulate nanocarriers (e.g., nanoemulsions, microemulsions) and solid-in-oil dispersions for the transdermal delivery of antigenic proteins and antisense oligonucleotides both in vitro and in vivo.16,17 In these studies, conventional toxic surfactants were successfully replaced with LBILs.16,17 LBILs can emerge as potential alternatives to traditional phospholipids for liposomal drug delivery systems.13 Thus, it would be interesting to investigate the effect of LBILs on the physiochemical properties of ETs and the TDD of drug molecules, particularly insulin, which has a relatively high MW. Our objective was to develop ETs with a safe amount of LBIL to address the challenges related to the toxicity, stability, and encapsulation of moderately high MW drugs to enable the efficient delivery of insulin. We believe that this innovative approach, reported here for the first time, has the potential to be applied to a diverse range of relatively high MW drugs in the field of TDD.
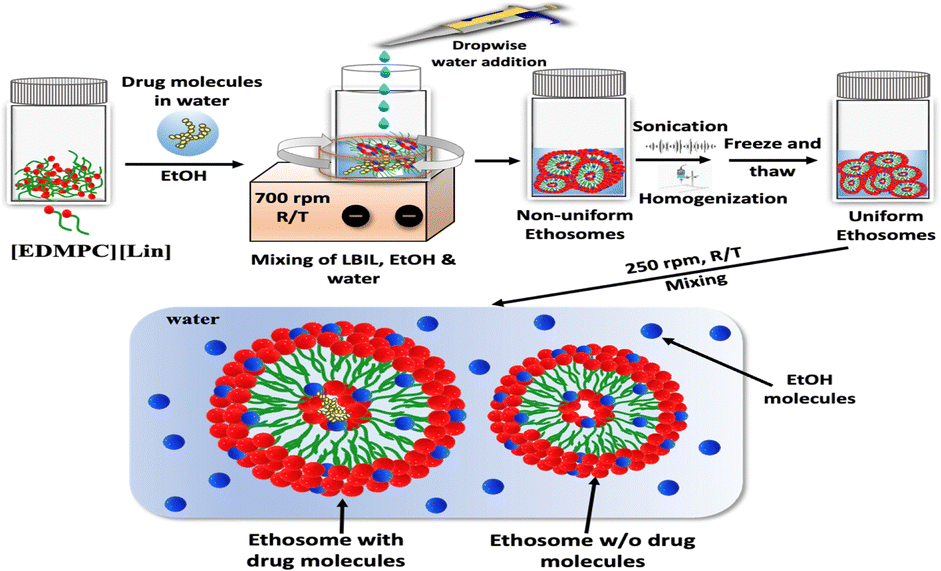
ET vesicles were prepared using DMPC-based LBIL consisting of the phospholipid derivative 1,2-dimyristoyl-sn-glycero-3-ethyl-phosphatidylcholine (EDMPC) as the cation and unsaturated linoleic acid (Lin) as the anion, containing two double bonds in its structure (C18![[thin space (1/6-em)]](https://www.rsc.org/images/entities/char_2009.gif) :2). The LBIL was synthesized following the previously reported protocols.18 The Fourier transform infrared (FTIR) spectra and 1H-NMR indicated the successful synthesis of [EDMPC][Lin] (Fig. S1 and S2 in ESI†). ETs were prepared by the “cold method”, with minor modifications to the procedure, as described in previous reports (Scheme 1).3,19 To prepare a stock solution, a specific amount of [EDMPC][Lin] was dissolved in ethanol.
:2). The LBIL was synthesized following the previously reported protocols.18 The Fourier transform infrared (FTIR) spectra and 1H-NMR indicated the successful synthesis of [EDMPC][Lin] (Fig. S1 and S2 in ESI†). ETs were prepared by the “cold method”, with minor modifications to the procedure, as described in previous reports (Scheme 1).3,19 To prepare a stock solution, a specific amount of [EDMPC][Lin] was dissolved in ethanol.
 | ||
| Scheme 1 Schematic representation of the ET preparation steps. | ||
For the drug solution, free Insulin was initially dissolved in 0.01 M HCl (20 mg of insulin in 1 mL of 0.01 M HCl), neutralized with 0.01 M NaOH, and then diluted with Milli-Q water to create a 4 mg mL−1 drug solution. The drug solution was gently mixed with the LBIL solution, and then, water was added dropwise with stirring at 700 rpm to create the ET formulation. The formulation was maintained at 4 °C and sonication was applied using a probe sonicator following the previously described method.5 A mechanical homogenizer (POLYTRON, high-speed homogenizer, PT2500E) was used to homogenize the formulation at 26000 rpm for 2 min. After freezing with liquid N2 and thawing, the formulation was stirred at 250 rpm at RT for 3 h. Conventional DMPC ETs were prepared using the same procedure, with the LBILs being replaced by DMPC. Details of the ET compositions are provided in Table 1.
| Samples | [EDMPC][Lin] (mM) | DMPC (mM) | EtOH (w/w%) | Water (w/w%) |
|---|---|---|---|---|
| ET1 | 5 | — | 25,35 | 75,65 |
| ET2 | 10 | — | 25,35 | 75,65 |
| ET3 | 15 | — | 25,35 | 75,65 |
| ET4 | 20 | — | 25,35 | 75,65 |
| ET5 | — | 10 | 25,35 | 75,65 |
| ET6 | — | 20 | 25,35 | 75,65 |
ETs without any incorporated drugs were also prepared using the same method. Circular dichroism (CD) spectra were analyzed to assess the stability of the secondary structure of insulin in the presence of ethanol in the formulations. The CD spectra indicated that there was a slight increase in negative ellipticity from 230 to 210 nm, consistent with previous findings for insulin in ethanol (Fig. S3 in ESI†).20 According to the previous findings, the correct structure of insulin is maintained, with this slight increase in negative ellipticity, in ethanol concentrations up to 40%.20,21 The structure of insulin was also likely to be preserved in the ET formulations (Fig. S3, ESI†). Insulin was then labeled with fluorescein isothiocyanate (FITC) to observe the drug distribution using confocal laser scanning microscope (CLSM) examination, determine the entrapment efficiency, and assess the in vitro drug permeation of the formulations by measuring the fluorescence of the ETs. The synthesis of FITC-Insulin was confirmed using matrix-assisted laser desorption/ionization-time of flight mass spectrometry (Fig. S4 in ESI†). FITC-Insulin was directly solubilized in water, and ETs loaded with FITC-Insulin were prepared using the same protocol used for preparing ETs with unlabeled insulin (Scheme 1).
The ET2, ET4, ET5, and ET6 formulations were prepared with 35% ethanol following the described procedure (Scheme 1 and Table 1) to observe their morphological characteristics using transmission electron microscopy (TEM), dynamic light scattering (DLS) and zeta potential (ZP) measurements. The entrapment efficiency was also calculated through fluorescence spectrophotometry of the FITC-Insulin-loaded ET formulations (Fig. S6, ESI†). DLS and TEM observations revealed that the size of ETs formed with DMPC ranged from 230 to 250 nm, while those formed from [EDMPC][Lin] ranged from 350 to 400 nm, with all formulations displaying polydispersity index (PDI) values < 0.2 (Table S3 in ESI†). As shown in Table S3 (ESI†), the ZP values exhibited a negative trend for the DMPC ETs, whereas the ZP values were highly positive for the LBIL ETs. Since ethanol provides a negative charge on the vesicle surface,22 the DMPC ETs showed negative ZP values in the presence of ethanol. In contrast, the presence of LBILs caused a large positive shift in the ZP values, compared with those of the DMPC ETs. According to previous reports, ZP values are an indicator of vesicle stability, as they reflect the degree of repulsion between vesicles in a dispersion. The greater positive values of the ZPs for the LBIL ETs were indicative of enhanced stability compared with the DMPC ETs because a high degree of repulsion reduces the possibility of the aggregation of the vesicles.23 It is worth noting that the slight decrease in the sizes of the vesicles observed by TEM, compared with those observed from DLS measurements, was caused by EtOH volatilization, which leads to the shrinking of the vesicles. The physical appearances of all the ETs are shown in Fig. 1.
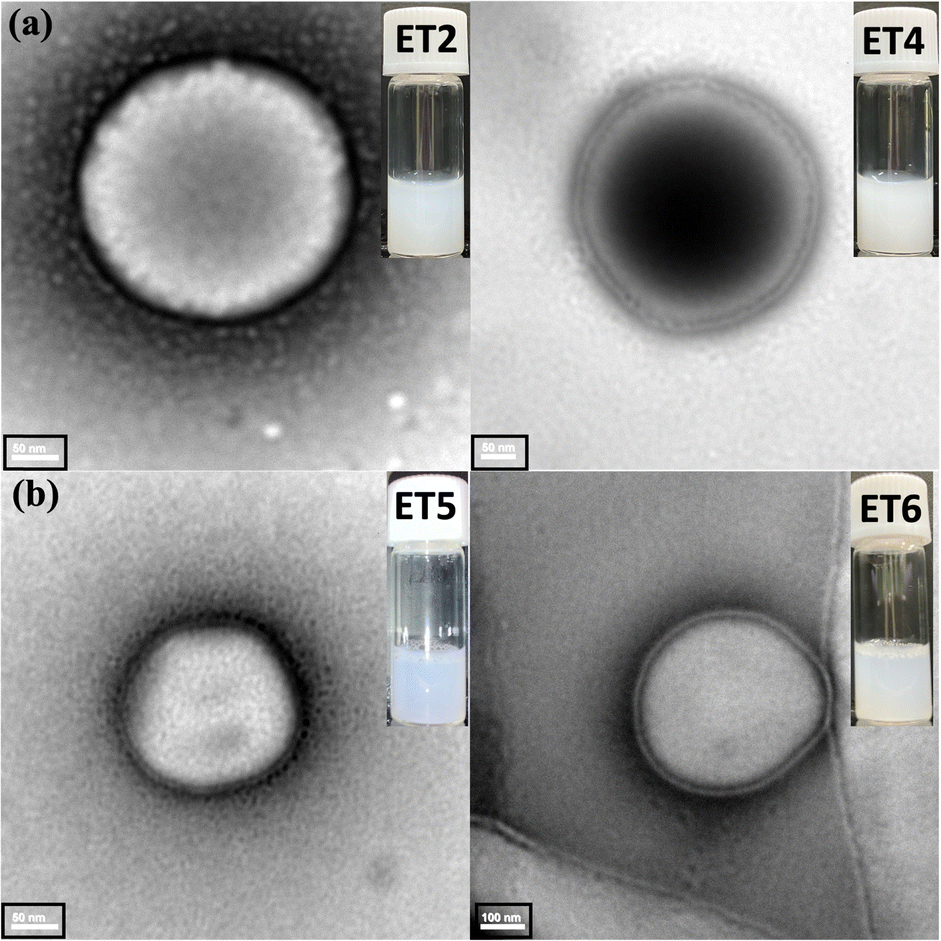 | ||
| Fig. 1 TEM images and physical appearances of the ETs; (a) LBIL ETs and (b) DMPC ETs. | ||
The stability of drug-loaded ethosomal carriers is crucial for their use in TDD. The stability of insulin-loaded ETs was monitored at 4 °C and 25 °C for over 12 weeks by examining changes in the mean vesicle diameters, PDI values, ZP values, and through direct visual observations (Fig. 2 and Fig. S5 in ESI†). Fig. 2 shows that ETs containing varying concentrations of LBILs exhibited stable values for all the parameters both at 4 °C and 25 °C. Specifically, for ET1, the vesicle size and the distribution of the PDI remained relatively constant at 4 °C, while some minor changes were observed in both the size distribution and the PDI value at 25 °C (Fig. 2).
 | ||
| Fig. 2 Stability of the ETs determined using DLS and ZP measurements; N = 10; mean ± SD; (a) at 4 °C and (b) at 25 °C for 12 weeks. | ||
In contrast, for the other ETs, the vesicle size distribution and PDI values displayed an increasing trend over time. This behavior was correlated with the change in ZP values, which, as discussed earlier, are directly associated with vesicle stability.23 Remarkably, for ET1 stored at 4 °C, the ZP value was almost constant. Additionally, ET1 stored at 25 °C and ET2 stored at 4 °C maintained nearly consistent ZP values for 12 weeks. After storage at both 4 °C and 25 °C, ET3 and ET4 exhibited notable decreases in ZP values, corresponding with the observed increases in vesicle size and PDI values over time. In the case of ET4, with time, the PDI values exceeded 0.5, the vesicle size doubled, and the ZP values decreased by nearly half [Fig. 2(a) and (b)]. This trend suggested that the ethosomal stability diminished with higher concentrations of LBILs, with ET1 demonstrating the highest stability under both temperature conditions, while ET4 exhibited the lowest stability. The physical appearances of all the ETs remained almost the same over time (Fig. S5, ESI†). The entrapment efficiency was 98–99% for all the formulations, indicating a high encapsulation efficiency (Fig. S6, ESI†).
To visualize the drug distribution within the ET formulations, FITC-Insulin-loaded ETs with varying concentrations of LBIL and 25% ethanol were examined using CLSM (Fig. S7, ESI†). The observations showed that there was an even distribution of fluorescence in the ET1 formulation. However, as the LBIL concentration increased, the fluorescence became concentrated unevenly, indicating a noticeable tendency for vesicle aggregation in the formulations with higher concentrations of LBIL (Fig. S7, ESI†). This observed aggregation could be explained by the previous results, where over time, vesicles with high concentrations exhibited a large decline in ZP values (Fig. 2).23 ET1 formulations with increasing EtOH concentrations were also evaluated to observe the FITC fluorescence distribution (Fig. 3). A uniform distribution of fluorescence was observed in ET1 containing 25%, 30%, and 35% ethanol (Fig. 3). In addition, ET2 and ET4 formulations containing 35% ethanol were assessed to investigate whether the ethanol percentage influenced the drug distribution in ETs with high concentrations of LBIL (Fig. S8, ESI†). The drug distribution observations indicated that there was lower aggregation with the formulation prepared with 35% ethanol compared with 25% ethanol (Fig. 3 and Fig. S8, ESI†).
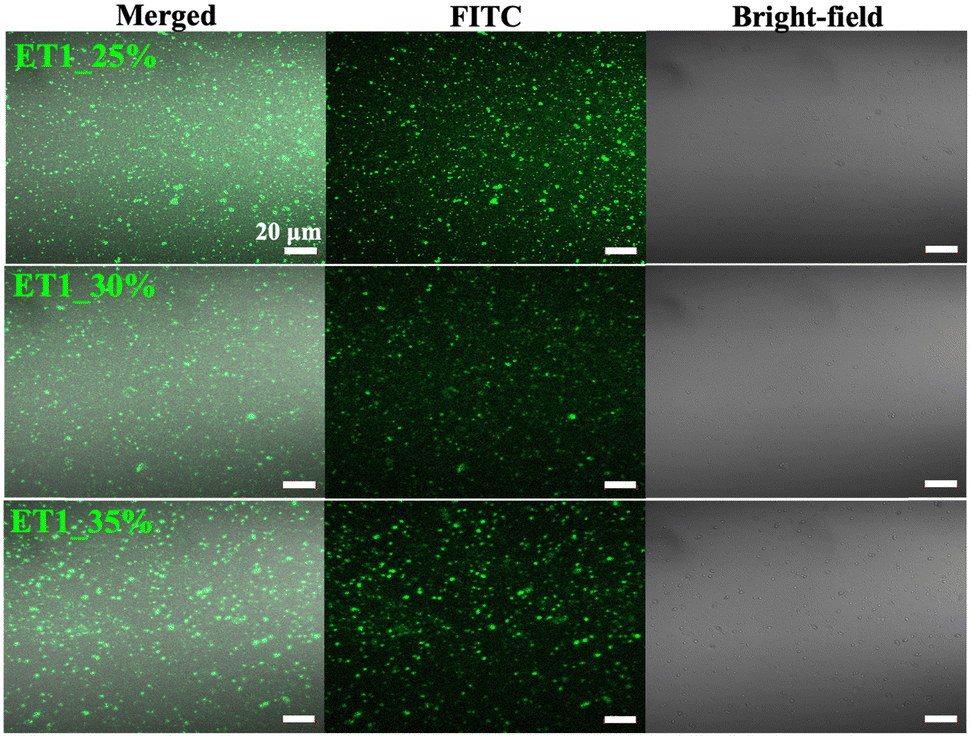 | ||
| Fig. 3 Drug distribution of FITC-Insulin encapsulated ET1 prepared with 25%, 30%, and 35% ethanol using CLSM visualization through a 63× lens, scale bars = 20 μm. | ||
To evaluate the relative safety profile of the newly formed ETs, cell viability was investigated using the WST-8 assay in the HeLa cell line (Fig. S9, ESI†). Changes in cell viability were evaluated with increasing concentrations of LBIL-mediated ETs. Dulbecco's phosphate-buffered saline and 5% sodium dodecyl sulfate were used as positive and negative controls, respectively. The safety profiles of ET1, ET2, ET3, and ET4 were investigated at a 50 times dilution, with final concentrations of 100, 200, 300, and 400 μg mL−1 in wells containing 1.5 × 10⁴ cells per mL. As shown in Fig. S9 (ESI†), an increase in LBIL concentration resulted in a reduction in cell viability.
An in vitro drug penetration study in mouse skin was performed to assess the efficacy of DMPC and LBIL-containing ETs prepared with 35% ethanol for TDD [Fig. S10(a) and (b), ESI†]. ET5 and ET6 showed no significant increase in drug penetration or permeation compared with the control, indicating that incorporating DMPC in ETs had no impact on TDD through the skin. In contrast, both ET2 and ET4 significantly (p < 0.0001 for ET2 & p < 0.001 for ET4) enhanced the transdermal flux compared with the control. In another in vitro study, compared with the control, ET formulations containing varying concentrations of LBIL (ET1, ET2, ET3, and ET4) led to a notable increase in both drug penetration and permeation into and through the skin [Fig. 4(a) and (b)]. Particularly, there was a significant (p < 0.0001) increase in drug permeation for all ET formulations compared with the control [Fig. 4(b)]. ET1 formulations with different ethanol concentrations (25%, 30%, and 35%) were also evaluated for in vitro drug penetration efficiency, and a pronounced increase in transdermal flux was observed for ET1 containing 25%, 30%, and 35% ethanol compared with the control [Fig. 4(c) and (d)]. The permeation rate was greatly elevated for all the ET1 formulations compared with the control. Also, compared with ET1_25%, there were notable increases of 13% and 26% in drug permeation for ET1_30% and ET1_35%, respectively, indicating that the permeation capability increased with increasing EtOH concentrations [Fig. 4(d)].
 | ||
| Fig. 4 In vitro skin permeation study in mouse skin; (a) and (c) drug penetration and (b) and (d) drug permeation with (a) and (b) various ETs and (c) and (d) various ethanol concentrations in ET1. N = 3; mean ± SD; *p < 0.05, **p < 0.005, ***p < 0.001, ****p < 0.0001 (Dunnett's multiple comparison test). | ||
In conclusion, we have successfully developed a biocompatible LBIL-mediated ET formulation, which, to the best of our knowledge, is the first report of an LBIL-mediated ET used for TDD. The LBIL ETs effectively encapsulated insulin with ∼99% encapsulation efficiency and demonstrated long-term stability at 4 °C and 25 °C, while DMPC ETs were unable to encapsulate insulin. Increasing the LBIL concentration reduced the cell viability, whereas increasing ethanol concentration was correlated with an increase in TDD, emphasizing the crucial roles of the LBIL concentration and ethanol percentage for ET efficacy. Considering the high cell viability, increased transdermal flux, and uniform drug distribution compared with the other formulations, the ET1 formulation containing 35% ethanol was considered the lead candidate from this study. We are currently optimizing the use of emulsifiers and other LBILs to further improve drug delivery using the ET formulations to determine the best-performing ETs for in vivo study. The knowledge gained from this study has the potential to broaden the scope of ethosomal drug delivery and offer promising solutions for the effective transdermal administration of high MW therapeutics.
The authors acknowledge financial support from the Japan Society for the Promotion of Science (KAKENHI numbers JP22K18314). The lead author also expresses her gratitude to the Japanese Government for awarding the MEXT scholarship. Victoria Muir, PhD, from Edanz (https://jp.edanz.com/ac) edited a draft of this manuscript.
Conflicts of interest
There are no conflicts to declare.Notes and references
- M. B. R. Pierre and I. dos Santos Miranda Costa, Arch. Dermatol. Res., 2011, 303, 607–621 CrossRef CAS.
- D. A. Kuznetsova, E. A. Vasilieva, D. M. Kuznetsov, O. A. Lenina, S. K. Filippov, K. A. Petrov, L. Y. Zakharova and O. G. Sinyashin, ACS Omega, 2022, 7, 25741–25750 CrossRef CAS PubMed.
- E. Touitou, N. Dayan, L. Bergelson, B. Godin and M. Eliaz, J. Controlled Release, 2000, 65, 403–418 CrossRef CAS PubMed.
- R. Gupta, Y. Badhe, B. Rai and S. Mitragotri, RSC Adv., 2020, 10, 12234–12248 RSC.
- S. Paliwal, A. Tilak, J. Sharma, V. Dave, S. Sharma, R. Yadav, S. Patel, K. Verma and K. Tak, Lipids Health Dis., 2019, 18, 1–15 CrossRef CAS.
- M. M. Shitole, S. N. Nangare, U. Patil and N. Jadhav, Thai J. Pharm. Sci., 2022, 46(3), 251–265 CAS.
- D. Ramadon, M. T. C. McCrudden, A. J. Courtenay and R. F. Donnelly, Drug Delivery Transl. Res., 2021, 1–34 Search PubMed.
- S. Kazaz, R. Miray, L. Lepiniec and S. Baud, Prog. Lipid Res., 2022, 85, 101138 CrossRef CAS.
- A. Akbarzadeh, R. Rezaei-Sadabady, S. Davaran, S. W. Joo, N. Zarghami, Y. Hanifehpour, M. Samiei, M. Kouhi and K. Nejati-Koshki, Nanoscale Res. Lett., 2013, 8, 1–9 CrossRef PubMed.
- A. G. Kohli, P. H. Kierstead, V. J. Venditto, C. L. Walsh and F. C. Szoka, J. Controlled Release, 2014, 190, 274–287 CrossRef CAS PubMed.
- H. Nsairat, D. Khater, U. Sayed, F. Odeh, A. Al Bawab and W. Alshaer, Heliyon, 2022, 8, e09394 CrossRef CAS.
- J. Zhao, G. Xu, X. Yao, H. Zhou, B. Lyu, S. Pei and P. Wen, Drug Delivery Transl. Res., 2021, 1–25 Search PubMed.
- M. K. Mandal, E. Manna, H. Sultana, M. Barai, K. C. Guchhait, C. Ghosh, A. Patra, K. Nag, S. Yusa and A. K. Panda, JCIS Open, 2022, 6, 100050 CrossRef.
- R. M. Moshikur, M. R. Chowdhury, M. Moniruzzaman and M. Goto, Green Chem., 2020, 22, 8116–8139 RSC.
- A. Benedetto and P. Ballone, Langmuir, 2018, 34, 9579–9597 CrossRef CAS PubMed.
- S. Uddin, M. R. Islam, R. Md Moshikur, R. Wakabayashi, N. Kamiya, M. Moniruzzaman and M. Goto, ACS Appl. Bio Mater., 2022, 5, 2586–2597 CrossRef CAS PubMed.
- K. Toyofuku, R. Wakabayashi, N. Kamiya and M. Goto, ACS Appl. Mater. Interfaces, 2023, 15, 33299–33308 CrossRef CAS PubMed.
- S. Uddin, M. R. Chowdhury, R. Wakabayashi, N. Kamiya, M. Moniruzzaman and M. Goto, Chem. Commun., 2020, 56, 13756–13759 RSC.
- E. Esposito, L. Calderan, A. Galvan, E. Cappellozza, M. Drechsler, P. Mariani, A. Pepe, M. Sguizzato, E. Vigato and E. Dalla Pozza, Int. J. Mol. Sci., 2022, 23, 15112 CrossRef CAS PubMed.
- D. Bernson, A. Mecinovic, M. T. Abed, F. Limé, P. Jageland, M. Palmlöf and E. K. Esbjörner, Eur. Biophys. J., 2020, 49, 145–153 CrossRef CAS PubMed.
- W. Dzwolak, S. Grudzielanek, V. Smirnovas, R. Ravindra, C. Nicolini, R. Jansen, A. Loksztejn, S. Porowski and R. Winter, Biochemistry, 2005, 44, 8948–8958 CrossRef CAS PubMed.
- T. Limsuwan, P. Boonme, P. Khongkow and T. Amnuaikit, BioMed Res. Int., 2017, 2017, 8310979 Search PubMed.
- M. Sguizzato, F. Ferrara, S. S. Hallan, A. Baldisserotto, M. Drechsler, M. Malatesta, M. Costanzo, R. Cortesi, C. Puglia and G. Valacchi, Antioxidants, 2021, 10, 768 CrossRef CAS PubMed.
Footnote |
| † Electronic supplementary information (ESI) available. See DOI: https://doi.org/10.1039/d3cc06130b |
| This journal is © The Royal Society of Chemistry 2024 |