DOI:
10.1039/D4AY01109K
(Paper)
Anal. Methods, 2024,
16, 7043-7053
Discrimination of serum samples of prostate cancer and benign prostatic hyperplasia with 1H-NMR metabolomics†
Received
14th June 2024
, Accepted 10th September 2024
First published on 12th September 2024
Abstract
Prostate cancer continues to be a prominent health concern for men globally. Current screening techniques, primarily the prostate-specific antigen (PSA) test and digital rectal examination (DRE), possess inherent limitations, with prostate biopsy being the definitive diagnostic procedure. The invasive nature of the biopsy and other drawbacks of current screening tests create the need for non-invasive and more accurate diagnostic methods. This study utilized 1H-NMR (Proton Nuclear Magnetic Resonance) based serum metabolomics to differentiate between prostate cancer (PCa) and benign prostatic hyperplasia (BPH). Serum samples from 40 PCa and 41 BPH patients were analysed using 1H-NMR spectroscopy. PepsNMR was utilized for preprocessing the raw NMR data, and the binned spectra were examined for patterns distinguishing PCa and BPH. Principal component analysis (PCA) showed a moderate separation between PCa and BPH, highlighting the distinct metabolic profiles of both conditions. A logistic regression model was then developed, which demonstrated good performance in distinguishing between the two conditions. The results showed significant variance in multiple metabolites between PCa and BPH, such as isovaleric acid, ethylmalonic acid, formate, and glutamic acid. This research underlines the potential of 1H-NMR-based serum metabolomics as a promising tool for improved prostate cancer screening, offering an alternative to the limitations of current screening methods.
1. Introduction
Prostate cancer is a major health concern for men worldwide, having a profound global impact. The worldwide incidence of prostate cancer reached 1![[thin space (1/6-em)]](https://www.rsc.org/images/entities/char_2009.gif) 414259 cases in 2020, making it the fourth most prevalent cancer. In that year, around 375304 individuals across the globe succumbed to prostate cancer.1 These figures highlight the urgent need for enhanced preventive measures, early detection, and advanced treatment approaches to tackle prostate cancer and reduce its severe impact on individuals. Currently, prostate cancer screening relies on the prostate-specific antigen (PSA) test and digital rectal examination (DRE), which possess inherent limitations. One notable limitation pertains to the utilization of PSA levels in the blood, which is a widely employed indicator for prostate cancer screening. However, elevated PSA levels can also result from various other prostate health conditions, such as benign prostate hyperplasia (BPH) or prostatitis, both characterized by the enlargement of the prostate gland.2–5 These factors can interfere with the test, resulting in diminished accuracy, sensitivity, and specificity. Moreover, the PSA range of 4 to 10 ng mL−1 presents difficulties in distinguishing between indolent (slow-growing) prostate cancer and a metastatic one, thereby casting doubts on the efficacy of the PSA test.6–8 On the other hand, the invasive nature of DRE often discourages patients from undergoing this test as its sensitivity largely depends on the physician's expertise, leading to considerable variability among different examiners. Moreover, there is a potential risk of DRE failing to detect early-stage prostate cancer.9,10 Although prostate biopsy is regarded as the definitive method for diagnosing prostate cancer,11 it is an invasive procedure that can lead to uncomfortable and occasionally inevitable adverse effects. These effects include pain, fever, hematuria (blood in urine), and in certain instances, more severe complications such as bleeding, infection, urinary retention, or sepsis.4,11,12 Misdiagnosing prostate cancer can have severe consequences, including overdiagnosis and overtreatment in benign cases or life-threatening risks in malignant ones. Consequently, there is a pressing need for novel and reliable screening tests.
414259 cases in 2020, making it the fourth most prevalent cancer. In that year, around 375304 individuals across the globe succumbed to prostate cancer.1 These figures highlight the urgent need for enhanced preventive measures, early detection, and advanced treatment approaches to tackle prostate cancer and reduce its severe impact on individuals. Currently, prostate cancer screening relies on the prostate-specific antigen (PSA) test and digital rectal examination (DRE), which possess inherent limitations. One notable limitation pertains to the utilization of PSA levels in the blood, which is a widely employed indicator for prostate cancer screening. However, elevated PSA levels can also result from various other prostate health conditions, such as benign prostate hyperplasia (BPH) or prostatitis, both characterized by the enlargement of the prostate gland.2–5 These factors can interfere with the test, resulting in diminished accuracy, sensitivity, and specificity. Moreover, the PSA range of 4 to 10 ng mL−1 presents difficulties in distinguishing between indolent (slow-growing) prostate cancer and a metastatic one, thereby casting doubts on the efficacy of the PSA test.6–8 On the other hand, the invasive nature of DRE often discourages patients from undergoing this test as its sensitivity largely depends on the physician's expertise, leading to considerable variability among different examiners. Moreover, there is a potential risk of DRE failing to detect early-stage prostate cancer.9,10 Although prostate biopsy is regarded as the definitive method for diagnosing prostate cancer,11 it is an invasive procedure that can lead to uncomfortable and occasionally inevitable adverse effects. These effects include pain, fever, hematuria (blood in urine), and in certain instances, more severe complications such as bleeding, infection, urinary retention, or sepsis.4,11,12 Misdiagnosing prostate cancer can have severe consequences, including overdiagnosis and overtreatment in benign cases or life-threatening risks in malignant ones. Consequently, there is a pressing need for novel and reliable screening tests.
In this context, metabolomics emerges as a promising methodology. This approach, which involves the study of metabolites, holds the potential to offer insights into disease mechanisms and provide more accurate diagnostic tools for prostate cancer.13 Choosing an appropriate analytical method to monitor variations in metabolites is important. When deciding on a method, considerations like sensitivity, limit of detection, resolution, and sample compatibility with the equipment are crucial. Gas or liquid chromatography coupled with mass spectrometry (GC-MS or LC-MS) and proton nuclear magnetic resonance (1H-NMR) stand out as common techniques in metabolomics. Each of these methods offers distinct advantages and challenges.14–16 For instance, 1H-NMR is non-destructive, rapid, reproducible, and highly automatable.17–211H-NMR is capable of detecting compounds that are less detectable in LC-MS. Moreover, it can also be used for quantitative analysis and enables the identification of several metabolites in a single experiment. However, despite these advantages, NMR-based metabolomics faces significant challenges. One major limitation is the high instrument cost and complexity associated with traditional high-resolution NMR spectrometers, which restricts their widespread adoption in clinical settings. While benchtop NMR offers a more affordable alternative, it still requires further development to match the capabilities of its high-resolution counterparts.22 Additionally, the sensitivity and resolution of NMR techniques are often inadequate for detecting low-abundance metabolites, which limit its effectiveness in quantifying a broad spectrum of metabolites simultaneously.23,24 Furthermore, NMR suffers from peak overlap and interpretation difficulties in 1D spectra, thus complicate metabolite identification and quantification. Some of these issues can be mitigated by using 2D NMR techniques, which provide better spectral resolution and more accurate data.25 Therefore, the development of more advanced tools and workflows can help overcome challenges associated with spectral pre-processing and interpretation, making it easier to achieve accurate and reliable results.25
In this study, we investigated the potential of 1H-NMR to discriminate prostate cancer and benign prostatic hyperplasia using serum samples. We employed 1H-NMR to acquire metabolic profiles, followed by pre-processing to enhance data quality. To unveil, underlying patterns in the data, exploratory data analysis was performed using Principal Component Analysis (PCA). Drawing on these insights, a supervised model based on logistic regression was built to establish a robust classification model. Additionally, we identified potential metabolites and compared their relative concentrations to gain deeper insights into the two studied groups of samples.
2. Materials and methods
2.1 Study design and participants
This research adhered to the ethical guidelines established by the Finnish National Advisory Board on Research Ethics (TENK) and adhere to the general principles set out in the Declaration of Helsinki. The study protocol was approved by the Ethics Committee of the Hospital District of Southwest Finland (3/1801/2013). All participants who were suspected of having prostate cancer (PCa) due to elevated PSA levels or physical examination consented in writing before participating in the study. The study included a total of eighty-one patients, consisting of forty individuals with pathologically confirmed PCa and forty-one patients with BPH. Table 1 displays the clinical characteristics of the individuals involved in the study. All serum samples were obtained perioperatively from patients undergoing transurethral resection of the prostate (TURP) for BPH or robot-assisted laparoscopic prostatectomy (RALP) for PCa at Turku University Hospital (TYKS) between 2021 and 2022. After an overnight fast, blood samples were collected during the aforementioned procedures (RALP and TURP) under general or spinal anesthesia. Explicitly, blood samples were taken using a peripheral cannula placed routinely for intravenous infusion during operation. Next, samples were centrifuged for 12 min at 3800–4000 rpm at room temperature. Serum samples were then collected and stored in a −80 °C freezer prior to the NMR experiment.
Table 1 Clinical data of the individuals included in the study
|
|
BPH group (n = 41) |
PCa group (n = 40) |
| Median (range) |
Median (range) |
| Age (years) |
74.4 (66.2–85.2) |
66.2 (48.1–72.3) |
| BMI (kg m−2) |
25.2 (18.7–30.7) |
27.1 (21.3–31.3) |
| Preop PSA (ng mL−1) |
3.4 (0.025–35) |
7.9 (2.4–30) |
| Number of cores |
N/A |
14 (3–31) |
| Positive cores |
N/A |
0 (0–2) |
| Grade group |
N/A |
3 (2–5) |
2.2
1H-NMR spectroscopy
2.2.1 Reagents.
All chemicals used for NMR experiments were analytical grade. Sodium (3-trimethylsilyl)-2,2,3,3-tetradeuteriopropionate (TSP) was obtained from Alfa Aesar. Sodium chloride (NaCl), deuterium oxide (D2O), sodium phosphate monobasic (NaH2PO4), and sodium phosphate dibasic (Na2HPO4) were purchased from Sigma-Aldrich.
2.2.2 Measurement.
Serum samples were thawed at room temperature, transferred into Eppendorf tubes, and then centrifuged for 10 min at 3000 rpm to remove any possible precipitates. Aliquots of 300 μL serum samples were then mixed with phosphate buffer (0.2 M Na2HPO4/0.04 M NaH2PO4 of pH 7.4, 0.8% w/v NaCl, 1 mM TSP, and D2O) to a final volume of 600 μL. Next, samples were vortexed and then the supernatant was transferred into 5 mm NMR tubes. Lastly, the tubes were capped and labelled prior to NMR acquisition. NMR experiments were carried out using a 600 MHz NMR spectrometer (AVANCE III, Bruker, Germany) equipped with a liquid nitrogen cooled Prodigy TCI (inverted CryoProbe) at 298 K. Line-broadening effect coming from proteins and lipids was minimized using a Carr–Purcell–Meiboom–Gill (CPMG) pulse sequence with a fixed receiver-gain value. The delay time, often referred to as τ (tau), between the π-pulses determines how effectively the sequence can suppress unwanted signals while maintaining the integrity of metabolite signals. This parameter is crucial because different metabolites exhibit different T2 relaxation times. If the delay time is too short or too long relative to the T2 of the metabolites of interest, it may either over-suppress the metabolite signals or fail to adequately suppress the signals from proteins and lipids.26
2.3 Statistical analysis
2.3.1 Data preprocessing.
PepsNMR (Package Extensive Pre-processing Strategy for NMR data), a statistical software package written in R, was employed to perform pre-processing of the raw FID data using a fully automated preprocessing pipeline (Fig. 1).27
 |
| | Fig. 1 Preprocessing flow chart. | |
2.3.2 Data analysis.
PCA was used to explore the binned spectra with the aim of looking for hidden patterns among the two studied groups (PCa and BPH) using PLS Toolbox version 9.0. Discriminant analysis was also carried out in Python with the use of logistic regression (LR) to discriminate PCa from BPH. ASICS (Automatic Statistical Identification in Complex Spectra), an R statistical package which is based on a library of pure metabolites spectra, was used for metabolites identification and relative quantification. The identification of metabolites is achieved by comparing the spectra of the mixture to the pure spectra.28 The Kruskal–Wallis test was utilized to compare the relative concentrations of metabolites in PCa and BPH.
3. Results and discussion
3.1 Data preprocessing
The raw FIDs were imported into R, resulting into two datasets containing the complex FID signals and the Bruker acquisition parameters. Fig. S1† illustrates the real part of the FID signal, which is a complex time domain signal comprising all the information in an NMR spectrum, yet it is challenging to interpret the information in this format. Fig. 2A and B displays a zoomed-in view of the FID, both before and after the removal of the group delay, which is also referred to as the death time. The death time is around 5 μs with very small intensities before the actual FID starts.27 In other words, the group delay introduces a 1st order phase error, which can be corrected by removing the group delay from the FID. To remove the variability of solvent (water) residuals from the spectrum, which can obscure informative signals from other interesting compounds, the FIDs are then preprocessed using a Whittaker smoother. The estimated solvent residuals signal, along with the FID signal both before and after its removal, are displayed in Fig. 2C and D. More insightful data about the target molecules is revealed by eliminating these residuals. Apodization is another crucial step that is used to enhance the signal-to-noise ratio and minimize artifacts, ensuring that the final spectrum accurately represents the underlying data. Zero filling is also applied to the FIDs before Fourier transformation. This process involves padding the time-domain data with zeros, which increases the number of data points in the frequency domain, thereby improving the resolution and allowing for more accurate peak identification.27,29
 |
| | Fig. 2 Zoomed FID with group delay (A), after group delay removal (B), FID spectrum with (C) and without solvent residuals signal (D). | |
The FIDs are then converted into spectra in the frequency domain with the help of Fourier transform (Fig. 3A), which offers a typical solution for converting the complex signal into a complex spectrum. This is done by extracting and transforming each signal into peaks in a spectrum with precise intensities, positions, and widths which depend on the amplitude of the signal, frequency, and relaxation time. The obtained spectra can still have a 0th order phase error of a certain angle φ0 which is independent of the spectral frequencies. This step is resolved by automatically finding an optimal φ0 which shifts the spectrum into its pure absorptive mode (Fig. 3B). Consequently, the NMR spectra are referenced with TSP (Fig. S2†), a common reference compound whose chemical shift is conventionally set to 0 ppm. This issue is achieved by detecting the peak of TSP in each spectrum and shifting its chemical shift to 0 ppm. Fig. 3C and D displays an NMR spectrum before and after baseline correction which was performed using asymmetric least squares (AsLS) smoothing which allows flexible baseline estimation with rapid and reproducible results. This step guarantees the removal of artifacts using a suitable approach with the purpose of improving the warping efficiency. NMR spectra might still have negative values at particular frequency values even after phase and baseline correction. These values must be set to zero as they cannot be explained properly. Next, the spectra are then globally aligned. This step removes variations in experimental conditions (e.g., pH, temperature, or concentration), peak shifts, or misalignment between identical peaks from different spectra. The warping technique integrated in PepsNMR enhances the resemblance between peaks using shifts, stretches and/or compressions along their horizontal axis. Fig. 3E and F illustrates an NMR spectrum before and after binning or bucketing, a data reduction technique used to reduce the m original spectral intensities (32768 data points) into n predefined buckets (81 buckets) using rectangular integration. The high dimensions of the data and small shifts of peaks can hinder multivariate analysis. This step evokes a trade-off between correcting the small remaining deviations in shifts of peaks, decreasing the total number of features, and keeping the whole spectral information. Region removal was employed to cut off the region (4.5–5.1 ppm) where the water resonance residuals are located. Finally, each spectrum was normalized by quantile normalization which attempts to achieve the same distribution of feature intensities across all spectra.30
 |
| | Fig. 3 Frequency domain signal (spectrum) after Fourier transform (A) and (B) after zero-order phase correction. NMR spectrum before (C) and after the estimation and (D) removal of the baseline (in red). NMR spectrum before (E) and after bucketing (F). | |
3.2 Analysis on buckets
3.2.1 Principal component analysis.
The preprocessed spectra were imported into the PLS Toolbox, mean centered and columns with all zeros were removed. PCA was then applied to explore the potential hidden patterns present in the data. Fig. 4A shows that the first five principal components (PC1–PC5), 43.57, 22.59, 8.95, 5.94, 4.37% respectively, explained the total variance, respectively. Also, their cumulative percentage of variance is 85.43%. Fig. 4B displays the score plot between PC1 and PC7, the main components separating the two studied groups. It can be observed that the BPH samples are grouped in the positive values of PC1 and the negative values of PC7, while PCa samples are surrounding the BPH samples in these two components. Fig. 4C and D show the loadings of PC1 and PC7 versus the original variables (buckets).
 |
| | Fig. 4 Variance explained (%) versus PCs (A), score plot of PC1 versus PC7 (B), loadings of PC1 (C) and PC7 (D) with the buckets colored in red black for BPH and PCa samples, respectively. | |
3.2.2 Model development.
The data was split into training and testing sets with a test size of 25%. A logistic regression model was then trained on the training set using a repeated cross validation (CV) approach with a number of repetitions of one hundred and a number of splits of five. Next, the testing set was used to predict the output classes and evaluate the performance of the model using a confusion matrix. Tables 2 and 3 show the average confusion matrix and classification report of the logistic regression model using the above-mentioned CV approach and testing set. The misclassification rates or error rates are around 14.3% in CV and testing set and was calculated as the number of all incorrect predictions divided by the total number of predictions. Additionally, important information about accuracy, precision and recall can also be obtained from Table 3, these metrics are essential to assess the robustness of the classification model. The average recalls or non-error rates are 87% and 85.5%, precisions are 86.5% and 86% and accuracies are 87% and 86% in cross-validation and testing indicating that the model performed well on the training and testing sets.
Table 2 Confusion matrix of LR obtained in cross-validation
|
|
Actual |
Predicted |
| BPH |
PCa |
| Training set |
BPH |
19 |
3 |
| PCa |
4 |
23 |
| Testing set |
BPH |
8 |
1 |
| PCa |
2 |
10 |
Table 3 Classification report calculated from Table 1
|
|
Precision |
Recall |
Accuracy |
F1-score |
| Training set (cross-validation) |
BPH |
0.84 |
0.87 |
0.87 |
0.86 |
| PCa |
0.89 |
0.87 |
0.87 |
0.88 |
| Testing set |
BPH |
0.89 |
0.80 |
0.86 |
0.84 |
| PCa |
0.83 |
0.91 |
0.86 |
0.87 |
3.3 Analysis on relative concentrations
Table 4 presents data on 31 metabolites, among which 12 showed a p-value of less than 0.05 while the other 19 displayed an even stronger significance with a p-value of less than 0.0001. These 19 metabolites (Fig. 5 and S3†), highlighted in bold, provide strong evidence against the null hypothesis. A p-value of less than 0.0001 suggests that, under the null hypothesis, the probability of observing such extreme differences in relative concentrations by chance alone would be less than 0.01%, indicating strong statistical significance. However, it is worth mentioning that statistical significance does not necessarily imply practical significance or real-world relevance. Among them, lactate which showed a significant increase in PCa compared to BPH similar to other studies that reported this result in tissue samples.31,40 Myo-inositol was found to be decreasing towards the progression of the disease. Similarly, several studies reported a decreased level of this compound in PCa compared to non-cancer specimens in biopsy, expressed prostatic fluid, and urine supernatant.31 Levels of glutamate, formate and acetoacetate were found to be significantly increased in the patients with cancer when compared with benign groups, consistent with another study where serum samples from BPH and PCa (Gleason score 5 and 7) were used to identify biomarkers using gel electrophoresis and NMR.37 The levels of acetone also increases in serum of PCa patients and it is in agreement with its increase in urine.54 A significant decrease of ethanolamine in PCa compared with BPH was also observed in this study as well as in tissue samples.49,50 Besides, creatine was found to be decreasing in serum of PCa patients as well as in tissue samples.55 Spermidine decreased in serum of PCa patients compared to BPH, however its regulation in other biological samples such as tissue is not clear. Additionally, various studies reported its decrease and increase in tissue.45,56 Methylguanidine was also identified in serum as well as in urine samples.57 It was characterized by a singular peak around 2.85 ppm and was one of the top twenty metabolites discriminating PCa and BPH according to their variable importance in projection (VIP). Glycerophosphocholine was also increased in the serum of PCa patients compared to the BPH ones, consistent with findings in prostate cancer tissue.58,59 Isovaleric acid levels were observed to be elevated in prostate cancer (PCa) samples compared to benign prostatic hyperplasia (BPH) cases. This increase may be associated with the characteristic odor or could potentially be indicative of other conditions, including PCa.32,33 Ethylmalonic acid levels were found to be higher in PCa samples. Additionally, ethylmalonic acid, 5-hydroxymethyl-2-furoic acid, and pyroglutamic acid have been identified as biomarkers capable of distinguishing between PCa cases with prostate-specific antigen (PSA) levels below 4.0 ng mL−1 and those with PSA levels above 4.0 ng mL−1, demonstrating high sensitivity and specificity.34 Quinolinic acid was also found to be significantly higher in serum as well as in urine from PCa compared with BPH patients.36 Levels of phenylalanine were also increased in the serum of PCa compared with BPH in the same way in the blood of patients diagnosed with bone metastasis compared to healthy volunteers.38 Similarly, adenine was found to be increasing in PCa compared to BPH.60 Uracil was also increased in serum as well as tissue61 of PCa compared with BPH. In the same way, kynurenic acid displayed a significant increase in serum of PCa as well as urine compared to BPH.41 Histidine and lysine were decreased in the serum of PCa compared with BPH. The changes of these metabolites were more noticeable in tissue samples than serum and urine.47 Unlike leucine that showed an increasing level in PCa. Similar results were reported,31 in contrast to other studies that reported a decreasing levels of leucine.47 Glutamine was found to be decreasing in serum of PCa patients and it is in agreement with other studies.31,47 Citrulline was also found to be decreasing in PCa.52,62N-Acetylglycine was increase in the case of PCa compared with BPH as well as in lethal prostate cancer versus matched case controls.35O-Acetyl-L-carnitine levels were also found to be lower in PCa compared to BPH. This finding aligns with results from another study, which reported higher levels of O-acetyl-L-carnitine in individuals without cancer. These observations suggest a potential protective role for O-acetyl-L-carnitine against PCa.51 Other metabolites were also found to be different in the two studied groups include choline chloride, 1,3-diaminopropane and 2-deoxyguanosine. Notably, the oxidized form of 2-deoxyguanosine, known as 8-hydroxy-2′-deoxyguanosine, has been found to be associated with PCa.48 While the statistical analysis of our data has identified a set of metabolites that exhibit strong evidence against the null hypothesis, it's important to note that their reliability may face challenges when subjected to validation studies utilizing samples from diverse geographical or clinical sites. These findings are based on the analysis of a specific dataset, and their practical significance in real-world clinical settings remains to be established. We recognize the need for cautious interpretation and the importance of validating these results in subsequent studies.
Table 4 Significant metabolite biomarkers found in the serum of PCa and BPH groups
| No. |
HMDB ID |
Metabolite |
Regulation (PCa vs. BPH) |
p-Value |
References |
| 1 |
HMDB0000190 |
Lactate |
↑ |
0.001 |
31
|
| 2 |
HMDB0000718 |
Isovaleric acid |
↑ |
0.000 |
32 and 33 |
| 3 |
HMDB0000086 |
Glycerophosphocholine |
↑ |
0.045 |
31
|
| 5 |
HMDB0000622 |
Ethylmalonic acid |
↑ |
0.000 |
34
|
| 6 |
HMDB0000532 |
N-Acetylglycine |
↑ |
0.031 |
35
|
| 7 |
HMDB0000232 |
Quinolinic acid |
↑ |
0.005 |
36
|
| 8 |
HMDB0000060 |
Acetoacetate |
↑ |
0.000 |
35
|
| 9 |
HMDB0000148 |
L-Glutamic acid |
↑ |
0.000 |
37 and 38 |
| 10 |
HMDB0000159 |
L-Phenylalanine |
↑ |
0.005 |
38 and 39 |
| 11 |
HMDB0001659 |
Acetone |
↑ |
0.000 |
40
|
| 12 |
HMDB0000300 |
Uracil |
↑ |
0.024 |
31 and 41 |
| 13 |
HMDB0000715 |
Kynurenic acid |
↑ |
0.001 |
41
|
| 14 |
HMDB0000142 |
Formate |
↑ |
0.000 |
37
|
| 15 |
HMDB0000002 |
1,3-Diaminopropane |
↓ |
0.000 |
N/A |
| 16 |
HMDB0000034 |
Adenine |
↑ |
0.047 |
42 and 43 |
| 17 |
HMDB0001257 |
Spermidine |
↓ |
0.000 |
44 and 45 |
| 18 |
HMDB0000510 |
2-Aminoadipic acid |
↑ |
0.000 |
46
|
| 19 |
HMDB0000064 |
Creatine |
↓ |
0.000 |
40
|
| 20 |
HMDB0000211 |
Myo-inositol |
↓ |
0.000 |
31
|
| 21 |
HMDB0000687 |
L-Leucine |
↑ |
0.004 |
31 and 47 |
| 22 |
HMDB0000056 |
Beta-alanine |
↓ |
0.000 |
N/A |
| 23 |
HMDB0000085 |
2-Deoxyguanosine |
↑ |
0.000 |
48
|
| 24 |
HMDB0000097 |
Choline chloride |
↓ |
0.000 |
N/A |
| 25 |
HMDB0000182 |
L-Lysine |
↓ |
0.000 |
47
|
| 26 |
HMDB0000149 |
Ethanolamine |
↓ |
0.000 |
49 and 50 |
| 27 |
HMDB0000201 |
O-Acetyl-L-carnitine |
↓ |
0.000 |
51
|
| 28 |
HMDB0001522 |
Methylguanidine |
↓ |
0.000 |
N/A |
| 29 |
HMDB0000177 |
L-Histidine |
↓ |
0.000 |
47
|
| 30 |
HMDB0000641 |
L-Glutamine |
↓ |
0.033 |
31 and 47 |
| 31 |
HMDB0000904 |
L-Citrulline |
↓ |
0.002 |
52 and 53 |
 |
| | Fig. 5 Box plots showing the highly significantly different metabolites in PCa and BPH. | |
Metabolic pathway analysis conducted through MetaboAnalyst has identified significant alterations (p < 0.05) in seven pathways in PCa, highlighting substantial metabolic changes that are intricately linked with the development and progression of disease. These pathways include beta-alanine metabolism glycerophospholipid metabolism, arginine and proline metabolism, butanoate metabolism, pantothenate and CoA biosynthesis, glutathione metabolism phenylalanine, tyrosine and tryptophan biosynthesis (Fig. 6), suggest a metabolic change that is characteristic of cancerous cells. These alterations reflect the increased metabolic demands of proliferating cancer cells, which often undergo shifts in energy production, biosynthesis, and redox balance to sustain rapid growth. For instance, the upregulation of pathways like glycerophospholipid metabolism and glutathione metabolism may be indicative of enhanced membrane biosynthesis and an increased need for antioxidant defense mechanisms, respectively, both of which are critical for cancer cell survival and proliferation. Moreover, the significant changes in metabolites such as lactate, which is elevated in many cancers due to the Warburg effect, and amino acids like L-glutamic acid and L-phenylalanine, underscore the altered amino acid metabolism that supports the biosynthetic and bioenergetic needs of cancer cells. These metabolic shifts are not just a consequence of cancer but may actively contribute to the oncogenic process by promoting cell survival, growth, and metastasis.63
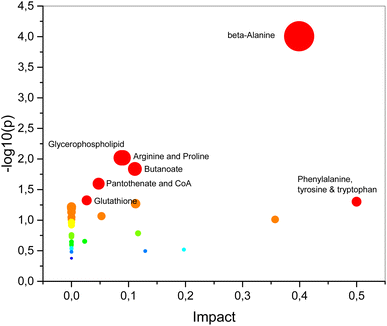 |
| | Fig. 6 Pathway analysis conducted with MetaboAnalyst 6.0 identified seven significant metabolic pathways. | |
3.4 Comparison of serum and urine results64
In this section, we compared findings from our previous urine analysis64 with the current serum analysis, both conducted on the same patient cohort. Purposes of both works are to identify metabolites differentiating PCa from BPH and to explore the similarities and differences between the metabolic profiles of these two biological fluids. Acetone was consistently elevated in both serum and urine, suggesting a systemic alteration in lipid metabolism associated with PCa. Uracil increased in serum but decreased in urine, while L-citrulline showed the opposite trend, reflecting different metabolic mechanisms in these two fluids. Similarly, 2-aminoadipic acid increased in serum but decreased in urine, indicating distinct regulatory mechanisms depending on the biological fluid. Pathway analysis revealed significant but differing alterations in cancer-related metabolic pathways. Serum showed changes in glycerophospholipid and glutathione metabolism, while urine exhibited alterations in glyoxylate metabolism and the TCA cycle. These differences underscore the complex nature of cancer metabolism, with distinct processes occurring at the systemic level versus the local or excretory level.
4. Conclusion
In an attempt to screen PCa, 1H-NMR-based metabolomics was employed to highlight the metabolic differences in serum samples between PCa and BPH. The methodology includes spectral preprocessing, encompassing 81 NMR buckets, then underwent analysis via PCA, aiming to underline specific variables/buckets that held potential in distinguishing between PCa and BPH. Further analysis using a supervised logistic regression model, subjected to both CV and testing evaluations, yielded impressive average recalls of 87% and 85.5%, precisions of 86.5% and 86%, and accuracies of 87% and 86%, respectively. These metrics indicate robustness and potential applicability of the model to new and unseen data. Furthermore, this study unveiled several potential biomarkers via an untargeted 1H-NMR metabolomics approach. Future studies with larger sample sizes are essential for further validation.
Data availability
Data for this article, including raw FIDs and processed spectra are available at internal storage of the Åbo Akademi University (https://pchome2.abo.fi/pchome2). The data supporting this article have been included as part of the ESI.† The data analysis scripts of this article are available in the interactive notebook at 1H-NMR serum. Data collected from human participants, described in the Experiment section of the manuscript, are not available for confidentiality reasons.
Conflicts of interest
There are no conflicts to declare.
Acknowledgements
T.-P. H. acknowledges the Liv och Hälsa Foundation, Academy of Finland (Grant No. 323240 and 331774) and the FICORE (Indian Finnish Consortia for Research and Education) for financial support. We, the authors, wish to thank Turku Prostate Cancer Consortium (TPCC) for providing clinical samples. Our appreciation also goes to Ms. Pauliina Toivonen for collecting clinical samples along with patients' information.
References
- J. Ferlay, M. Colombet, I. Soerjomataram, D. M. Parkin, M. Piñeros, A. Znaor and F. Bray, Int. J. Cancer, 2021, 149, 778–789 CrossRef CAS PubMed.
- J. N. Eskra, D. Rabizadeh, C. P. Pavlovich, W. J. Catalona and J. Luo, Prostate Cancer Prostatic Dis., 2019,(22), 362–381 CrossRef PubMed.
- J. T. Kearns and D. W. Lin, Curr. Urol. Rep., 2018, 19, 1–4 CrossRef PubMed.
- A. R. Lima, J. Pinto, F. Amaro, M. d. L. Bastos, M. Carvalho and P. Guedes De Pinho, Metabolites, 2021, 11, 181 CrossRef CAS PubMed.
- K. S. Louie, A. Seigneurin, P. Cathcart and P. Sasieni, Ann. Oncol., 2015, 26, 848–864 CrossRef CAS PubMed.
- M. Djulbegovic, R. J. Beyth, M. M. Neuberger, T. L. Stoffs, J. Vieweg, B. Djulbegovic and P. Dahm, BMJ, 2010, 341, 593 CrossRef PubMed.
- E. Killick, E. Bancroft, Z. Kote-Jarai and R. Eeles, Clin. Oncol., 2012, 24, 545–555 CrossRef CAS PubMed.
- Y. J. Lee, J. E. Park, B. R. Jeon, S. M. Lee, S. Y. Kim and Y. K. Lee, Ann. Lab. Med., 2013, 33, 233–241 CrossRef PubMed.
- A. B. Furlan, R. Kato, F. Vicentini, J. Cury, A. A. Antunes and M. Srougi, International Brazilian Journal of Urology, 2008, 34, 572–576 CrossRef PubMed.
- A. B. Galosi, E. Palagonia, S. Scarcella, A. Cimadamore, V. Lacetera, R. F. Delle Fave, A. Antezza and L. Dell'Atti, Arch. Ital. Urol. Androl., 2021, 93, 92–100 CrossRef CAS PubMed.
- N. Hübner, S. Shariat and M. Remzi, Curr. Opin. Urol., 2018, 28, 354–359 CrossRef PubMed.
- C. J. Das, A. Razik, S. Sharma and S. Verma, Clin. Radiol., 2019, 74, 853–864 CrossRef CAS PubMed.
- C. R. Marchand, F. Farshidfar, J. Rattner and O. F. Bathe, Metabolites, 2018, 8, 59 CrossRef PubMed.
- D. D. Marshall and R. Powers, Prog. Nucl. Magn. Reson. Spectrosc., 2017, 100, 1–16 CrossRef CAS PubMed.
- Y. Munjal, R. K. Tonk and R. Sharma, Syst. Rev. Pharm., 2022, 13, 550–556 Search PubMed.
- K. Segers, S. Declerck, D. Mangelings, Y. Vander Heyden and A. Van Eeckhaut, Bioanalysis, 2019, 11, 2297–2318 CrossRef CAS PubMed.
- T. W. M. Fan and A. N. Lane, Prog. Nucl. Magn. Reson. Spectrosc., 2016, 92–93, 18–53 CrossRef CAS PubMed.
- T. Gebregiworgis and R. Powers, Comb. Chem. High Throughput Screening, 2012, 15, 595–610 CrossRef CAS PubMed.
- A. K. Kosmides, K. Kamisoglu, S. E. Calvano, S. A. Corbett and I. P. Androulakis, Crit. Rev. Biomed. Eng., 2013, 41, 205–221 CrossRef PubMed.
- A. Smolinska, L. Blanchet, L. M. C. Buydens and S. S. Wijmenga, Anal. Chim. Acta, 2012, 750, 82–97 CrossRef CAS PubMed.
- M. Zniber, P. Vahdatiyekta and T. P. Huynh, Biosens. Bioelectron., 2023, 219, 114810 CrossRef CAS PubMed.
- P. Alonso-Moreno, I. Rodriguez and J. L. Izquierdo-Garcia, Metabolites, 2023, 13, 614 CrossRef CAS PubMed.
- G. A. Nagana Gowda and D. Raftery, Methods Mol. Biol., 2019, 2037, 3–14 CrossRef CAS PubMed.
- A. A. Crook and R. Powers, Molecules, 2020, 25, 5128 CrossRef CAS PubMed.
- A. H. Emwas, R. Roy, R. T. McKay, L. Tenori, E. Saccenti, G. A. Nagana Gowda, D. Raftery, F. Alahmari, L. Jaremko, M. Jaremko and D. S. Wishart, Metabolites, 2019, 9, 123 CrossRef CAS PubMed.
- N. J. Rankin, D. Preiss, P. Welsh, K. E. V. Burgess, S. M. Nelson, D. A. Lawlor and N. Sattar, Atherosclerosis, 2014, 237, 287 CrossRef CAS PubMed.
- M. Martin, B. Legat, J. Leenders, J. Vanwinsberghe, R. Rousseau, B. Boulanger, P. H. C. Eilers, P. De Tullio and B. Govaerts, Anal. Chim. Acta, 2018, 1019, 1–13 CrossRef CAS PubMed.
- G. Lefort, L. Liaubet, C. Canlet, P. Tardivel, M. C. Père, H. Quesnel, A. Paris, N. Iannuccelli, N. Vialaneix, R. Servien and J. Kelso, Bioinformatics, 2019, 35, 4356–4363 CrossRef PubMed.
- A. Ebel, W. Dreher and D. Leibfritz, J. Magn. Reson., 2006, 182, 330–338 CrossRef CAS PubMed.
- S. M. Kohl, M. S. Klein, J. Hochrein, P. J. Oefner, R. Spang and W. Gronwald, Metabolomics, 2012, 8, 146 CrossRef CAS PubMed.
- B. J. Trock, Urol. Oncol.: Semin. Orig. Invest., 2011, 29, 572–581 CrossRef CAS PubMed.
- M. Wagenstaller and A. Buettner, Metabolites, 2013, 3, 637–657 CrossRef CAS PubMed.
- T. L. Perry, S. Hansen, S. Diamond, B. Bullis, C. Mok and S. B. Melançon, Clin. Chim. Acta, 1970, 29, 369–374 CrossRef CAS PubMed.
- J. He, Z. Han, W. Luo, J. Shen, F. Xie, L. Liao, G. Zou, X. Luo, Z. Guo, Y. Li, J. Li and H. Chen, Front. Immunol., 2023, 13, 998447 CrossRef PubMed.
- J. Huang, A. M. Mondul, S. J. Weinstein, A. Derkach, S. C. Moore, J. N. Sampson and D. Albanes, Int. J. Cancer, 2019, 145, 3231–3243 CrossRef CAS PubMed.
- D. Drago, A. Andolfo, E. Mosca, A. Orro, L. Nocera, V. Cucchiara, M. Bellone, F. Montorsi and A. Briganti, Cancer Biol. Med., 2021, 18, 604 CrossRef CAS PubMed.
- Y. Fan, T. B. Murphy, J. C. Byrne, L. Brennan, J. M. Fitzpatrick and R. W. G. Watson, J. Proteome Res., 2011, 10, 1361–1373 CrossRef CAS PubMed.
- E. Thysell, I. Surowiec, E. Hörnberg, S. Crnalic, A. Widmark, A. I. Johansson, P. Stattin, A. Bergh, T. Moritz, H. Antti and P. Wikström, PLoS One, 2010, 5, e14175 CrossRef CAS PubMed.
- L. Lécuyer, A. Victor Bala, A. Demidem, A. Rossary, N. Bouchemal, M. N. Triba, P. Galan, S. Hercberg, V. Partula, B. Srour, P. Latino-Martel, E. Kesse-Guyot, N. Druesne-Pecollo, M. P. Vasson, M. Deschasaux-Tanguy, P. Savarin and M. Touvier, Metabolomics, 2021, 17, 1–10 CrossRef PubMed.
- B. Madhu, G. L. Shaw, A. Y. Warren, D. E. Neal and J. R. Griffiths, Metabolomics, 2016, 12, 1–11 CrossRef CAS PubMed.
- G. Gkotsos, C. Virgiliou, I. Lagoudaki, C. Sardeli, N. Raikos, G. Theodoridis and G. Dimitriadis, Metabolites, 2017, 7, 9 CrossRef PubMed.
- D. Kumar, A. Gupta, A. Mandhani and S. N. Sankhwar, Prostate, 2016, 76, 1106–1119 CrossRef CAS PubMed.
- A. M. Mondul, S. C. Moore, S. J. Weinstein, E. D. Karoly, J. N. Sampson and D. Albanes, Int. J. Cancer, 2015, 137, 2124–2132 CrossRef CAS PubMed.
- G. F. Giskeødegård, H. Bertilsson, K. M. Selnæs, A. J. Wright, T. F. Bathen, T. Viset, J. Halgunset, A. Angelsen, I. S. Gribbestad and M. B. Tessem, PLoS One, 2013, 8, e62375 CrossRef PubMed.
- M. K. Andersen, G. F. Giskeødegård and M. B. Tessem, Curr. Opin. Endocr. Metab. Res., 2020, 10, 23–28 CrossRef CAS.
- A. R. Lima, M. d. L. Bastos, M. Carvalho and P. Guedes de Pinho, Transl. Oncol., 2016, 9, 357–370 CrossRef PubMed.
- H. Zheng, B. Dong, J. Ning, X. Shao, L. Zhao, Q. Jiang, H. Ji, A. Cai, W. Xue and H. Gao, Clin. Chim. Acta, 2020, 501, 241–251 CrossRef CAS PubMed.
- L. Kumar, S. Kumar and S. Agarwal, Journal of Integrative Nephrology and Andrology, 2017, 4, 55 CrossRef.
- K. R. Keshari, H. Tsachres, R. Iman, L. Delos Santos, Z. L. Tabatabai, K. Shinohara, D. B. Vigneron and J. Kurhanewicz, NMR Biomed., 2011, 24, 691–699 CrossRef CAS PubMed.
- M. G. Swanson, K. R. Keshari, Z. L. Tabatabai, J. P. Simko, K. Shinohara, P. R. Carroll, A. S. Zektzer and J. Kurhanewicz, Magn. Reson. Med., 2008, 60, 33–40 CrossRef CAS PubMed.
- D. Baci, A. Bruno, C. Cascini, M. Gallazzi, L. Mortara, F. Sessa, G. Pelosi, A. Albini and D. M. Noonan, J. Exp. Clin. Cancer Res., 2019, 38, 1–17 CrossRef CAS PubMed.
- J. A. Schmidt, G. K. Fensom, S. Rinaldi, A. Scalbert, P. N. Appleby, D. Achaintre, A. Gicquiau, M. J. Gunter, P. Ferrari, R. Kaaks, T. Kühn, A. Floegel, H. Boeing, A. Trichopoulou, P. Lagiou, E. Anifantis, C. Agnoli, D. Palli, M. Trevisan, R. Tumino, H. B. Bueno-de-Mesquita, A. Agudo, N. Larrañaga, D. Redondo-Sánchez, A. Barricarte, J. M. Huerta, J. R. Quirós, N. Wareham, K. T. Khaw, A. Perez-Cornago, M. Johansson, A. J. Cross, K. K. Tsilidis, E. Riboli, T. J. Key and R. C. Travis, BMC Med., 2017, 15, 1–14 CrossRef PubMed.
- M. A. Fernández-Peralbo, E. Gómez-Gómez, M. Calderón-Santiago, J. Carrasco-Valiente, J. Ruiz-García, M. J. Requena-Tapia, M. D. Luque De Castro and F. Priego-Capote, Sci. Rep., 2016, 6, 38243 CrossRef PubMed.
- A. R. Lima, J. Pinto, D. Barros-Silva, C. Jerónimo, R. Henrique, M. d. L. Bastos, M. Carvalho and P. Guedes Pinho, Metabolomics, 2020, 16, 1–9 CrossRef PubMed.
- B. Madhu, G. L. Shaw, A. Y. Warren, D. E. Neal and J. R. Griffiths, Metabolomics, 2016, 12, 1–11 CrossRef CAS PubMed.
- G. F. Giskeødegård, H. Bertilsson, K. M. Selnæs, A. J. Wright, T. F. Bathen, T. Viset, J. Halgunset, A. Angelsen, I. S. Gribbestad and M. B. Tessem, PLoS One, 2013, 8, e62375 CrossRef PubMed.
- B. Yang, C. Zhang, S. Cheng, G. Li, J. Griebel and J. Neuhaus, Diagnostics, 2021, 11, 149 CrossRef CAS PubMed.
- J. J. A. Van Asten, V. Cuijpers, C. Hulsbergen-Van De Kaa, C. Soede-Huijbregts, J. A. Witjes, A. Verhofstad and A. Heerschap, Magn. Reson. Mater. Phys., Biol. Med., 2008, 21, 435–442 CrossRef CAS PubMed.
- M. G. Swanson, D. B. Vigneron, Z. L. Tabatabai, R. G. Males, L. Schmitt, P. R. Carroll, J. K. James, R. E. Hurd and J. Kurhanewicz, Magn. Reson. Med., 2003, 50, 944–954 CrossRef CAS PubMed.
- D. Kumar, A. Gupta, A. Mandhani and S. N. Sankhwar, Prostate, 2016, 76, 1106–1119 CrossRef CAS PubMed.
- A. Sreekumar, L. M. Poisson, T. M. Rajendiran, A. P. Khan, Q. Cao, J. Yu, B. Laxman, R. Mehra, R. J. Lonigro, Y. Li, M. K. Nyati, A. Ahsan, S. Kalyana-Sundaram, B. Han, X. Cao, J. Byun, G. S. Omenn, D. Ghosh, S. Pennathur, D. C. Alexander, A. Berger, J. R. Shuster, J. T. Wei, S. Varambally, C. Beecher and A. M. Chinnaiyan, Nature, 2009, 457, 910–914 CrossRef CAS PubMed.
- M. A. Fernández-Peralbo, E. Gómez-Gómez, M. Calderón-Santiago, J. Carrasco-Valiente, J. Ruiz-García, M. J. Requena-Tapia, M. D. Luque De Castro and F. Priego-Capote, Sci. Rep., 2016, 6, 1–11 CrossRef PubMed.
- N. Gómez-Cebrián, J. L. Poveda, A. Pineda-Lucena and L. Puchades-Carrasco, Cancers, 2022, 14, 596 CrossRef PubMed.
- M. Zniber, T. Lamminen, P. Taimen, P. J. Boström and T. P. Huynh, Heliyon, 2024, 10, e28949 CrossRef CAS PubMed.
|
| This journal is © The Royal Society of Chemistry 2024 |
Click here to see how this site uses Cookies. View our privacy policy here. 
 Open Access Article
 This Open Access Article is licensed under a
  *
*


