
 Open Access Article
 This Open Access Article is licensed under a Creative Commons Attribution-Non Commercial 3.0 Unported Licence
A simplified lateral flow immunosensor for the assay of carcinoembryonic antigen in low-resource settings†
Ioanna
Tsogka
,
Electra
Mermiga
,
Varvara
Pagkali
,
Christos
Kokkinos
 and
Anastasios
Economou
*
and
Anastasios
Economou
*
Department of Chemistry, National and Kapodistrian University of Athens, Panepistimiopolis 157 71, Greece. E-mail: aeconomo@chem.uoa.gr
First published on 20th April 2024
Abstract
Carcinoembryonic antigen (CEA) is a glycoprotein widely used as a tumor marker. In this work, a colorimetric lateral flow immunosensor is developed for rapid and low-cost quantification of CEA in human blood serum. The immunosensor consists of a glass fiber sample/conjugation pad, a nitrocellulose detection pad and a cellulose absorption pad. The detection is based on a sandwich immunoreaction: the sample/conjugation pad is modified with gold nanoparticles (GNPs)-labeled anti-CEA conjugate probes which bind to the CEA target molecules in the sample and the complexes are captured at capture anti-CEA immobilized at the test line. The color intensity of the test line, measured from a scanned image of the strip, is related to the CEA concentration in the sample. The different assay parameters are studied in detail. The linearity holds from 1.25 to 640 ng mL−1 of CEA, the instrumental and visual limits of detection are 0.45 and 0.63 ng mL−1, respectively, and the total assay time is 15 min. The specificity of the immunoassay versus other cancer biomarkers is satisfactory. The recovery in samples of human serum spiked with CEA is in the range of 81–118% and the coefficient of variation of the method is ≤10%. Results obtained with the lateral flow immunosensor correlated well with a reference radioimmunoassay method (R2 = 0.99). This immunosensor can be readily applied to CEA monitoring at the point-of-care (POC) or in resource-limited settings thanks to its low-cost and simplicity.
1 Introduction
Despite the significant advances made in the medical field in recent years, cancer remains one of the world's biggest and most pressing health problems. According to the World Health Organization (WHO), cancer is the second leading cause of death after cardiovascular diseases, accounting for nearly 10 million deaths every year globally (or nearly one in six deaths).1 20.3 million new cancer cases and 13.2 million deaths due to cancer are predicted for the year 2030 (ref. 2) while by the end of 2023, a grand total of 1![[thin space (1/6-em)]](https://www.rsc.org/images/entities/char_2009.gif) 261990 cancer deaths are predicted in the European Union alone.3 The monitoring of tumor biomarkers has been used for a long time in cancer diagnostics as a tool for early clinical detection, prognosis, checking of recurrence and evaluating the response to therapy.4–6 Carcinoembryonic antigen (CEA) is a glycoprotein involved in cell adhesion and is a universally acknowledged cancer marker (mainly for colorectal, breast, lung and pancreatic cancer).7–9 The conventional cut-off value for CEA is set to 5 ng mL−1.10,11 Since CEA exists in many types of normal epithelial cells, it is present, albeit at low levels (<5 ng mL−1), in the blood of healthy adults. However, high blood serum levels of CEA (>15–20 ng mL−1) are associated with a plethora of carcinomas. Thus, the quantification of CEA enables early diagnosis, assessment and monitoring the recurrence the disease.
261990 cancer deaths are predicted in the European Union alone.3 The monitoring of tumor biomarkers has been used for a long time in cancer diagnostics as a tool for early clinical detection, prognosis, checking of recurrence and evaluating the response to therapy.4–6 Carcinoembryonic antigen (CEA) is a glycoprotein involved in cell adhesion and is a universally acknowledged cancer marker (mainly for colorectal, breast, lung and pancreatic cancer).7–9 The conventional cut-off value for CEA is set to 5 ng mL−1.10,11 Since CEA exists in many types of normal epithelial cells, it is present, albeit at low levels (<5 ng mL−1), in the blood of healthy adults. However, high blood serum levels of CEA (>15–20 ng mL−1) are associated with a plethora of carcinomas. Thus, the quantification of CEA enables early diagnosis, assessment and monitoring the recurrence the disease.
Among the methods used for CEA detection and quantification in human serum, those based on liquid chromatography-mass spectrometry provide low limits of detection and exceptional selectivity but require expensive and bulky instrumentation as well as laboratory facilities.12 In addition, a variety of immunoassays have been developed for detecting CEA in serum, such as radioimmunoassays (RIAs), enzyme-linked immunosorbent assays (ELISA), fluorescence immunoassays, chemiluminescence immunoassays, electrochemical immunoassays and surface-enhanced Raman scattering immunoassays.13–23 However, these assays normally require multiple reagents and several washing steps that increase the complexity of the analytical procedure and the time of the analysis while many of them demand trained personnel, laboratory facilities and complex instrumentation.
On the other hand, lateral flow immunoassays operate on a simplified protocol in which the sample migrates along a strip and the target antigen undergoes an immunoreaction at a narrow test zone modified with a capture antibody, resulting in an analytical signal.24–28 This operational principle has many advantages in terms of the operational characteristics and the analytical features of the assay. Lateral flow immunoassays do not require washing steps or addition of reagents, as they rely on unidirectional spontaneous flow of the sample and on reagents immobilized on the strip. The strips are cost-effective because only minute quantities of expensive biorecognition agents are used while the dry reagents are less prone to deactivation so that these devices have relatively long shelf life in ambient conditions. The assay robustness is usually further ensured by incorporating an internal quality control in the form of a control line. The tight spatial confinement of the biorecognition elements at the narrow test zone on the strip induces a high degree of aggregation of the target species at the test zone leading to high detection sensitivity. On the other hand, adequate selectivity is ensured by judicious choice of target-specific antibodies. The timescale of these tests is determined by the time it takes for the sample to migrate to the test zone and is usually of the order of only a few minutes. In addition, even non-trained personnel, including the end users, can perform the test as only addition of a drop of sample in required. Finally, the transduction of analytical signal can be performed either visually for qualitative evaluation or using simple readers and low-cost commercial devices (scanners and smartphones) for quantitative measurements. Therefore, lateral flow immunoassays are particularly suitable for PoC in resource-limited environments being portable, affordable, robust, user-friendly, simple, sensitive, specific and rapid.
In this study, a colorimetric sandwich-type lateral flow immunoassay is developed for the detection of CEA in human serum. The sample/conjugation pad of the lateral flow strip is modified with gold nanoparticles (GNPs)-labeled anti-CEA conjugates which serve as probes and bind to the CEA target molecules in the sample; the complex is then captured at capture anti-CEA immobilized at the test line. In this work, the focus is on simplifying the construction, reducing the fabrication and operational cost of the biosensor and making it suitable for resource-limited POC settings. GNPS are used as functional signal reporters since their fabrication and their properties are extensively studied and well known.29,30 The construction of the strip is greatly simplified as a single sample/conjugate pad is used. The amount of capture antibodies immobilized at the test line is reduced without compromising the sensitivity. Finally, the prerequisite for low-cost detection is fulfilled, since only a commercial inexpensive office scanner is required for quantification. The lateral flow immunoassay is validated in terms of linearity, limit of detection, matrix effects, reproducibility, accuracy and specificity.
2 Experimental
2.1 Materials and apparatus
All reagents used in this work are of analytical reagent grade. Ultrapure water (>18.2 MΩ cm−1) is obtained using a Water Direct-Q® 3 UV Milli-Q water purification system (Merck Millipore, Burlington, MA, USA). Sucrose, polyethylene glycol (PEG) 20000, polysorbate 20 (Tween 20), Triton X-114, polyvinylpyrrolidone (PVP), sodium hydroxide, boric acid, sodium borate decahydrate (Na2B4O7·10H2O), potassium carbonate, carcinoembryonic antigen (CEA) (from human colon adenocarcinoma cell line), human blood serum (sterile & filtered) and hydrogen tetrachloroaurate(III)trihydrate (HAuCl4·3H2O, ≥99.9%) are purchased from Sigma Aldrich (St. Louis, MO, USA). Ficoll F-400 (Mr 400000) is from Sigma and Ficoll F-70 (Mr 70000) is from Santa Cruz Biotechnology (Dallas, TX). Nitric acid 65%, potassium chloride, sodium chloride, potassium dihydrogen phosphate, disodium hydrogen phosphate and sodium citrate dihydrate (Na3C6H5O7·2H2O) are obtained from Chem-Lab (Zedelgem, Belgium). Bovine serum albumin (BSA) is from Thermo Scientific (Waltham, MA, USA), hydrochloric acid 30% is from Merck (Darmstadt, Germany) and sodium dodecyl sulfate (SDS) is from Honeywell Fluka (Charlotte, NC, USA). Cancer antigen 125 (from human ascites fluid adenocarcinoma) and cancer antigen 19-9 (from Human Metastatic Liver Carcinoma) are purchased from Medix Biochemica (Espoo, Finland).
The antibodies utilized as biorecognition elements are the monoclonal anti-h CEA 5909 SP-5 (as reporter antibody conjugated to GNPs), the anti-h CEA 5910 SPTN-5 (as capture antibody immobilized at the test line) and are purchased from Medix Biochemica (Espoo, Finland). The polyclonal goat anti-Mouse IgG (IgG AP124 Gt X Ms) serves as the capture antibody at the control line and is purchased from Merck (Darmstadt, Germany). The stock antibody solutions are diluted with a 20 mM phosphate buffer saline (PBS) (pH 7.4) before dispensing at the detection and control lines.
Standard CEA solutions are prepared in running buffer (50 mM PBS, 0.5% (w/v) Tween-20, 1% (w/v) BSA, 5% (w/v) sucrose, 0.6% (w/v) PEG), obtaining different analyte concentrations: 0.625, 1.25, 2.5, 5, 10, 20, 40, 80, 160, 320, 640 and 1280 ng mL−1.
Syringe filters with a pore diameter of 0.20 μm are provided by Macherey-Nagel (Dueren, Germany). All the materials used for the fabrication of the immunosensor pad are purchased from Whatman Cytiva (Little Chalfont, Buckinghamshire, UK): nitrocellulose membranes Immunopore FP (5 μm, 25 mm × 50 m, 140–200 s/4 cm) and Immunopore RP (8 μm, 25 mm × 50 m, 90–150 s/4 cm) as the detection pads, STANDARD 17 bound glass fiber (34.5 s/4 cm, 22 mm × 50 m) as the sample/conjugate pad and chromatography paper 3 mm CHR (as the absorbent pad).
A Shimadzu UV-1800 (Kyoto, Japan) spectrophotometer is used to obtain the UV-vis absorption spectra of GNPs. The stirrer and the centrifuge are from Witeg (Wertheim, Germany). A semi-automatic sample dispenser (Camag Linomat 5, Muttenz, Switzerland) is used to spray the antibody solutions onto the nitrocellulose membrane in the form of bands to form the test and control lines. A HP Deskjet 2720 all-in-one printer-scanner (Palo Alto, CA, USA) is utilized to capture the images of the strips and Inkscape Version 1.2 is employed for image analysis. For RIA, a RIA kit (hCEA [I-125] IRMA, Institute of Isotopes Co Ltd, Budapest, Hungary) and a γ-counter (Genesys Gamma 1, Lablogic Systems Ltd, Sheffield, UK) are used in accordance with the manufacturers' instructions.
2.2 Methods
The test and control lines of the strip are formed as follows. First, the capture anti-h CEA 5910 SPTN-5 and the IgG AP124 Gt X Ms antibodies are diluted in 20 mM PBS (pH 7.4) to final concentrations of 0.125 mg mL−1 and 0.25 mg mL−1, respectively. Then, the capture anti-h CEA 5910 SPTN-5 solution is dispensed onto the nitrocellulose membrane using the semi-automatic sample dispenser at a flow rate of 2.86 μL cm−1 to form the test line. The IgG AP124 Gt X Ms antibodies solution is dispensed in the same manner at a distance of 0.6 cm downstream of the test line to form the control line. Therefore, 0.125 μg of anti-h-CEA 5910 and 0.25 μg of the IgG AP124 Gt X Ms antibody are used for each strip. The detection pad is subsequently dried on a hotplate at 37 °C for 1 h.
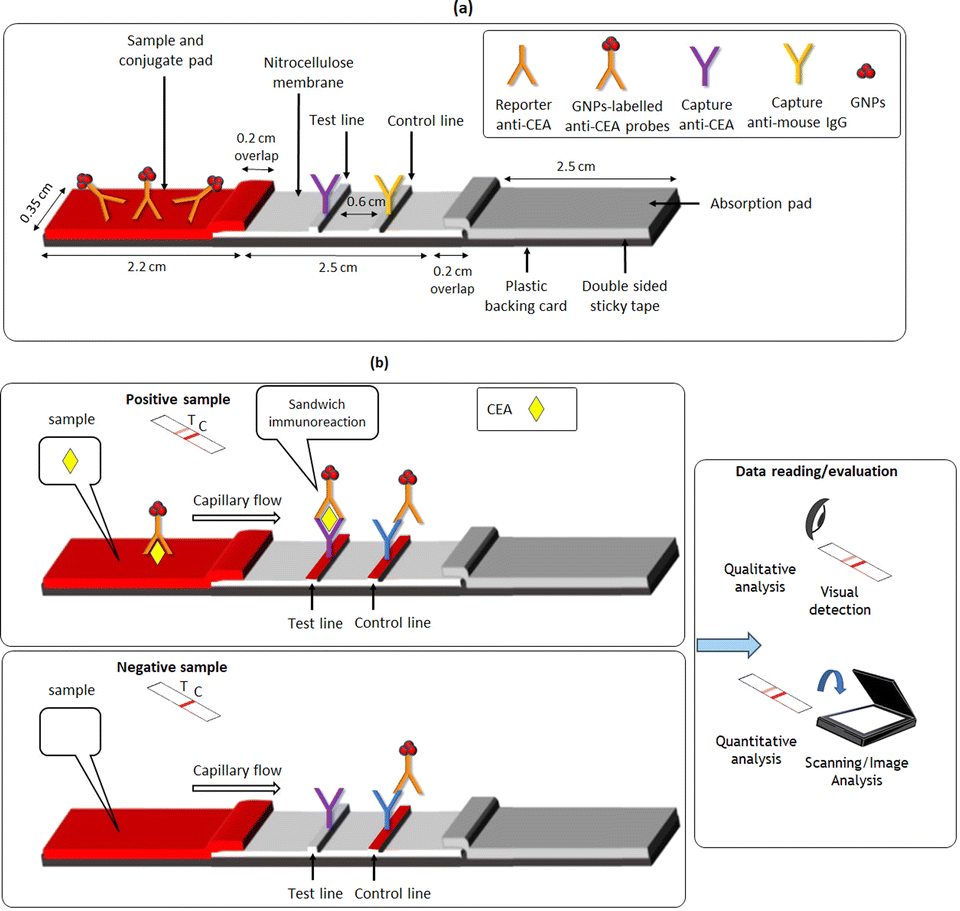 | ||
| Fig. 1 (a) Schematic illustration of the construction of the lateral flow immunosensor developed for CEA detection showing the components, dimensions and immobilized reagents. (b) The principle of the sandwich-type immunoassay. | ||
The assay procedure consists of dispensing 50 μL of a standard CEA solution, sample or blank solution (running buffer) onto the sample/conjugate pad and allowing the liquid to flow. After 15 min, visual detection is performed for qualitative analysis. For quantitative analysis, the strips are scanned and the scanned images are imported into the open-access application Inkscape (https://inkscape.org/). The fluorescence filter is applied to enhance the contrast between the nitrocellulose background coloration and the test and control lines, thus increasing the signal-to-noise ratio. The color intensities of the test and control lines are determined with the Inkscape's Fill and Stroke tool using the Green component of the RGB color palette. To calculate the net signal due to CEA alone, the color intensity of the test line of each sample was subtracted from the color intensity of the test line of the blank sample.
3 Results and discussion
3.1 Selection of the experimental conditions
The overall performance of the lateral flow strips depends on the simultaneous interaction of several factors. The type of the nitrocellulose membrane, the formation of the control and test lines, the amount of antibody immobilized, the composition of the running buffer, the amount of reported antibody conjugated to the GNPs and the volume of GNPs-labelled-anti CEA conjugates solution used per test, were studied.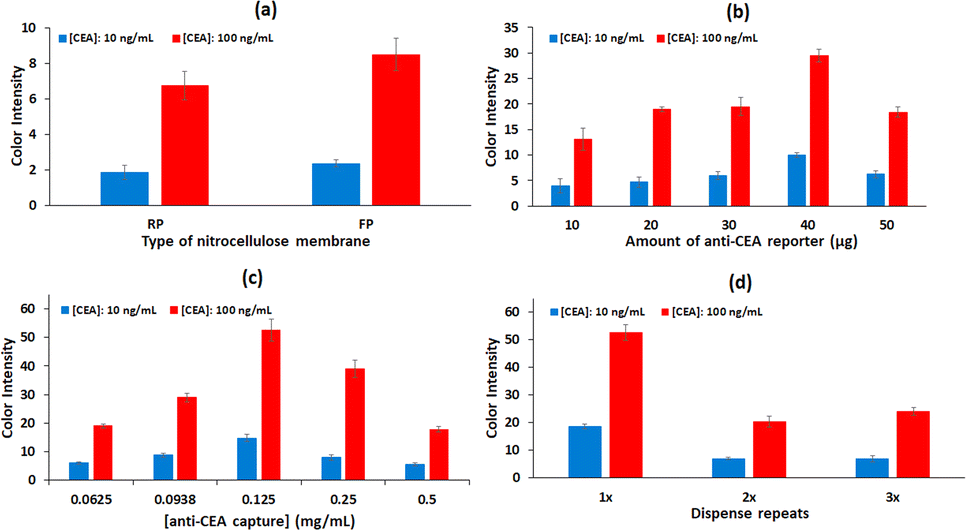 | ||
| Fig. 2 Effect of different parameters on the performance of the lateral flow immunosensor for CEA detection (a) the type of the nitrocellulose membrane, (b) the amount of the anti-CEA per mL of the GNPs solution for the preparation of the GNPs-labelled anti-CEA conjugate probes, (c) the concentration of the capture anti-CEA solution immobilized at the test line, (d) the dispense cycles of the capture anti-CEA solution at the test line. | ||
Next, different concentrations of sucrose (1%, 3%, 5% (w/v)) are examined. In addition to sucrose, the running buffer also contains 1% (w/v) BSA and 0.06% (w/v) Tween-20 in 50 mM PBS (pH 7.4). As previously reported, the addition of carbohydrates such as sucrose, lactose or trehalose, facilitates the release of the GNPs-labelled antibody conjugates from the conjugate pad.33 This is confirmed in our experiments, since the immunosensor performs best with 5% (w/v) sucrose added, exhibiting higher color intensity at the test line (Fig. 3a). Higher concentrations of sucrose are not tested because they increase the viscosity and affect the flow of the running buffer.
At the same time, the concentration of polysorbate 20 (Tween-20) is evaluated. The role of Tween-20 in LFIAs is triple; it facilitates the re-solubilization of the GNPs–antibodies conjugate probes, it limits nonspecific interactions and it reduces the adsorption of the target analyte to the nitrocellulose membrane.33 Solutions containing 0.1%, 0.25%, 0.5%, 0.75% and 1% (w/v) of Tween-20, along with 1% BSA and 5% sucrose in PBS 50 mM (pH 7.4) are compared and the best response is achieved using the 0.5% (w/v) Tween solution (Fig. 3b).
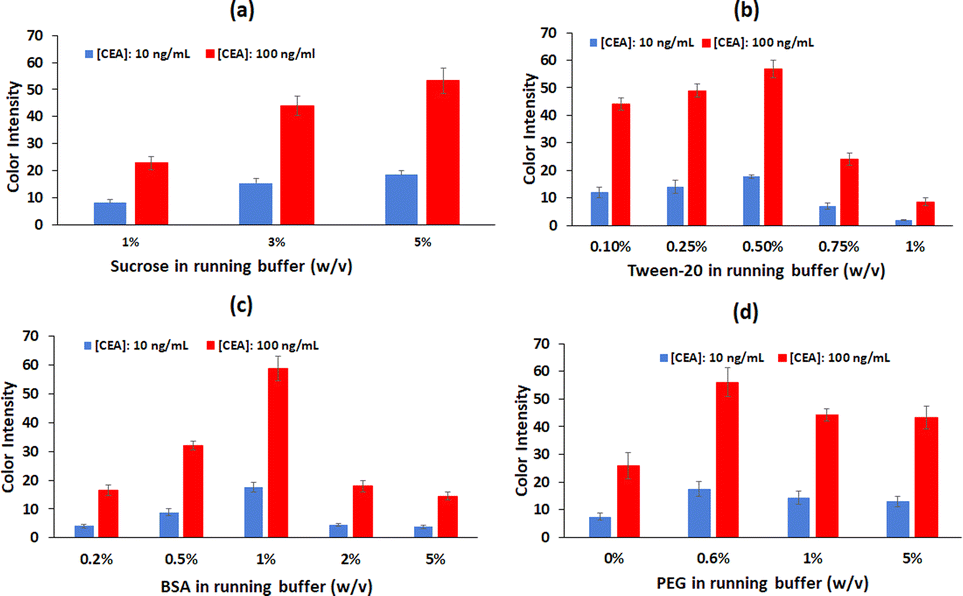 | ||
| Fig. 3 The effect of the running buffer composition on the performance of the lateral flow immunosensor for CEA detection (a) content of sucrose, (b) content of Tween 20, (c) content of BSA, (d) content of PEG. | ||
The next buffer component to be studied is BSA. BSA is often used in immunoassays to address non-specific binding and protein stability issues.34 Solutions containing 0.2%, 0.5%, 1%, 2% and 5% (w/v) BSA along with 5% sucrose and 0.5% Tween in PBS 50 mM (pH 7.4) are compared. 1% (w/v) of BSA appears to provide the best signal for CEA (Fig. 3c); in contrast, higher BSA concentrations (2% and 5% (w/v)) result in false positive results. Therefore, the running buffer selected for further optimization contains 1% (w/v) BSA, 5% (w/v) sucrose and 0.5% (w/v) Tween in 50 mM PBS (pH 7.4).
The next component to be assessed is polyethylene glycol (PEG) 20000. Macromolecular crowding agents such as PEG 20000 create a confining environment which enhances the efficiency of a successful immunoreaction between the target analyte and the biorecognition components. The agents can also increase the viscosity of the running buffer, decreasing the capillary flow rate and thus leading to improved sensitivity.35 Solutions containing 0%, 0.6%, 1% and 5% (w/v) PEG along with 1% BSA, 5% (w/v) sucrose and 0.5% (w/v) Tween in PBS 50 mM (pH 7.4) are compared. The 0.6% (w/v) PEG concentration gives the highest signal at the test line and is thus chosen for the next experiments (Fig. 3d).
The effect of five more substances on the performance of the immunosensor's is evaluated. Different concentrations of Triton X-114, polyvinylpyrrolidone (PVP), sodium dodecyl sulfate (SDS), Ficoll-70 and Ficoll-400 are added to the buffer solution and the obtained results proved to be similar or worse than the aforementioned running buffer alone. Therefore, the buffer selected for further experiments contains 0.6% (w/v) PEG, 1% (w/v) BSA, 5% (w/v) sucrose and 0.5% (w/v) Tween-20 in 50 mM PBS (pH 7.4).
3.2 Metrological features of the immunosensor
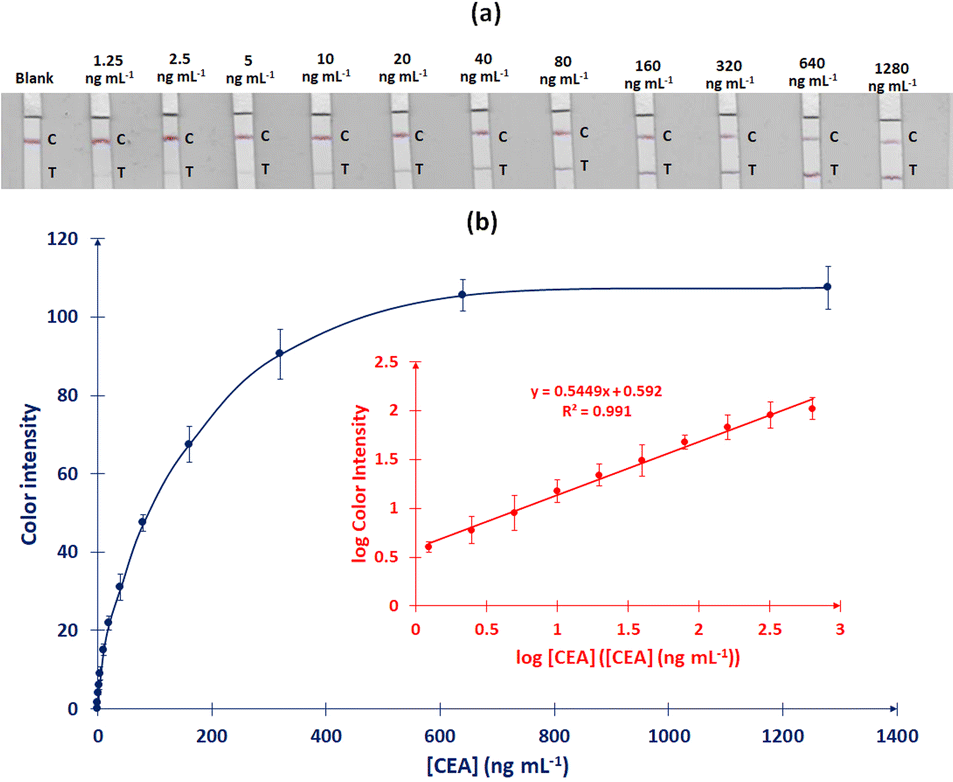 | ||
| Fig. 4 (a) Photographs of the lateral flow strips after assays of different CEA concentrations (0–1280 ng mL−1), (b) calibration graph for CEA determination (color intensity of the test line vs. CEA concentration), insert is the logarithmic calibration curve in the concentration range 1.25–640 ng mL−1 CEA. Each data point corresponds to the average color intensity of the test line from six replicate tests. | ||
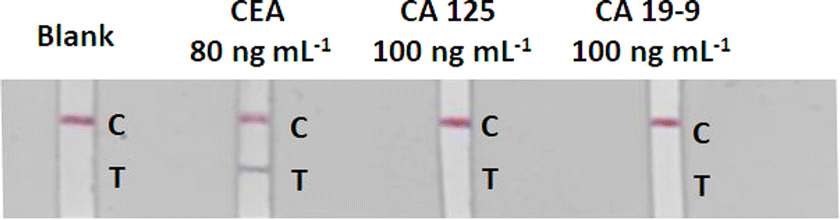 | ||
| Fig. 5 Selectivity of the immunosensor. Blank and running buffer spiked with CEA, CA 125 and CA 19-9. | ||
:1 with a solution containing 1.2% (w/v) PEG, 2% (w/v) BSA, 10% (w/v) sucrose and 1% (w/v) Tween-20 in 100 mM PBS (pH 7.4), aliquots of the diluted solution are spiked with CEA to final concentrations of 2.5, 10, 40 και 160 ng mL−1 and the samples are analyzed in triplicate using the lateral flow immunosensor; scanned images of the assays are illustrated in Fig. S2 (ESI†).
To evaluate the matrix effect, the logarithmic calibration plot in the spiked sample is plotted and compared to the respective calibration plot using standards in running buffer (Fig. S3, ESI†). Statistical t tests demonstrate that the slopes and intercepts of the two calibration plots do not show statistically significant differences at the 95% confidence level; this suggests that the matrix effects are statistically insignificant and that the calibration plot using standards in running buffer can be used for the quantification of CEA in serum samples.
The recovery is calculated from the formula R% = Cc/CSp (where Cc is the CEA concentration calculated from the calibration curve in running buffer and Csp is the concentration in the spiked sample). The results are summarized in Table 1 indicating recoveries between 87% and 115%. The reproducibility is expressed as the % relative standard deviation (% RSD) of the triplicate measurements at each concentration level (Fig. S2, ESI†). As shown in Table 1, the % RSD values are between 7 and 11%.
| Level | Spiking in the spiked sample (ng mL−1) | Concentration detected (ng mL−1) | Recovery (%) | RSD (%) |
|---|---|---|---|---|
| 1 | 2.5 | 2.36 ± 0.18 | 87–102 | 7.63 |
| 2 | 10 | 10.05 ± 1.01 | 90–111 | 10.05 |
| 3 | 40 | 44.74 ± 2.65 | 105–118 | 5.92 |
| 4 | 160 | 166.99 ± 16.66 | 94–115 | 9.98 |
Finally, the lateral flow immunoassay is compared with a radioimmunoassay (RIA) method which serves as a reference method. Human blood serum sample is diluted 1:1 with a solution containing 1.2% (w/v) PEG, 2% (w/v) BSA, 10% (w/v) sucrose and 1% (w/v) Tween in 100 mM PBS (pH 7.4), aliquots of the solution are spiked with CEA to final concentrations of 3, 15, 36, 72 και 120 ng mL−1 and the samples are analyzed in triplicate using the lateral flow immunosensor and RIA. As illustrated in Fig. 6, the two methods correlate well (R2 = 0.991).
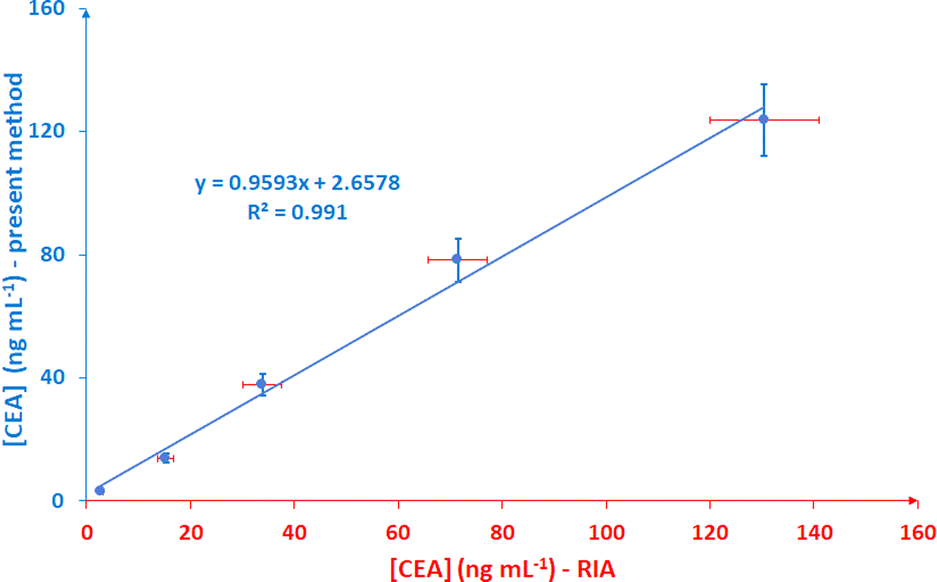 | ||
| Fig. 6 Correlation between the present lateral flow immunoassay and RIA for CEA determination in spiked serum at 5 concentration levels. | ||
3.3 Comparison with existing immunosensors for CEA
Table S1 (ESI†) summarizes some characteristics of different lateral flow immunoassays for CEA reported in the literature.37–46 The present lateral flow immunosensor is economical as it requires low amounts of immobilized antibodies, up to 6 times less compared to most of the existing methods (Table S1, ESI†). In two reports using a smaller amount of antibody at the test line, signal amplification techniques and a more complex protocol are used.37,38The detection limit for CEA of the present immunosensor is 0.45 ng mL−1. Some of the methods in Table S1 (ESI†) report lower LODs;40,42 however, these methods use either fluorescence detection or reporter probes consisting of quantum dots (QDs), magnetic nanoparticles or combination of nanoparticles. However, fluorescence detectors require more complex instrumentation (namely an excitation source) and are more expensive while QDS and magnetic nanoparticles are more expensive to purchase and more difficult to synthesize and functionalize than GNPs. Therefore, these methods are more expensive and complex and do not lend themselves to applications in low-resource environments. On the other hand, considering that the cut-off value for CEA is 5 ng mL−1,47,48 methods with LODs< 1 ng mL−1 are actually suitable for CEA detection within the clinically accepted range. Most often, the methods with extremely low detection limits have limited narrow linear dynamic range at higher concentrations necessitating dilution of some samples.40,42 In contrast, the present immunosensor exhibits a wide linear dynamic range (1.25–640 ng mL−1), 2 to 12 times wider than most literature reports (Table S1, ESI†).
Some previous applications are based on capturing images of the strips with smartphones;38 however, this approach has some serious limitations as many unpredictable factors can contribute to the final coloration of the captured image.49 On the other hand, optical readers commercially available39,41,42,46 or made in-house37,40,44 have been used for signal transduction but these are not suitable for low-resource settings as the former are expensive while the latter require laborious fabrication steps. In this work, we utilize a commercial-all-in one office printer-scanner, a low-cost device (<50 €) widely available in office and home settings which provides stable lighting conditions leading to reproducible results.
Another advantage of the present immunosensor is that it shows similar response to the running buffer and human serum samples so that calibration using standards prepared in the running buffer is sufficient for quantification purposes. Finally, the fabrication of the present strip is simpler as it makes use of only three pads as opposed to existing lateral flow assays that make use of four or more pads in the strip.
To assess whether the developed immunosensor is economically sustainable, the cost of the reagents per strip is calculated. The components that mainly determine the total cost of the device are the antibodies, the nitrocellulose membrane and the bound glass fiber pad. The total cost of materials at retail prices required to prepare one immunosensor for CEA detection amounts to ∼0.19 € (Fig. S4, ESI†).
4 Conclusions
In this study, a lateral flow assay is developed for the detection of CEA in human serum. The lateral flow strip is low-cost (<0.20 €/per device), its fabrication is simplified compared to conventional strips, it makes use of low amounts of expensive reagents and a single drop of sample and offers a limit of detection of 0.45 ng mL−1 (which is well below the 5 ng mL−1 cut-off value for CEA) using only a low-cost office scanner. The assay is selective for CEA, is free from serum matrix effects, is accurate and reproducible. Therefore, the operational, fabrication and analytical features suggest that the lateral flow immunosensor is fit-for purpose for the detection and quantitation of CEA at the PoC or in low-resource environments.Author contributions
Conceptualization, A. E., C. K. and V. P.; methodology, A. E. and V. P.; validation, V. P., I. T. and E. M.; investigation, V. P., I. T. and E. M.; data curation, V. P., I. T., A. E. and E. M.; writing—original draft preparation, I. T. and C. K.; writing—review and editing, A. E., C. K., V. P. I. T.; project administration, A. E.; funding acquisition, A. E.Conflicts of interest
There are no conflicts to declare.Acknowledgements
The research project was supported by the Hellenic Foundation for Research and Innovation (H. F. R. I.) under the “2nd Call for H. F. R. I. Research Projects to support Faculty Members & Researchers” (Project Number: 2956).References
- Cancer, WHO, https://www.who.int/news-room/fact-sheets/detail/cancer, accessed February 2024.
- F. Bray, A. Jemal, N. Grey, J. Ferlay and D. Forman, Global cancer transitions according to the Human Development Index (2008–2030): a population-based study, Lancet Oncol., 2012, 13(8), 790–801 CrossRef PubMed.
- M. Malvezzi, C. Santucci, P. Boffetta, G. Collatuzzo, F. Levi, C. La Vecchia and E. Negri, European cancer mortality predictions for the year 2023 with focus on lung cancer, Ann. Oncol., 2023, 34(4), 410–419 CrossRef CAS PubMed.
- A. Roberts and S. Gandhi, A concise review on potential cancer biomarkers and advanced manufacturing of smart platform-based biosensors for early-stage cancer diagnostics, Biosens. Bioelectron.: X, 2022, 11, 100178 CAS.
- M. Pal, T. Muinao, H. P. D. Boruah and N. Mahindroo, Current advances in prognostic and diagnostic biomarkers for solid cancers: Detection techniques and future challenges, Biomed. Pharmacother., 2022, 146, 112488 CrossRef CAS PubMed.
- L. Wu and X. Qu, Cancer biomarker detection: recent achievements and challenges, Chem. Soc. Rev., 2015, 44, 2963–2997 RSC.
- C. Hall, L. Clarke, A. Pal, P. Buchwald, T. Eglinton, C. Wakeman and F. Frizelle, A Review of the Role of Carcinoembryonic Antigen in Clinical Practice, Ann. Coloproctol., 2019, 35(6), 294–305 CrossRef PubMed.
- M. J. Duffy, Carcinoembryonic antigen as a marker for colorectal cancer: is it clinically useful?, Clin. Chem., 2001, 47(4), 624–630 CrossRef CAS.
- S. Hammarström, The carcinoembryonic antigen (CEA) family: structures, suggested functions and expression in normal and malignant tissues, Semin. Cancer Biol., 1999, 9, 67–81 CrossRef PubMed.
- E. Ermiah, M. Eddfair, O. Abdulrahman, M. Elfagieh, A. Jebriel, M. Al-Sharif, M. Assidi and A. Buhmeida, Prognostic value of serum CEA and CA19-9 levels in pancreatic ductal adenocarcinoma, Mol. Clin. Oncol., 2022, 17(2), 126 CrossRef CAS PubMed.
- H. Mizuno, H. Miyake, H. Nagai, Y. Yoshioka, K. Shibata, S. Asai, J. Takamizawa and N. Yuasa, Optimal cutoff value of preoperative CEA and CA19-9 for prognostic significance in patients with stage II/III colon cancer, Langenbeck's Arch. Surg., 2021, 406, 1987–1997 CrossRef PubMed.
- G. R. Nicol, M. Han, J. Kim, C. E. Birse, E. Brand, A. Nguyen, M. Mesri, W. FitzHugh, P. Kaminker, P. A. Moore, S. M. Ruben and T. He, Use of an Immunoaffinity-Mass Spectrometry-based Approach for the Quantification of Protein Biomarkers from Serum Samples of Lung Cancer Patients, Mol. Cell. Proteomics, 2008, 7(10), 1974–1982 CrossRef CAS PubMed.
- R. Falzarano, V. Viggiani, S. Michienzi, F. Longo, S. Tudini, L. Frati and E. Anastasi, Evaluation of a CLEIA automated assay system for the detection of a panel of tumor markers, Tumor Biol., 2013, 34, 3093–3100 CrossRef CAS PubMed.
- S. Qu, J. Liu, J. Luo, Y. Huang, W. Shi, B. Wang and X. Cai, A rapid and highly sensitive portable chemiluminescent immunosensor of carcinoembryonic antigen based on immunomagnetic separation in human serum, Anal. Chim. Acta, 2013, 766, 94–99 CrossRef CAS PubMed.
- X. Yang, Y. Guo and A. Wang, Luminol/antibody labeled gold nanoparticles for chemiluminescence immunoassay of carcinoembryonic antigen, Anal. Chim. Acta, 2010, 666(1–2), 91–96 CrossRef CAS PubMed.
- J. Y. Hou, T. C. Liu, G. F. Lin, Z. X. Li, L. P. Zou, M. Li and Y. S. Wu, Development of an immunomagnetic bead-based time-resolved fluorescence immunoassay for rapid determination of levels of carcinoembryonic antigen in human serum, Anal. Chim. Acta, 2012, 734, 93–98 CrossRef CAS PubMed.
- Z. Tan, L. Cao, Y. Yang, Q. Yan, Q. Liu, W. Zhang, P. Zhao, Y. Li and D. Zhang, Amperometric immunoassay for the carcinoembryonic antigen by using a peroxidase mimic consisting of palladium nanospheres functionalized with glutathione-capped gold nanoparticles on graphene oxide, Mikrochim. Acta, 2019, 186(11), 693 CrossRef CAS PubMed.
- H. Chon, S. Lee, S. Wook Son, C. Hwan Oh and J. Choo, Highly Sensitive Immunoassay of Lung Cancer Marker Carcinoembryonic Antigen Using Surface-Enhanced Raman Scattering of Hollow Gold Nanospheres, Anal. Chem., 2009, 81(8), 3029–3034 CrossRef CAS PubMed.
- X. Gu, Z. She, T. Ma, S. Tian and H. B. Kraatz, Electrochemical Detection of Carcinoembryonic Antigen, Biosens. Bioelectron., 2018, 102, 610–616 CrossRef CAS PubMed.
- Y. Wang, G. Zhao, Y. Zhang, X. Pang, W. Cao, B. Du and Q. Wei, Sandwich-Type Electrochemical Immunosensor for CEA Detection Based on Ag/MoS2@Fe3O4 and an Analogous ELISA Method with Total Internal Reflection Microscopy, Sens. Actuators, B, 2018, 266, 561–569 CrossRef CAS.
- Y. Wang, Y. Wang, D. Wu, H. Ma, Y. Zhang, D. Fan, X. Pang, B. Du and Q. Wei, Label-Free Electrochemical Immunosensor Based on Flower-like Ag/MoS2/RGO Nanocomposites for Ultrasensitive Detection of Carcinoembryonic Antigen, Sens. Actuators, B, 2018, 255, 125–132 CrossRef CAS.
- T. Špringer and J. Homola, Biofunctionalized Gold Nanoparticles for SPR-Biosensor-Based Detection of CEA in Blood Plasma, Anal. Bioanal. Chem., 2012, 404, 2869–2875 CrossRef PubMed.
- R. Li, F. Feng, Z. Z. Chen, Y. F. Bai, F. F. Guo, F. Y. Wu and G. Zhou, Sensitive Detection of Carcinoembryonic Antigen Using Surface Plasmon Resonance Biosensor with Gold Nanoparticles Signal Amplification, Talanta, 2015, 140, 143–149 CrossRef CAS PubMed.
- A. Sena-Torralba, R. Álvarez-Diduk, C. Parolo, A. Piper and A. Merkoçi, Toward Next Generation Lateral Flow Assays: Integration of Nanomaterials, Chem. Rev., 2022, 122(18), 14881–14910 CrossRef CAS PubMed.
- T. Mahmoudi, M. de la Guardia and B. Baradaran, Lateral flow assays towards point-of-care cancer detection: A review of current progress and future trends, TrAC, Trends Anal. Chem., 2020, 125, 115842 CrossRef CAS.
- K. Omidfar, F. Riahi and S. Kashanian, Lateral Flow Assay: A Summary of Recent Progress for Improving Assay Performance, Biosensors, 2023, 13(9), 837 CrossRef CAS PubMed.
- M. K. Dey, M. Iftesum, R. Devireddy and M. R. Gartia, New technologies and reagents in lateral flow assay (LFA) designs for enhancing accuracy and sensitivity, Anal. Methods, 2023, 23, 4351–4376 RSC.
- E. Gumus, H. Bingol and E. Zor, Lateral flow assays for detection of disease biomarkers, J. Pharm. Biomed. Anal., 2023, 225, 115206 CrossRef CAS PubMed.
- I. Ielo, G. Rando, F. Giacobello, S. Sfameni, A. Castellano, M. Galletta, D. Drommi, G. Rosace and M. R. Plutino, Synthesis, Chemical–Physical Characterization, and Biomedical Applications of Functional Gold Nanoparticles: A Review, Molecules, 2021, 26, 5823 CrossRef CAS PubMed.
- M. I. Anik, N. Mahmud, A. Al Masud and Md. M. Hasan, Gold nanoparticles (GNPs) in biomedical and clinical applications: A review, Nano Sel., 2022, 3, 792 CrossRef CAS.
- J. Dong, P. L. Carpinone, G. Pyrgiotakis, P. Demokritou and B. M. Moudgil, Synthesis of Precision Gold Nanoparticles Using Turkevich Method, Kona, 2020, 37, 224–232 CrossRef CAS PubMed.
- K. Baryeh, Development of quantitative lateral flow strip biosensors for the detection of cancer biomarkers, Doctoral Dissertation, Department of Chemistry and Biochemistry, North Dakota State University of Agriculture and Applied Science, 2019, https://library.ndsu.edu/ir/bitstream/handle/10365/29881/Baryeh_ndsu_0157D_12268.pdf?sequence=1&isAllowed=y, accessed in February 2024 Search PubMed.
- M. Kaur and E. Eltzov, Optimizing Effective Parameters to Enhance the Sensitivity of Vertical Flow Assay for Detection of Escherichia coli, Biosensors, 2022, 12(2), 63 CrossRef CAS PubMed.
- A. Sukumaran, T. Thomas, R. Thomas, R. E. Thomas, J. K. Paul and D. M. Vasudevan, Development and Troubleshooting in Lateral Flow Immunochromatography Assays, Indian J. Clin. Biochem., 2021, 36(2), 208–212 CrossRef CAS PubMed.
- N. M. Christopoulou, D. Kalogianni and T. Christopoulos, Macromolecular crowding agents enhance the sensitivity of lateral flow immunoassays, Biosens. Bioelectron., 2022, 218, 114737 CrossRef CAS PubMed.
- B. N. Khlebtsov, R. S. Tumskiy, A. M. Burov, T. E. Pylaev and N. G. Khlebtsov, Quantifying the Numbers of Gold Nanoparticles in the Test Zone of Lateral Flow Immunoassay Strips, ACS Appl. Nano Mater., 2019, 2(8), 5020–5028 CrossRef CAS.
- T. Mahmoudi, M. Pourhassan-Moghaddam, B. Shirdel, B. Baradaran, E. Morales-Narváez and H. Golmohammadi, On-Site Detection of Carcinoembryonic Antigen in Human Serum, Biosensors, 2021, 11(10), 392 CrossRef CAS PubMed.
- T. Mahmoudi, B. Shirdel, B. Mansoori and B. Baradaran, Dual sensitivity enhancement in gold nanoparticles-based lateral flow immunoassay for visual detection of carcinoembryonic antigen, Anal. Sci. Adv., 2020, 1, 161–172 CrossRef.
- Q. Zeng, X. Mao, H. Xu, S. Wang and G. Liu, Quantitate Immunochromatographic Strip Biosensor for the Detection of Carcinoembryonic Antigen Tumour Biomarker in Human Plasma, Am. J. Biomed. Sci., 2009, 1(1), 70–79 CrossRef CAS.
- K. Xiao, K. Wang, W. Qin, Y. Hou, W. Lu, H. Xu, Y. Wo and D. Cui, Use of quantum dot beads-labeled monoclonal antibody to improve the sensitivity of a quantitative and simultaneous immunochromatographic assay for neuron specific enolase and carcinoembryonic antigen, Talanta, 2017, 164, 463–469 CrossRef CAS PubMed.
- Z. Chen, R. Liang, X. Guo, J. Liang, Q. Deng, M. Li, T. An, T. Liu and Y. Wu, Simultaneous quantitation of cytokeratin-19 fragment and carcinoembryonic antigen in human serum via quantum dot-doped nanoparticles, Biosens. Bioelectron., 2017, 91, 60–65 CrossRef CAS PubMed.
- W. Lu, K. Wang, K. Xiao, W. Qin, Y. Hou, H. Xu, X. Yan, Y. Chen, D. Cui and J. He, Dual immunomagnetic nanobeads-based lateral flow test strip for simultaneous quantitative detection of carcinoembryonic antigen and neuron specific enolase, Sci. Rep., 2017, 7, 42414 CrossRef CAS PubMed.
- F. Liu, H. Zhang, Z. Wu, H. Dong, L. Zhou, D. Yang, Y. Ge, C. Jia, H. Liu, Q. Jin, J. Zhao, Q. Zhang and H. Mao, Highly sensitive and selective lateral flow immunoassay based on magnetic nanoparticles for quantitative detection of carcinoembryonic antigen, Talanta, 2016, 161, 205–210 CrossRef CAS PubMed.
- W. Qin, K. Wang, K. Xiao, Y. Hou, W. Lu, H. Xu, Y. Wo and S. Feng, D. Cui Carcinoembryonic antigen detection with “handing”-controlled fluorescence spectroscopy using a color matrix for point-of-care applications, Biosens. Bioelectron., 2017, 90, 508–515 CrossRef CAS PubMed.
- Y. Wu, W. Peng, Q. Zhao, J. Piao, B. Zhang, X. Wu, H. Wang, Z. Shi, X. Gong and J. Chang, Immune fluorescence test strips based on quantum dots for rapid and quantitative detection of carcino-embryonic antigen, Chin. Chem. Lett., 2017, 28(9), 1881–1884 CrossRef CAS.
- B. Zhang, W. Ma, F. Li, W. Gao, Q. Zhao, W. Peng, J. Piao, X. Wu, H. Wang, X. Gong and J. Chang, Fluorescence quenching-based signal amplification on immunochromatography test strips for dual-mode sensing of two biomarkers of breast cancer, Nanoscale, 2017, 9, 18711–18722 RSC.
- L. Gan, S. Ren, M. Lang, G. Li, F. Fang, L. Chen, Y. Liu, R. Han, K. Zhu and T. Song, Predictive value of preoperative serum AFP, CEA, and CA19-9 levels in patients with single small hepatocellular carcinoma: retrospective study, J. Hepatocell. Carcinoma, 2022, 9, 799–810 CrossRef PubMed.
- H. Zhang, C. Li, F. Hu, X. Zhang, Y. Shen, Y. Chen and F. Li, Auxiliary diagnostic value of tumor biomarkers in pleural fluid for lung cancer-associated malignant pleural effusion, Respir. Res., 2020, 21, 1–7 CrossRef PubMed.
- S. Soares, G. M. Fernandes and F. R. P. Rocha, Smartphone-based digital images in analytical chemistry: Why, when, and how to use, TrAC, Trends Anal. Chem., 2023, 168, 117284 CrossRef CAS.
Footnote |
| † Electronic supplementary information (ESI) available. See DOI: https://doi.org/10.1039/d4ay00381k |
| This journal is © The Royal Society of Chemistry 2024 |