
 Open Access Article
 This Open Access Article is licensed under a Creative Commons Attribution-Non Commercial 3.0 Unported Licence
Selective ionization of marker molecules in fuels by laser-based ion mobility spectrometry (LIMS)†
Martin
Zühlke
 *,
Leonard
Genin
,
Daniel
Riebe
and
Toralf
Beitz
*,
Leonard
Genin
,
Daniel
Riebe
and
Toralf
Beitz
University of Potsdam, Physical Chemistry, Karl-Liebknecht-Str. 24-25, 14476 Potsdam, Germany
First published on 18th January 2024
Abstract
Careful quality control of complex matrices such as fuels and food is necessary due to the prevalence of counterfeit and pirated goods in global trade. The addition of taggants (indicator substances) to products or their packaging helps to ensure traceability. In order to prevent the mixing of different liquid products, such as different taxed fuels, invisible labelling (marker) can be used to detect illegal activities. This study investigates the qualitative and quantitative analysis of markers in complex fuel matrices using Resonance-Enhanced Multiphoton Ionisation (REMPI) Ion Mobility Spectrometry (IMS). The potential of REMPI as a selective ionisation technique for the detection of markers is highlighted, particularly with respect to minimizing matrix background and the possibility of detection without chromatographic pre-separation. Finding a suitable marker–wavelength combination that provides a suitable marker-to-matrix ratio allows selective ionization of markers while minimising matrix background. Matrix analysis shows that higher excitation wavelengths result in reduced matrix signals, with the low intensities observed at 355 nm for diesel and petrol matrices. Several candidate markers are evaluated based on the criteria of intense signal at 355 nm and non-leachability for the low tax labelling. The analytical performance of selected markers is evaluated, with a focus on the charge transfer reaction (CTR) between markers and matrix components. Our findings demonstrate the potential of REMPI-IMS for marker analysis in fuels without the need for chromatographic pre-separation, providing a promising approach for detecting illegal or fraudulent activities in the supply chain.
1. Introduction
Complex matrices such as food products, cosmetics or pharmaceuticals require rigorous quality control to ensure the safety and traceability of the products' ingredients.1,2 The Organisation for Economic Co-operation and Development (OECD) estimates that counterfeit and pirated goods accounted for up to 2.5% of global trade in 2019, and estimates an increase in subsequent years.3 The loss of tax revenue, the damage to various branded companies and the health risk to the consumers can be immense. To monitor the process chains, indicator substances (so-called taggants) can be added to the ingredients or their packaging at any point in the production process.4 In the best case scenario, this ensures complete labelling from the origin of each raw material right through to the product, thus preventing counterfeiting. Products that have been traded illegally (tax-free) or plagiarized can thus be identified and withdrawn from circulation. Tagging options include, for example, magnetic inks, fluorescent labels, photochromic and thermochromic coatings, isotopic tracers and Raman-active components.5,6 Most of these physical methods are designed for labelling solid surfaces or are incorporated directly into the product during manufacture.Blending of different taxed fuels is a prominent example of tax avoidance worldwide. Mixing untaxed fuels (e.g. from crude oil theft, fuel piracy and illegal trade) with low or high taxed fuels can increase profits enormously. While the regular tax on petrol or diesel is paid by the customer, the full tax has not been previously paid and therefore represents an additional profit for the distributor. As a result, oil producing and processing countries as well as the petrol industry add unique chemical signatures or a concentrate of an indicator solution to a fuel (known as tagging) in order to help track its distribution and identify any illegal or fraudulent activity in the supply chain.7–9 Different taggants can be used to label the fuel at various points including refineries, terminals, or blending facilities. The requirements for potential taggants are high: inert, non-leachable, inexpensive, easy to detect, safe to use and without an effect on the product's properties. To detect diluted or contaminated products, the marker must also be quantifiable in the complex matrix and tolerant of matrix changes.10 Tagging substances can be distinguished between covert (invisible markers) and overt (visible dyes).10 Commonly used qualitative and quantitative laboratory analyses are based on a pre-separation step, usually performed by high performance liquid chromatography (HPLC) coupled to ultraviolet-visible (UV-VIS) absorption11 or fluorescence spectroscopy as well as gas chromatography (GC) coupled to mass spectrometry (MS).12 Outside the laboratory, labeled fuel samples can be injected directly into portable spectrophoto-/spectrofluorometers or Raman spectrometers.13 Overall, there's little literature available on marker substances as it's always a struggle between governments or companies and counterfeiters, who also counterfeit the marker substances.14 Thus, implementing a completely new and even mobile analysis technique, which analyses qualitatively and potentially quantitatively, could significantly improve the situation for the manufacturers.
Ion mobility (IM) spectrometry is a robust, inexpensive, and mobile analytical technique that separates ions based on their mobility (shape and size of the ions). At atmospheric pressure ions move through an electric field gradient inside a tube of a defined length to a detector and collide with inert gas molecules in the tube. Due to their different cross sections (depending on shape and size) the ions are detected at different drift times which are related to their ion mobility.15 However, the resolving power (Rp) of most commercially available IM spectrometers is low, with Rp < 60.16 Thus, ionization sources based on chemical ionization at atmospheric pressure (APCI) or single photon ionization (SPI) would not allow detection of the marker alongside the broad matrix signal in the presence of a complex matrix like fuel.17 Therefore, chromatographic pre-separation in the gas phase is used to detect markers with these ionisation techniques, requiring longer analysis times and extensive instrumentation.18,19
Resonance-Enhanced Multiphoton Ionization (REMPI), on the other hand, allows selective ionization of markers and minimizes the matrix background at optimal laser parameters.20 REMPI is an ionization technique that consists of two steps. First, m photons are simultaneously absorbed by an atom or small molecule in the sample which excites the molecule into a higher (e.g. first) electronic state. Second, n photons are absorbed by molecule in the first electronic state and create a free electron or electron–ion pair. The simplest form of this m + n REMPI is 1 + 1 REMPI where photons of the same wavelength are absorbed in the first and second step.21 If the energy of the photon and the first electronic state is close to half the energy of the ionisation potential (resonance condition), the REMPI process is more efficient and therefore selective. Hence, a good marker–wavelength combination is necessary for a substantial marker-to-matrix ratio.22
REMPI was first implemented for spectroscopic purposes, but soon became increasingly used as an ionisation technique for polyatomic compounds in MS.23–25 Until now, it has been used for process and quality control of polycyclic aromatic hydrocarbons (PAHs) and polymers, often in conjunction with GC.20,26,27 PAH studies performed with tuneable lasers were done at laser wavelengths below 300 nm, although 1 + 1 REMPI with amine compounds would allow higher wavelengths.28,29 Almost exclusively, REMPI-MS studies have been limited to the intense UV-pulses between 193 nm and 350 nm.30
REMPI-IM spectrometry has been used so far mainly for fundamental studies, e.g. photofragmentation, charge transfer reaction monitoring, trace detection and aromatics sensing.31–36 In this study, we present qualitative and quantitative analysis of markers in fuels (petrol/diesel) using REMPI-IM spectrometry without chromatographic pre-separation. Fuel as a complex matrix with many PAHs required the use of laser wavelengths above 300 nm, or even 350 nm to obtain easily interpretable marker signals. Therefore, the marker candidates need to be studied intensively in order to select the best wavelength–marker combination. The candidates were evaluated for analytical performance (reproducibility and accuracy) with a focus on the charge transfer reaction (CTR) to or from matrix components.
2. Experimental part
2.1. REMPI-MS und IMS
In order to investigate potential REMPI markers, two different set-ups were established (Fig. 1). The first was the analysis with an established analytical technique – (a) mass spectrometry (MS) – to identify the M+ ions produced by REMPI. The second set-up was the intended instrumentation for the potential mobile application: (b) combination of REMPI with an ion mobility spectrometer (IMS). | ||
| Fig. 1 Scheme of the resonance-enhanced multiphoton ionization (REMPI) set-ups, (a) sample introduction with thermo desorber (TD) and analysis with mass spectrometer (MS), (b) sample introduction with gas chromatograph (GC) and analysis with ion mobility spectrometer (IMS), temperatures and gas flows are stated in the figure. | ||
Samples were prepared in small vials by pipetting dilutions from a marker stock solution prepared in hexane. The samples were injected with a syringe (Hamilton, 10 μl, Model 701 N, 26 s gauge, Bonaduz, Switzerland) into the injector of the self-made thermal desorber (TD, TC-13.006, PAS Technology, Magdala, Germany) or into the injector of the commercial GC (HP 5890 SII, Hewlett Packard, now: Agilent Technologies Inc., Santa Clara, USA). The GC was used with a short (approx. 40 cm) inactivated and uncoated silica capillary, so that both TD and GC were used only for rapid evaporation of the liquid sample. At the end of the transfer capillary a special ionization region was reached where the gaseous sample was ionized via REMPI with a Nd:YAG pumped optical parametric oscillator (OPO) laser (NT342A-SH, Ekspla, Vilnius, Lithuania). These specific ionization regions for the MS (LTQ XL, Thermo Fisher Scientific, Waltham, MA, USA) and for the IMS (self-made37, University of Potsdam) have been described previously.37,38 In the IMS the ions were detected on a Faraday plate coupled to an amplifier (NT3-ES, Physimetron, Berlin, Germany) and an oscilloscope (Handyscope, HS3, TiePie engineering, Sneek, Netherlands). Nitrogen (5.0, Praxair, Danbury, USA) was used as carrier and drift gas.
2.2. APCI-MS and IMS
For the APCI comparison measurements, the laser source in both set-ups was replaced by the same APCI source. The APCI source was a miniaturized X-ray source (diameter: 10 mm, length: 40 mm), which was developed by Bruker for the handheld IM spectrometer (Roadrunner, Bruker Optics GmbH & Co. KG, Leipzig, Germany). The source consists of an electron gun and a rhodium target on a beryllium window. The electron acceleration voltage is 4 kV, and the power consumption of the source is about 1 W.38 For the APCI-IMS set-up the GC from the REMPI set-up was connected to the handheld IM spectrometer (Roadrunner) with the ionization source described above. For the APCI-MS we used a self-made ionization region, which has been described in detail before.382.3. Samples and solvents
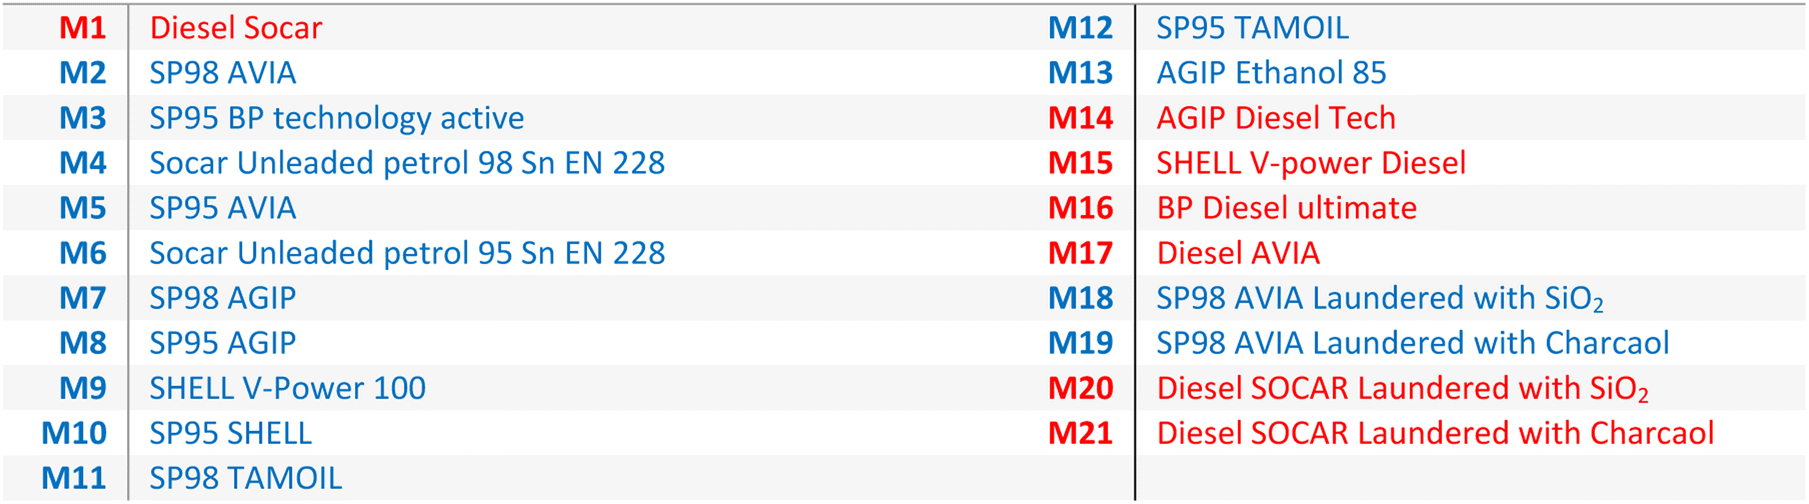
All reagents and solvents were purchased from Merck SA (Darmstadt, Germany) with a minimum purity of 97%: 2-ethyl-9,10-dimethoxyanthracene (EDMA, >97%), 1,4-diphenyl-1,3,-butadien (>99%), N,N,N′,N′-tetramethyl-p-phenylenediamine (TMPPD, 99%), N,N,N′,N′-tetramethyl-1,8-naphthalenediamine (TMNDA, >99%), n-hexan (99%). Only N1,N1,N5,N5-tetraethyl-naphthalene-1,5-diamine was self-synthesized via 1,5-diaminonaphthalene with ethyl bromide and N,N-diisopropylethylamine (details in ESI†). The fuel samples are listed in Table 1 (usually used diesel is M1 and petrol is M2).
|
3. Results and discussion
The aim of this work was to characterize the qualitative and quantitative analysis of marker molecules in complex fuel matrices by using REMPI-IM spectrometry. In the following section, four different focal points are discussed. The first task was to find a REMPI wavelength that allows ionization of marker molecules while minimizing ionization of the matrix, but for which commercially available lasers also exist (3.1. Matrix analysis). Second, marker molecules that give an intense signal at this wavelength had to be identified (3.2. Marker selection). Third, the analytical performance of these markers was characterized (3.3. Analytical performance) and finally, possible charge transfer reactions (section 3.4. CTR) in the atmospheric pressure ionization region were examined, which appeared to be one of the reasons for small deviations in the marker signal between different matrices.3.1. Matrix analysis
The analysis of complex matrices, such as diesel or petrol, can be a challenging task due to the presence of a very large number of components with varying concentrations. Unselective ionization techniques such as APCI give a large number of peaks in MS and IMS (see Fig. 2a), therefore the presence of complex matrices can hinder the qualitative and especially quantitative analysis of markers. Using an excitation wavelength of 266 nm – often used in REMPI applications – also show broad intense spectra (see Fig. 2b), due to the high number of PAH in the diesel matrix the spectra of the petrol matrix at different wavelengths can be found in ESI.† Searching for higher excitation wavelengths focusing on commercially available lasers (266 nm – Nd:YAG laser, 308 nm – XeCl excimer laser, 337 nm – N2 laser, 355 nm – Nd:YAG laser) shows that the matrix signals decrease with increasing excitation wavelengths (Fig. 2d). It is important to note that the laser pulse energy of the OPO also decreases with increasing wavelength (green line in Fig. 2d). The lowest intensities were found at 355 nm for the diesel matrix (see Fig. 2c). At various times after injection, other small m/z or drift time ranges were blocked by the matrix peak. This indicates a time dependence in the evaporation of the compounds in the matrix.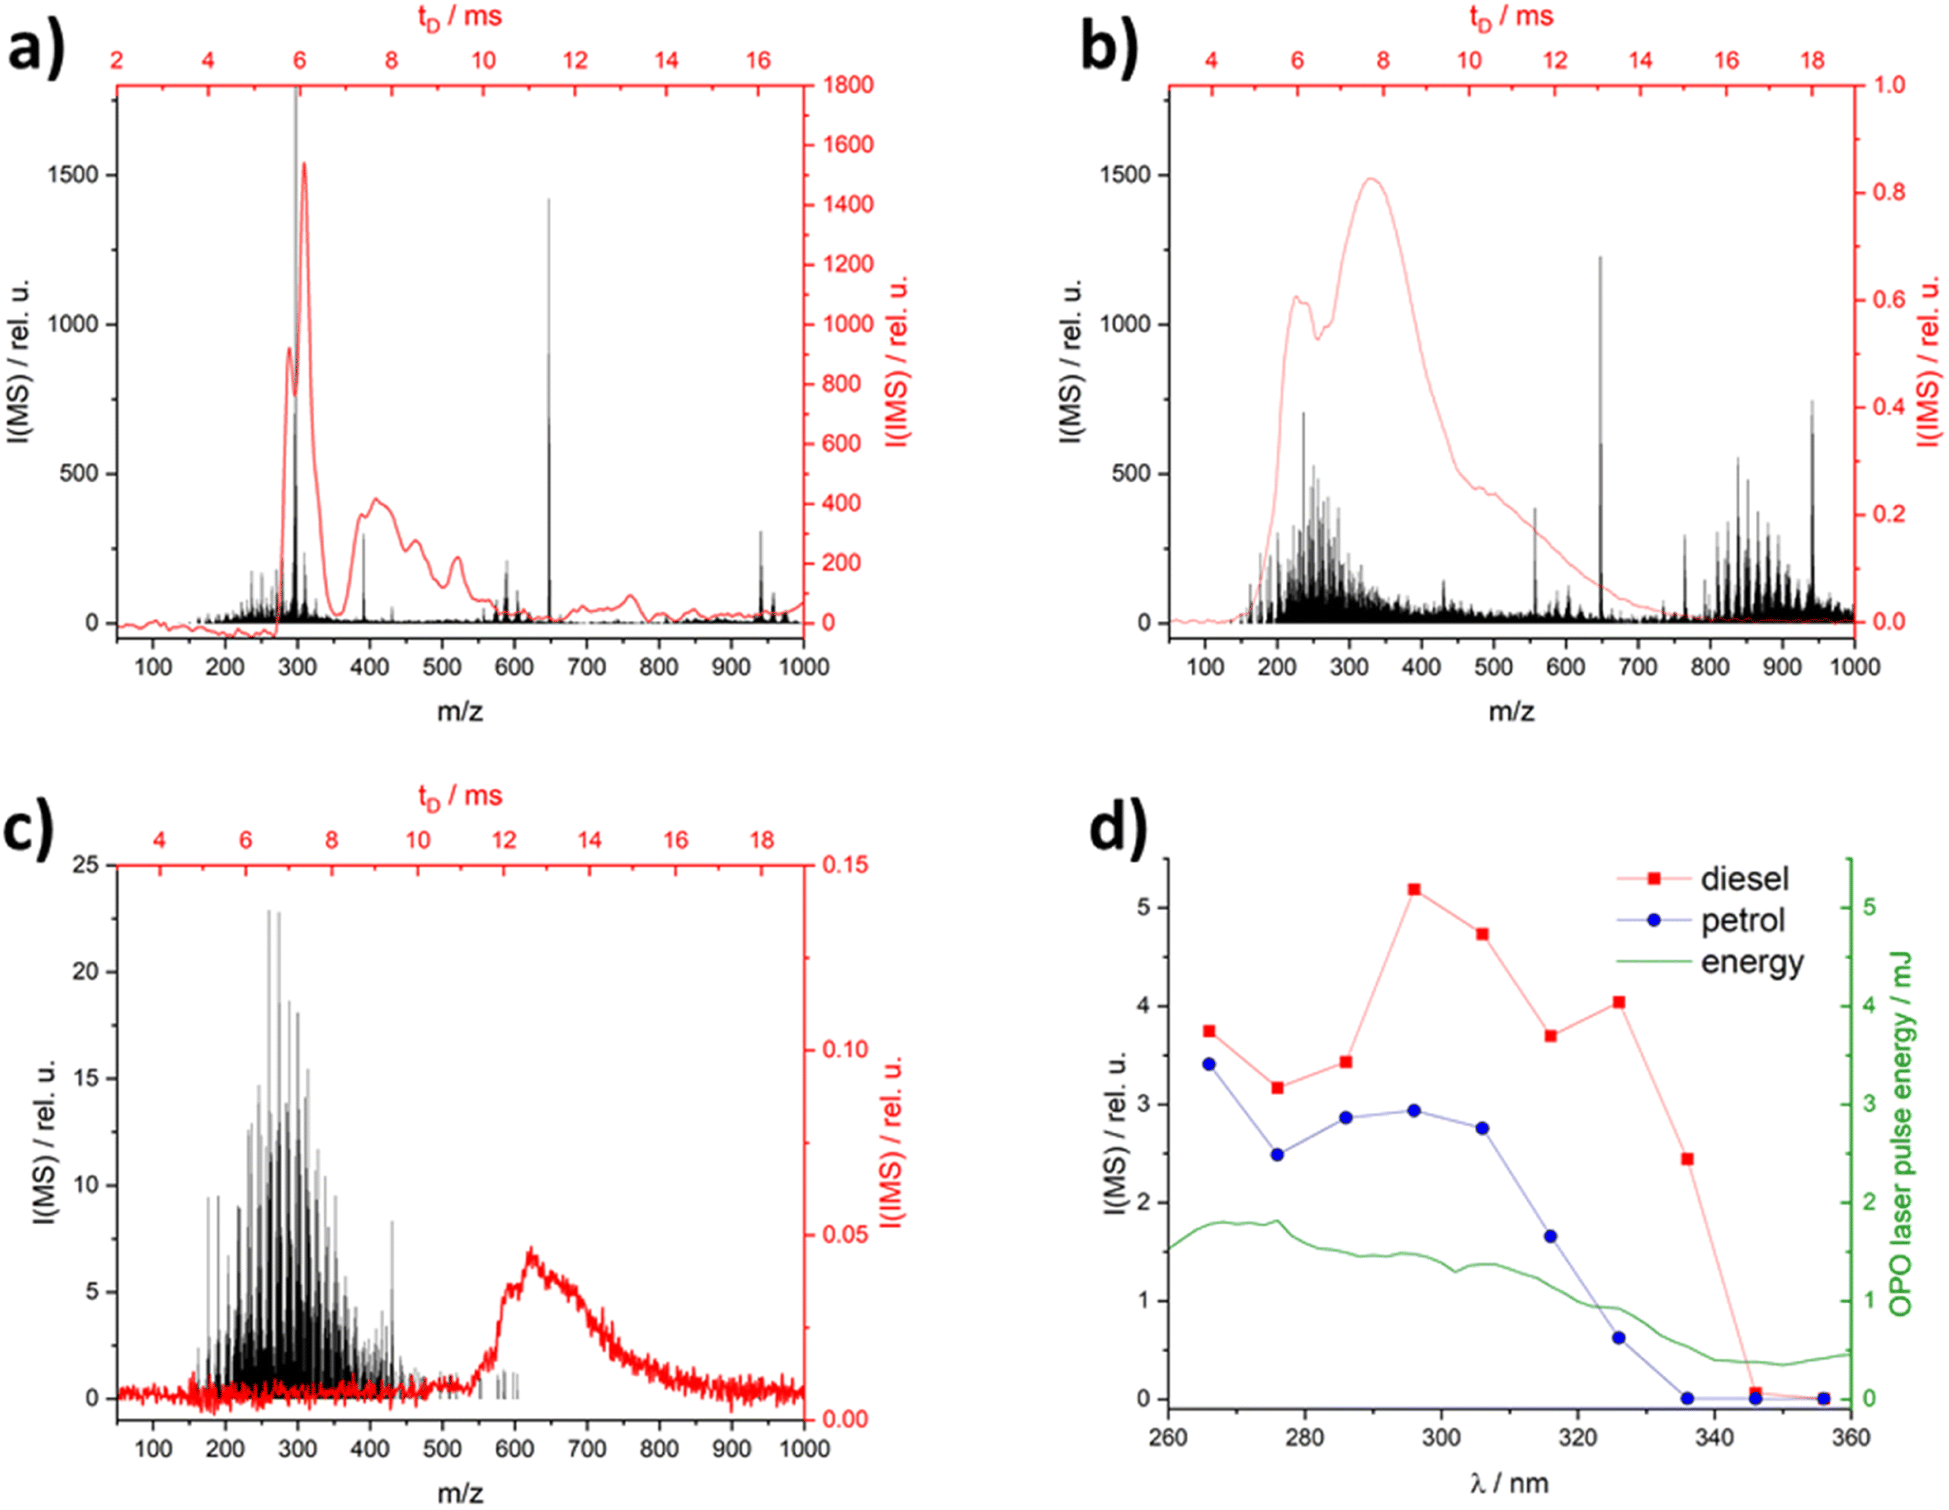 | ||
Fig. 2 IM (red) & MS-spectra (black) with different ionization methods: (a) APCI; (b) laser ionization at 266 nm and (c) at 355 nm; (d) diesel and petrol MS-spectra and laser pulse energy in dependence of wavelength, all spectra were made with diesel socar (M1) in hexane (1![[thin space (1/6-em)]](https://www.rsc.org/images/entities/char_2009.gif) :100), neat diesel IM spectra in the ESI Fig. S1.† :100), neat diesel IM spectra in the ESI Fig. S1.† | ||
3.2. Marker selection
There are two ways of labelling diesel or petrol to prevent the mixing of different taxed fuels. One is to add a marker to the high taxed fuel, which can be quantifiably detected to confirm purity. Alternatively, a non-leachable marker (usually a pure carbon–hydrogen marker) can be added to the low taxed fuel, which should not be detected in the analysis of the high taxed fuel at its purity (Fig. 3).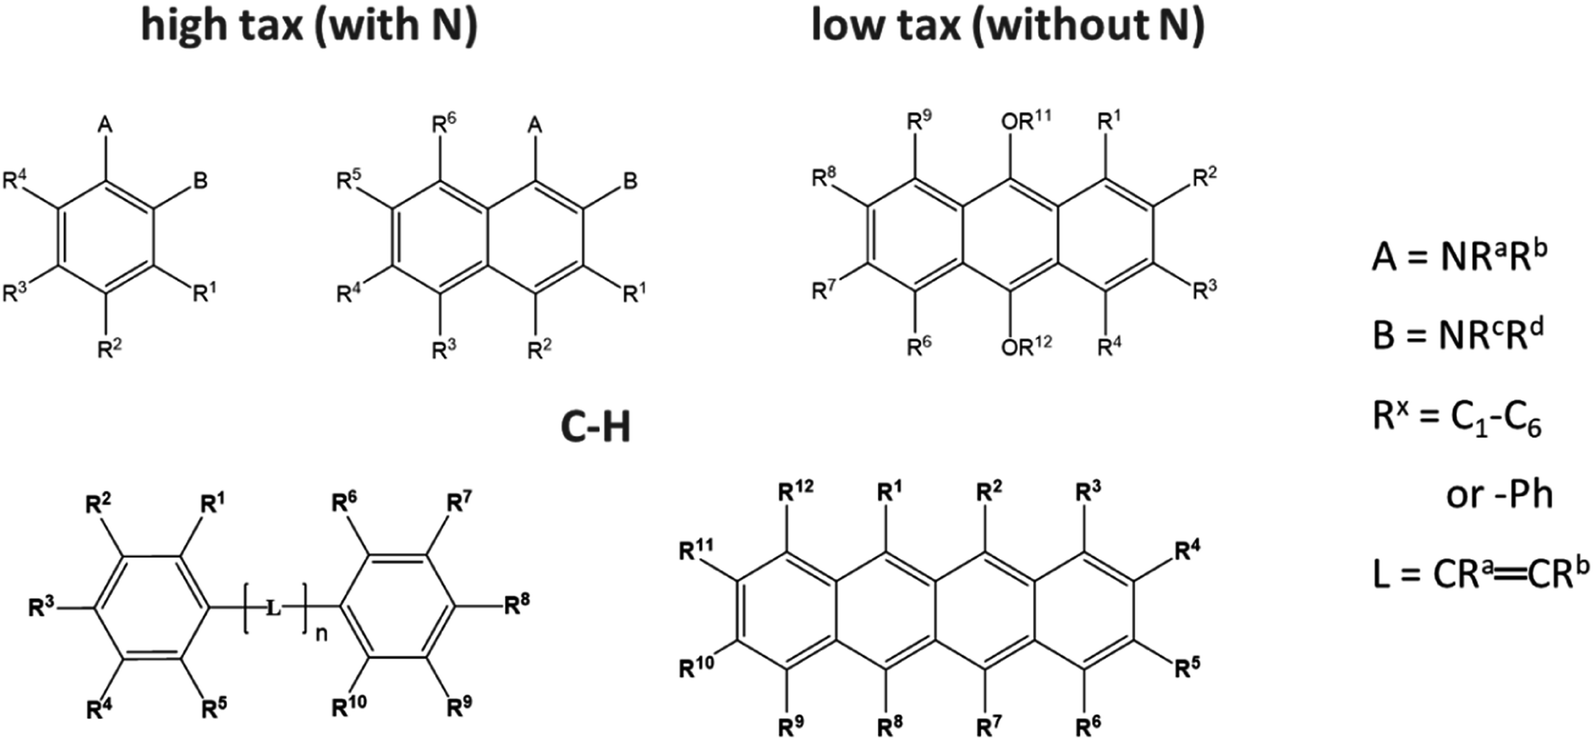 | ||
| Fig. 3 Overview of the chemical core structures of the marker candidates with nitrogen (N) for high tax labelling or without N for non-leachable low tax labelling. | ||
The results from the previous experiments on matrices indicated that the marker should have an intense signal at excitation wavelengths above 300 nm. The large number of UV-VIS spectra in online databases may provide a clue to this selection criterion, but they are not always related to REMPI spectra.29 Contradictory requirements in the chemical structure made the selection of suitable markers even more difficult. Larger contiguous aromatic or multiple-bond systems (π-system) result in lower ionization potentials (IPs), so less energy is required for the laser ionization and higher laser wavelengths are suitable.39 In addition, smaller IPs result in fewer electron transfer reactions (ETRs) from the marker to the matrix.40 However, for the resonance condition of REMPI, the energy difference between the half-ionization potential (1/2 IP) and the excited state (S1) must be as small as possible. According to the literature,39 the energy difference increases for aromatic systems with more than two rings. For the high tax marker candidates containing N, 1 + 1 REMPI signals above 300 nm could be found for the combination of amine and 2–3 aromatic rings. Amine-alkylation does not affect the position of 1 + 1 REMPI wavelength.41 To overcome these challenges, approximately 40 candidates for low and high tax marking were tested, focusing on molecules with different ring sizes containing pure C–H π-systems, as well as those with heteroatoms to facilitate ionization (best marker see ESI Fig. S2†).
One of the best marker candidates was N,N,N′,N′-tetramethyl-p-phenylenediamine (TMPPD), which showed an intense M+-peak at 266 nm (Fig. 4a) with medium petrol matrix peaks at the standard REMPI wavelength of 266 nm. Firstly, the M+ peak indicates that photo-ionization is predominantly occurring. If proton transfer reactions (PTR) from matrix to marker would be the preferred way to ionize the marker the (M + 1)+-peak would be the dominant one. Secondly, at 266 nm it is possible to find a time after injection when the marker signal intensity of 1 μM marker is clearly separated from the complex matrix background for a matrix sample diluted in hexane. In any case, the matrix intensity would be increased if neat petrol were used. Therefore, an excitation wavelength above 266 nm was searched with the best marker-to-matrix-ratio. The bar graph (Fig. 4b) shows that the intensities of the TMPPD marker and the petrol matrix decrease with increasing wavelength. Even so, the marker-to-matrix-ratio increases from around two at 266 nm to a plateau of seven between 337 nm and 355 nm. Similar results were found for the marked diesel matrix. But the separation of marker and matrix peak was easier due to delayed matrix evaporation. Due to the greater flexibility offered by the Nd:YAG pump laser used, 355 nm was chosen as the preferred laser wavelength with a pulse energy of 2 mJ (see ESI Fig. S3†).
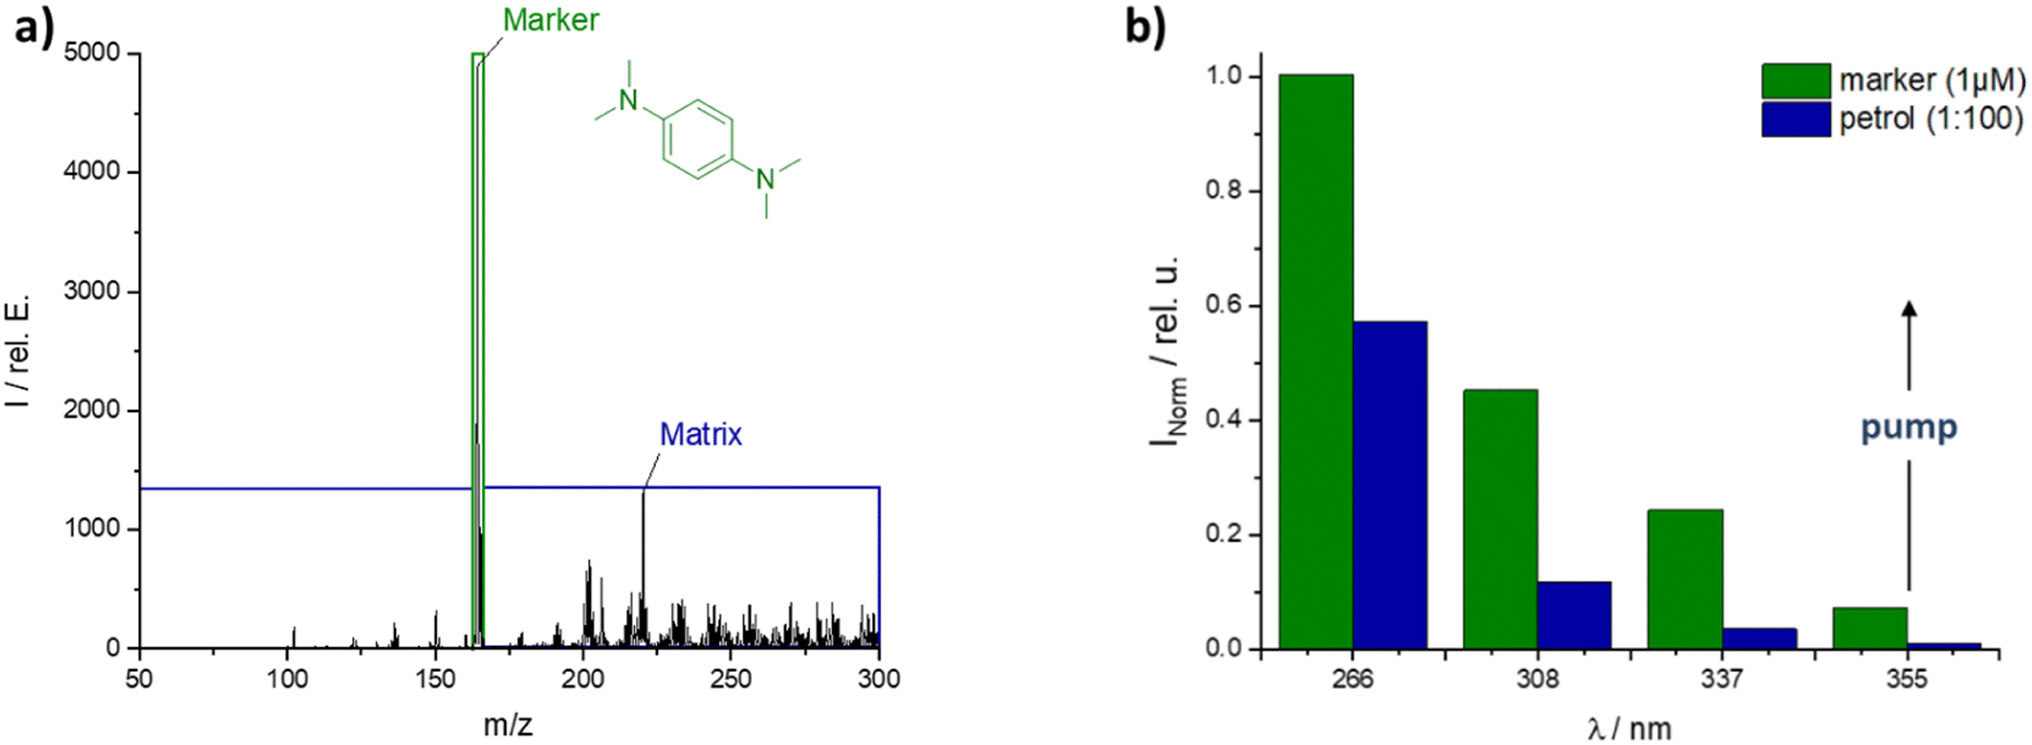 | ||
| Fig. 4 (a) MS-spectrum of marked petrol at 266 nm and (b) normalized intensity of marker or matrix over excited wavelength, both spectra: 1 μm marker TMPPD in 1:100 petrol to hexane. | ||
At this wavelength several potential candidates with heteroatoms and pure C–H were found for labeling high and low taxed fuels (Fig. 5). For all candidates, a successful photo-ionization was verified by the M+-peak in MS reference measurements (*-peak in the MS-spectra). In the IM spectrometer each of the selected candidates shows almost similar signal intensities in hexane and in the diesel matrix. Thus, for the diesel matrix no influence was found through the matrix. From the concentration required to achieve significant marker intensity, evidently nitrogen is an important component for ionization; higher concentrations are required for oxygen–C–H or for pure C–H marker candidates.
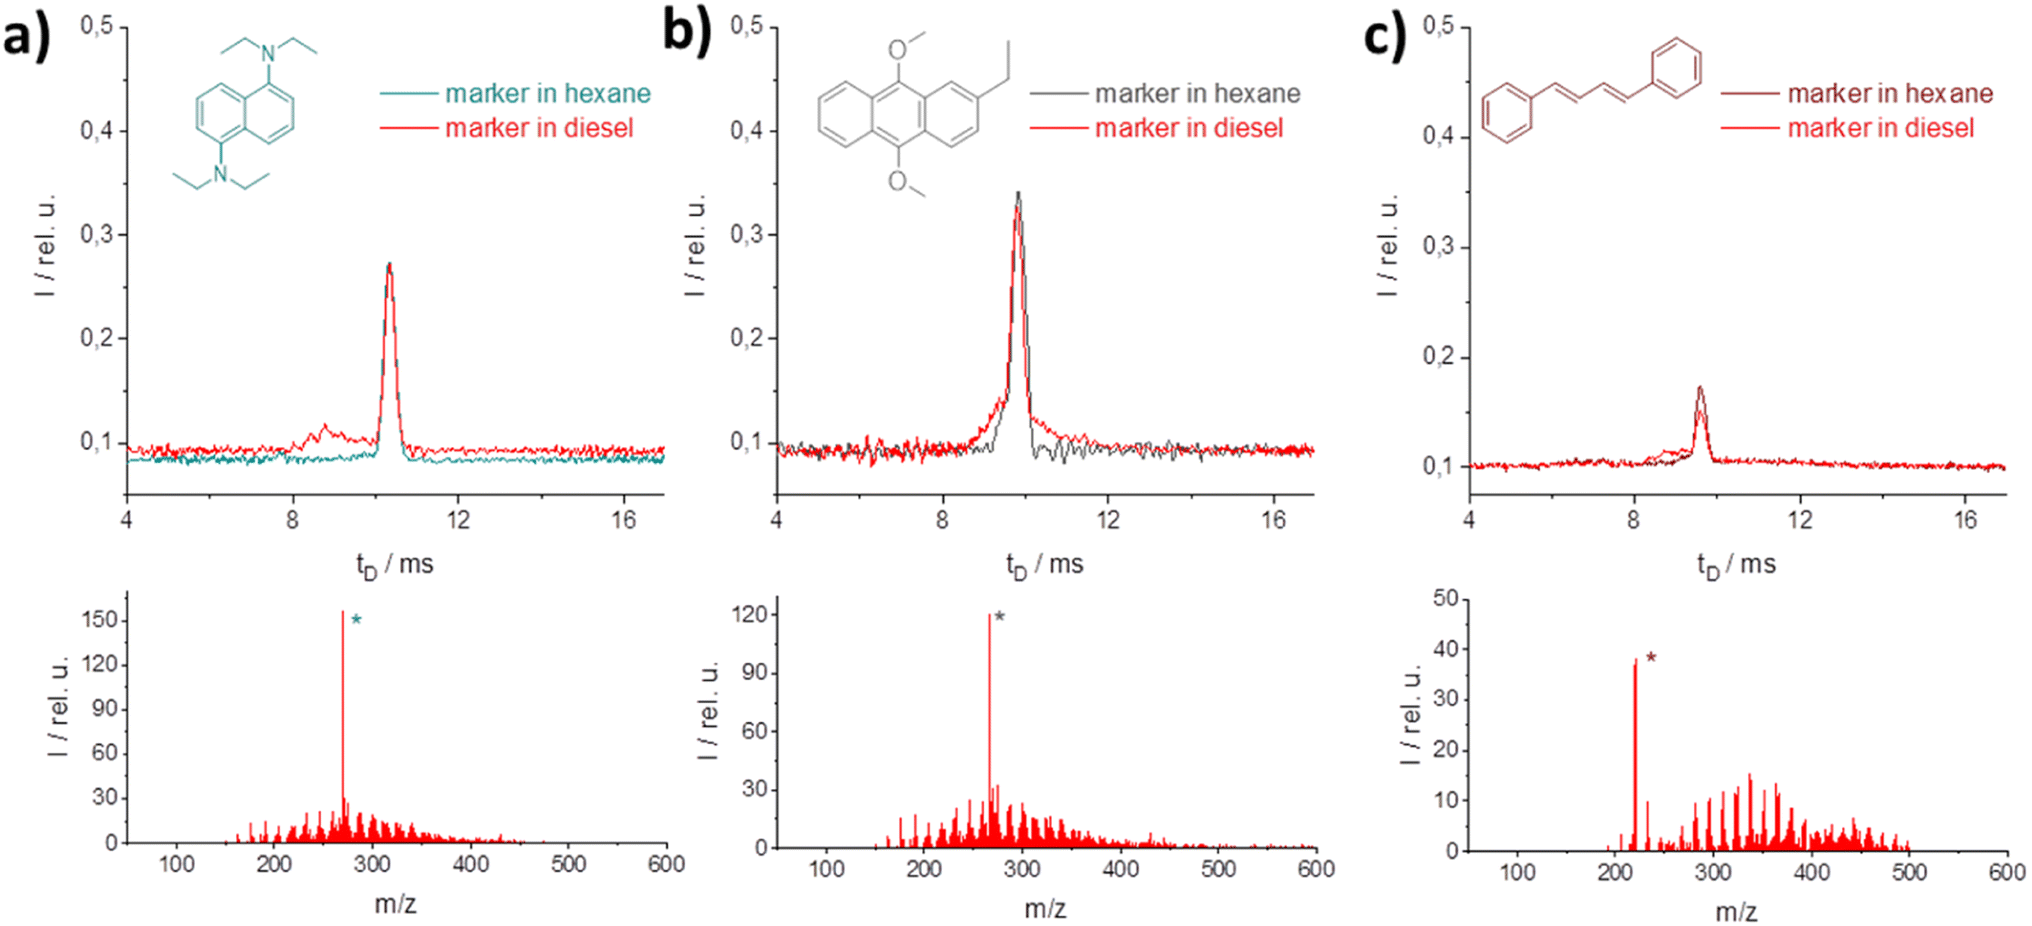 | ||
| Fig. 5 IM (top) and MS spectra (bottom) of different marker candidates in hexane or diesel matrix at 355 nm (2 mJ) excitation wavelength; (a) 2 μM solution of N1,N1,N5,N5-tetraethyl-naphthalene-1,5-diamine, (b) 100 μM of 2-ethyl-9,10-dimethoxyanthracene, (c) 100 μM of 1,4-diphenyl-1,3,-butadien. | ||
3.3. Analytical performance
Each of the selected high and low tax marker candidates were evaluated for reproducibility, the applicability in different matrices (e.g. fuels), accuracy, and their limit of detection (LOD). Here, the results of the best high tax marker TMPPD are shown (results from another candidate can be found in ESI Fig. S4†).Firstly, calibration curves of TMPPD were measured. Broad linearity and excellent limits of detection (LODs) were found in both setups (MS and IMS, Fig. 6a and b). Thus, the low detection level of marker and the wide dynamic range allow the use of low concentrations of marker and the detection of the marker in different fuel blends. The LOD from the MS setup to the IMS deteriorates by a factor of 20. However, the matrix was diluted 1:100 in the MS study, while neat fuel samples were used in the IMS. For the diluted matrices in MS and IMS very low matrix dependence was found (IMS data not shown here). The influence of the matrices increases for the neat matrix samples in IMS measurements. Strong memory effects prevented the marker from being compared in pure matrix in MS as well. In particular, a higher concentration of rapidly evaporating components in the petrol matrix shows a greater influence on the marker intensity due to simultaneous ionization with the marker and therefore a higher possibility for CTRs.
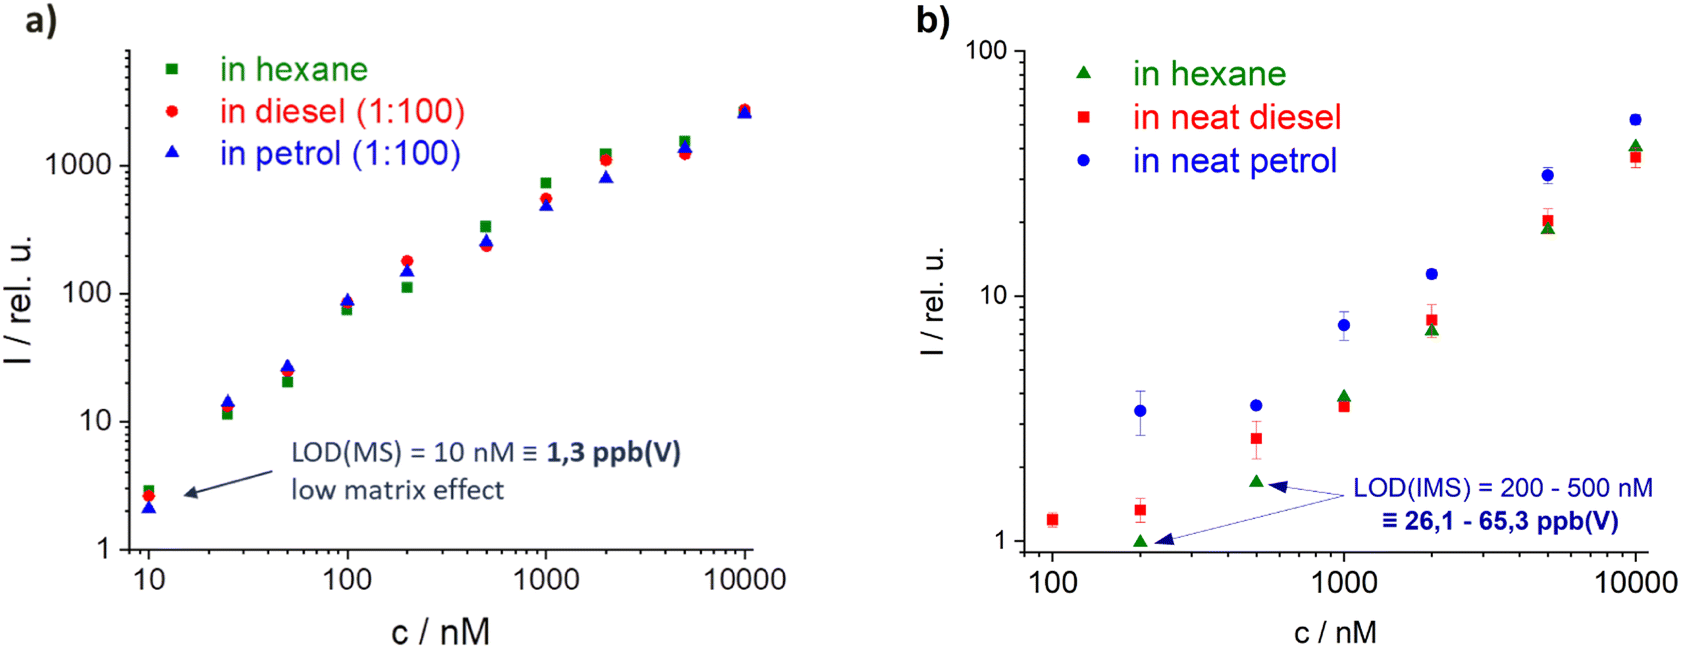 | ||
| Fig. 6 Calibration curve of TMPPD, (a) in MS with diluted matrix samples (1:100) in hexane and (b) in IMS with neat matrix, both excitation conditions: 355 nm (2 mJ). | ||
Evaluating the accuracy of the TMPPD in the IMS setup within a single matrix is essential to ensure the reliability and reproducibility of future results. To identify commercially relevant blends such as a dilution of high tax fuel, a labelled fuel is tested with only a 5% dilution of another fuel. Therefore, a comparison of a 95% labelled fuel with a 100% labelled fuel must show a significant difference in the marker intensity within one matrix, as shown in the graph in Fig. 7a. The applicability of the TMPPD marker in different fuels was verified by checking its signal intensity in 22 different matrices (7 diesel, 15 petrol). With an average intensity of 36.7 ± 1.1 the signal is nealy constant over all matrices. A deviation of 3% was observed between matrices and equally 3% within a matrix. So, there is a good applicability in different diesel and petrol matrices with small inaccuracies. The reason for these inaccuracies is delayed marker evaporation due to matrix effects or charge transfer reactions (CTRs).
 | ||
| Fig. 7 High tax marker candidate TMPPD (a) 95% vs. 100% of TMPPD in hexane diluted diesel matrix (1:100), 5-times repeat measurement, tR = time or repetition, and (b) volume integration of 1 μM TMPPD over different matrices (M1–M21 are described in Table 1); all graphs: at 355 nm (2 mJ). The 3D-integration is surrounded by start & end of the retention time (x), drift time (y) and intensity (z) of the peak of the marker. | ||
3.4. Charge transfer reaction (CTR)
In MS or IMS, CTR can occur between two or more species, resulting in ion suppression or enhancement effects that can affect the sensitivity and accuracy of a measurement. CTR is one of the most influential aspects of atmospheric pressure ionization. Charges can be transferred between matrix and marker if there are differences in ionization potential (IP for electron transfer reactions – ETR) or proton affinity (PA for proton transfer reactions – PTR).36 To reduce matrix ionization, the labelled fuel was excited at high wavelengths. To reduce ETR from marker to matrix, candidate markers with low ionization energies were found (see above). In order to identify potential components or additives in the matrices that may be part of a CTR, an intensive literature search was conducted for PA and IP of various components. A comparison of the components found in the literature with the determined m/z of the matrices identified was made, including 2,6-di-tert-butyl-4-methylphenol (DTBMP, m/z = 220.35, see ESI Fig. S5†).42 But, DTBMP shows small influence on marker intensities even at high concentrations (not shown here). Thus, other substances had to be found.One potential other additive or component with fitting IP and PA was anthracene (7.44 eV, 877.3 kJ mol−1).43 At high concentrations, anthracene is ionized at the excitation wavelength of 355 nm but is clearly distinguishable from the marker used, TMNDA, in the LIMS spectrum (Fig. 8a). In consequence the intensities of both substances can be analyzed separately. A concentration of 100 μM TMNDA gave an intensity of 0.42 (dotted horizontal line Fig. 8b). While increasing the anthracene concentration between 0.05 and 1 mM the intensity of the TMNDA signal is increasing even though the concentration of TMNDA is constant (light blue graph, Fig. 8b). The intensity of the anthracene peak instead is minimized in the presence of TMNDA compared to the neat anthracene measurements (dark blue vs. turquoise graph in Fig. 8b). This shows clearly a CTR from anthracene to TMNDA. But a significant influence on the signal intensity of TMNDA was only found above anthracene concentrations of 100 μM. In petrol the concentration is around 10 μM.44 Thus, the anthracene reaction must be just one part of the occurring CTRs.
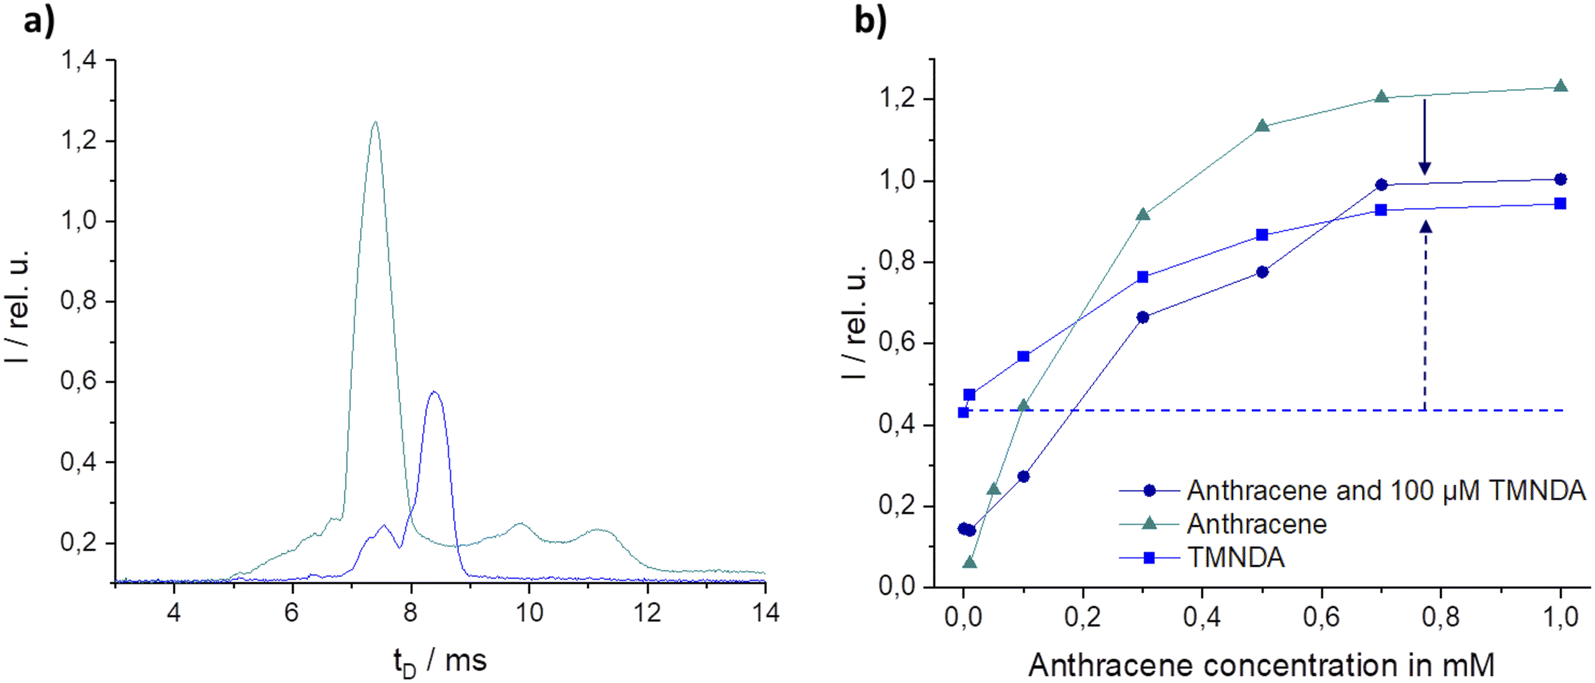 | ||
| Fig. 8 (a) LIMS-spectra of 100 μm marker N,N,N′,N′-tetramethyl-1,8-naphthalenediamine (TMNDA, blue) and 1 mM anthracene (turquoise), both in hexane (b) variation of anthracene concentration with constant concentration of 100 μM TMNDA or neat in hexane, at 355 nm excitation wavelength. | ||
4. Summary and conclusions
The use of REMPI-IMS provides a fast and efficient tool for marker analysis in complex matrices such as petrol or diesel. At an excitation wavelength of 355 nm extremely low matrix signals were obtained, allowing marker detection without pre-separation. However, CTR may occur due to vaporized components of the complex matrix, affecting the marker intensity. Anthracene was found to be one of the matrix components leading to CTR at high concentrations but CTR were negligible at the low concentrations in fuels. Several possible marker candidates for different applications were found. Their signal stability in the matrix and between matrices is around 3% and can be improved in the future by: switching from manual injection (2–4% deviation)45 to an auto sampler (<1% deviation),45 lower laser pulse-to-pulse energy stability (currently 3.5%), short pre-separation of marker and matrix, and reduced pressure in the IMS to suppress CTRs. Currently, it can be used to track distribution and identify any illegal or fraudulent activity in the fuel supply chain. A future application could be the differentiation between fuels produced from renewable sources and conventional fuels.Conflicts of interest
There are no conflicts to declare.Acknowledgements
The authors thank Paul Rosomm and Justin Koenig for help with the REMPI-(I)MS measurements.References
- M. M. Aung and Y. S. Chang, Food Control, 2014, 39, 172–184 CrossRef.
- L. F. Rahman, L. Alam, M. Marufuzzaman and U. R. Sumaila, Foods, 2021, 10, 2265 CrossRef CAS PubMed.
- OECD/EUIPO (2021), Global Trade in Fakes: A Worrying Threat, OECD Publishing, Paris, 2021 Search PubMed.
- J. Zuo, J. Feng, M. G. Gameiro, Y. Tian, J. Liang, Y. Wang, J. Ding and Q. He, Future Foods, 2022, 6, 100198 CrossRef CAS PubMed.
- M. Puddu, D. Paunescu, W. J. Stark and R. N. Grass, ACS Nano, 2014, 8, 2677–2685 CrossRef CAS PubMed.
- D. Barzallo, J. Benavides, V. Cerdà and E. Palacio, Molecules, 2023, 28, 2465 CrossRef CAS PubMed.
- D. L. Flumignan, A. G. Tininis, F. de O. Ferreira and J. E. de Oliveira, Anal. Chim. Acta, 2007, 595, 128–135 CrossRef CAS PubMed.
- D. L. Flumignan, N. Boralle and J. E. de Oliveira, Talanta, 2010, 82, 99–105 CrossRef CAS PubMed.
- J. Orzel, M. Daszykowski, I. Grabowski, G. Zaleszczyk and M. Sznajder, Fuel, 2014, 117, 224–229 CrossRef CAS.
- J. Orzel and M. Daszykowski, TrAC, Trends Anal. Chem., 2017, 87, 98–111 CrossRef CAS.
- M. A. G. Trindade, M. V. B. Zanoni and F.-M. Matysik, Fuel, 2010, 89, 2463–2467 CrossRef CAS.
- R. Timkovich, Dyes Pigm., 2000, 46, 69–79 CrossRef CAS.
- T. Wilkinson, J. Clarkson, P. C. White, N. Meakin and K. McDonald, A. W. Fountain, 2013, p. 87100G.
- E. Guanabara, K. Ltda, E. Guanabara and K. Ltda, The Handbook of Security, Palgrave Macmillan UK, London, 2nd edn, 2014 Search PubMed.
- G. A. Eiceman, Z. Karpas and H. H. Hill Jr., Ion Mobility Spectrometry, Taylor & Francis, Boca Raton, 3rd edn, 2014 Search PubMed.
- A. T. Kirk, M. Allers, P. Cochems, J. Langejuergen and S. Zimmermann, Analyst, 2013, 138, 5200–5207 RSC.
- T. Adam and R. Zimmermann, Anal. Bioanal. Chem., 2007, 389, 1941–1951 CrossRef CAS PubMed.
- W. Li, J. M. Manheim, Y. Fu, T. Laaksonen, G. Kilaz and H. I. Kenttämaa, Fuel, 2023, 343, 127993 CrossRef CAS.
- M. S. Eschner, W. Welthagen, T. M. Gröger, M. Gonin, K. Fuhrer and R. Zimmermann, Anal. Bioanal. Chem., 2010, 398, 1435–1445 CrossRef CAS PubMed.
- T. Streibel and R. Zimmermann, Annu. Rev. Anal. Chem., 2014, 7, 361–381 CrossRef CAS PubMed.
- K. W. D. Ledingham and R. P. Singhal, Int. J. Mass Spectrom. Ion Processes, 1997, 163, 149–168 CrossRef CAS.
- U. Boesl, R. Zimmermann and H. Nagel, in Analytiker Taschenbuch, ed. H. Günzler, A. M. Bahadir, K. Danzer, W. Engewald, W. Fresenius, R. Galensa, W. Huber, M. Linscheid, G. Schwedt and G. Tölg, Springer Berlin Heidelberg, Berlin, Heidelberg, 1998, vol. 19, pp. 163–213 Search PubMed.
- V. S. Antonov, I. N. Knyazev, V. S. Letokhov, V. M. Matiuk, V. G. Movshev and V. K. Potapov, Opt. Lett., 1978, 3, 37–39 CrossRef CAS PubMed.
- U. Boesl, H. J. Neusser and E. W. Schlag, Z. Naturforsch. A, 1978, 33, 1546–1548 Search PubMed.
- U. Boesl, H. J. Neusser and E. W. Schlag, Chem. Phys., 1981, 55, 193–204 CrossRef CAS.
- A. Dhahak, C. Grimmer, A. Neumann, C. Rüger, M. Sklorz, T. Streibel, R. Zimmermann, G. Mauviel and V. Burkle-Vitzthum, Waste Manage., 2020, 106, 226–239 CrossRef CAS PubMed.
- R. Zimmermann, U. Boesl, H.-J. Heger, E. R. Rohwer, E. K. Orthner, E. W. Schlag and A. Kettrup, J. High Resolut. Chromatogr., 1997, 20, 461–470 CrossRef CAS.
- D. A. Lustig and D. M. Lubman, Int. J. Mass Spectrom. Ion Processes, 1991, 107, 265–280 CrossRef CAS.
- J. E. Rink and U. Boesl, Eur. J. Mass Spectrom., 2003, 9, 23–32 CrossRef CAS PubMed.
- R. Zimmermann, W. Welthagen and T. Gröger, J. Chromatogr. A, 2008, 1184, 296–308 CrossRef CAS PubMed.
- C. Oberhüttinger, A. Langmeier and H. Oberpriller, Int. J. Ion Mobility Spectrom., 2009, 12, 23–32 CrossRef.
- T. Beitz, R. Laudien and O. Gmbh, Proc. SPIE, 2006, 6377, 1–11 Search PubMed.
- J. M. Headrick, T. A. Reichardt, T. B. Settersten, R. P. Bambha and D. A. V. Kliner, Appl. Opt., 2010, 49, 2204 CrossRef CAS PubMed.
- C. Brendler, D. Riebe, K. Zenichowski, T. Beitz and H. Löhmannsröben, Int. J. Ion Mobility Spectrom., 2014, 17, 105–115 CrossRef CAS.
- H.-G. Loehmannsroeben, T. Beitz, R. Laudien and R. Schultze, in Proceedings of SPIE, ed. A. Chu and J. Szykman, 2004, vol. 5547, p. 16 Search PubMed.
- C. Illenseer and H.-G. Löhmannsröben, Phys. Chem. Chem. Phys., 2001, 3, 2388–2393 RSC.
- C. Brendler, D. Riebe, T. Ritschel, T. Beitz and H. G. Löhmannsröben, Anal. Bioanal. Chem., 2013, 405, 7019–7029 CrossRef CAS PubMed.
- D. Riebe, A. Erler, T. Ritschel, T. Beitz, H. G. Löhmannsröben, A. Beil, M. Blaschke and T. Ludwig, J. Mass Spectrom., 2016, 51, 566–577 CrossRef CAS PubMed.
- R. Zimmermann, Anwendung isomerenselektiver lasermassenspektrometrie (LAMS) in der analytik, PhD thesis, Herbert UF, Munich, 1995.
- J. M. Masnovi, E. A. Seddon and J. K. Kochi, Can. J. Chem., 1984, 62, 2552–2559 CrossRef CAS.
- K. M. Hafner, PhD thesis, TU Munich, 2004.
- S. I. Pisareva, V. I. Pynchenkov, N. V. Ryabova, I. V. Russkikh and N. V. Yudina, J. Anal. Chem., 2001, 56, 971–974 CrossRef CAS.
- F. Sharipov and V. Seleznev, J. Phys. Chem. Ref. Data, 1998, 27, 657–706 CrossRef CAS.
- Y. Goto, K. Nakamuta and H. Nakata, Ecotoxicol. Environ. Saf., 2021, 224, 112644 CrossRef CAS PubMed.
- A. Tipler, in Handbooks in Separation Science – Gas Chromatography, ed. C. F. Poole, Elsevier, 2nd edn, 2012, pp. 187–219 Search PubMed.
Footnote |
| † Electronic supplementary information (ESI) available. See DOI: https://doi.org/10.1039/d3ay01994b |
| This journal is © The Royal Society of Chemistry 2024 |