
 Open Access Article
 This Open Access Article is licensed under a Creative Commons Attribution-Non Commercial 3.0 Unported Licence
SA-ODG platform: a semi-automated and PCR-free method to analyse microRNAs in solid tissues†
S.
Detassis
 a,
F.
Precazzini‡
b,
I.
Brentari
b,
R.
Ruffilli
a,
C.
Ress
a,
A.
Maglione
a,
S.
Pernagallo
*c and
M. A.
Denti
*b
a,
F.
Precazzini‡
b,
I.
Brentari
b,
R.
Ruffilli
a,
C.
Ress
a,
A.
Maglione
a,
S.
Pernagallo
*c and
M. A.
Denti
*b
aOPTOI SRL, Via Vienna 8, 38121, Trento, Italy. E-mail: salvatore.pernagallo@destinagenomics.com
bDepartment of Cellular, Computational and Integrative Biology (CIBIO), University of Trento, Via Sommarive 9, 38123, Trento, Italy
cDESTINA Genomica SL, Parque Tecnológico de la Salud (PTS), Avenida de la Innovación 1, 18016 Granada, Spain
First published on 12th July 2024
Abstract
Over the past two decades, numerous techniques have been developed for analysing microRNAs in body fluids and tissues. However, these techniques still face technical challenges, particularly when compared to well-established techniques for proteins and metabolites. Recently, the ODG platform was introduced, which is an innovative technology that allows for the direct detection and quantification of microRNAs in liquid biopsies without requiring extraction or amplification. This study presents the implementation of the ODG platform within a semi-automated protocol to create the “SA-ODG” platform, enhancing the efficiency and precision of microRNA testing while reducing hands-on time required by laboratory staff. For the first time, the SA-ODG platform has been used to directly quantify microRNAs in solid tissues. The results demonstrate precise analysis of miR-122-5p in mouse liver tissues using SA-ODG. These developments represent a crucial step forward in advancing the field of extraction and amplification-free microRNA detection and quantification.
Introduction
microRNAs (miRNAs) are a class of small non-coding RNAs involved in post-transcriptional regulation by promoting translation inhibition or mRNA degradation.1 miRNAs, with their differential expression in pathological states, are quickly becoming key indicators for the diagnosis and prediction of a wide range of diseases, holding promising prospects as clinically relevant biomarkers.2–6,48 Over the past two decades, several techniques have been developed for analysing the expression of miRNAs in both biological fluids and solid tissues.7,8 However, persistent technical challenges, particularly for the direct testing of these molecules, limit their use in clinical practice.8,9The primary challenges with the gold standard RT-qPCR method for analysing miRNAs arise from its demanding workflow, which encompasses RNA extraction, cDNA conversion, labelling, and target amplification. These steps introduce undesired variability and complexity, impeding their practical use in clinical settings.10–14 Moreover, many current alternative techniques to RT-qPCR, such as branched DNA,15 Fireplex,16 and nCounter,17 still require RNA extraction and/or PCR amplification.8
In response to these challenges, in 2019 our group developed the OPTOI-DESTINA Genomica (ODG) platform, a novel analytical biosensor designed for the direct testing of circulating miRNAs. The platform was successfully used to analyse miR-21-5p in plasma samples of patients with Non-Small Cell Lung Cancer (NSCLC).18 This platform integrates Dynamic Chemical Labelling (DCL) with a state-of-the-art silicon photomultiplier (SiPM)-based reader. This optoelectronic sensor can detect light from near UV to near IR, making it essential in applications that require high-resolution quantification of low-light signals. Moreover, DCL, a technology for miRNA analysis, uses a unique biotinylated aldehyde-modified SMART nucleobase (SMART base-biotin) along with a modified peptide nucleic acid (PNA) capture probe that is synthesized with an abasic position (abasic PNA probe).19 The detection process with DCL involves two precise steps: (1) the abasic PNA probe captures the complementary miRNA sequence, forming a chemical pocket. Once the target miRNA hybridization is complete, the SMART base-biotin is covalently attached to the backbone of the abasic PNA probe, creating a chemical lock-up. (2) The duplex is then read out using a reporter molecule that recognizes the biotin tag. Essentially, DCL requires two specific molecular events to generate a signal: (a) perfect hybridization between the miRNA strand and the abasic PNA probe and (b) specific molecular recognition, according to Watson–Crick base-pairing rules, by the SMART base-biotin. When these two molecular events do not occur, the incorporation of the SMART base-biotin does not happen, hence ensuring 100% specificity.20–22 Therefore, the main advantages of DCL are: (1) significantly reduced number of false positives and (2) direct detection of the analyte without either extraction or amplification. The entire process, including reaction steps and washings, is facilitated by immobilizing the abasic PNA probes onto magnetic beads.23
DCL has been demonstrated and validated against the gold-standard RT-qPCR in multiple studies. It was used to analyse circulating miR-122-5p in serum samples from patients with drug-induced liver injury, as well as to analyse miR-451a-5p in whole blood samples and miR-21-5p in cell lysates and plasma.18,20–22,24–32 In addition, DCL has been applied to detect a variety of pathogens, including viruses and parasites, and can also analyse alpha satellite DNA in in situ hybridization.33–36
Over the years, our group has used the ODG platform as a versatile tool for chemiluminescence detection of circulating miRNAs.18 The ODG platform features an 8-channel SiPM array that is compatible with standard 8-channel pipettes. Despite enhancements in sensitivity and specificity, the current ODG platform has not yet achieved the high reliability required for miRNA-based clinical tests. This is primarily due to its manual and labour-intensive sample and reagent preparation steps, which introduce variability.
To address these challenges, this work has developed a semi-automatized version of the ODG platform, referred to as the “SA-ODG platform,” which significantly enhances miRNA analysis. This upgraded platform combines the ultra-specificity of the original ODG technology with a liquid handler and a semi-automatic washer. This implementation significantly enhances the platform's capabilities, allowing for the processing of a larger number of assays within a specified timeframe. Automating manual steps reduces labour requirements, improves efficiency, and ensures consistent and reliable results.
For the first time, the SA-ODG platform has enabled the direct detection and quantification of miR-122-5p in mouse liver tissue sections, removing the need for RNA extraction and amplification. This advancement leveraged the use of the unique Stabiltech buffer, a lysing solution that releases and stabilizes miRNAs during tissue homogenization and processing. miR-122-5p was selected for this proof of concept because it has been widely described as an excellent biomarker for liver disease.37–40
This work describes the development of the SA-ODG platform and introduces a significant innovation that enhances the detection process and expands the use of DCL in solid tissues through a semi-automated protocol. Additionally, it demonstrates, for the first time, its ability to directly detect miRNAs in solid tissues. It shows the versatility of the novel platform for a wide range of research and diagnostic applications based on miRNA testing in liquid and/or solid biopsies.
Materials and methods
Materials and instrumentation
The HPLC-purified RNA oligomer mimic miR-122-5p was purchased from Eurofins and resuspended in DNase/RNase-free water (Table S1†). Unless specified differently, all chemicals and solvents were obtained from Merck and used as received. Dynabeads M-270, 2.8 μm diameter superparamagnetic beads presenting carboxylic acid groups (catalog# 14305D), and the SuperSignal ELISA femto substrate (catalog #37075) were obtained from Thermo Fisher Scientific. Streptavidin-HRP (horseradish peroxidase) was purchased from Moss Bio (catalog #SAHRP). Custom abasic PNA probes (DGL) and Stabiltech buffer (confidential formulation) were provided by DESTINA Genomica SL. DGL probe sequences and their targets are shown in Table S1.† Commercial human serum was obtained from Merck (catalog #H4522). The OT-2 liquid handler is a Cartesian liquid handler designed to transfer 1–1000 microliter volumes of aqueous and DMSO-based solutions, and it was purchased from Opentrons. The 405TS plate washer is a semi-automatic plate washer designed to efficiently wash cell-based assays, microsphere-based assays, and ELISA applications, and it was purchased from Biotek. RNA extraction was performed with Trizol obtained from Qiagen (catalog #79306). The RT-qPCR was performed using the ID3EAL miRNA qPCR Assay (MiRXES) and detected with a CFX96 Real-Time PCR Detection System (BIO-RAD). 96-Well plates (8-well in a support frame with 96 spaces) were purchased from Biomat (catalog #MT03F1-NB). 96-Well plate incubations were performed using a Thermoshaker (Thermo Fisher Scientific).Tissue sample pre-processing
Liver and kidney pieces were retrieved from euthanized C57BL/6 mice (ethical approval: 545/2020-PR) and kindly donated by the laboratory of Professor Fulvio Chiacchiera (University of Trento, Italy). Each liver and kidney tissue was divided further into small sections of the same weight (13 ± 1 mg). Each tissue section was homogenized in 300 μL of Stabiltech buffer or Trizol with metallic beads (catalog #116925050-CF, MP Biomedicals) in a Tissue Lyser apparatus (Qiagen). Centrifugation (1200g, 1 minute) was performed for removing the solid matrix and cellular debris. The supernatant was tested using the SA-ODG platform or for RNA extraction and RT-qPCR analysis.SA-ODG platform equipment
The SA-ODG platform was equipped with six mother master mixes prepared manually and disposable plastic consumables. Below is reported the composition of the six master mixes, 1 to 3 contained in a 2 mL vial and 5 to 7 in a 22 mL reservoir:1. Master mix #1 (MM1): Stabiltech buffer, abasic PNA probe-coupled magnetic beads (DGL-beads; abasic PNA probe for capturing miR-122-5p), human serum and miRNA oligomer spike-ins (14 ng mL−1).
2. Master mix #2 (MM2): Stabiltech buffer, DGL-beads (abasic PNA probe for capturing miR-122-5p) and human serum.
3. Master mix #3 (MM3): Stabiltech buffer and DGL-beads (abasic PNA probe for capturing miR-122-5p).
4. DCL master mix: 2× SSC + 0.1% SDS buffer, sodium cyanoborohydride (1 mM) and SMART-C-biotin (2 μM).
5. HRP-streptavidin master mix (HRP-SA master mix): HRP-SA (1![[thin space (1/6-em)]](https://www.rsc.org/images/entities/char_2009.gif) :8000) in PBS + 0.1% Tween20.
:8000) in PBS + 0.1% Tween20.
6. HRP substrate: SuperSignal ELISA femto substrate.
The disposable plastic consumables included the following: two 96-well plates composed of 8-well strips and plastic tips for P300 GEN2 (20–300 μL) and P20 GEN2 (1–20 μL) by Opentrons.
SA-ODG platform workflows for the calibration curve and sample testing
Initially, a 96-well plate (8-well strips in a support frame with 96 spaces) is prepared to generate the calibration curve and to load samples for testing.- 47 μL of sections 1–3 were loaded in technical triplicate respectively in wells from A3 to A5, B3 to B5, and C3 to C5.
- 47 μL of section 4 was loaded in wells D3, D4, and D5.
MM3 was dispensed by the liquid handler into all wells to a final volume of 50 μL. Each well contained 2 × 10⁵ DGL-beads. Dispensing of MM3 was carried out using a single plastic tip for each tissue section.
RNA extraction
RNA extraction was performed by the phenol–chloroform method. Briefly, 1 mL of Trizol was added to 150 μL of pre-processed liver and kidney sections and mixed thoroughly. 200 μL of chloroform was added to the mixture for phase separation. The aqueous phase was taken and washed with 500 μL of isopropanol and 1 mL of ethanol. The RNA pellet was resuspended in 40 μL of DNase- and RNase-free water. RNA concentrations were measured using a NanoDrop 1000 spectrophotometer (Thermo Fisher).RT-qPCR testing
Statistics and analysis
The RT-qPCR calibration curve was fitted with a linear model, while the SA-ODG calibration curve was fitted with a 4PL model. The lower limit of quantitation (LLoQ) was calculated by interpolating the background signal [negative control signal (NCS) + 10 × standard deviation of NCS] into each fitting model. Precision was calculated by dividing the standard deviation by the average signal, in percentage, for each point of the calibration curves. Accuracy was determined by backcalculating the concentration resulting from interpolating the signal of each point of the calibration curve into the fit model and subtracting it from the actual concentration used.Results and discussion
SA-ODG development
The SA-ODG platform was developed by integrating the existing ODG platform with a liquid handler and a semi-automated washing system. Positioned on a standard laboratory bench, these components occupy a compact area of 1 m2, creating an efficient bench-top system for nucleic acid testing. The SA-ODG platform is equipped with six master mixes, prepared manually as described in the Materials and methods section.SA-ODG platform workflow
Traditional bench-top reader systems, like the ODG platform, are generally used only for the final reading step in the complex process of sample handling. The SA-ODG platform, however, is designed to support scientists in managing the entire process from beginning to end. Unlike the ODG platform, where all steps are manual—including sample pre-processing, preparation of master mixes and solutions, reagent dispensing, conducting DCL reactions, and measurement—the SA-ODG platform integrates these procedures into a semi-automated workflow conducted in a 96-well plate (8-well strips in a support frame with 96 spaces). This advancement simplifies the generation of calibration curves and the testing of samples. A detailed description of the four steps of the SA-ODG platform workflow follows, along with a summary presented in Fig. 1.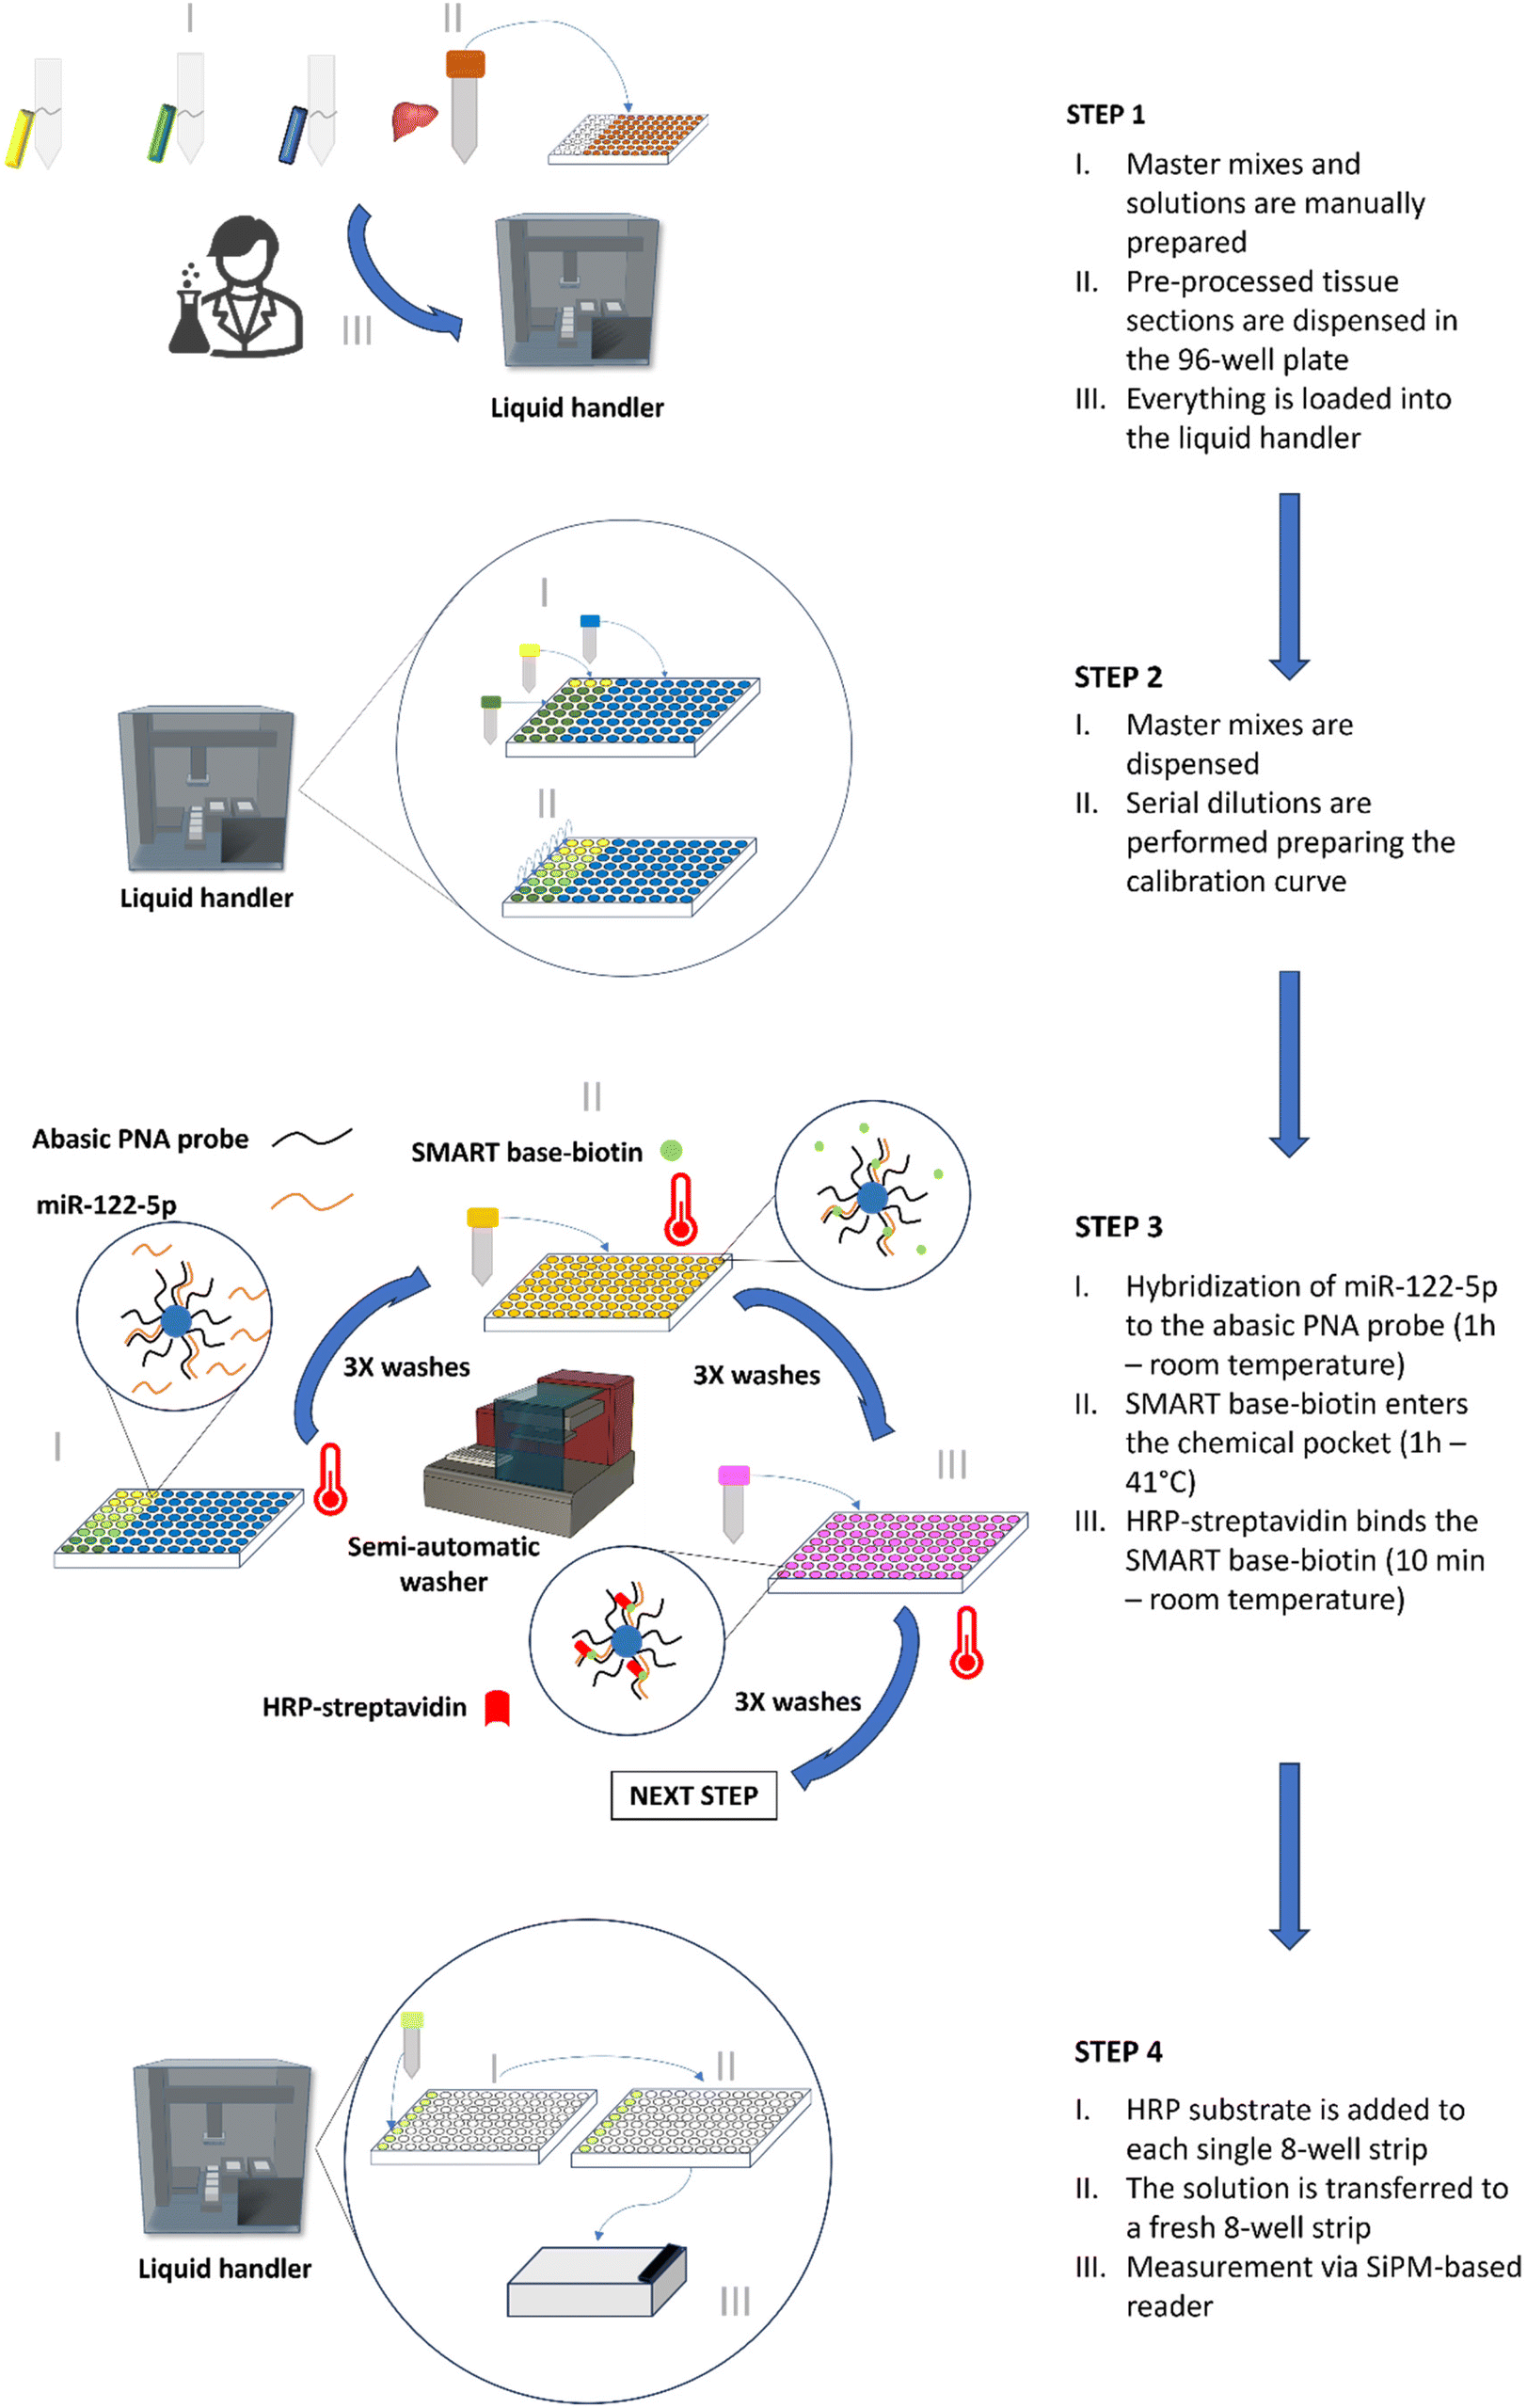 | ||
| Fig. 1 SA-ODG platform workflow. STEP 1: equipping the liquid handler with master mixes, solutions and the homogenised tissue sections into the 8-well strips in a support frame with 96 spaces; STEP 2: calibration curve and sample testing preparation; STEP 3: DCL reaction for SMART base-biotin incorporation and HRP-streptavidin labelling; STEP 4: chemiluminescent signal measurement via the SiPM-based reader. | ||
STEP 1: The liquid handler is equipped with disposable tips, a 96-well plate, three 2 mL vials containing MM1, MM2, and MM3 and three solutions (DCL master mix; HRP-SA master mix; and the HRP substrate) in a single 22 mL reservoir. Additionally, liver/kidney sections are pre-processed as described in the Materials and methods section.
STEP 2: The liquid handler automatically dispenses the master mixes into the 96-well plate to (1) generate a calibration curve using spike-ins (miRNA mimic oligomers) in commercially available serum and (2) analyse endogenous miR-122-5p from liver/kidney tissue lysates already placed in the 96-well plate in STEP 1.
STEP 3: The DCL reaction (Fig. S1†) is conducted to label both the miRNA oligomers for the spike-ins and the endogenous miRNA in liver/kidney tissue lysates. The DCL reaction involves incubation periods to allow for hybridization of targets, SMART base-biotin incorporation, and labelling with HRP-streptavidin.
Washings are performed within the 96-well plate using a semi-automated washer.
STEP 4: The final step involves measuring the outcome of STEP 3 using a SiPM-based reader. The HRP substrate is dispensed into each single 8-well strip of the 96-well plate, mixed and transferred to a fresh reading 8-well strip. The use of a fresh reading strip allows the reduction of any background signal due to unspecific binding of excess HRP to plastic.41
The SA-ODG platform, with its workflow and plate, allows the generation of an 8-point calibration curve run in technical duplicate and processing of up to 26 tissue sections in technical triplicate simultaneously. The total workflow time is 3 h from STEP 1 to STEP 4 (Fig. 1).
SA-ODG platform for solid tissue analysis
In this study, the SA-ODG platform was used to directly analyze miR-122-5p in liver tissue sections. To evaluate the workflow described in the previous paragraph, liver and kidney tissue sections from mice were retrieved and sectioned into uniform pieces (13 ± 1 mg).The tissue sections were first subjected to a pre-processing step that included homogenization using metallic beads with the Stabiltech buffer. This process transformed the tissue into a liquid suspension, effectively separating the solid matrix and cellular debris through centrifugation. The Stabiltech buffer is a unique pre-treatment buffer that in combination with DCL technology allows for the direct detection of miRNAs. So far it has been used for the pre-treatment of liquid matrices such as serum, plasma, and whole blood,29,30 but it has never been applied before for analysing miRNAs in solid tissues. In this study, for the first time, the Stabiltech buffer has been used with the SA-ODG platform for the pre-treatment of solid tissues. To confirm the value of the Stabiltech buffer in solid tissues, its performance in homogenizing and lysating solid tissues was compared with the gold standard Trizol. Therefore, two liver sections were treated respectively with Trizol and Stabiltech buffer. The two liquid suspensions obtained were collected and studied. The study aimed to determine the quantity of total RNA liberated after the treatment. Total RNA was extracted using a commercial total RNA extraction kit and quantified via spectrophotometry. RNA yields from liver sections are as follows:
- Trizol processing: 1366.2 ng μL−1
- Stabiltech processing: 1200 ng μL−1
Although the results showed a slightly better yield of total RNA liberation with Trizol, the Stabiltech buffer also successfully liberated total RNA. It provided a significant yield from processed solid tissues, sufficient for downstream miRNA processing.
Upon the confirmation that the Stabiltech buffer was able to liberate RNA, the SA-ODG platform was used to quantitate miR-122-5p in liver tissue sections with absolute precision. Benchmarking was performed with the gold-standard RT-qPCR TaqMan method. Calibration curves of the SA-ODG platform and RT-qPCR were established using synthetic RNA miR-122-5p spike-ins (Fig. 2A and B). Subsequently, three liver tissue sections were analyzed with both the SA-ODG platform and RT-qPCR for detecting endogenous miR-122-5p. Additionally, negative control experiments (Fig. S2†) were conducted to confirm the high specificity of the SA-ODG platform by detecting miR-122-5p in kidney tissue sections (Fig. 2C). miR-122-5p is present in low quantities in the kidneys. As expected, the negative control did not show a signal, indicating that the quantification achieved by the SA-ODG platform is highly specific. It is worth noting that while miR-122-5p is present in the kidneys as verified by RT-qPCR (Fig. 2D), its amount (0.13 pg mL−1) falls below the lower limit of quantitation (LLoQ) of the SA-ODG platform (64.7 pg mL−1) calculated from the calibration curve data. Using the calibration curves, the absolute quantity of endogenous miR-122-5p was extrapolated from both SA-ODG and RT-qPCR analyses of liver tissue sections. The results in Fig. 3 show that SA-ODG absolute miRNA quantification (median 281.6 pg mL−1) is comparable to the one provided by RT-qPCR (median 292.9 pg mL−1). These findings demonstrate the capability of SA-ODG for accurate PCR-free absolute quantification of miR-122-5p in liver tissues. This marks the first application of the ODG platform for solid tissues, requiring minimal pre-processing steps. Further analytical analysis of SA-ODG and RT-qPCR data allowed the building of a competitive matrix shown in Table 1. Precision and accuracy are comparable, demonstrating the robustness of the SA-ODG platform. The SA-ODG platform throughput is higher, resulting in reduced hands-on time, which in turn liberates the user for more critical tasks. Moreover, SA-ODG does not require RNA extraction, which could introduce variability in the analysis. SA-ODG is also superior to the previous manual protocol regarding all the criteria taken under consideration.
 | ||
| Fig. 2 SA-ODG and RT-qPCR analyses. (A) Calibration curve of SA-ODG with spike-ins of synthetic miR-122-5p. The red dots represent the luminescent unit signal for miR-122-5p in liver tissue sections. LLoQ = lower limit of quantitation (64.7 pg mL−1). (B) Calibration curve of RT-qPCR with spike-ins of synthetic miR-122-5p. The red dots represent the Ct values of miR-122-5p in liver tissue sections. (C) Luminescent unit signal of miR-122-5p in liver and kidney tissue sections. (D) Ct values of miR-122-5p in liver and kidney tissue sections. | ||
 | ||
| Fig. 3 RT-qPCR and SA-ODG quantification of miR-122-5p in liver tissue sections. | ||
| LLoQ | Manual ODG, ng mL−1 | SA-ODG, pg mL−1 | RT-qPCR, fg mL−1 |
|---|---|---|---|
| Precision | <25% | <10% | <10% |
| Accuracy | <15% | <15% | <10% |
| Throughput | Low | High | Medium |
| Hands-on time | Medium | Very low | High |
| RNA extraction | No | No | Yes |
Conclusions
Over the past two decades, there has been a constant attempt to either improve the gold-standard RT-qPCR method or find alternatives for miRNA detection and quantification.8 Yet, miRNAs present several challenges due to their short sequence, difficulties in the normalization analysis and, in the case of those found in biofluids, their low abundance. Several variances of the RT-qPCR standard procedure have been introduced such as ddPCR,42 RT-qPCR-DS (direct detection in serum),43 Direct S-Poly(T) Plus44 and multiplex circulating Fireplex16 to avoid RNA extraction or retro transcription steps.Introduced in 2019, the ODG platform marked a significant advancement in this field, by demonstrating the feasibility of a highly specific, sensitive, and reliable analytical biosensor capable of directly detecting miRNAs and small nucleic acids in general. The ODG platform addressed many challenges posed by existing analytical methods by eliminating the need for RNA extraction, target labeling, and PCR amplification.
The ODG platform has played a crucial role in the analysis of circulating miRNAs found in liquid biopsies. The platform has demonstrated a significant limit of detection, allowing for the successful and direct identification of hsa-miR-21-5p in plasma samples obtained from patients with NSCLC.18 However, it is worth noting that the ODG platform initially operated with a relatively manual approach, which presented certain challenges in its operation similar to many other benchtop readers. Recognizing the need to address these operational constraints, a decision was made to create the SA-ODG platform by integrating a liquid handler and a semi-automated washer with the ODG platform. This strategic integration facilitated automation, streamlining the workflow, and improving efficiency. The SA-ODG platform is a significant milestone in the evolution of the ODG platform, transitioning it from a manual to a semi-automated system. This advancement improves assay throughput by increasing the number of samples tested from 5 to 26 in a single run thanks to the 96-well plate format. In addition, the automation significantly reduces manual labor by reducing hands-on time of about 90%, with a user-friendly protocol designed for ease of use, even by those with limited technical skills. Reducing hands-on time is pivotal; it frees operators for more critical tasks, lowers test costs, and diminishes the possibility of human errors. This study also illustrates the workflow efficiency of the SA-ODG platform, achieving a 50% reduction in total assay time for the direct analysis of small nucleic acids compared to the gold-standard RT-qPCR and the manual ODG platform.
This work outlines the effort involved in this transition, presenting the potential of the SA-ODG platform to revolutionize small nucleic acid analysis in clinical and research settings. The protocol used the unique Stabiltech buffer that allows the lysation of the tissue and stabilization of miRNAs. To the best of our knowledge, this is the first work analyzing miRNAs in solid tissues without RNA extraction or PCR amplification with the support of a full semi-automatized workflow.
This proof-of-concept, demonstrated with miR-122-5p, opens up the possibility of miRNA quantification in solid biopsies for diagnostic purposes, which has been shown to have clinical significance.4,45–47 Moreover, the platform shows promise for use in further applications involving nucleic acids in general, such as animal-based pharmacological studies that rely on tissue analysis to comprehend pharmacokinetics and pharmacodynamics. Additionally, modern pharmaceutical approaches, including organoids, iPSCs, and organ-on-chip technologies, require efficient processing of solid matrices.
In conclusion, the implementation of the SA-ODG platform presents an innovative nucleic acid testing tool for the direct qualitative and quantitative analysis of small nucleic acid biomarkers in tissue biopsies using a semi-automated approach.
Data availability
The data that support the findings of this study are momentarily embargoed to allow for commercialization of research findings.Author contributions
S. D., S. P., F. P., I. B., C. R. and R. R. contributed to the design of the experiments of this work. S. D., F. P., I. B. and R. R. performed the experiments. S. D. and S. P. wrote the manuscript. S. D., R. R., C. R., A. M., S. P. and M. A. D. critically revised the manuscript. A. M., S. D., C. R., M. A. D., and S. P. secured funding for this study. All authors have read and agreed to the published version of the manuscript.Conflicts of interest
The authors declare the following competing financial interest(s): S. P. is a shareholder of DESTINA Genomica SL. A. M. is the owner and President of OPTOI SRL. DESTINA Genomica SL has all commercial rights to its reagents.Acknowledgements
The authors thank the staff of DESTINA Genomica SL and OPTOI SRL for their important technical support, and Professor Fulvio Chiacchiera and his team for providing the tissue sections from mice. This study has received funding from H2020-MSCA-RISE-2020 under grant agreement no 101007934 and from Fondazione CARITRO under the project entitled “Un dispositivo diagnostico innovativo per la misurazione di microRNA in biopsie liquide”.References
- D. P. Bartel, Cell, 2004, 116, 281–297 CrossRef CAS PubMed.
- C. E. Condrat, D. C. Thompson, M. G. Barbu, O. L. Bugnar, A. Boboc, D. Cretoiu, N. Suciu, S. M. Cretoiu and S. C. Voinea, Cells, 2020, 9, 276 CrossRef CAS PubMed.
- S. Detassis, M. Grasso, V. Del Vescovo and M. A. Denti, Front. Cell Dev. Biol., 2017, 5 Search PubMed.
- S. Detassis, V. del Vescovo, M. Grasso, S. Masella, C. Cantaloni, L. Cima, A. Cavazza, P. Graziano, G. Rossi, M. Barbareschi, L. Ricci and M. A. Denti, Front. Mol. Biosci., 2020, 7, 86 CrossRef CAS PubMed.
- M. Grasso, P. Piscopo, A. Crestini, A. Confaloni and M. A. Denti, Exper. Suppl., 2015, 106, 151–169 CAS.
- S. Detassis, F. Precazzini, M. Grasso, V. Del Vescovo, F. Maines, O. Caffo, P. Campomenosi and M. A. Denti, Int. J. Mol. Sci., 2024, 25, 5573 CrossRef CAS PubMed.
- T. Ouyang, Z. Liu, Z. Han and Q. Ge, Anal. Chem., 2019, 91, 3179–3186 CrossRef CAS PubMed.
- F. Precazzini, S. Detassis, A. S. Imperatori, M. A. Denti and P. Campomenosi, Int. J. Mol. Sci., 2021, 22, 1–27 Search PubMed.
- H. Butz and A. Patócs, Exp. Suppl., 2015, 106, 55–71 CAS.
- O. Bryzgunova, M. Konoshenko, I. Zaporozhchenko, A. Yakovlev and P. Laktionov, Diagnostics, 2021, 11, 865 CrossRef CAS PubMed.
- E. Ban and E. J. Song, Genes, 2022, 13(2), 328 CrossRef CAS PubMed.
- M. Mussbacher, T. L. Krammer, S. Heber, W. C. Schrottmaier, S. Zeibig, H. P. Holthoff, D. Pereyra, P. Starlinger, M. Hackl and A. Assinger, Cells, 2020, 9, 1915 CrossRef CAS PubMed.
- W. W. Wilfinger, H. R. Eghbalnia, K. Mackey, R. Miller and P. Chomczynski, PLoS One, 2023, 18(11), e0291209 CrossRef CAS PubMed.
- A. Brunet-Vega, C. Pericay, M. E. Quílez, M. J. Ramírez-Lázaro, X. Calvet and S. Lario, Anal. Biochem., 2015, 488, 28–35 CrossRef CAS PubMed.
- L. Cheng, Z. Zhang, D. Zuo, W. Zhu, J. Zhang, Q. Zeng, D. Yang, M. Li and Y. Zhao, ACS Appl. Mater. Interfaces, 2018, 10, 34869–34877 CrossRef CAS PubMed.
- M. R. Tackett and I. Diwan, Methods Mol. Biol., 2017, 1654, 209–219 CrossRef CAS PubMed.
- P. M. Godoy, A. J. Barczak, P. DeHoff, S. Srinivasan, A. Etheridge, D. Galas, S. Das, D. J. Erle and L. C. Laurent, Cell Rep., 2019, 29, 4212 CrossRef CAS PubMed.
- S. Detassis, M. Grasso, M. Tabraue-Chávez, A. Marín-Romero, B. López-Longarela, H. Ilyine, C. Ress, S. Ceriani, M. Erspan, A. Maglione, J. J. Díaz-Mochón, S. Pernagallo and M. A. Denti, Anal. Chem., 2019, 91, 5874–5880 CrossRef CAS PubMed.
- F. R. Bowler, J. J. Diaz-Mochon, M. D. Swift and M. Bradley, Angew. Chem., Int. Ed., 2010, 49, 1809–1812 CrossRef CAS PubMed.
- D. M. Rissin, B. López-Longarela, S. Pernagallo, H. Ilyine, A. D. B. Vliegenthart, J. W. Dear, J. J. Díaz-Mochón and D. C. Duffy, PLoS One, 2017, 12(7), e0179669 CrossRef PubMed.
- S. Venkateswaran, M. A. Luque-González, M. Tabraue-Chávez, M. A. Fara, B. López-Longarela, V. Cano-Cortes, F. J. López-Delgado, R. M. Sánchez-Martín, H. Ilyine, M. Bradley, S. Pernagallo and J. J. Díaz-Mochón, Talanta, 2016, 161, 489–496 CrossRef CAS PubMed.
- S. Pernagallo, G. Ventimiglia, C. Cavalluzzo, E. Alessi, H. Ilyine, M. Bradley and J. J. Diaz-Mochon, Sensors, 2012, 12, 8100–8111 CrossRef CAS PubMed.
- E. Garcia-Fernandez, M. C. Gonzalez-Garcia, S. Pernagallo, M. J. Ruedas-Rama, M. A. Fara, F. J. López-Delgado, J. W. Dear, H. Ilyine, C. Ress, J. J. Díaz-Mochón and A. Orte, Chem. Commun., 2019, 55, 14958–14961 RSC.
- A. Marín-Romero and S. Pernagallo, Anal. Methods, 2023, 15, 6139–6149 RSC.
- A. Marín-Romero, V. Regele, D. Kolanovic, M. Hofner, J. J. Díaz-Mochón, C. Nöhammer and S. Pernagallo, Analyst, 2023, 148, 5658–5666 RSC.
- A. Marín-Romero, M. Tabraue-Chávez, J. W. Dear, J. José Díaz-Mochón and S. Pernagallo, Sens. Diagn, 2022, 1, 1243–1251 RSC.
- A. Marín-Romero, M. Tabraue-Chávez, B. López-Longarela, M. A. Fara, R. M. Sánchez-Martín, J. W. Dear, H. Ilyine, J. J. Díaz-Mochón and S. Pernagallo, Analytica, 2021, 2, 130–139 CrossRef.
- A. Delgado-Gonzalez, A. Robles-Remacho, A. Marin-Romero, S. Detassis, B. Lopez-Longarela, F. J. Lopez-Delgado, D. de Miguel-Perez, J. J. Guardia-Monteagudo, M. A. Fara, M. Tabraue-Chavez, S. Pernagallo, R. M. Sanchez-Martin and J. J. Diaz-Mochon, Talanta, 2019, 200, 51–56 CrossRef CAS PubMed.
- A. Marín-Romero, A. Robles-Remacho, M. Tabraue-ChAvez, Ba. López-Longarela, R. M. SAnchez-Martín, J. J. Guardia-Monteagudo, M. A. Fara, F. J. López-Delgado, S. Pernagallo and J. J. Díaz-Mochón, Analyst, 2018, 143, 5676–5682 RSC.
- B. López-Longarela, E. E. Morrison, J. D. Tranter, L. Chahman-Vos, J. F. Léonard, J. C. Gautier, S. Laurent, A. Lartigau, E. Boitier, L. Sautier, P. Carmona-Saez, J. Martorell-Marugan, R. J. Mellanby, S. Pernagallo, H. Ilyine, D. M. Rissin, D. C. Duffy, J. W. Dear and J. J. Díaz-Mochón, Anal. Chem., 2020, 92, 3388–3395 CrossRef PubMed.
- A. Marín-Romero, M. Tabraue-Chávez, J. W. Dear, R. M. Sánchez-Martín, H. Ilyine, J. J. Guardia-Monteagudo, M. A. Fara, F. J. López-Delgado, J. J. Díaz-Mochón and S. Pernagallo, Talanta, 2020, 219, 121265 CrossRef PubMed.
- A. Cueto-Sánchez, H. Niu, I. Álvarez-Álvarez, B. López-Longarela, E. Del Campo-Herrera, A. Ortega-Alonso, M. García-Cortés, J. Pinazo-Bandera, J. Sanabria-Cabrera, J. J. Díaz-Mochón, M. I. Lucena, R. J. Andrade, C. Stephens and M. Robles-Díaz, Br. J. Clin. Pharmacol., 2023, 89, 2497–2507 CrossRef PubMed.
- M. Angélica Luque-González, M. Tabraue-Chávez, B. López-Longarela, R. María Sánchez-Martín, M. Ortiz-González, M. Soriano-Rodríguez, J. Antonio García-Salcedo, S. Pernagallo and J. José Díaz-Mochón, Talanta, 2018, 176, 299–307 CrossRef PubMed.
- C. Martín-Sierra, M. T. Chavez, P. Escobedo, V. García-Cabrera, F. J. López-Delgado, J. J. Guardia-Monteagudo, I. Ruiz-García, M. M. Erenas, R. M. Sanchez-Martin, L. F. Capitán-Vallvey, A. J. Palma, S. Pernagallo and J. J. Diaz-Mochon, Biosens. Bioelectron., 2023, 230, 115268 CrossRef PubMed.
- A. Robles-Remacho, M. A. Luque-Gonzalez, F. J. López-Delgado, J. J. Guardia-Monteagudo, M. A. Fara, S. Pernagallo, R. M. Sanchez-Martin and J. J. Diaz-Mochon, Biosens. Bioelectron., 2023, 219, 114770 CrossRef CAS PubMed.
- P. Escobedo, A. J. Palma, M. M. Erenas, A. Martinez Olmos, M. A. Carvajal, M. Tabraue Chavez, M. A. Luque Gonzalez, J. J. Diaz-Mochon, S. Pernagallo and L. F. Capitan-Vallvey, IEEE Access, 2019, 7, 185677–185686 Search PubMed.
- S. Bandiera, S. Pfeffer, T. F. Baumert and M. B. Zeisel, J. Hepatol., 2015, 62, 448–457 CrossRef CAS PubMed.
- E. Cione, D. M. Abrego Guandique, M. C. Caroleo, F. Luciani, M. Colosimo and R. Cannataro, Curr. Issues Mol. Biol., 2022, 45, 78–91 CrossRef PubMed.
- C. Roderburg, F. Benz, D. Vargas Cardenas, A. Koch, J. Janssen, M. Vucur, J. Gautheron, A. T. Schneider, C. Koppe, K. Kreggenwinkel, H. W. Zimmermann, M. Luedde, C. Trautwein, F. Tacke and T. Luedde, Liver Int., 2015, 35, 1172–1184 CrossRef CAS PubMed.
- O. F. Laterza, M. G. Scott, P. W. Garrett-Engele, K. M. Korenblat and C. M. Lockwood, Biomarkers Med., 2013, 7, 205–210 CrossRef CAS PubMed.
- D. E. Rebeski, E. M. Winger, Y. K. Shin, M. Lelenta, M. M. Robinson, R. Varecka and J. R. Crowther, J. Immunol. Methods, 1999, 226, 85–92 CrossRef CAS PubMed.
- F. Tavano, D. Gioffreda, M. R. Valvano, O. Palmieri, M. Tardio, T. P. Latiano, A. Piepoli, E. Maiello, F. Pirozzi and A. Andriulli, Sci. Rep., 2018, 8(1), 16389 CrossRef PubMed.
- S. Asaga, C. Kuo, T. Nguyen, M. Terpenning, A. E. Giuliano and D. S. B. Hoon, Clin. Chem., 2011, 57, 84–91 CrossRef CAS PubMed.
- Y. Niu, S. Xia, M. Su, Q. Dang, K. Kang, L. Li and D. Gou, J. Transl. Med., 2019, 17, 316 CrossRef PubMed.
- E. Azzalini, E. De Martino, P. Fattorini, V. Canzonieri, G. Stanta and S. Bonin, Int. J. Mol. Sci., 2019, 20, 4819 CrossRef CAS PubMed.
- L. MacDonagh, M. F. Gallagher, B. Ffrench, C. Gasch, S. G. Gray, M. Reidy, S. Nicholson, N. Leonard, R. Ryan, V. Young, J. J. O'Leary, S. Cuffe, S. P. Finn, K. J. O'Byrne and M. P. Barr, Transl. Lung Cancer Res., 2021, 10, 1773–1791 CrossRef CAS PubMed.
- D. Hanniford, J. Zhong, L. Koetz, A. Gaziel-Sovran, D. J. Lackaye, S. Shang, A. Pavlick, R. Shapiro, R. Berman, F. Darvishian, Y. Shao, I. Osman and E. Hernando, Clin. Cancer Res., 2015, 21, 4903–4912 CrossRef CAS PubMed.
- S. Detassis, F. Precazzini, M. Grasso, V. Del Vescovo, F. Maines, O. Caffo, P. Campomenosi and M. A. Denti, Int. J. Mol. Sci., 2024, 25, 5573 CrossRef CAS PubMed.
Footnotes |
| † Electronic supplementary information (ESI) available. See DOI: https://doi.org/10.1039/d4an00783b |
| ‡ Present address: Istituto Zooprofilattico Sperimentale delle Venezie, Sezione di Bolzano, Via Laura Conti 4, 39100 Bolzano, Italy. |
| This journal is © The Royal Society of Chemistry 2024 |