 Open Access Article
Native mass spectrometry analysis of conjugated HSA and BSA complexes with various flavonoids†
Nicolas
Alexander‡
,
Lucas
McDonald‡
,
Chrys
Wesdemiotis
 * and
Yi
Pang
 *
*
Department of Chemistry, The University of Akron, OH 44325, USA. E-mail: yp5@uakron.edu; wesdemiotis@uakron.edu
First published on 20th February 2024
Abstract
Mass spectrometry was used to study the binding interaction between serum albumin proteins (BSA and HSA) and flavone dyes, which is known to induce large fluorescence signals for protein detection. By electrospray ionization mass spectrometry (ESI-MS), multiple charged species/states could be produced in ammonium acetate buffer, while preserving the native structures of the proteins. Subsequent introduction of a flavone dye into the buffered solution resulted in an immediate interaction, forming the respective protein–dye conjugates associated by non-covalent interactions. Formation of protein–dye conjugates induced a notable response in the ESI-MS spectra, including changes in both the charge states and molecular mass of the protein species. The resulting data pointed out that the protein–flavone dye maintained a 1![[thin space (1/6-em)]](https://www.rsc.org/images/entities/char_2009.gif) :
:![[thin space (1/6-em)]](https://www.rsc.org/images/entities/char_2009.gif) 1 ratio in the conjugate, although multiple binding sites for drug molecules are present in albumin proteins.
1 ratio in the conjugate, although multiple binding sites for drug molecules are present in albumin proteins.
Introduction
Mass spectrometry (MS) is a powerful tool that can assist in studying proteins and protein complexes via proteomics, which involves the characterization of proteins expressed by cells or organisms.1,2 Post-translational modifications such as phosphorylation, ubiquitination, and more can be monitored via MS.3–10 Additionally, protein complexes can be confirmed based on the specific residue interactions detected via tandem mass spectrometry (MS/MS) fragmentation, a procedure referred to as top down sequencing.11–13 Further analysis of complexes can be monitored by using the ion mobility where drift times and fragmentation can be compared, thus providing a two-fold analysis of the complex.14,15 These MS techniques can be used to further examine the native structure of a protein, which was first demonstrated by JB Fenn in 1989.16In order to achieve native MS, the protein must be prepared in a volatile solution, typically ammonium acetate sulution.17 It should be noted that the ammonium acetate solution can mimic the protein solvation under physiological conditions, thereby avoiding premature degradation and preserving the quaternary structure of the protein. Such study of biomolecules/biopolymers in their native conformations can yield useful information, including tertiary and quaternary structures, complex stoichiometry, and ligand attachment site(s).18–29
As an important class of natural compounds, flavonoids can readily interact with proteins such as albumins, giving strong fluorescent emissions. For example, a study by Pang et al. has shown that such protein binding could induce a large fluorescence signal from a flavonoid, which can be used for wash-free SDS-PAGE.20 It has been speculated that the observed interaction is primarily driven by entering a hydrophobic pocket of BSA. However, the structure of albumin is known to have different domains that are associated with multiple binding sites for drug molecules,30 as illustrated in Fig. 1. Site I (or the warfarin site) prefers to bind large heterocyclic and negatively charged compounds, while site II is preferred by small aromatic carboxylic acids.31,32 Molecular docking studies suggest that the flavonoid 1 likely binds to the site I in HSA.33 By using pheloretin (a chalcone flavonoid present in apples), Bellocco et al. studied the interaction and binding of flavonoids to HSA.34 Their fluorescence displacement using warfarin (a site selective drug for site I) suggests that the flavonoid is likely bound to the site I (a hydrophobic pocket), as well as that interaction of flavonoids with HSA could modify the protein's conformation.34 A study by Bojić et al. further revealed that flavonoids may not bind at the location where warfarin has high affinity, but rather to different regions within the drug-binding site I.35 Although drug displacement experiments provide information about the dye's binding location, they do not give reliable indication about the protein–ligand ratio, because incomplete displacement often occurs. Herein, we demonstrate that mass spectrometry could be used to examine the interactions between flavonoids and both human and bovine serum albumin (i.e. HSA and BSA, respectively), which could shed some additional light on the protein–ligand ratio in the interactions.
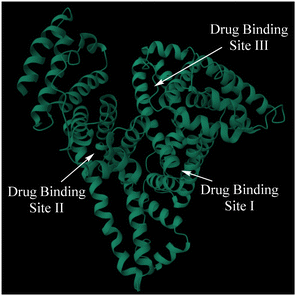 | ||
| Fig. 1 Schematic of the HSA structure from the PDB file 1AO6 (https://doi.org/10.2210/pdb1AO6/pdb). The arrows indicate drug binding sites. | ||
Experimental section
Reagents
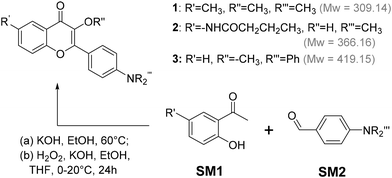
Bovine serum albumin (>98.0% purity) and human serum albumin (>99.9% purity) were purchased from Sigma-Aldrich (St Louis, MO); water (optima grade), acetonitrile (optima grade), ammonium acetate (>97% purity), and acetic acid (>99.7% purity) were purchased from Fisher Scientific (Pittsburgh, PA). All commercial reagents were used as received without further purification. Flavone dyes 1–3 were synthesized using the procedures reported previously from one of our laboratories (Scheme 1).20,36BSA and HSA complexation
BSA and HSA solutions were prepared at 0.2 mg mL−1 in a 20 mM ammonium acetate buffer. Stock solutions of the flavone dyes (10 mM) were prepared in acetonitrile. The flavone dye was added to the BSA or HSA solution at a molar ratio of 3![[thin space (1/6-em)]](https://www.rsc.org/images/entities/char_2009.gif) :
:![[thin space (1/6-em)]](https://www.rsc.org/images/entities/char_2009.gif) 1. The resulting solution was left at room temperature for 5 minutes to allow for conjugation. Denatured solutions of BSA and HSA were prepared by adjusting the pH of the BSA or HSA solution to below 4.0. The denatured complex solutions were prepared by conjugating the flavone dye and BSA as above and then adjusting the pH to below 4.0.
1. The resulting solution was left at room temperature for 5 minutes to allow for conjugation. Denatured solutions of BSA and HSA were prepared by adjusting the pH of the BSA or HSA solution to below 4.0. The denatured complex solutions were prepared by conjugating the flavone dye and BSA as above and then adjusting the pH to below 4.0.
ESI-MS experiments
ESI experiments were carried out on a Waters Synapt HDMS quadrupole/time-of-flight (Q/ToF) mass spectrometer (Waters, Milford, MA) equipped with an ESI source. The prepared solutions (see above) were injected directly into the ESI source using a syringe pump at a flow rate of 75 μL min−1. Instrument parameters for MS analysis were set as follows: capillary voltage, 3.00 kV; sample cone voltage, 45 V; extraction cone voltage, 8.0 V; desolvation gas (nitrogen) flow, 650 L h−1; trap collision energy (CE), 6.0 eV; transfer CE, 4.0 eV; argon flow through trap and transfer cells, 1.5 mL min−1; source temperature, 40 °C; desolvation temperature, 125 °C. MassLynx (version 4.1) program was used for data analysis.Results and discussion
Flavonoid compounds 1–3 (Scheme 1) were synthesized and their interactions with either HSA or BSA were examined using UV-vis and fluorescence spectroscopy and native mass spectrometry (MS). Previously, it has been reported that flavonoids can selectively bind to BSA over other proteins in aqueous media, which was accompanied with a strong fluorescence turn on.20 The flavonoid–albumin interactions between HSA and flavonoids were reexamined in ammonium acetate buffer, as a volatile buffer is necessary for preserving the native structure of a protein. As shown in Fig. 2, addition of HSA induced a large fluorescence from the flavonoid 1. In addition, the emission also exhibited significant bathochromic shifts as the solvent polarity increased (ESI Fig. S1†), along with a sharp decrease in emission intensity. The observed large fluorescence response indicated that the flavonoid–albumin interaction was preserved in ammonium acetate buffer, which enabled the MS study.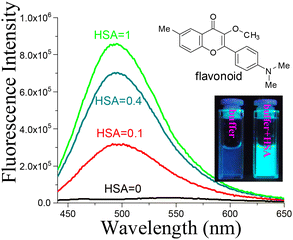 | ||
| Fig. 2 Fluorescence response of flavonoid 1 (20 μM) in 20 mM ammonium acetate buffer solution, upon addition of HSA. | ||
Initial MS investigation was carried out by acquiring the native spectra of both BSA and HSA, which were prepared in 20 mM ammonium acetate in order to preserve the native state. The ESI-MS spectrum of HSA contained ions with +15 to +18 charges (Fig. 3 and Table 1). Based on the MassLynx software of the mass spectrometer, the observed m/z values corresponded to native HSA ionized by a combination of K+ and H+ cations (Table 1). Among the charge distribution from the native HSA (i.e. ions with +15 to +18 charges), the ion with the +17 charge was the most predominant species (Fig. 3), which is consistent with what has been reported in the literature.37
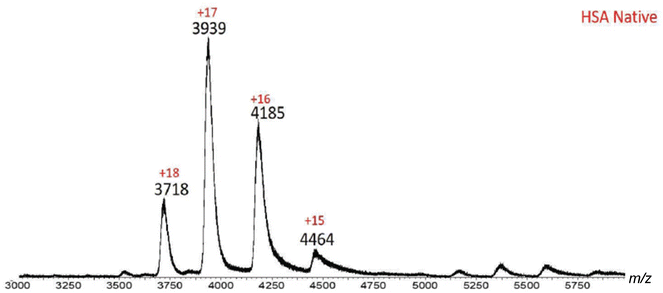 | ||
| Fig. 3 ESI-MS spectrum of native HSA. Ions with +15–+18 charges are present, with +17 being the predominant charge state. This charge distribution is indicative of HSA in its native form. | ||
| HSA native | ||||
|---|---|---|---|---|
| Charge state | Measured m/z | Calculated m/z | |% error| | [M + xK + yH] |
| 15 | 4464 | 4463 | 0.02 | 13K+ + 2H+ |
| 16 | 4185 | 4187 | 0.05 | 14K+ + 2H+ |
| 17 | 3939 | 3940 | 0.03 | 14K+ + 3H+ |
| 18 | 3718 | 3722 | 0.11 | 13K+ + 4H+ |
Similarly, native BSA produced a spectrum with charged species ranging from +15 to +19, with the +17 ion being the predominant state.
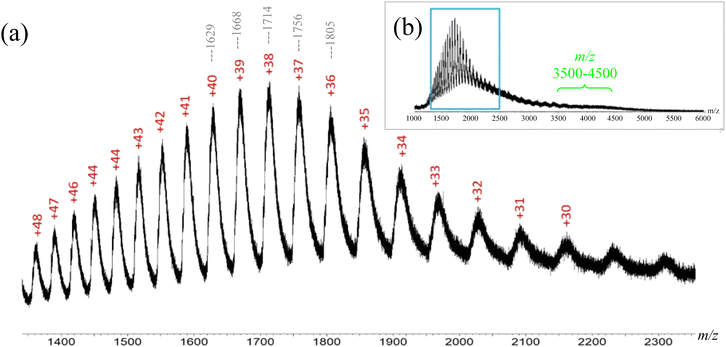
In order to verify that the characteristics of HSA and BSA in Fig. 3 and 4 correspond to their respective native forms, the mass spectra in their denatured forms were also acquired. Our initial effort to obtain denatured BSA was by using sodium dodecyl sulfate (SDS). However, the SDS-denatured BSA gave a weak MS signal intensity, as denaturing requires the use of excessive SDS (e.g. a 50![[thin space (1/6-em)]](https://www.rsc.org/images/entities/char_2009.gif) :
:![[thin space (1/6-em)]](https://www.rsc.org/images/entities/char_2009.gif) 1 ratio for SDS
1 ratio for SDS![[thin space (1/6-em)]](https://www.rsc.org/images/entities/char_2009.gif) :
:![[thin space (1/6-em)]](https://www.rsc.org/images/entities/char_2009.gif) BSA),21 which caused ionization suppression. Therefore, a pH driven denaturation method was adopted in this study, as BSA molecules can change their folding conformations, i.e. deviate from their native structure, when the pH is beyond the 4.0–8.0 range.38–40 Thus, acetic acid was added to the 20 mM ammonium acetate-BSA solution until the pH was below 4.0, which caused the protein to denature and expose more residues to the solvent. The newly exposed residues allowed the protein to accept additional charges, as compared to the native state, thereby increasing the charge state of the protein. The ESI-MS spectrum of denatured BSA showed ions with +30 to +48 charges (Fig. 5). Such increase in the number of charges is expected for denatured BSA due to more residues being exposed when the protein is unfolded. In other words, the ESI-MS spectrum of denatured BSA contained ions of distinctively lower m/z (e.g. m/z 1400–2300, Fig. 5), as a consequence of the higher charge states, which are in sharp contrast to those observed from native BSA (Fig. 4).
BSA),21 which caused ionization suppression. Therefore, a pH driven denaturation method was adopted in this study, as BSA molecules can change their folding conformations, i.e. deviate from their native structure, when the pH is beyond the 4.0–8.0 range.38–40 Thus, acetic acid was added to the 20 mM ammonium acetate-BSA solution until the pH was below 4.0, which caused the protein to denature and expose more residues to the solvent. The newly exposed residues allowed the protein to accept additional charges, as compared to the native state, thereby increasing the charge state of the protein. The ESI-MS spectrum of denatured BSA showed ions with +30 to +48 charges (Fig. 5). Such increase in the number of charges is expected for denatured BSA due to more residues being exposed when the protein is unfolded. In other words, the ESI-MS spectrum of denatured BSA contained ions of distinctively lower m/z (e.g. m/z 1400–2300, Fig. 5), as a consequence of the higher charge states, which are in sharp contrast to those observed from native BSA (Fig. 4).
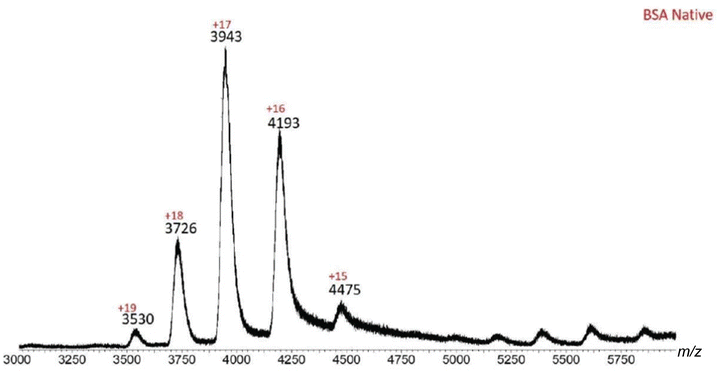 | ||
| Fig. 4 ESI-MS spectrum of native BSA. Ions with +15–+19 charges are present, with +17 being the predominant charge state. Such charge distribution indicates that BSA is in its native form. | ||
BSA–flavone dye conjugation
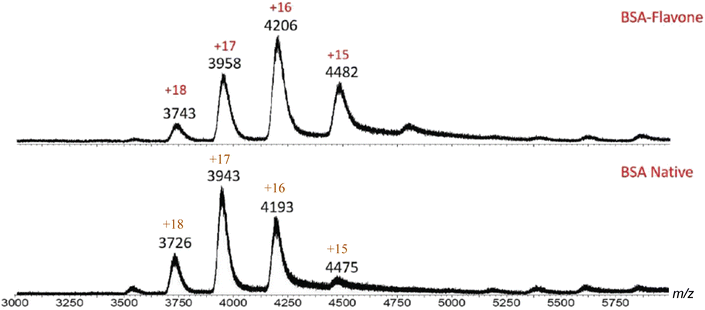
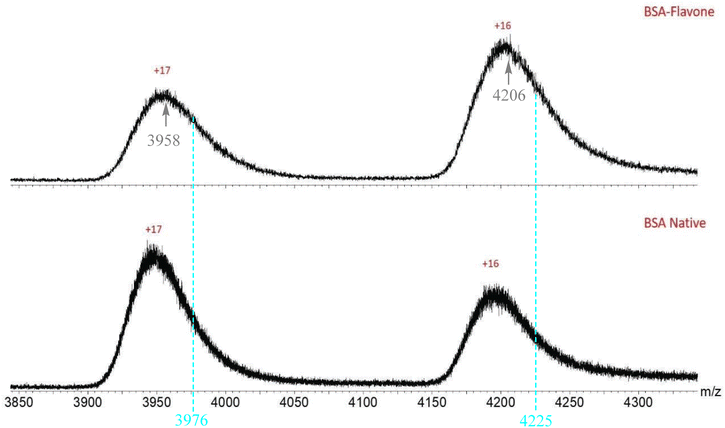
After establishing a signature mass spectrum for native and denatured BSA, a flavone dye was introduced into the BSA solution to probe the BSA–flavone interaction. The BSA solution was allowed to react with flavone dye 1 for various time frames ranging from thirty seconds to thirty minutes. The time interval of five minutes was chosen for analysis, as it produced the most intense signal (this trend was also observed in the fluorescence spectral studies). The sample obtained after the reaction for over thirty minutes indicated that no additional dye molecules were added to BSA after the five minutes time interval. Therefore, the resulting conjugated solution, obtained after mixing BSA and the flavone dye for five minutes, was injected to determine the stoichiometry of the protein–dye complex.The ESI-MS spectrum of the BSA–flavone solution showed an increase in the m/z values of all charge states, as compared to the native BSA, indicating that complexation occurred between BSA and flavone (Fig. 6). In addition to the increase in the m/z values, the predominant charge state from +17 for native BSA was changed to +16 for the BSA complexed to the flavone dye (Fig. 7), corroborating the change in the elemental composition after conjugation. As shown in Table 2, BSA was ionized by K+ incorporation when subjected to ESI, presumably because the sample analyzed had been treated with potassium salt. The ESI-MS spectrum of the complex revealed that complexation also caused partial potassium/proton exchange. The m/z values of different charge states of the conjugate were reconciled if one dye molecule was added to BSA and three K+ ions were replaced with H+. The calculated m/z values for such stoichiometry and charges agree with these measured values, as presented in Table 3.
| BSA native | |||
|---|---|---|---|
| Charge state | Measured m/z | Calculated m/z | |% Error| |
| 15 | 4475 | 4470 | 0.11 |
| 16 | 4193 | 4193 | 0.00 |
| 17 | 3943 | 3949 | 0.15 |
| 18 | 3726 | 3731 | 0.13 |
| 19 | 3530 | 3537 | 0.20 |
To investigate whether the native conformation was necessary for complexation, the BSA and dye were allowed to conjugate, then acetic acid was added to bring the pH < 4 to denature the BSA complex. After addition of acetic acid, the ESI-MS spectrum became identical to that of the denatured BSA, indicating that the complex did not survive after denaturation (Fig. 8). The flavone dye was also treated with acetic acid, in order to confirm that acidic conditions were not damaging its structure (ESI Fig. S2†). The spectrum of the flavone dye before and after treatment with acetic acid were identical under the same conditions, demonstrating that no structural changes occur on the flavone dye at pH < 4. It should be noticed that the denatured BSA–flavone solution did not exhibit the m/z value and predominant charge state shifts, which were observed in the native BSA–flavone sample. The finding thus pointed out that only the BSA in the native conformation can complex the flavone dye.
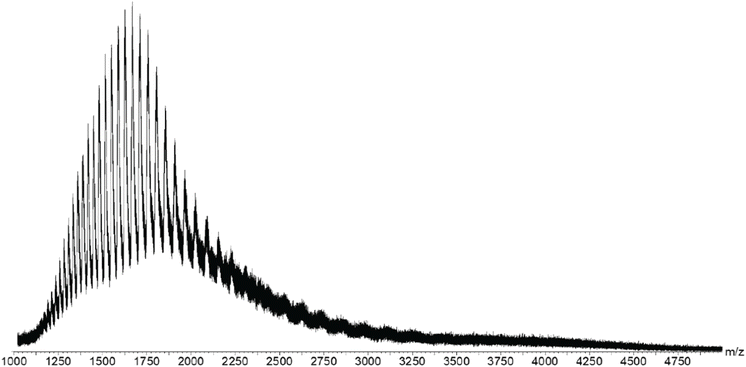 | ||
| Fig. 8 ESI-MS spectrum of the denatured BSA-flavone 1 complex. No peaks are present between m/z 4000 and m/z 4500, which are present in native BSA (Fig. 6). The peaks at around m/z 1500 are consistent with the denatured BSA. | ||
As an interesting feature observed during the ESI-MS study, the predominant charge of +17 for native BSA was shifted to +16 when BSA was conjugated to a flavonoid dye (Fig. 6). It appeared that the ability of BSA to accommodate positive charges was perturbed when the hydrophobic flavone 1 was bound to the protein, making the +16 charge state more popular. Similarly, the +15 charge state of the BSA–flavone complex was increased in abundance at the expense of the +16 charge state in native BSA (Fig. 6). This result corroborates that one flavone dye was bound to BSA upon the interaction, as incorporating one molecule of flavone 1 increased the protein's hydrophobic property, thereby decreasing the protein's ability to accommodate positive charges by +1. The ESI-MS spectrum also provides evidence that the flavonoid dyes bind BSA to form a complex in a 1![[thin space (1/6-em)]](https://www.rsc.org/images/entities/char_2009.gif) :
:![[thin space (1/6-em)]](https://www.rsc.org/images/entities/char_2009.gif) 1 ratio. This conclusion is further supported by estimating the molecular mass of 1 (ESI Table S2†). From the calculated MW of the BSA–flavone 1 complexes with different charges, the average mass increase in the complexes with the +15, +16, +17 and +18 charges was calculated to be 332 ± 86 Da, which agrees reasonably well with the MW of flavone 1 (MW = 309). The data thus consistently indicated that only one flavone dye was incorporated in a BSA, forming a 1
1 ratio. This conclusion is further supported by estimating the molecular mass of 1 (ESI Table S2†). From the calculated MW of the BSA–flavone 1 complexes with different charges, the average mass increase in the complexes with the +15, +16, +17 and +18 charges was calculated to be 332 ± 86 Da, which agrees reasonably well with the MW of flavone 1 (MW = 309). The data thus consistently indicated that only one flavone dye was incorporated in a BSA, forming a 1![[thin space (1/6-em)]](https://www.rsc.org/images/entities/char_2009.gif) :
:![[thin space (1/6-em)]](https://www.rsc.org/images/entities/char_2009.gif) 1 complex.
1 complex.
As shown in Fig. 6, the BSA–flavone complex gave a set of new peaks with characteristic m/z values and charged states. Upon including one flavone in the protein–dye complex, each charge state exhibited an increasing m/z value, in comparison with that from the BSA protein only. This can be seen more clearly in Fig. 7, where the spectrum is presented in an expanded region for the +16 and +17 charge states. One fundamental question is whether the detected BSA–flavone peak could include more than one flavone dye. If the BSA–flavone complex includes two flavone 1 molecules, one would expect the further mass increase in the resulting complex. For example, the mass for the +17 charge state of the “BSA–flavone 1” complex would be at “3958 + (309/17) = 3976”, while the mass for the +16 charge state would be at “4206 + (309/16) = 4225.” However, no obvious peak was detected at either m/z 3976 or 4225 in the spectrum of the BSA–flavone 1 complex (Fig. 7). This observation strongly suggests that both charge states gave consistent results, i.e. inclusion of one “flavone 1” molecule in the complex.
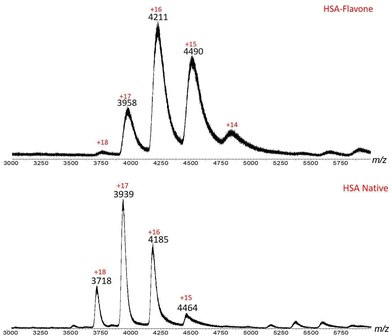
A similar feature was also observed when 1 was used to interact with HSA. The predominant peak in the +17 charge state for native HSA was shifted to +16 when HSA was conjugated to a flavonoid dye 1 (Fig. 9). As a consequence of incorporating a molecule of flavone 1, the charge states (+15, +16, +17 and +18) of native HSA were decreased by 1 (to +14, +15, +16 and +17, respectively). These characteristics indicated the formation of the complex HSA-1 with a 1![[thin space (1/6-em)]](https://www.rsc.org/images/entities/char_2009.gif) :
:![[thin space (1/6-em)]](https://www.rsc.org/images/entities/char_2009.gif) 1 ratio.
1 ratio.
Complexes of HSA with other flavones
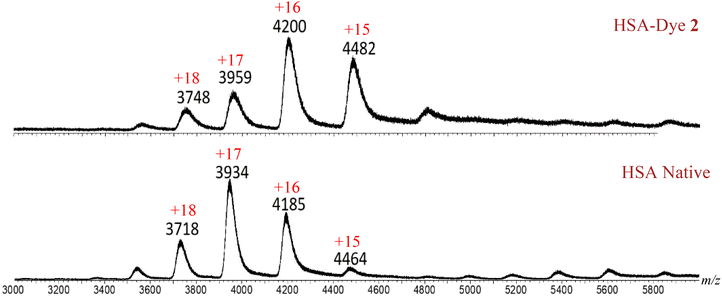
In order to explore the general trend of the protein's interaction with flavones, HSA was also used to examine its binding character with other flavone compounds such as 2 and 3, whose structures bear different substituents. Thus, flavone dyes 2 and 3 were individually left to conjugate with HSA and the resulting solutions were analyzed by ESI-MS. As shown in Fig. 10, the spectrum revealed a predominant charge state shift from +17 state for HSA to +16 state for HSA–dye 2, indicating that complexation has occurred. The m/z values in these spectra also showed that complexation was accompanied with a potassium/proton exchange (Table 4), as observed with dye 1.![[thin space (1/6-em)]](https://www.rsc.org/images/entities/char_2009.gif) :
:![[thin space (1/6-em)]](https://www.rsc.org/images/entities/char_2009.gif) 1 stoichiometric ratio with HSA
1 stoichiometric ratio with HSA
| HSA-flavone 2 complex | ||||
|---|---|---|---|---|
| Charge state | Measured m/z | Calculated m/z | [% error] | Charges [M + xK + yH] |
| 15 | 4482 | 4482 | 0.00 | 11K+ + 4H+ |
| 16 | 4200 | 4200 | 0.00 | 10K+ + 6H+ |
| 17 | 3959 | 3960 | 0.03 | 13K+ + 4H+ |
| 18 | 3748 | 3748 | 0.00 | 17K+ + 1H+ |
When assuming an HSA to flavone ratio of 1![[thin space (1/6-em)]](https://www.rsc.org/images/entities/char_2009.gif) :
:![[thin space (1/6-em)]](https://www.rsc.org/images/entities/char_2009.gif) 1, the calculated m/z value matched well with the experimentally measured m/z values for all charge states (Table 4). The data further revealed that the average value of the measured molecular mass for HSA–flavone dye 2 complex was 66
1, the calculated m/z value matched well with the experimentally measured m/z values for all charge states (Table 4). The data further revealed that the average value of the measured molecular mass for HSA–flavone dye 2 complex was 66![[thin space (1/6-em)]](https://www.rsc.org/images/entities/char_2009.gif) 798 Da (ESI Table S4†), and the average measured molecular mass for native HSA was 66
798 Da (ESI Table S4†), and the average measured molecular mass for native HSA was 66![[thin space (1/6-em)]](https://www.rsc.org/images/entities/char_2009.gif) 422 Da (ESI Table S3†). The mass increase by forming the HSA–flavone 2 complex was estimated to be 356 (= 66
422 Da (ESI Table S3†). The mass increase by forming the HSA–flavone 2 complex was estimated to be 356 (= 66![[thin space (1/6-em)]](https://www.rsc.org/images/entities/char_2009.gif) 798–66
798–66![[thin space (1/6-em)]](https://www.rsc.org/images/entities/char_2009.gif) 442), which closely matched the molecular mass (MW = 366) for flavone 2. These results pointed out that the resulting complex of HSA–flavone 2 had a 1
442), which closely matched the molecular mass (MW = 366) for flavone 2. These results pointed out that the resulting complex of HSA–flavone 2 had a 1![[thin space (1/6-em)]](https://www.rsc.org/images/entities/char_2009.gif) :
:![[thin space (1/6-em)]](https://www.rsc.org/images/entities/char_2009.gif) 1 stoichiometry. Similar results were also observed from HSA–flavone 3 with comparable low % error (ESI Fig. S3 & Table S5†), which maintained a 1
1 stoichiometry. Similar results were also observed from HSA–flavone 3 with comparable low % error (ESI Fig. S3 & Table S5†), which maintained a 1![[thin space (1/6-em)]](https://www.rsc.org/images/entities/char_2009.gif) :
:![[thin space (1/6-em)]](https://www.rsc.org/images/entities/char_2009.gif) 1 stoichiometric ratio.
1 stoichiometric ratio.
Conclusion
Conjugation of albumin proteins (HSA and BSA) with flavone dyes (compounds 1–3; Scheme 1) is known to induce a large fluorescence signal for molecular imaging applications. Using ESI-MS, this study demonstrates a useful strategy to characterize the structure of the protein–flavone complexes that are formed by weak non-covalent interactions. The study is based on the assumption that ESI (a soft ionization method) will allow the generation of multiple charges on protein structures without causing fragmentation, while protein's native conformations can be preserved in an ammonium acetate buffer. In the buffer solution, ESI-MS of the native forms of either HSA or BSA detected several well-separated protein species that exhibited different m/z values and charge states (ranging from +15 to +18). Inclusion of a flavone dye (such as 1) caused a spectral shift toward a higher m/z value, as well as a shift of the predominant charge state toward a lower value (e.g. ranging from the corresponding +14 to +17 charge state). The predominant charge state and m/z shift were only observed when BSA and HSA were in their native state, indicating that a non-covalent interaction is occurring between the dye and proteins. The observed shifts in m/z values and reduced charge states could be attributed to the inclusion of a relative hydrophobic flavone into the proteins’ drug binding site, which attenuates the protein's ability to stabilize the multiple charges. Analysis of the ESI-MS data from the resulting protein–flavone conjugates consistently pointed to the 1![[thin space (1/6-em)]](https://www.rsc.org/images/entities/char_2009.gif) :
:![[thin space (1/6-em)]](https://www.rsc.org/images/entities/char_2009.gif) 1 ratio for the protein-to-flavone dye, despite the multiple drug binding sites present in the HSA or BSA structure (Fig. 1). Therefore, the ESI-MS study here provides direct evidence for the non-covalent binding interaction between the albumin proteins and the flavone dyes examined. Since the flavones have been shown to be an important class of fluorescent dyes for their selective interaction with HSA, the study provides a valuable method to guide the further development of this class of materials for molecular imaging applications.
1 ratio for the protein-to-flavone dye, despite the multiple drug binding sites present in the HSA or BSA structure (Fig. 1). Therefore, the ESI-MS study here provides direct evidence for the non-covalent binding interaction between the albumin proteins and the flavone dyes examined. Since the flavones have been shown to be an important class of fluorescent dyes for their selective interaction with HSA, the study provides a valuable method to guide the further development of this class of materials for molecular imaging applications.
Author contributions
N. A. performed the MS studies, L. M. performed synthesis and fluorescence analysis. N. A. and L. M. wrote the initial draft, C. W. and Y. P. finalized the paper with input from all authors.Conflicts of interest
The authors declare that they have no competing financial interests.Acknowledgements
C. W. acknowledges the support from the National Science Foundation (CMI-1808115). Y. P. acknowledges the support from NIH (Grant no. 1R15GM148965-01).References
- X. Han, A. Aslanian and J. R. Yates, Mass Spectrometry for Proteomics, Curr. Opin. Chem. Biol., 2008, 12(5), 483–490, DOI:10.1016/j.cbpa.2008.07.024.
- J. R. Yates, C. I. Ruse and A. Nakorchevsky, Proteomics by Mass Spectrometry: Approaches, Advances, and Applications, Annu. Rev. Biomed. Eng., 2009, 11(1), 49–79, DOI:10.1146/annurev-bioeng-061008-124934.
- H. Keshishian, T. Addona, M. Burgess, E. Kuhn and S. A. Carr, Quantitative, Multiplexed Assays for Low Abundance Proteins in Plasma by Targeted Mass Spectrometry and Stable Isotope Dilution, Mol. Cell. Proteomics, 2007, 6(12), 2212–2229, DOI:10.1074/mcp.M700354-MCP200.
- C. Hentschker, C. Dewald, A. Otto, K. Büttner, M. Hecker and D. Becher, Global Quantification of Phosphoproteins Combining Metabolic Labeling and Gel-Based Proteomics in B. Pumilus, Electrophoresis, 2017, 334–343, DOI:10.1002/elps.201700220.
- O. O. Dada, Y. Zhao, N. Jaya and O. Salas-Solano, High-Resolution CZE-MS Peptide Mapping of Therapeutic Proteins: Peptide Recovery and PTM Analysis in Monoclonal Antibodies and Antibody-Drug Conjugates, Anal. Chem., 2017, 89(21), 11236–11242, DOI:10.1021/acs.analchem.7b03643.
- J. Naru, R. Aggarwal, A. K. Mohanty, U. Singh, D. Bansal, N. Kakkar and N. Agnihotri, Identification of Differentially Expressed Proteins in Retinoblastoma Tumors Using Mass Spectrometry-Based Comparative Proteomic Approach, J. Proteomics, 2017, 159, 77–91, DOI:10.1016/j.jprot.2017.02.006.
- N. Gasilova, K. Srzentić, L. Qiao, B. Liu, A. Beck, Y. O. Tsybin and H. H. Girault, On-Chip Mesoporous Functionalized Magnetic Microspheres for Protein Sequencing by Extended Bottom-up Mass Spectrometry, Anal. Chem., 2016, 88(3), 1775–1784, DOI:10.1021/acs.analchem.5b04045.
- V. Ravikumar, C. Jers and I. Mijakovic, Elucidating Host-Pathogen Interactions Based on Post-Translational Modifications Using Proteomics Approaches, Front. Microbiol., 2015, 6, 1–7, DOI:10.3389/fmicb.2015.01312.
- J. M. Armenta, I. Hoeschele and I. M. Lazar, Differential Protein Expression Analysis Using Stable Isotope Labeling and PQD Linear Ion Trap MS Technology, J. Am. Soc. Mass Spectrom., 2009, 20(7), 1287–1302, DOI:10.1016/j.jasms.2009.02.029.
- J. G. Cabrero, G. J. Freeman, W. S. Lane and H. Reiser, Identification, by Protein Sequencing and Gene Transfection, of Sgp-60 as the Murine Homologue of CD48, Proc. Natl. Acad. Sci. U. S. A., 2018, 90(8), 3418–3422, DOI:10.1073/pnas.90.8.3418.
- D. F. Hunt, J. R. Yates, J. Shabanowitz, S. Winston and C. R. Hauer, Protein Sequencing by Tandem Mass Spectrometry, Proc. Natl. Acad. Sci. U. S. A., 1986, 83(17), 6233–6237, DOI:10.1073/pnas.83.17.6233.
- A. Doerr, Top-down Mass Spectrometry, Nat. Methods, 2008, 5(1), 24, DOI:10.1038/nmeth1162.
- A. Manuscript and M. Spectrometry, Comprehensive Analysis of Protein Modifications by Top-down Mass Spectrometry, Circ.: Cardiovasc. Genet., 2012, 4(6), 1–21, DOI:10.1161/CIRCGENETICS.110.957829.Comprehensive.
- S. J. Allen, K. Giles, T. Gilbert and M. F. Bush, Ion Mobility Mass Spectrometry of Peptide, Protein, and Protein Complex Ions Using a Radio-Frequency Confining Drift Cell, Analyst, 2016, 141(3), 884–891, 10.1039/C5AN02107C.
- J. P. C. Vissers and J. I. Langridge, Contemporary Protein Analysis by Ion Mobility Mass Spectrometry, Protein Anal. Using Mass Spectrom., 2017, 1–9, DOI:10.1002/9781119371779.ch1.
- J. B. Fenn, M. Mann, C. K. Meng, S. F. Wong and C. M. Whitehouse, Electrospray Ionization for Mass Spectrometry of Large Biomolecules, Science, 1989, 246(4926), 64–71, DOI:10.1126/science.2675315.
- L. Konermann, Addressing a Common Misconception: Ammonium Acetate as Neutral PH “Buffer” for Native Electrospray Mass Spectrometry, J. Am. Soc. Mass Spectrom., 2017, 28(9), 1827–1835, DOI:10.1007/s13361-017-1739-3.
- M. Zhou, A. M. Sandercock, C. S. Fraser, G. Ridlova, E. Stephens, M. R. Schenauer, T. Yokoi-Fong, D. Barsky, J. A. Leary, J. W. Hershey, J. A. Doudna and C. V. Robinson, Mass Spectrometry Reveals Modularity and a Complete Subunit Interaction Map of the Eukaryotic Translation Factor EIF3, Proc. Natl. Acad. Sci. U. S. A., 2008, 105(47), 18139–18144, DOI:10.1073/pnas.0801313105.
- E. B. Erba, B. T. Ruotolo, D. Barsky and C. V. Robinson, Ion Mobility-Mass Spectrometry Reveals the Influence of Subunit Packing and Charge on the Dissociation of Multiprotein Complexes, Anal. Chem., 2010, 82(23), 9702–9710, DOI:10.1021/ac101778e.
- B. Liu, Y. Pang, R. Bouhenni, E. Duah, S. Paruchuri and L. McDonald, A Step toward Simplified Detection of Serum Albumin on SDS-PAGE Using an Environment-Sensitive Flavone Sensor, Chem. Commun., 2015, 51(55), 11060–11063, 10.1039/C5CC03516C.
- C. Giancola, C. De Sena, D. Fessas, G. Graziano and G. Barone, DSC Studies on Bovine Serum Albumin Denaturation Effects of Ionic Strength and SDS Concentration, Int. J. Biol. Macromol., 1997, 20(3), 193–204, DOI:10.1016/S0141-8130(97)01159-8.
- D. Hope, C. Gries, W. Zhu, W. F. Fagan, C. L. Redman, N. B. Grimm, A. L. Nelson, C. Martin, A. Kinzig and A. L. Nelsonll, Socioeconomics Drive Plant Diversity, Proc. Natl. Acad. Sci. U. S. A., 2012, 100(15), 8788–8792, DOI:10.1073/pnas.1.
- C. Atmanene, D. Chaix, Y. Bessin, N. Declerck, A. V. Dorsselaer and S. Sanglier-Cianferani, Combination of Noncovalent Mass Spectrometry and Traveling Wave Ion Mobility Spectrometry Reveals Sugar-Induced Conformational Changes Of Central Glycolytic Genes Repressor/DNA Complex, Anal. Chem., 2010, 82(9), 3597–3605, DOI:10.1021/ac902784n.
- Y. Tian, D. K. Simanshu, M. Ascano, R. Diaz-Avalos, A. Y. Park, S. A. Juranek, W. J. Rice, Q. Yin, C. V. Robinson, T. Tuschl and D. J. Patel, Multimeric Assembly and Biochemical Characterization of the Trax-Translin Endonuclease Complex, Nat. Struct. Mol. Biol., 2011, 18(6), 658–664, DOI:10.1038/nsmb.2069.
- J. Marcoux, S. C. Wang, A. Politis, E. Reading, J. Ma, P. C. Biggin, M. Zhou, H. Tao, Q. Zhang, G. Chang, N. Morgner and C. V. Robinson, Mass Spectrometry Reveals Synergistic Effects of Nucleotides, Lipids, and Drugs Binding to a Multidrug Resistance Efflux Pump, Proc. Natl. Acad. Sci. U. S. A., 2013, 110(24), 9704–9709, DOI:10.1073/pnas.1303888110.
- C. G. Hartinger, Y. O. Tsybin, J. Fuchser and P. J. Dyson, Characterization of Platinum Anticancer Drug Protein-Binding Sites Using a Top-down Mass Spectrometric Approach, Inorg. Chem., 2008, 47(1), 17–19, DOI:10.1021/ic702236m.
- A. E. Egger, C. G. Hartinger, H. B. Hamidane, Y. O. Tsybin, B. K. Keppler and P. J. Dyson, High Resolution Mass Spectrometry for Studying the Interactions of Cisplatin with Oligonucleotides High Resolution Mass Spectrometry for Studying the Interactions of Cisplatin with Oligonucleotides, Inorg. Chem., 2008, 47(22), 10626–10633, DOI:10.1021/ic801371r.
- D. Marcotte, W. Zeng, J. C. Hus, A. McKenzie, C. Hession, P. Jin, C. Bergeron, A. Lugovskoy, I. Enyedy, H. Cuervo, D. Wang, C. Atmanene, D. Roecklin, M. Vecchi, V. Vivat, J. Kraemer, D. Winkler, V. Hong, J. Chao, M. Lukashev and L. Silvian, Small Molecules Inhibit the Interaction of Nrf2 and the Keap1 Kelch Domain through a Non-Covalent Mechanism, Bioorg. Med. Chem., 2013, 21(14), 4011–4019, DOI:10.1016/j.bmc.2013.04.019.
- A. Dyachenko, R. Gruber, L. Shimon, A. Horovitz and M. Sharon, Allosteric Mechanisms Can Be Distinguished Using Structural Mass Spectrometry, Proc. Natl. Acad. Sci. U. S. A., 2013, 110(18), 7235–7239, DOI:10.1073/pnas.1302395110.
- V. Mishra and R. J. Heath, Structural and Biochemical Features of Human Serum Albumin Essential for Eukaryotic Cell Culture, Int. J. Mol. Sci., 2021, 22(16), 8411, DOI:10.3390/ijms22168411.
- C. W. Murray and M. J. Hartshorn, 4.31 - New Applications for Structure-Based Drug Design, ed. J. B. Taylor and D. J. B. T.-C. M. C. I. I. Triggle, Elsevier, Oxford, 2007, pp. 775–806. DOI:10.1016/B0-08-045044-X/00277-7.
- G. Colmenarejo, In Silico Prediction of Drug-Binding Strengths to Human Serum Albumin, Med. Res. Rev., 2003, 23(3), 275–301, DOI:10.1002/med.10039.
- B. Liu, L. McDonald, Q. Liu, X. Bi, J. Zheng, L. Wang and Y. Pang, A Flavonoid-Based Light-up Bioprobe with Intramolecular Charge Transfer Characteristics for Wash-Free Fluorescence Imaging in Vivo, Sens. Actuators, B, 2016, 235, 309–315, DOI:10.1016/j.snb.2016.05.079.
- D. Barreca, G. Laganà, G. Toscano, P. Calandra, M. A. Kiselev, D. Lombardo and E. Bellocco, The Interaction and Binding of Flavonoids to Human Serum Albumin Modify Its Conformation, Stability and Resistance against Aggregation and Oxidative Injuries, Biochim. Biophys. Acta, Gen. Subj., 2017, 1861(1, Part B), 3531–3539, DOI:10.1016/j.bbagen.2016.03.014.
- H. Rimac, C. Dufour, Ž Debeljak, B. Zorc and M. Bojić, Warfarin and Flavonoids Do Not Share the Same Binding Region in Binding to the IIA Subdomain of Human Serum Albumin, Molecules, 2017, 22(7), 1153, DOI:10.3390/molecules22071153.
- L. McDonald, B. Liu, A. Taraboletti, K. Whiddon, L. P. Shriver, M. Konopka, Q. Liu and Y. Pang, Fluorescent Flavonoids for Endoplasmic Reticulum Cell Imaging, J. Mater. Chem. B, 2016, 4(48), 7902–7908, 10.1039/C6TB02456D.
- Y. Leblanc, N. Bihoreau and G. Chevreux, Characterization of Human Serum Albumin Isoforms by Ion Exchange Chromatography Coupled On-Line to Native Mass Spectrometry, J. Chromatogr. B: Anal. Technol. Biomed. Life Sci., 2018, 1095, 87–93, DOI:10.1016/j.jchromb.2018.07.014.
- T. J. Su, J. R. Lu, R. K. Thomas, Z. F. Cui and J. Penfold, The Conformational Structure of Bovine Serum Albumin Layers Adsorbed at the Silica−Water Interface, J. Phys. Chem. B, 1998, 102(41), 8100–8108, DOI:10.1021/jp981239t.
- L. R. S. Barbosa, M. G. Ortore, F. Spinozzi, P. Mariani, S. Bernstorff and R. Itri, The Importance of Protein-Protein Interactions on the PH-Induced Conformational Changes of Bovine Serum Albumin: A Small-Angle X-Ray Scattering Study, Biophys. J., 2010, 98(1), 147–157, DOI:10.1016/j.bpj.2009.09.056.
- V. S. Raghuwanshi, B. Yu, C. Browne and G. Garnier, Reversible PH Responsive Bovine Serum Albumin Hydrogel Sponge Nanolayer, Front. Bioeng. Biotechnol., 2020, 8, 573, DOI:10.3389/fbioe.2020.00573.
Footnotes |
| † Electronic supplementary information (ESI) available. See DOI: https://doi.org/10.1039/d3an02070c |
| ‡ Equal participation and data contribution were provided by both co-authors. |
| This journal is © The Royal Society of Chemistry 2024 |

