
 Open Access Article
 This Open Access Article is licensed under a Creative Commons Attribution-Non Commercial 3.0 Unported Licence
Flexible direct synthesis of phosphorus-rich CoP3 on carbon black and its examination in hydrogen evolution electrocatalysis†
Ishanka A.
Liyanage
 ,
Hannah
Barmore
and
Edward G.
Gillan
*
,
Hannah
Barmore
and
Edward G.
Gillan
*
Department of Chemistry, University of Iowa, Iowa City, Iowa, USA. E-mail: edward-gillan@uiowa.edu
First published on 25th September 2023
Abstract
In contrast to metal-rich cobalt phosphides, phosphorus-rich CoP3 is less studied as a hydrogen evolution reaction (HER) electrocatalyst, though it has distinct polyphosphide structural features and electronic properties that can be useful in facilitating proton reduction. While bulk crystalline solids are ideal surfaces for electrocatalytic studies, methods to disperse active catalysts on inexpensive high surface area supports can lead to improved HER activity with less catalyst. This paper describes a straightforward two-step procedure to produce a series of crystalline CoP3 particles supported on conducting carbon black powder. Anhydrous CoCl2 was deposited onto carbon black in various amounts from a methanol solution. The dried CoCl2/C products were directly reacted with elemental phosphorus in an ampoule at 500 °C. These reactions produce crystalline CoP3/C with nominally 5–25 mol% of CoP3 on carbon black. These CoP3/C composites possess a ∼3 to 10 times higher surface area (∼11–35 m2 g−1) versus similarly synthesized bulk CoP3. The CoP3 crystallites grow in aggregated form with carbon black nanoparticles. The HER electrocatalytic behavior of these composites in 0.5 M H2SO4 was evaluated and all CoP3/C composites were HER active and require only applied potentials near −95 mV to achieve 10 mA cm−2 current densities. The lower content CoP3 catalyst particles dispersed on carbon black show similar HER activity to bulk CoP3. These CoP3/C composites are stable in acid and show a high degree of electrocatalytic stability in extended time HER electrocatalytic experiments.
Introduction
Sustainable, cost-effective, and efficient processes for energy conversion and storage remain a crucial environmental and economic challenge. Molecular hydrogen as an excellent energy carrier and can be produced without carbon emissions, and so it is a key component in meeting future energy demands.1–4 The hydrogen evolution reaction (HER) can be catalytically driven using electrochemical or photochemical means via water splitting (2H2O → 2H2 + O2) and is important for renewable and green energy strategies in a hydrogen economy.5–8 Precious metal-based catalysts such as platinum are very efficient HER electrocatalysts, but low abundance and high cost have impeded their practical wide scale use. Extensive efforts are underway to identify effective, efficient, and less expensive HER electrocatalysts using earth-abundant elements in compounds including metal borides, carbides, nitrides, oxides, sulfides, selenides, and phosphides.9–13 Among these materials, metal phosphides are a diverse class of compounds including metal rich (MxPy: x > y) and phosphorus rich (MxPy: x < y) structures that exhibit electrocatalytic HER activity. Nanostructured, metal-rich and monophosphides have also shown impressive HER catalytic performance.14–17 The metal-rich phosphides have exposed metal surface sites along with nearby phosphorus for proton binding, reduction, and moderate stability during acidic HER electrocatalysis. In contrast, phosphorus-rich structures have metal and polyphosphide anion bonding arrangements that can modify proton–surface interactions, reduction processes and may improve corrosion resistance during acidic HER electrocatalysis.18,19In energy applications, cobalt phosphides are widely studied as active materials in fuel cell, battery, and HER electrocatalytic applications. The phosphorus-rich CoP3 has been examined as a thermoelectric and lithium or sodium-ion battery material.20–22 A variety of nanostructured, free-standing, metal-rich phosphides and monophosphides including Co2P, and CoP with different morphologies show promising HER performance in acidic conditions. Several cobalt phosphides supported on titanium foil (Co2P nanorods, hollow Co2P nanoparticles, uniform, multifaceted CoP nanoparticles) and CoP nanowires on a glassy carbon electrode (GCE) produce 10 mA cm−2 current density at very low applied potentials of −75 mV to −134 mV.14 The HER applied potentials markedly decrease with the increase of phosphorus content in Co–P phases (CoP versus Co2P), indicating that more phosphorus-rich structures can exhibit higher HER activities and stabilities.23
Several recent theoretical studies describe value in phosphorus-rich surface structures that can favor hydrogen adsorption and reduction in HER catalysis.18,24,25 The phosphorus rich Co–P phases, including CoP2 and CoP3 are much less studied as electrocatalysts. Bulk CoP2 nanoparticles require applied negative potentials of −120 mV to achieve 10 mA cm−2 in 0.5 M H2SO4.26 The most phosphorus-rich phase, CoP3, has a cubic, skutterudite (CoAs3) crystal structure with P44− polyanion rings, Co3+ cations, has a small semiconductor band gap (Eg ∼0.45 eV), and is typically produced in high temperature elemental (∼1000 °C) solid-state reactions.27–30 Crystalline CoP3 nanowires and CoP3 nanoparticles require applied potentials of −247 mV and −122 mV, respectively to achieve a 10 mA cm−2 current density.31,32 We recently reported a straightforward solvent-free moderate temperature (500 °C) route to crystalline CoP3 and other phosphorus-rich MP2/MP3 structures (M = Fe, Ni, Cu) and demonstrated that crystalline CoP3 microparticles are very effective in HER electrocatalysis in 0.5 M H2SO4 at low applied negative potentials of −147 mV to achieve a 10 mA cm−2 current density.33 This solvent-free method has been extended to a range of metal-rich to phosphorus-rich nickel phosphides that show HER activity.34
One potentially useful way to maintain or enhance electrocatalytic performance with lower catalyst amounts is to deposit/composite active catalysts on/with electrically conductive carbon-based supports.35–39 Catalyst–support interactions are reported to impact interfacial charge transfer that can result in more effective electrocatalytic activity.40–42 Carbon black (e.g., Vulcan XC-72) is a commonly employed high surface areas support in electrochemical studies and is used to disperse and stabilize platinum nanoparticles, to prevent agglomeration, and to reduce metal usage.38,39 Carbon-supported materials such as metal nitrides, sulfides, selenides, and phosphides have been studied in battery electrochemistry and in electrocatalytic reactions such as the hydrogen evolution reaction (HER), oxygen evolution reaction (OER), and oxygen reduction reaction (ORR).9,35,43,44 Recent catalyst materials intimately embedded in conducting carbons have been produced from pyrolysis of metal–organic frameworks.45
Carbon-supported metal-rich and monophosphides of several earth-abundant 3d transition metals (Fe, Co, Ni, Cu) have shown improved HER activity relative to their free-standing counterparts. Typical syntheses of carbon-supported cobalt phosphides require multiple synthetic steps such as hydro/solvothermal reactions of metal salt precursors, followed by moderate temperature (∼350–500 °C) phosphidization using toxic PH3 gas.23,46–48 These syntheses usually produce disordered or amorphous metal-rich Co2P and CoP nanomaterials and high temperature annealing is required to obtain crystalline products. Co2P and CoP materials supported on high surface area carbon nanotubes (CNTs) exhibit improved HER activity, achieving 10 mA cm−2 current density at applied potentials of −195 mV and −165 mV respectively, which are about 200 mV lower than measured for the bulk phosphide catalysts.46–50 CoP supported on nitrogen-doped CNTs shows high HER activity with an applied potential of only −99 mV to achieve a 20 mA cm−2 current density.23 Rare examples of supported phosphorus-rich cobalt phosphides on carbon supports include CoP2 on reduced graphene oxide (RGO) that shows HER activity at ∼30 mV lower applied potentials than required for free-standing CoP2 nanoparticles.26 Crystalline CoP3 nanoarrays grown on carbon fiber paper are efficient HER electrocatalysts at low applied potentials of −65 mV to attain a 10 mA cm−2 current density.40 CoP3 nanoparticles combined with carbon black via ball milling produce poorly crystalline nanocomposite mixtures of carbon-coated CoP3 with CoP and cobalt carbide phases (Co2C and CoCx) that were investigated as anode electrode materials for sodium-ion batteries.20
Our prior work on the solvent-free synthesis and properties of bulk crystalline microparticulate MP2/MP3 demonstrated that crystalline CoP3 is very effective for electrocatalytic HER.33 In this study, we demonstrate that a tunable modification of our direct CoP3 synthesis method is successful for the growth of varying amounts of crystalline CoP3 distributed on a conducting carbon black powder support. Changes in electrocatalytic HER activity were investigated versus catalyst composition for these CoP3/C composite structures. The influence of CoP3 catalyst content and physical or electrochemically active surface area on HER activity is described.
Experimental procedures
Starting materials
The cobalt phosphide materials were synthesized using sealed Pyrex ampoules (I.D. ∼9 mm, O.D. ∼13 mm). The reagents used as received were: CoCl2 (anhydrous, Alfa Aesar, 99.8%), red phosphorus (Aldrich, vacuum dried 60 °C, 99%), Vulcan XC-72 carbon black (Cabot), 12 M HCl (Fisher Scientific), and methanol (Fisher Scientific, 99.9%). Deionized water (18 MΩ) was obtained from a Photronix MiniQuad system. For electrochemical studies, the following materials were used: synthetic graphite powder (<20 μm, Sigma-Aldrich), paraffin wax (mp ≥ 65 °C, Sigma-Aldrich), concentrated H2SO4 (Certified ACS Plus 95–98%, Fisher Scientific), and 10% Pt on Vulcan XC-72 carbon (C1-10 fuel cell grade, E-Tek).Reaction safety considerations
All reactions described here were carried out in evacuated sealed Pyrex glass ampoules and utilizes red phosphorus that converts to pyrophoric molecular white phosphorous/P4 vapor above ∼400 °C. The maximum pressure (<7 atm) built inside the ampoule must be estimated from ideal gas law prior to each experiment to avoid any ampoule explosions. Ampoules must be heated in a well-ventilated fume hood to avoid any damage from an accidental explosion. Careful attention should be paid to opening the ampoule in a fume hood since transport end may present unreacted pyrophoric P4 and/or PCl3 liquid byproduct which fumes in contact with air. The transport should be carefully decomposed by oxidation using aqueous bleach solutions and the product should be well air ventilated in the fume hood prior isolation. The hazardous use of concentrated acids (HCl and H2SO4) in product isolation, chemical analysis, and electrochemistry must be carefully performed in a fume hood with proper protective gear. Careful attention to personal safety must be also performed for carbon-wax electrode preparation that utilizes razor blades and hot wax injection into Teflon tubing.Deposition of x-CoCl2 (x = 5, 10, 25 mol%) on carbon black
Different amounts of anhydrous cobalt chloride, x-CoCl2 (x = 5, 10, 25 mol% vs. C), were deposited on carbon black using methanol evaporation and drying of cobalt chloride and carbon black precursors to produce x-CoCl2/C composites. Typically, 0.650 g (5.0 mmol), 0.262 g (2.0 mmol) and 0.132 g (1.0 mmol) of CoCl2 were deposited on 0.182 g (15.1 mmol), 0.219 g (18.2 mmol), 0.229 g (19.0 mmol) of carbon black respectively to obtain 25-CoCl2/C, 10-CoCl2/C and 5-CoCl2/C precursor materials, respectively. The precursor materials were added to a 250 mL Schlenk flask with a stir bar in an argon filled glove box, the flask was covered with a rubber septum, the flask stopcock was closed and removed from the glove box. The flask was purged with nitrogen on a Schlenk line and approximately 30 mL of degassed methanol was cannula transferred onto the precursor mixture. The suspended dark solution was further degassed while stirring for several minutes and the rubber septum of the flask was replaced with a glass stopper. The flask was placed in a water bath (∼50 °C), was evacuated and the methanol was removed and condensed in a liquid nitrogen cold trap. The dry powder was then heated under vacuum at 180 °C for ∼15 minutes in a heating mantle. The closed flask was removed from the Schlenk line, returned to glove box, and weighed.Synthesis of CoP3 and x-CoP3/carbon black (x = 5, 10, 25 mol%) composites
Based on our prior reports of phosphorus-rich metal phosphide growth, CoP3/C composites were synthesized in sealed ampoule from direct stoichiometric reaction of anhydrous x-CoCl2/C and red phosphorus at 500 °C to produce CoP3 and PCl3 (mp/bp = −94/76 °C). For comparison, bulk CoP3 was synthesized using 0.133 g (1.0 mmol) of CoCl2 and 0.115 g (3.7 mmol) of red phosphorus. The x-CoP3/carbon black composites were synthesized from direct reactions of x-CoCl2/C precursors (x = 5, 10, 25 mol% vs. C) with excess red phosphorus (∼3–5 times more than stoichiometric) in sealed ampoules. Typical reagent amounts used are 25-CoP3/C reaction with 0.132 g (0.8 mmol) of 25-CoCl2/C and 0.269 g (8.6 mmol) of red phosphorus, 10-CoP3/C reaction with 0.131 g (0.55 mmol) of 10-CoCl2/C and 0.185 g (6.0 mmol) of red phosphorus, and 5-CoP3/C reaction with 0.098 g (0.28 mmol) of 5-CoCl2/C and 0.162 g (5.2 mmol) of red phosphorus.The starting materials were ground together in an argon filled glove box with an agate mortar and pestle and loaded into Pyrex glass ampoule, which was then closed with a Cajon fitting and Teflon valve and removed from the glove box. Each tube was evacuated on a Schlenk line for ∼15 minutes, and then the tube was flame sealed. The evacuated, sealed ampoule was heated in a horizontal tube furnace (Lindberg Blue M-clamshell) to 500 °C at a heating rate of 100 °C h−1 and reaction was held at 500 °C for ∼48 hours.
After the reaction, the end of the tube without solid was pulled out of the furnace and cooled to near room temperature and a colorless PCl3 liquid condensed on the cooled glass walls. When no further liquid condensed, the entire tube was cooled to room temperature. The cooled tube was cracked open in air in the fume hood, carefully keeping the fuming liquid PCl3 away from the solid. The solid was allowed to sit in air for several minutes and then washed with methanol for 1 h and then 6 M HCl for 1 h. All solids were rinsed several times in DI water until the pH of the wash solution was neutral and they were dried in air at room temperature and weighed.
For comparison purposes, XC-72 carbon black powder was heated in an evacuated ampoule with phosphorus powder of the same P amount used as in 25-CoCl2/C reaction (annealed C/P) and without phosphorus (annealed C) at 500 °C for 48 hours.
Sample characterization
Powder X-ray diffraction (XRD) was performed using a Bruker D8 DaVinci diffractometer with nickel filtered Cu Kα radiation, (40 kV, 40 mA, 0.05° step size, 5°–80° 2θ). Samples were ground to fine powders and affixed to glass slides using a thin layer of vacuum grease. XRD data for catalyst powders adhered to thin cut slabs of carbon-wax electrode tips before and after electrochemistry were obtained at higher resolution conditions (40 kV, 40 mA, 0.01° step size, 27°–60° 2θ). Reference XRD patterns were generated using Crystal Maker (https://www.crystalmaker.com/index.html). The elemental composition of thin pelletized samples was obtained using Rigaku ZSX Primus IV dispersive X-ray fluorescence spectrometer. The carbon content of the samples was further analyzed on a CE440 combustion CHN analyzer. Raman spectroscopy of the samples were performed on a Renishaw Raman microscope with a 514 nm excitation laser. The Brunauer–Emmett–Teller (BET) measurements (50-point isotherms) on Quantachrome Nova 1200 nitrogen surface area analyzer was performed on vacuum dried samples (150 °C for 4 hours). The morphology and elemental mapping of the samples were investigated using scanning electron microscopy (SEM) and energy dispersive spectroscopy (EDS) on a Hitachi S3400 system. Samples were prepared by pressing pre-ground samples onto carbon tape on aluminum stubs. The morphologies of the sonicated, methanol suspended particles were examined using a Hitachi S-7800 transmission electron microscope (TEM) with an accelerating voltage of 100 kV.Electrode preparation
The various CoP3 catalysts, 10% Pt on carbon, and annealed carbon black with and without phosphorus were evaluated using a graphite/carbon wax composite electrode described in our recent work.33,34,51,52 Solid conducting graphite/carbon wax electrodes are stable and inert with excellent reproducibility and negligible background current.53 Several modifications for this current study are use of a 50/50 wt% graphite/carbon wax electrode composition and a PTFE liner that was coned at the electrode surface so that gas bubbles are more easily removed during electrocatalysis (Fig. S1, ESI†).34,51The working electrode tips were formed by placing melted graphite/carbon wax into threaded and coned PTFE tubing (1.4 cm length, 3.2 mm ID, 6.4 mm OD) which has a 0.080 cm2 geometric internal surface area. The blank 50% graphite/carbon wax (Cwax) electrode tips were connected to 3.2 mm diameter brass current collectors, placed in a polyethylene bag, and submerged in a preheated (55 °C) water bath for ∼10 minutes to soften the wax for catalyst embedment. About 1–2 mg of each catalyst sample was briefly sonicated to a homogeneous suspension with 20 μL of methanol and about 5–10 μL aliquot of this suspension was placed on an aluminum weigh boat. The aluminum weigh boat was allowed to air dry for several minutes and then its weight was tared in CAHN C-33 200 mg max microbalance, and it was then placed in a preheated hot plate (55 °C) for ∼5 minutes. The coned surface of the warmed Cwax electrode tips was gently pressed onto the catalyst sample and excess powder adhered to PTFE tip surface was carefully returned to the aluminum weigh boat. The tip was re-pressed several times at a clean space inside the weigh boat to assure sample embedment. The aluminum weigh boat after catalyst loading was then weighed on the tared microbalance and the mass of catalyst loaded to electrode tip was recorded; typical sample mass loadings on the 0.08 cm2 Cwax electrode tip ranged from about 0.5 to 1.0 mg.
Electrochemical measurements
Electrochemical experiments utilized a three-electrode, single compartment cell, a Bioanalytical Systems (BASi) 100b potentiostat, and were guided by literature best practices.54 The cell consisted of a PTFE covered Pyrex beaker, the modified BASi electrode-tip assembly described above as the working electrode, a saturated calomel reference electrode (SCE; Fisher Accumet), a platinum wire counter electrode, and a magnetic cross stir bar placed directly under the working electrode (∼6 mm away) to aid gas removal from the electrode surface and minimize surface adhesion of gas bubbles. Graphite counter electrode was also used to verify that no platinum counter electrode effect is observed with these analyzed samples. Details of the experimental setup are similar to those described in our recent work and shown in Fig. S1 (ESI†).33,34,51Hydrogen evolution reaction (HER) polarization curves were obtained using linear sweep voltammetry (LSV) at 5 mV s−1 in acidic 0.5 M H2SO4 (pH = 0.3) aqueous solutions. The electrolyte solutions were continually purged with H2 (6.0 ultra-high purity 99.999%, Praxair) to maintain a reversible (H+/H2) Nernstian potential in the solution for HER reactions.55 The SCE reference electrode was calibrated against reversible hydrogen electrode (RHE) values for the electrolyte solution using established conversions [E(RHE) = E(SCE) + 241 mV + (59 mV) pH]. RHE adjustment for 0.5 M H2SO4 is 258.2 mV. All experimental and literature potential values are reported versus RHE. All current densities are calculated using the geometric surface area of the graphite/carbon wax electrode (0.08 cm2). Typically for LSV in acidic media, 50 LSV scans with zero iR compensation and 20 LSV scans with 85% iR compensation were performed to verify reproducible sample responses and short-term sample stability. For iR uncompensated LSV scans, potential was swept to negative values until applied potentials of about −750 mV was reached and for 85% iR compensated LSV scans, the potential was swept to negative values until current density of about 50 mA cm−2 is reached. Extended stability experiments of samples in 0.5 M H2SO4 were analyzed by constant potential time base amperometry (chronoamperometry, CA) with the working electrode potential set at a value that produced ∼10–15 mA cm−2 current density during LSV experiments and held at that potential for 18 hours.
Electrochemical surface area (ECSA) measurements were obtained from double layer capacitance (Cdl) values determined by cyclic voltammetry (CV), in the non-faradaic region (−100 mV to 350 mV RHE)- in 0.5 M H2SO4 at scan rates from 5 to 75 mV s−1. ECSA was calculated from the Cdl of each sample and the ideal specific capacitance (Cs, 35 μF cm−2) of an atomically smooth planar electrode surface in 0.5 M H2SO4. Geometric electrode area is useful when catalytic surface reactions are limited by reactant transport, but ECSA may better account for the electroactive surface area of embedded electrocatalyst particles.
Post electrochemical analysis
Approximately 1 mm of the surface of each catalyst loaded working electrode tips was cut for post electrochemical analysis and compared with similarly cut fresh catalyst loaded electrode tips. Powder XRD was done to examine the crystallinity of the catalysts before and after electrochemistry experiments. The PTFE lining of the electrode tips was removed, and the morphology and elemental analysis of the electrode tip surfaces were investigated using SEM/EDS and Raman spectroscopy.Results and discussion
Synthesis and structural analysis of CoP3/carbon black composites
Among the four Co–P binary phases (Co2P, CoP, CoP2, CoP3),56 the most phosphorus rich phase is CoP3. We previously demonstrated that the solvent-free reaction of anhydrous CoCl2 and stoichiometric amounts of elemental phosphorus produces crystalline phase pure CoP3 at 500 °C along with volatile PCl3 (eqn (1)).33,57 In this study, we report a facile and flexible two-step synthetic approach for the growth of a series of CoP3/carbon composites. Different amounts of CoP3 grown on carbon black powder (x-CoP3/C, x = 5, 10, 25 mol%) samples were produced from methanol deposition of x mol% of CoCl2 onto carbon black (x-CoCl2/C) followed by metal phosphide formation through solvent-free, direct reaction of x-CoCl2/C with P4 vapor at 500 °C. The balanced reactions for CoP3 and x-CoP3/C synthesis are shown in eqn (1) and (2). The reaction of CoCl2 with phosphorus is thermodynamically driven via volatile PCl3 elimination (ΔHf = −320 kJ mol−1).| CoCl2 + 11/3P → CoP3 + 2/3PCl3 | (1) |
| x-CoCl2/C + (11 + y)P → x-CoP3/C + 2/3PCl3 (x = 10, 25 y = 0; x = 5 y = 7.5) | (2) |
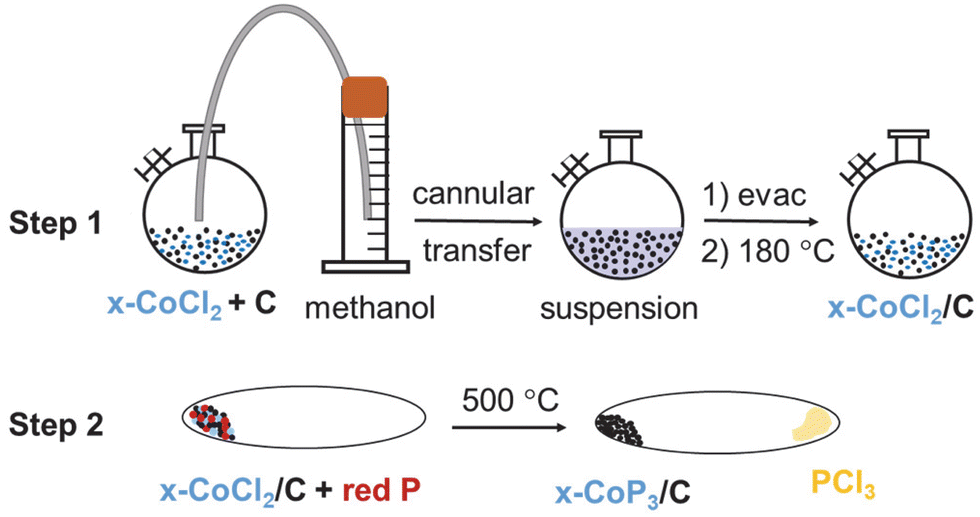 | ||
| Fig. 1 Schematic of two-step synthesis procedure of x-CoP3/C (x = 5, 10, 25 mol%) materials. Step 1 shows methanol precipitation of CoCl2 onto C (XC-72 carbon black), and step 2 shows direct reaction of x-CoCl2/C with elemental red phosphorus at 500 °C. | ||
In contrast to our prior CoP3 synthesis (eqn (1)), analogous experiments with x-CoCl2/C and stoichiometric amounts of red phosphorus produced lower Co–P products. It was determined that excess phosphorus was needed for phase pure CoP3 formation from x-CoCl2/C. Excess phosphorus in the range of 3–5 times more than stoichiometric amounts led to CoP3 growth on carbon black powder, specifically three-fold excess phosphorus was sufficient for 10-CoP3/C and 25-CoP3/C, while five-fold excess phosphorus was needed for the lowest CoCl2 content 5-CoP3/C composite (eqn (2)). When the 5-CoP3/C targeted reaction was run using a lower three-fold excess of phosphorus, XRD showed multiple phases were produced, including CoP, CoP2 and CoP3 (Fig. S3, ESI†). XRD data for successful single phase CoP3 alone and supported on carbon black (x-CoP3/C) are shown in Fig. 2. All the XRD patterns of free standing CoP3 and x-CoP3/C (x = 5, 10, 25) match with the crystalline cubic, skutterudite-type CoP3 structure [space group = Im![[3 with combining macron]](https://www.rsc.org/images/entities/char_0033_0304.gif) (204)], consistent with the CoP3 reference pattern (PDF#01-070-6854). The annealed carbon black reacted with P (annealed C/P) at 500 °C is also shown.
(204)], consistent with the CoP3 reference pattern (PDF#01-070-6854). The annealed carbon black reacted with P (annealed C/P) at 500 °C is also shown.
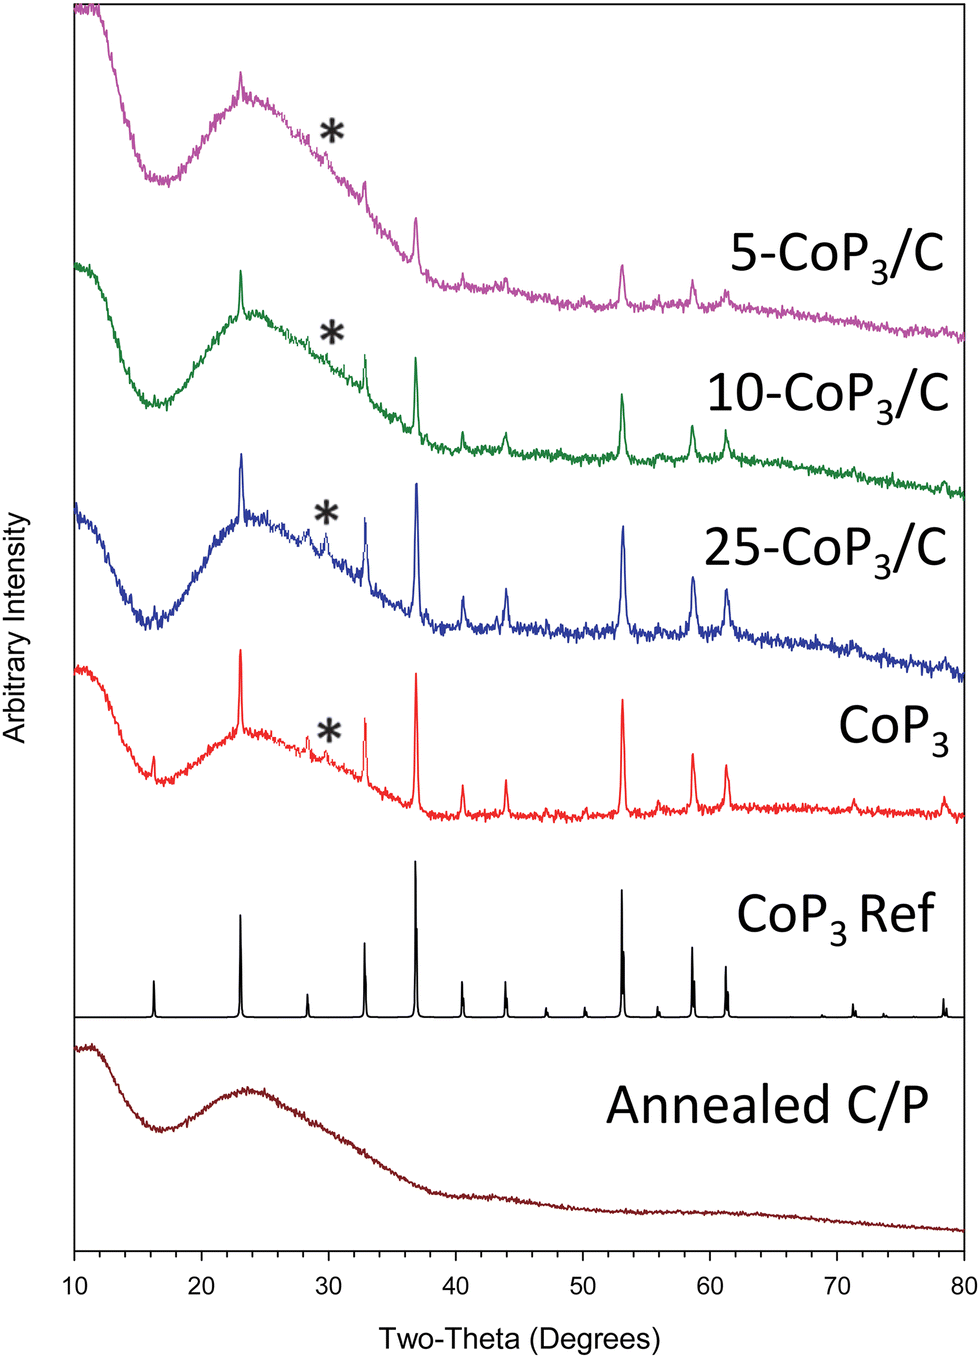 | ||
| Fig. 2 Powder XRD results for x-CoP3/C (x = 5, 10, 25 mol%) products from two-step synthesis procedure of methanol precipitations of x-CoCl2/C (x = 5,10, 25 mol%) followed by direct reactions of x-CoCl2/C with elemental red phosphorus at 500 °C. Reference (Ref) pattern for CoP3 and XC-72 carbon black annealed at 500 °C with elemental red phosphorus are also shown. Trace CoP2O6 impurity are identified with a (*). | ||
The CoP3 peak intensities increase in x-CoP3/C composites as the amount of CoP3 on the carbon black support increases. As the content of CoP3 in the composites decreases to 5 mol%, diffraction intensity from CoP3 is reduced, but crystalline CoP3 is still visible in the XRD pattern. Estimated crystallite sizes using XRD peak widths show that carbon black supported CoP3 crystallites are relatively smaller in size compared to bulk CoP3 indicating that some particle size reduction for crystallites grown on carbon black (Table 1). Traces of CoP2O6 (PDF#04-010-2428) were observed in both free standing CoP3 and x-CoP3/C composites. This phosphite might result from phosphorus reaction with some oxygen containing species adsorbed on carbon black and/or CoCl2 particles. Adsorbed water or methanol during the CoCl2 deposition process may be an oxygen source.
| CoCl2/P reactant molar ratio (target × mol% CoP3 for x-CoP3/C) | XRD phasea (cryst. size, nm) | Yieldb (%) | XRF Co![[thin space (1/6-em)]](https://www.rsc.org/images/entities/char_2009.gif) :P molar ratios :P molar ratios |
XRF/CHN Co:C molar ratio (ideal) |
BET surface areac (m2 g−1) |
|---|---|---|---|---|---|
| a Crystallite size from XRD peak width, trace CoP2O6 peaks detected. b Yield based on target composition and product mass. c BET values for annealed C (238 m2 g−1) and annealed C/P (37 m2 g−1). | |||||
| 1/3.7 (CoP3) | CoP3 (44) | 77 | 1:3.00 |
Not applicable | 3 |
| 1/11.1 (25-CoP3/C) | CoP3 (34) | 76 | 1:2.65 |
1:2.4/3.1 (1:3.0) |
11 |
| 1/11.0 (10-CoP3/C) | CoP3 (35) | 79 | 1:2.82 |
1:5.6/6.5 (1:9.0) |
17 |
| 1/18.5 (5-CoP3/C) | CoP3 (34) | 89 | 1:3.00 |
1:13.5/17.0 (1:19.0) |
35 |
During synthesis, some reaction is evident by 250 °C when the CoCl2/P powder mixture turns black and red phosphorus starts to sublime to gaseous P4 as the reaction temperature approaches 500 °C. Subsequent heating at 500 °C results in CoP3 crystallite growth and a colorless, volatile PCl3 byproduct, previously confirmed by 31P NMR.57 The pH of the transported PCl3 for the x-CoP3/C reactions tested immediately after opening the reaction tube showed similar acidity to phosphoric acid, so acidic HxPOyClz species may form during synthesis and give rise to trace phosphite impurities. Both free-standing CoP3 and x-CoP3/C composite products were isolated as black solids with crystalline CoP3 and greater than 75% yields (Table 1).
Control experiments annealing only carbon black at 500 °C results in near quantitative recovery of carbon (annealed C). The recovered yield of carbon black annealed with phosphorus was slightly greater than (∼110%) annealed carbon black yield indicating that carbon black incorporates some phosphorus at elevated temperatures (annealed C/P), while maintaining its amorphous structure (Fig. 2). The broad and low intensity XRD peaks centered at 23.5° and 43.2° are in the same positions as disordered carbon black and near interplanar graphite spacings (Fig. S4, ESI†) so no clear structural differences occur in the carbon support when heated with phosphorus.
The presence of both CoP3 and disordered/graphitic carbon in the x-CoP3/C composites was examined using Raman spectroscopy. The Raman spectra of synthesized crystalline CoP3 and x-CoP3/C materials is shown in Fig. 3 and Fig. S5 (ESI†). Both annealed carbon black samples with or without excess phosphorus and all x-CoP3/C composites show two peaks centered at approximately 1570–1578 cm−1 and 1332–1342 cm−1, which correspond to carbon bonding vibrations for graphitic (G-band) and disordered (D-band) structures, respectively.58–60 Consistent with the prior studies, eight active Raman modes for skutterudite CoP3 structure (ΓR = 2Ag + 2Eg + 4Tg) was observed in CoP3 and 25-CoP3/C composite materials.40 These CoP3 peaks were still present but not well resolved in 10-CoP3/C and 5-CoP3/C samples probably due to lower CoP3 content in the carbon matrix. Several weak intensity peaks between 650 cm−1 to 1130 cm−1 for CoP3 and x-CoP3/C composites may correspond to P–O bonding in anionic structures consistent with XRD evidence for CoP2O6.61–65 The Raman results provide further support for crystalline CoP3 growth on carbon black for the x-CoP3/C composite structures.
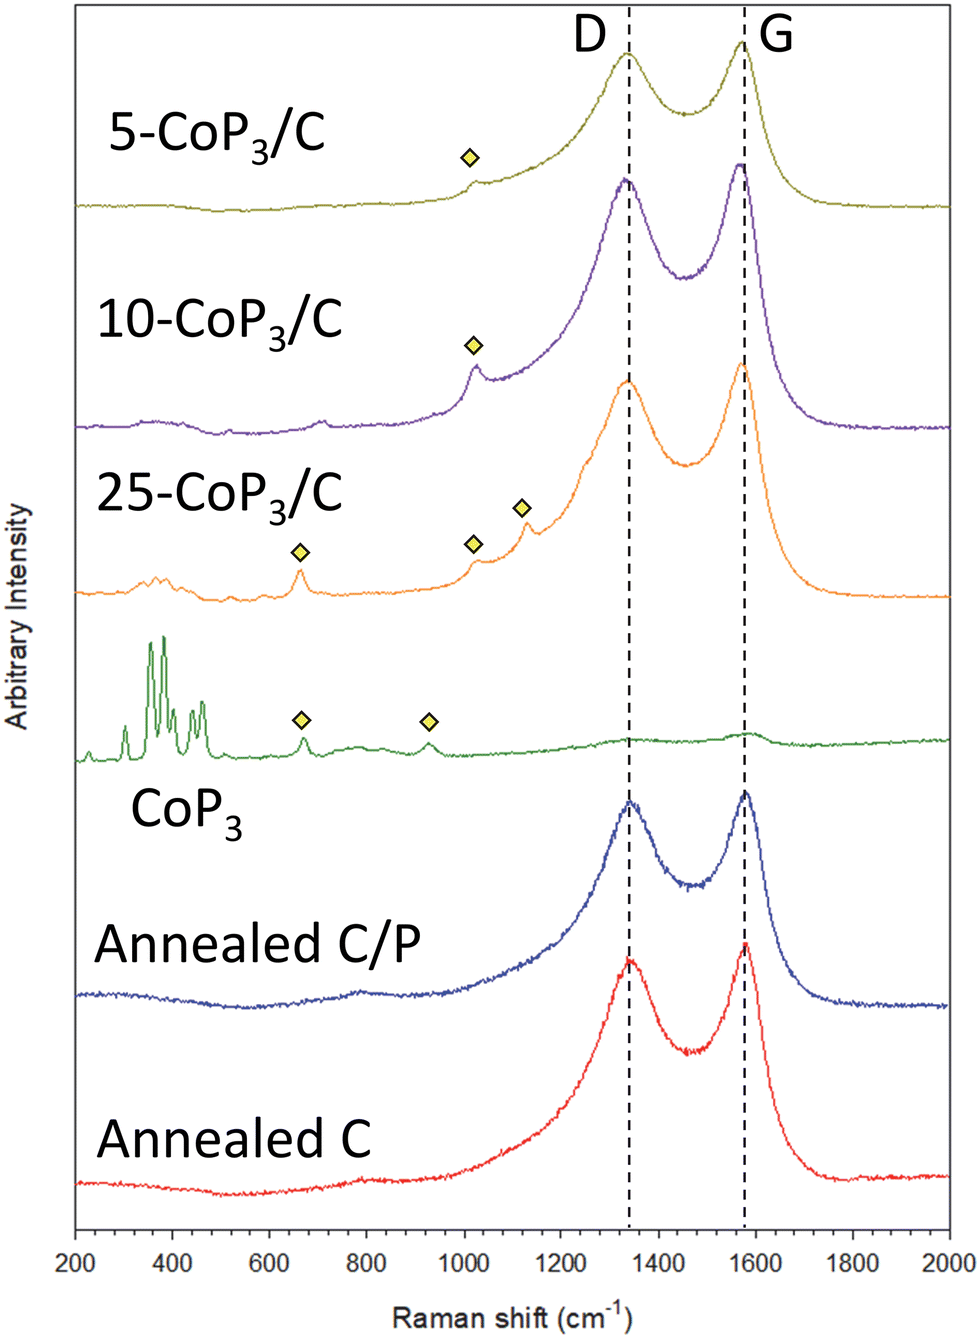 | ||
Fig. 3 An overlay of Raman spectra of CoP3, x-CoP3/C (x = 5,10, 25) and 500 °C annealed carbon black alone (C) and carbon black annealed with phosphorus (C/P) in the region of 200–2000 cm−1. ( denotes peaks for P–O bonding). denotes peaks for P–O bonding). | ||
Compositional analysis of x-CoP3/C composites
According to XRF analyses, free standing CoP3 and the x-CoP3/C composite powders have relative atomic compositions consistent with CoP3 (Table 1). The Co:C molar ratios for x-CoP3/C composites obtained from both XRF and CHN analysis indicate that carbon content is slightly lower than the ideal ratios but shows the expected increase in carbon content with decreasing CoP3 amounts. The EDS mapping for elements in free standing CoP3 and x-CoP3/C powders is shown in Fig. S6 and S7 (ESI†). The elemental maps for all x-CoP3/C samples show homogenous distributions of the elements and relatively intense P signals consistent with CoP3 in these materials. As expected, the carbon signal shows increased intensity as CoP3 content decreases. A homogenous distribution of phosphorus and carbon is observed in the annealed C/P sample (Fig. S8, ESI†) and EDS analysis estimates indicate about 2 mol% P in the carbon material. The bulk CHN analysis of annealed C is 99.6 wt% C, while annealed C/P samples are 78.9 wt% C, leading to an upper estimate of ∼9 mol% phosphorus in annealed C/P, though some of this non-carbon sample mass includes oxygen content.
Microstructural and morphological analysis of x-CoP3/C composites
Consistent with our prior work on free-standing CoP3 particle growth,33 the morphology of CoP3 from scanning electron microscopy (SEM) shows it consists of a collection of large ∼300–500 μm shard-like aggregates comprised of smaller fused, bead-like, faceted microparticles of about 0.5 μm in size (Fig. 4). In contrast, the x-CoP3/C composites form as relatively smaller, loosely packed aggregates of fused, irregular particles. The 25-CoP3/C sample consists of ∼20–50 μm sized, faceted aggregates of irregular fused particles ranging from 1 μm to 5 μm in size. Smaller particle aggregates of about 5–10 μm are identified in 10-CoP3/C and 5-CoP3/C products, indicating that the particle aggregate size is gradually reduced as the carbon black content in the composite increases. | ||
| Fig. 4 Representative SEM images of CoP3 and x-CoP3/C (x = 5, 10, 25 mol%) powders from reactions of x-CoCl2/C and red phosphorus at 500 °C. Scale bars are 50 μm for all left images. Scale bar lengths for right images of CoP3 and 10-CoP3/C are 5 μm and 25-CoP3/C and 5-CoP3/C are 10 μm. | ||
The annealed C control sample is comprised of spherical nanoparticle mixtures of ∼10–25 nm size and ∼50–60 nm size particles by TEM (Fig. 5). The annealed C/P particles are a slightly larger mix of ∼15–30 nm and ∼50–100 nm sizes. The TEM images for x-CoP3/C represent the smaller particulate components of fused particle aggregates of x-CoP3/C identified by SEM. Some of the observed nanoparticle sizes and morphologies in the x-CoP3/C composites resemble the annealed carbon black products. Given that our two-step synthesis first involves deposition of CoCl2 crystallites onto carbon black powder, it is anticipated that the CoP3 crystallites are well mixed with carbon black. In general, these composites have roughly spherical semi-transparent carbon black nanoparticle (∼10 nm to 50 nm) interspersed with darker, sometimes larger, faceted particles (∼50–150 nm) that are likely crystalline cubic CoP3 (Fig. 5). There were no clear differences in the particle sizes, morphologies, and aggregation between the different composites, but the prevalence of darker faceted particles that are likely CoP3 crystallites increases from 5 mol% to 25 mol% in carbon composites. The SEM and TEM images are consistent with CoP3 crystallites growing from CoCl2 crystallites deposited on carbon black nanoparticles to form into well-mixed composite structures. The nanoscale carbon black features and variations in morphological features may lead to differences in external surface areas of different composite structures.
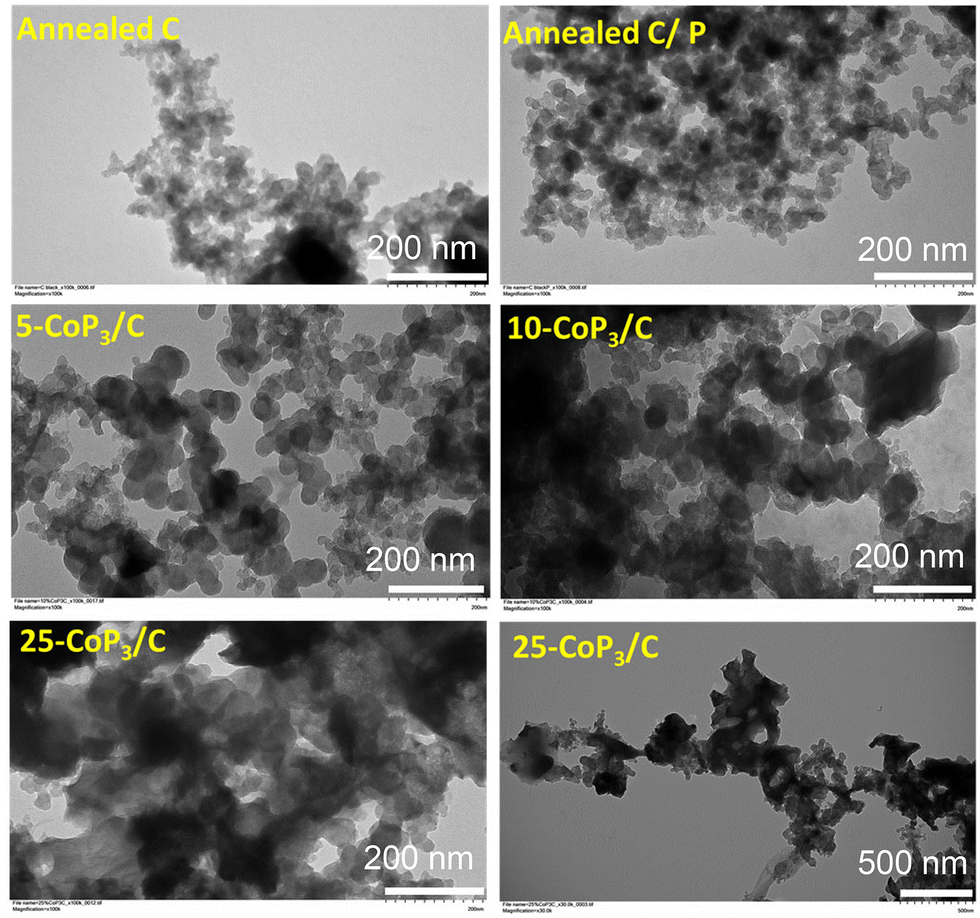 | ||
| Fig. 5 Representative TEM images of x-CoP3/C (x = 5, 10, 25 mol%) particles and aggregates synthesized from direct reactions of x-CoCl2/C (x = 5, 10, 25 mol%) with elemental red phosphorus at 500 °C. | ||
The particle aggregation shown by SEM is reflected in changes in BET surface areas from nitrogen adsorption measurements (Table 1). The full adsorption/desorption nitrogen isotherms for CoP3, x-CoP3/C and annealed carbon black samples are shown in Fig. S9 (ESI†). No significant change in BET surface area was observed between XC-72 carbon black (∼250 m2 g−1)66–68 and our 500 °C annealed C powder (238 m2 g−1). Some studies have shown that phosphorus doping in carbon structures can increase surface area, pore volume and average pore sizes.69 In contrast, carbon black particle growth or aggregation occurs in our annealed C/P as its 37 m2 g−1 surface area is ∼6 times lower than annealed C. The measured surface area of 5-CoP3/C is similar to annealed C/P, and as CoP3 content increases to 10 and 25 mol%, surface area decreases from ∼35 to 11 m2 g−1, which is still nearly 4 to 10 times larger than the bulk CoP3 surface area (∼3 m2 g−1). The decrease in BET surface area with increasing CoP3 content is consistent with observed increased particle aggregation in SEM/TEM images (Fig. 4). A similar trend of reduced surface area was reported for a carbon supported FeP catalyst composite.39 These surface area results show that the high surface area carbon black powder can improve the overall external surface area and likely the dispersion of CoP3 in the composite structure.
Examination of the HER activity of x-CoP3/C composite materials
The relative electrocatalytic HER performance of x-CoP3/C powders directly adhered to sticky carbon wax (Cwax) composite electrode tips was evaluated in a three-electrode cell in H2-saturated 0.5 M H2SO4, similar to our recent studies.33,34,51,52 The HER activity and stability of the catalysts were examined using linear sweep voltammetry (LSV) and constant potential time base chronoamperometry (CA) measurements, respectively. Representative iR uncompensated LSV scans for free standing CoP3 and x-CoP3/C samples are shown in Fig. 6. The individual LSV and CA data for CoP3 and x-CoP3/C composites is shown in Fig. S10–S14 and S18, S19 (ESI†). An LSV overlay plot with 85% iR compensated data is shown in Fig. S15 (ESI†). The iR compensated average applied potentials to achieve 10 mA cm−2 current densities are about 40–60 mV lower than the uncompensated results. Table 2 shows a summary of average LSV data, average Tafel slopes near onset potentials, electrochemically active surface area (ECSA) measurements and percent current density retained after 18 h CA experiments.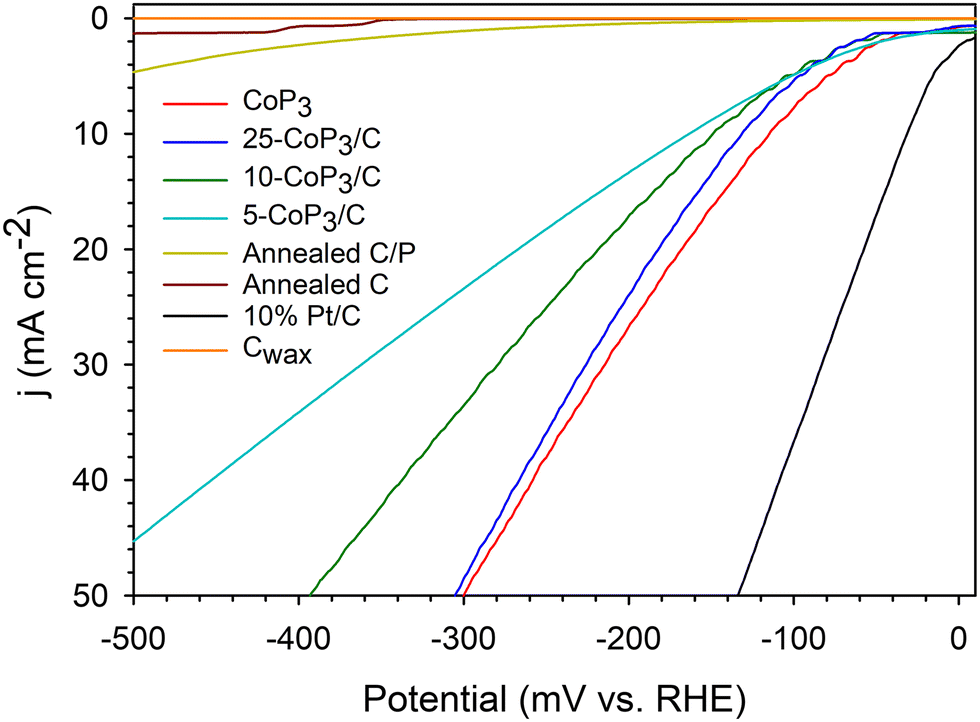 | ||
| Fig. 6 Representative LSV data for x-CoP3/C (x = 5,10, 25 mol%) powders on Cwax electrodes using Pt counter and SCE reference electrodes in 0.5 M H2SO4 (5 mV s−1 scan rate, no iR compensation) in a three-electrode cell. An LSV overlay graph with 85% iR compensated data is shown in Fig. S15 (ESI†). Plots for Cwax, annealed C, annealed C/P and commercial 10% Pt/C are shown for comparison. | ||
| x-CoP3/C phase | 10b mA cm−2 (mV) | 20b mA cm−2 (mV) | Tafel slopeb (mV dec−1) | ECSAc (cm2) | Extended stabilityd (%) |
|---|---|---|---|---|---|
| a LSV results in 0.5 M H2SO4 with SCE reference converted to RHE, Pt wire counter, powders embedded on a Cwax electrode. b Average data from 50 LSVs and current densities scaled for 0.08 cm2 geometric electrode area. Average 20 LSV results using 85% iR compensation in parentheses. c Data shown before/after 50 LSV runs. d From constant potential amperometry measurements over the 15 min to 18 h period. | |||||
| CoP3 | −114 ± 1 | −168 ± 1 | −51 ± 4 | 42/38 | 99 |
| (−72 ± 1) | (−102 ± 1) | (−38 ± 1) | |||
| 25-CoP3/C | −131 ± 2 | −182 ± 2 | −98 ± 1 | 46/28 | 96 |
| (−94 ± 1) | (−118 ± 1) | (−77 ± 1) | |||
| 10-CoP3/C | −148 ± 1 | −219 ± 1 | −114 ± 4 | 45/43 | 92 |
| (−92 ± 1) | (−125 ± 1) | (−86 ± 9) | |||
| 5-CoP3/C | −164 ± 1 | −268 ± 1 | −133 ± 2 | 46/32 | 96 |
| (−97 ± 1) | (−134 ± 1) | (−92 ± 3) | |||
| Annealed C/P | −612 ± 13 | — | — | 0.7/0.8 | — |
| Annealed C | −738 ± 11 | — | — | 0.4/0.6 | — |
| 10%Pt/C | −31 ± 4 | −57 ± 8 | −49 ± 2 | 27/44 | 30 |
| (−8 ± 1) | (−33 ± 2) | (−31 ± 3) | |||
Very low to negligible HER activity is observed for both annealed C and annealed C/P powders, with a slight catalytic improvement for the annealed-C/P at high applied potentials. This contrasts with several prior studies on phosphorus-doped carbons that show moderate improvement in ORR and HER activity versus carbon.47,69 Similarly, nitrogen-doped carbon materials can show enhanced HER catalytic activity.23,48,60 In contrast to annealed C/P materials, HER activity is greatly improved once CoP3 is introduced onto the carbon support and all x-CoP3/C composites show higher HER activity approaching the activity of CoP3 particles that require an applied potential of −115 mV to reach a 10 mA cm−2 current density (Fig. 6 and Table 2). The HER activity of free standing and composite catalysts followed the trend of 5-CoP3/C < 10-CoP3/C < 25-CoP3/C ≤ CoP3 for applied potentials required to achieve 10 mA cm−2 current density. This overall activity trend follows changes in CoP3 content in the composite, but the changes are relatively small versus the decrease in relative molar/atomic CoP3 content to as low as 5 mol%. While the unsupported CoP3 catalyst achieves 10 mA cm−2 current density at −114 mV, the more dilute 5-CoP3/C sample (CoP3:C atomic ratio of 1:20) generates about 6 mA cm−2 at this potential. With iR corrections, there is only a ∼20 mV difference in activity of bulk CoP3versus any of the x-CoP3/C carbon composite materials (Table 2).
The 25-CoP3/C composite catalyst showed most similar HER performance to free standing CoP3 particles but with only 25 mol% CoP3 content (CoP3:C ratio of 1:4). When an 85% iR correction (cell resistance) is applied, 25-CoP3/C (∼40 Ω) outperformed pure CoP3 (∼35 Ω) at applied potentials beyond −150 mV (Fig. S15, ESI†), so lower amounts of CoP3 distributed on conducting carbon particles have similar activity to pure CoP3. The similar electrochemical cell resistances suggest that carbon black powder does not interfere with electrical conduction or catalyst surface charge transfer during the electrochemical reactions. There surface charge accumulation abilities of CoP3 and all x-CoP3/C composites are similar to a commercial 10%Pt/C standard and much higher than carbon support values (Table 2). The ECSA values derived from cyclic voltammetry data are near 45 cm2 for all CoP3 samples and much larger than the near 1 cm2 values for the carbon supports (Fig. S16 and S17, ESI†). A previous study showed a similar increase in ECSA when 50 wt% FeP was loaded onto carbon particulate supports.39 For comparison, CoP3 nanoparticles synthesized via a hydrothermal-phosphidation approach reportedly have a high capacitance of 44.6 mF cm−2 (converted ECSA of 319 cm2).40 In our work, the similarity in ECSA values for all x-CoP3/C composites and bulk CoP3 is reflected in their similar HER activity and it contrasts with their large differences in physical BET surface area. Plots of BET versus ECSA values for CoP3 and x-CoP3/C are shown in Fig. 7 along with a bar graph of applied potentials needed to achieve 10 mA cm−2 current densities. While the carbon black support provides surface area advantages, it appears that its major influence is to distribute the lower amounts of electroactive CoP3 effectively along its conducting particulate structure and facilitate electron transfer from the Cwax electrode and the electrolyte solution. The moderate physical BET surface area of the composites with lower CoP3 content and higher ECSA values, suggests that lower amounts of supported CoP3 are distributed on the carbon support in a manner that leads to similar amounts of electrochemically active surfaces exposed to the acidic electrolyte as compared to bulk CoP3.
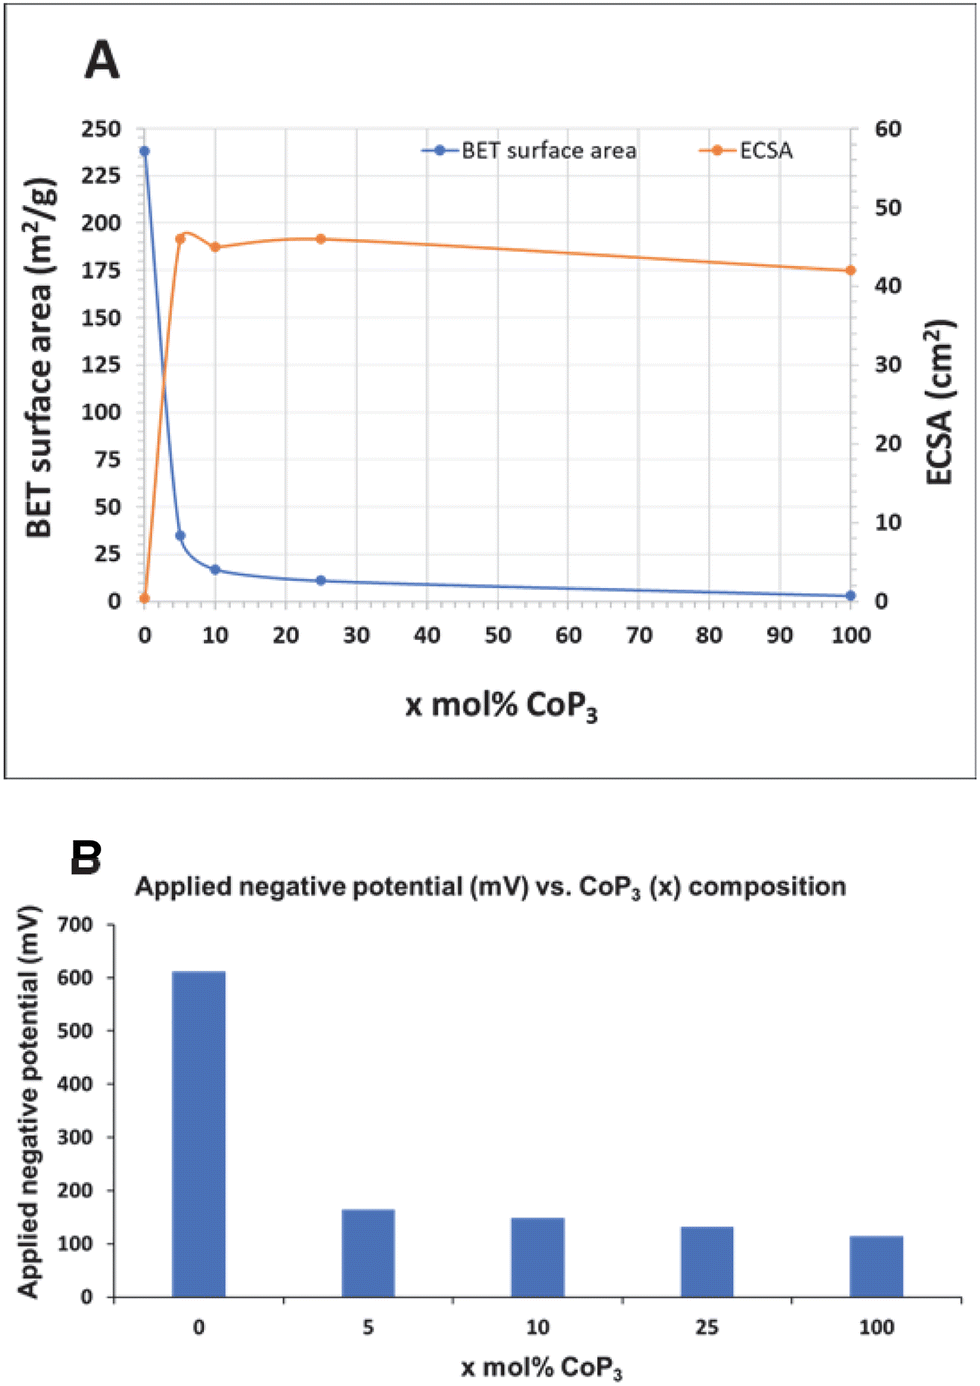 | ||
| Fig. 7 (A) Comparison of trends of physical BET surface area and electrochemically active surface area (ECSA) for CoP3 and x-CoP3/C (x = 5, 10, 25 mol%) materials along with annealed C/P (x = 0). (B) Variation of applied negative potentials (iR uncompensated) to achieve a 10 mA cm−2 current density with the amount of CoP3 dispersed on carbon black composites. | ||
The calculated Tafel slopes related to H2 formation kinetics at initial LSV current flow, show similar trends to the HER activity that slightly decreases with decreasing CoP3 content. The Tafel value for CoP3 is near that of the Pt/C standard and similar to prior work in CoP3 nanoparticles (−58 mV dec−1).40 The Tafel slopes increase from CoP3 through the x-CoP3/C composite as CoP3 content decreases. There Tafel slopes near 100–120 mV dec−1, for both free standing and x-CoP3/C composites are consistent with mixed Volmer–Tafel or Volmer–Heyrovsky mechanisms for proton reduction.70 The larger Tafel slopes at low CoP3 content in the composites indicate an expected lower rate of surface proton reduction with high carbon content and fewer electroactive CoP3 surface sites.
All the CoP3 based electrocatalyst materials (CoP3 and x-CoP3/C) showed >92% percent retention of ∼10–15 mA cm−2 current density at a constant applied potentials (CA, Table 2) and LSV scans obtained after 18 h CA measurements overlay well with the initial scans. The CA results show that both phosphorus rich CoP3 and supported particulates are more robust in corrosive acidic HER environments than the Pt/C standard (Fig. S18 and S19, ESI†). These results agree well with stability observed for CoP3 nanoparticles and supported CoP3.40 The extended stability of CoP3 and the x-CoP3/C composites may be due to the chemically robust nature of CoP3 (resists dissolution in 6 M HCl) and the presence of [P4]4− polyphosphide anions that may stabilize the catalyst surface during HER.71 Polyphosphides may also protect metal cations from dissolution and the formation of P–H surface bonds can contribute to the reduction process. Some theoretical studies suggest P-rich phosphide HER mechanisms may rely on non-metal surface hydrogen bonds.18,25
After the extended CA experiments, the electrode tips (Cwax with catalyst particles embedded on its surface) were directly examined by XRD, SEM/EDS, and Raman analysis to verify retention of the crystalline CoP3 catalyst. Powder XRD results show that crystalline CoP3 is present on electrode tips of CoP3 and x-CoP3/C composites after extended CA experiments (Fig. S20 and S21, ESI†). SEM images show evidence of particle surface roughening, a decrease in particle aggregation, and some smoother edges on larger CoP3 crystallites (Fig. S22, ESI†). The low CoP3 content catalysts were more difficult to distinguish as some may be embedded in the Cwax surface. The near surface elemental distribution for CoP3 and x-CoP3/C particles on Cwax electrodes before and after CA measurements was examined by EDS mapping. A homogenous distribution of Co and P was observed across the sample and a more intense P signal indicates the survival of phosphorus rich CoP3 structures after the 18 h CA experiments (Fig. S23 and S24, ESI†). In some cases, the carbon intensity increases after CA experiments, which may be due to catalyst loss or catalyst being embedded deeper in the carbon wax. As expected, there are more prominent oxygen surface signals after extended catalysis experiment. Surface oxidation after long term HER electrocatalysis have been frequently observed with electrocatalysts.72,73 Surface phosphates could form in the acidic aqueous environment and estimated surface compositions show slightly lower phosphorus and higher oxygen contents for the post electrocatalysis electrode surfaces (Table S1, ESI†).
Raman spectra were obtained for CoP3 and x-CoP3/C powders on Cwax electrodes before and after CA experiments (Fig. S25 and S26, ESI†). Due to sensitivity issues with the low CoP3 amounts on the Cwax surface for 10-CoP3/C and 5-CoP3/C, only the carbon/graphite peaks were observed for these samples. Similar to the bulk Raman results (Fig. 3), peaks for graphite/disordered carbon and CoP3 are observed before and after extended CA experiments for both CoP3 and 25-CoP3/C on the Cwax electrodes. The CoP3 peak intensities vary relative to the carbon signal but there is no visible increase in P–O vibrations after the CA experiments.
Due their relative ease in synthesis, metal-rich and monophosphides are more frequently examined as earth-abundant HER catalyst alternatives to Pt/C materials. Relatively few phosphorus-rich metal phosphides and composites have been studied for electrocatalytic HER, but some have shown HER activity in 0.5 M H2SO4 similar to a 10% Pt/C catalyst (Table S2, ESI†). A crystalline 3D porous CoP3 nanoneedle array on carbon fiber paper (CFP) was produced by hydrothermal precursor decomposition followed by phosphidation using red phosphorus at elevated temperatures (750 °C) that shows impressive HER activity to produce 10 mA cm−2 current densities at low overpotentials of −126 mV (vs. RHE),40 which is comparable to our free standing CoP3 microparticles. Porous CoP3 concave polyhedrons deposited on carbon fiber paper (CFP) show enhanced HER activity versus CoP3 nanoparticles and produces 10 mA cm−2 current densities at low overpotentials of −78 mV.32 Similarly impressive acidic electrolyte activity and stability was achieved for RhP2 grown on a nanocarbon support.47
These synthetic results described here for x-CoP3/C composites shows the tunability of our solvent-free, direct reactions to deposit varying amounts of phosphorus-rich CoP3 onto carbon black powder surfaces at moderate 500 °C temperatures using less-exotic reactants than typical PH3 based syntheses. The produced x-CoP3/C composites show systematic behavior expected for structures where reduced catalyst loading is balanced with improved catalyst dispersion across the carbon support. This leads to similar ECSA values and slightly reduced catalytic activities for relatively low CoP3 content materials (e.g. 10 mol% CoP3 on carbon black) versus the free standing CoP3 microparticle aggregates. The CoP3 grown in a dispersed fashion on carbon black is more active for HER on a catalyst mass basis, but the crystalline domains of carbon supported CoP3 are only about 20% smaller than those for free standing CoP3. When considering iR corrections to the HER data, the different x-CoP3/C all achieve 10 mA cm−2 current densities near −95 mV (Table 2 and Fig. S15, ESI†). The lower stability of the 10%Pt/C standard versus x-CoP3/C composites is notable, as metals such as platinum deposited on carbon black powders are found to be easily subjected to agglomeration and/or migration of the metal on the carbon surface.69 The electrocatalytic stability of the x-CoP3/C structures suggests a robust connection of the CoP3 crystallites directly grown interspersed with carbon black particles. Other studies have observed benefits from phosphorus-doped carbon supports improving HER activity and stability of a catalyst loaded onto these carbon surfaces, which may be present in the current materials.48,60
Conclusions
A two-step synthetic method involving CoCl2 deposited on carbon black followed by its solid-state reaction with elemental phosphorus vapor, yields a tunable range of CoP3/C composite structures. Several compositions from 5–25 mol% CoP3 were produced and structurally and compositionally characterized. Crystalline aggregates of CoP3 with small ∼35 nm crystallite sizes are homogeneously distributed on the carbon black. All composites showed HER activity near that of CoP3, and they achieved a 10 mA cm−2 current density with a similar applied potential near −95 mV (iR compensated) despite containing much lower CoP3 catalyst content. Their good retention of extended HER activity showed that the composite structures are stable in an acidic electrolyte. This study shows the success in adapting and extending direct MCl2/P reactions that form crystalline metal phosphides to more complex supported materials.33,34,51 This synthetic extension should be applicable different particulate supports and other crystalline metal phosphide catalysts using 3d earth abundant metals. Beyond HER electrocatalysis, CoP3 crystallites or related phosphides distributed on conducting carbon supports may find use in battery electrodes and capacitors,74 or other electrocatalytic transformations such as nitrogen reduction.75Author contributions
Conceptualization and methodology (IL and EG); formal analysis and visualization (IL and EG), investigation (IL and HB), writing and editing (IL and EG); supervision and project administration (EG).Conflicts of interest
There are no conflicts to declare.Acknowledgements
The authors gratefully thank Matthew Lovander for preliminary electrochemical analysis and assistance with carbon-wax electrode designs and gratefully acknowledge funding support from a U.S. National Science Foundation (Division of Chemistry, grant 1954676) and the University of Iowa. H. B. acknowledges a U.S. National Science Foundation grant (1757548) for the summer research experience for undergraduates (REU) program at the University of Iowa. Staff in the UI MatFab (K. Horkley and D. Unruh) and Central Microscopy Research Facility (J. Shao) are thanked for assistance with XRF, Raman spectroscopy and TEM.References
- N. S. Lewis and D. G. Nocera, Proc. Natl. Acad. Sci. U. S. A., 2006, 103, 15729–15735 CrossRef CAS PubMed.
- M. K. Singla, P. Nijhawan and A. S. Oberoi, Environ. Sci. Pollut. Res., 2021, 28, 15607–15626 CrossRef CAS PubMed.
- C. M. Kalamaras and A. M. Efstathiou, Conference Papers in Energy, 2013, 2013, 1–9 CrossRef.
- P. J. Megía, A. J. Vizcaíno, J. A. Calles and A. Carrero, Energy Fuels, 2021, 35, 16403–16415 CrossRef.
- X. Zou and Y. Zhang, Chem. Soc. Rev., 2015, 44, 5148–5180 RSC.
- P. C. Vesborg, B. Seger and I. Chorkendorff, Phys. Chem. Lett., 2015, 6, 951–957 CrossRef CAS PubMed.
- M. G. Walter, E. L. Warren, J. R. McKone, S. W. Boettcher, Q. Mi, E. A. Santori and N. S. Lewis, Chem. Rev., 2010, 110, 6446–6473 CrossRef CAS PubMed.
- S. Y. Tee, K. Y. Win, W. S. Teo, L. D. Koh, S. Liu, C. P. Teng and M. Y. Han, Adv. Sci., 2017, 4, 1600337 CrossRef PubMed.
- Y. L. Zhu, Q. Lin, Y. J. Zhong, H. A. Tahini, Z. P. Shao and H. T. Wang, Energy Environ. Sci., 2020, 13, 3361–3392 RSC.
- I. Roger, M. A. Shipman and M. D. Symes, Nat. Rev. Chem., 2017, 1, 0003 CrossRef CAS.
- M. S. Faber, M. A. Lukowski, Q. Ding, N. S. Kaiser and S. Jin, J. Phys. Chem. C Nanomater. Interfaces, 2014, 118, 21347–21356 CrossRef CAS PubMed.
- X. Chia, A. Y. Eng, A. Ambrosi, S. M. Tan and M. Pumera, Chem. Rev., 2015, 115, 11941–11966 CrossRef CAS PubMed.
- I. Ashraf, S. Rizwan and M. Iqbal, Front. Mater., 2020, 7, 181 CrossRef.
- J. F. Callejas, C. G. Read, C. W. Roske, N. S. Lewis and R. E. Schaak, Chem. Mater., 2016, 28, 6017–6044 CrossRef CAS.
- Z. H. Pu, T. T. Liu, I. S. Amiinu, R. L. Cheng, P. Y. Wang, C. T. Zhang, P. X. Ji, W. H. Hu, J. Liu and S. C. Mu, Adv. Funct. Mater., 2020, 30, 2004009 CrossRef CAS.
- Y. Shi and B. Zhang, Chem. Soc. Rev., 2016, 45, 1529–1541 RSC.
- S. Carenco, D. Portehault, C. Boissiere, N. Mezailles and C. Sanchez, Chem. Rev., 2013, 113, 7981–8065 CrossRef CAS PubMed.
- C. N. Zhang, S. K. Yang and D. W. Rao, Int. J. Hydrog. Energy, 2022, 47, 2992–3000 CrossRef CAS.
- A. R. J. Kucernak and V. N. N. Sundaram, J. Mater. Chem. A, 2014, 2, 17435–17445 RSC.
- W. X. Zhao, X. Q. Ma, G. Z. Wang, X. J. Long, Y. D. Li, W. L. Zhang and P. Zhang, Appl. Surf. Sci., 2018, 445, 167–174 CrossRef CAS.
- A. Watcharapasorn, R. C. Demattei, R. S. Feigelson, T. Caillat, A. Borshchevsky, G. J. Snyder and J. P. Fleurial, Jpn. J. Appl. Phys., 2000, 39, 14–18 CrossRef CAS.
- Y. Du, W. Ma and H. Li, Small, 2020, 16, e1907468 CrossRef PubMed.
- Y. Pan, Y. Lin, Y. J. Chen, Y. Q. Liu and C. G. Liu, J. Mater. Chem. A, 2016, 4, 4745–4754 RSC.
- R. B. Wexler, J. M. P. Martirez and A. M. Rappe, Chem. Mater., 2016, 28, 5365–5372 CrossRef CAS.
- R. B. Wexler, J. M. P. Martirez and A. M. Rappe, ACS Catal., 2017, 7, 7718–7725 CrossRef CAS.
- J. M. Wang, W. R. Yang and J. Q. Liu, J. Mater. Chem. A, 2016, 4, 4686–4690 RSC.
- W. Jeitschko, A. J. Foecker, D. Paschke, M. V. Dewalsky, C. B. H. Evers, B. Kunnen, A. Lang, G. Kotzyba, U. C. Rodewald and M. H. Moller, Z. Anorg. Allg. Chem., 2000, 626, 1112–1120 CrossRef CAS.
- F. A. Shookoh, H. Tavakoli-Anbaran and H. A. R. Aliabad, Compt. Theor. Chem., 2020, 1186, 112902 CrossRef CAS.
- M. Llunell, P. Alemany, S. Alvarez, V. P. Zhukov and A. Vernes, Phys. Rev. B: Condens. Matter Mater. Phys., 1996, 53, 10605–10609 CrossRef CAS PubMed.
- C. H. Lee, H. Kito, H. Ihara, K. Akita, N. Yanase, C. Sekine and I. Shirotani, J. Cryst. Growth, 2004, 263, 358–362 CrossRef CAS.
- K. W. Wang, X. L. She, S. Chen, H. L. Liu, D. H. Li, Y. Wang, H. W. Zhang, D. J. Yang and X. D. Yao, J. Mater. Chem. A, 2018, 6, 5560–5565 RSC.
- T. Wu, M. Pi, X. Wang, D. Zhang and S. Chen, Phys. Chem. Chem. Phys., 2017, 19, 2104–2110 RSC.
- N. Coleman, Jr., M. D. Lovander, J. Leddy and E. G. Gillan, Inorg. Chem., 2019, 58, 5013–5024 CrossRef PubMed.
- I. A. Liyanage, A. V. Flores and E. G. Gillan, Inorg. Chem., 2023, 62, 4947–4959 CrossRef CAS PubMed.
- P. Stelmachowski, J. Duch, D. Sebastián, M. J. Lázaro and A. Kotarba, Materials, 2021, 14, 4984 CrossRef CAS PubMed.
- C. C. Weng, J. T. Ren and Z. Y. Yuan, ChemSusChem, 2020, 13, 3357–3375 CrossRef CAS PubMed.
- J. Wang, Z. Liu, Y. Zheng, L. Cui, W. Yang and J. Liu, J. Mater. Chem. A, 2017, 5, 22913–22932 RSC.
- Y. Holade, C. Morais, K. Servat, T. W. Napporn and K. B. Kokoh, Phys. Chem. Chem. Phys., 2014, 16, 25609–25620 RSC.
- M. H. Suliman, A. Adam, M. N. Siddiqui, Z. H. Yamani and M. Qamar, Catal. Sci. Technol., 2019, 9, 1497–1503 RSC.
- T. L. Wu, M. Y. Pi, D. K. Zhang and S. J. Chen, J. Mater. Chem. A, 2016, 4, 14539–14544 RSC.
- J. Chen, Y. T. Zhang, Z. H. Zhang, D. Y. Hou, F. N. Bai, Y. Han, C. X. Zhang, Y. J. Zhang and J. Hu, J. Mater. Chem. A, 2023, 11, 8540–8572 RSC.
- Y. Tang, S. Zheng, S. Cao, H. Xue and H. Pang, J. Mater. Chem. A, 2020, 8, 18492–18514 RSC.
- A. Parra-Puerto, K. L. Ng, K. Fahy, A. E. Goode, M. P. Ryan and A. Kucernak, ACS Catal., 2019, 9, 11515–11529 CrossRef CAS.
- X. Peng, C. R. Pi, X. M. Zhang, S. Li, K. F. Huo and P. K. Chu, Sustainable Energy Fuels, 2019, 3, 366–381 RSC.
- H. F. Wang, L. Chen, H. Pang, S. Kaskel and Q. Xu, Chem. Soc. Rev., 2020, 49, 1414–1448 RSC.
- J. Jiang, C. D. Wang, J. J. Zhang, W. L. Wang, X. L. Zhou, B. C. Pan, K. B. Tang, J. Zuo and Q. Yang, J. Mater. Chem. A, 2015, 3, 499–503 RSC.
- L. Jin, X. Zhang, W. Zhao, S. Chen, Z. Shi, J. Wang, Y. Xie, F. Liang and C. Zhao, Langmuir, 2019, 35, 9161–9168 CrossRef CAS PubMed.
- Z. Pu, C. Zhang, I. S. Amiinu, W. Li, L. Wu and S. Mu, ACS Appl. Mater. Interfaces, 2017, 9, 16187–16193 CrossRef CAS PubMed.
- Q. Liu, J. Tian, W. Cui, P. Jiang, N. Cheng, A. M. Asiri and X. Sun, Angew. Chem., Int. Ed., 2014, 53, 6710–6714 CrossRef CAS PubMed.
- M. Li, X. T. Liu, Y. P. Xiong, X. J. Bo, Y. F. Zhang, C. Han and L. P. Guo, J. Mater. Chem. A, 2015, 3, 4255–4265 RSC.
- N. Coleman, I. A. Liyanage, M. D. Lovander, J. Leddy and E. G. Gillan, Molecules, 2022, 27, 5053 CrossRef PubMed.
- J. P. Abeysinghe, A. F. Kolln and E. G. Gillan, ACS Mater. Au, 2022, 2, 489–504 CrossRef CAS PubMed.
- C. M. V. B. Almeida and B. F. Giannetti, Electrochem. Commun., 2002, 4, 985–988 CrossRef CAS.
- Z. Chen, H. N. Dinh and E. Miller, Photoelectrochemical Water Splitting: Standards, Experimental Methods, and Protocols, Springer, 2013 Search PubMed.
- S. Anantharaj, S. R. Ede, K. Karthick, S. S. Sankar, K. Sangeetha, P. E. Karthik and S. Kundu, Energy Environ. Sci., 2018, 11, 744–771 RSC.
- K. Ishida and T. Nishizawa, Bull. Alloy Phase Diagr., 1990, 11, 555–560 CrossRef CAS.
- B. M. Barry and E. G. Gillan, Chem. Mater., 2009, 21, 4454–4461 CrossRef CAS.
- J. Wu, C. Jin, Z. Yang, J. Tian and R. Yang, Carbon, 2015, 82, 562–571 CrossRef CAS.
- Z. Liu, F. Peng, H. Wang, H. Yu, W. Zheng and X. Wei, J. Nat. Gas Chem., 2012, 21, 257–264 CrossRef CAS.
- H. Zhang, H. Y. Li, S. Niu, Y. Zhou, Z. T. Ni, Q. W. Wei, A. R. Chen, S. S. Zhang, T. Sun, R. J. Dai, Y. Yang and G. Z. Hu, Cell. Rep. Phys. Sci., 2021, 2, 100586 CrossRef CAS.
- J. Qi, Y. P. Lin, D. Chen, T. Zhou, W. Zhang and R. Cao, Angew. Chem., Int. Ed., 2020, 59, 8917–8921 CrossRef CAS PubMed.
- H. Yoon, A. Xu, G. E. Sterbinsky, D. A. Arena, Z. Wang, P. W. Stephens, Y. S. Meng and K. J. Carroll, Phys. Chem. Chem. Phys., 2015, 17, 1070–1076 RSC.
- B.-A. Liu, H.-L. Zhou, Q.-H. Zhang, M.-X. Xu, S.-H. Ji, L.-L. Zhu, L.-S. Zhang, F.-F. Liu, X. Sun and X.-G. Xu, Chin. Phys. Lett., 2013, 30, 067804 CrossRef.
- P. Wu, T. Wiegand, H. Eckert and M. Gjikaj, J. Solid State Chem., 2012, 194, 212–218 CrossRef CAS.
- L. Gu, Y. Dong, Y. Zhang, B. Wang, Q. Yuan, H. Du and J. Zhao, RSC Adv., 2020, 10, 8709–8716 RSC.
- C. Walter, K. Kummer, D. Vyalikh, V. Bruser, A. Quade and K. D. Weltmann, J. Electrochem. Soc., 2012, 159, F494–F500 CrossRef CAS.
- M. L. Stevenson and G. Pattrick, J. S. Afr. I. Min. Metall., 2017, 117, 989–995 CrossRef CAS.
- A. S. A. Khan, Installation and operation of autosorb-1-C-8 for BET surface area measurement of porous materials, 2010.
- J. Wu, Z. R. Yang, X. W. Li, Q. J. Sun, C. Jin, P. Strasser and R. Z. Yang, J. Mater. Chem. A, 2013, 1, 9889–9896 RSC.
- T. Shinagawa, A. T. Garcia-Esparza and K. Takanabe, Sci. Rep., 2015, 5, 13801 CrossRef PubMed.
- H. G. Von Schnering and W. Hoenle, Chem. Rev., 1988, 88, 243–273 CrossRef CAS.
- F. H. Saadi, A. I. Carim, E. Verlage, J. C. Hemminger, N. S. Lewis and M. P. Soriaga, J. Phys. Chem. C, 2014, 118, 29294–29300 CrossRef CAS.
- E. J. Popczun, C. G. Read, C. W. Roske, N. S. Lewis and R. E. Schaak, Angew. Chem., Int. Ed., 2014, 53, 5427–5430 CrossRef CAS PubMed.
- X. Guo, S. Zheng, Y. Luo and H. Pang, Chem. Eng. J., 2020, 401, 126005 CrossRef CAS.
- Y. Wan, J. Xu and R. Lv, Mater. Today, 2019, 27, 69–90 CrossRef CAS.
Footnote |
| † Electronic supplementary information (ESI) available: Images of electrochemical cell and electrodes, additional product data, images, and summary tables (XRD, SEM, EDS, Raman), and HER electrocatalysis data for x-CoP3/C materials, HER literature comparisons. See DOI: https://doi.org/10.1039/d3ya00295k |
| This journal is © The Royal Society of Chemistry 2023 |