
 Open Access Article
 This Open Access Article is licensed under a
 Creative Commons Attribution 3.0 Unported Licence
Electrowetting limits electrochemical CO2 reduction in carbon-free gas diffusion electrodes†
Lorenz M.
Baumgartner
a,
Andrey
Goryachev
a,
Christel I.
Koopman
a,
David
Franzen
b,
Barbara
Ellendorff
 b,
Thomas
Turek
b and
David A.
Vermaas
*a
b,
Thomas
Turek
b and
David A.
Vermaas
*a
aDepartment of Chemical Engineering, Delft University of Technology, Netherlands. E-mail: D.A.Vermaas@tudelft.nl
bInstitute for Chemical and Electrochemical Process Engineering, Technical University Clausthal, Germany
First published on 28th September 2023
Abstract
CO2 electrolysis might be a key process to utilize intermittent renewable electricity for the sustainable production of hydrocarbon chemicals without relying on fossil fuels. Commonly used carbon-based gas diffusion electrodes (GDEs) enable high Faradaic efficiencies for the desired carbon products at high current densities, but have limited stability. In this study, we explore the adaption of a carbon-free GDE from a Chlor-alkali electrolysis process as a cathode for gas-fed CO2 electrolysis. We determine the impact of electrowetting on the electrochemical performance by analyzing the Faradaic efficiency for CO at industrially relevant current density. The characterization of used GDEs with X-ray photoelectron spectroscopy (XPS) and X-Ray diffraction (XRD) reveals a potential-dependent degradation, which can be explained through chemical polytetrafluorethylene (PTFE) degradation and/or physical erosion of PTFE through the restructuring of the silver surface. Our results further suggest that electrowetting-induced flooding lets the Faradaic efficiency for CO drop below 40% after only 30 min of electrolysis. We conclude that the effect of electrowetting has to be managed more carefully before the investigated carbon-free GDEs can compete with carbon-based GDEs as cathodes for CO2 electrolysis. Further, not only the conductive phase (such as carbon), but also the binder (such as PTFE), should be carefully selected for stable CO2 reduction.
Introduction
Electrochemical CO2 reduction (CO2R) could utilize excess wind and solar power to allow the sustainable production of hydrocarbon chemicals, fuels, or plastics.1,2 If combined with CO2 capture from the atmosphere3,4 or the ocean,5 this process could be independent of fossil feedstocks and contribute to the goal of the Glasgow Climate Pact to limit the increase in global temperature to 1.5 °C.6Captured CO2 can be converted electrochemically with a CO2 electrolyzer. Depending on the catalyst employed at the cathode, CO2R can yield a range of chemical products (Ag: CO; Sn: HCOOH; Cu: C2H4). Despite suitable catalysts being available, CO2R can still suffer from poor Faradaic efficiency due to mass transfer limitations. If the supply of CO2 to the catalyst cannot match the applied current density, the competing hydrogen evolution reaction (HER) takes place.7 While the production of CO on Ag has the highest maturity among the different CO2R routes, the process for CO production still has to be further optimized to meet a number of key industrial criteria:8
•Current density, j: −200 to −500 mA cm−2
•Faradaic efficiency, FECO: >95%
•Catalyst activity: 100 A g−1
•Stability: >10![[thin space (1/6-em)]](https://www.rsc.org/images/entities/char_2009.gif) 000 h
000 h
High jCO2R has become feasible through the introduction of gas diffusion electrodes (GDEs). By avoiding mass transfer limitations imposed by the limited solubility and diffusivity of CO2 in aqueous electrolytes,9–11 GDEs suppress the unwanted HER and allow high FE for C1 products12–14 and C2 products.15–17 Typically, GDEs for CO2R consist of a catalyst layer (CL), coated on top of a gas diffusion layer (GDL). The CL provides a reaction interface, at which gaseous reactants get in contact with the catalyst surface and the electrolyte. Catalysts are typically employed in the form of nanoparticles18 with typical loadings of 1 mg cm−2,19 which allows specific catalyst activities of >200 A g−1. The GDL is typically treated with polytetrafluoroethylene (PTFE) to prevent electrolyte intrusion and ensure free pore space for gas transport. The majority of studies utilizes commercial, carbon-based GDL materials adapted from hydrogen fuel cell research.20,21
While the first three criteria for industrial application are within reach with current materials, only a limited long-term stability has been reported for carbon-based GDEs. CO2 electrolyzers with membrane electrode assembly (MEA) have achieved jCO2R values of ≥−200 mA cm−2 and FECO ≥90% for up to 1000 h (Table 1).14 More commonly, however, much shorter lifetimes than this are reported because insufficient hydration management leads to rapid electrode drying22 or carbonate salt formation in the gas channels.23–25 Even shorter lifetimes have been reported for CO2 electrolyzers with a catholyte buffer (Table 1). Similar problems with GDE stability are also known from fuel cell applications, in which carbon and PTFE can degrade significantly after 100 h of operation at target current densities, which leads to a loss of hydrophobicity. In turn, the pore network of the GDL becomes more flooded with liquid, which reduces the performance by inhibiting the gas transport.26
| Process | Gas diffusion electrode | j (mA cm−2) | T (°C) | Electrolyte | Lifetime (h) |
|---|---|---|---|---|---|
| Carbon-based GDEs: direct electrolyte contact | |||||
| CO2R: CO | Ag + Nafion/ELAT LT1400 W cloth29 | −185 | 20 | 1 M KHCO3 | >120 |
| CO2R: CO | Ag + Nafion/SGL 39BC30 | −190 | 20 | 1 M KHCO3 | ≤20 |
| CO2R: HCOOH | Sn + carbon + PTFE/SGL 35BC31 | −200 | 20 | 1 M KHCO3 | >5 |
| CO2R: C2H4 | Cu/Freudenberg (unspecified)16 | −320 | 20 | 7 M KOH | <1 |
| CO2R: CO | Ag/Freudenberg H23C632 | −196 | 20 | 1 M KOH | <0.25 |
| Carbon-based GDEs: membrane electrode assembly (MEA) | |||||
| CO2R: CO | Ag + Sustainion/SGL 35BC14 | −200 | 20 | 10 mM KHCO3 | >1000 |
| CO2R: CO | Ag + Nafion/carbon felt22 | −100 | 20 | 1 M NaOH | <2 |
| Oxygen depolarized cathodes (ODCs): direct electrolyte contact | |||||
| ORR | Ag + carbon + PTFE/Ag mesh33 | −300 | 80 | 32 wt% NaOH | >28800 |
| CO2R: CO | Ag + PTFE/Ag mesh (Covestro)34 | −300 | 30 | 0.4 M K2SO4 + 1.5 M KHCO3 | >1200 |
| CO2R: CO | Ag + PTFE/Ag mesh (Covestro)35 | −150 | 20 | 0.4 M K2SO4 | >840 |
The lifetime of carbon-based GDEs in CO2 electrolyzers depends on the chemical stability of the GDL substrate. As chemical degradation reduces the hydrophobicity of the pore network, electrolyte breakthrough occurs at lower differential pressure between liquid and gas phase,36 which limits the flow-by regime in scaled-up electrolyzers.29 The reported lifetime of carbon-based GDEs differs between materials types (Table 1). Nonwoven GDLs from Freudenberg exhibit especially short lifetimes of less than 1 h (Table 1).16,30,32 Yang et al. demonstrated the flooding of a Freudenberg GDL started when the cathode potential was set below −0.65 V vs. RHE. X-ray photoelectron spectroscopy (XPS) measurements indicated a degradation of the CFS, which showed a reduction of C–F bonds and an increase in oxygen content.37 In contrast, carbon papers manufactured by SGL seem to be more stable (Table 1). For example, we recently demonstrated the operation of a SGL carbon paper at –190 mA cm−2 for 20 h until flooding occurred. Post-electrolysis characterization revealed that the static contact angle of the CFS had dropped from initially 149° to 128° after electrolysis.30 A woven carbon cloth from ELAT showed a very promising performance, as it was stable for at least 120 h and allowed more than 50% FECO despite flooding (Table 1).29
The adoption of oxygen depolarized cathodes (ODC) for the CO2R process might help avoid the limitations of carbon-based GDLs altogether.38 ODCs are silver-containing GDEs, which have been employed in industrial chlor-alkali electrolysis for many years. Typically, they consist of a current collector mesh with a porous layer of Ag and PTFE, which allows O2 transfer to reaction zone. There, the oxygen reduction reaction (ORR) is carried out at 80–90 °C with 30–35 wt% NaOH electrolytes.39–41 ODCs have been shown to be stable for ten thousands of hours in these harsh chemical conditions (Table 1).33 Early ODCs used carbon particles as a catalyst support, which limited their long-term stability (>10000 h) because carbon is susceptible to degradation.39,40
Modern ODCs have a carbon-free composition to enable a higher long-term stability.39 For example, the commercial, carbon-free ODC from Covestro consists of Ag particles (92–98 wt%) and PTFE (2–8 wt%) on a Ag mesh support.27,28 Unfortunately, the GDE from Covestro is proprietary, which means that limited public characterization data is available.27,28 In our previous work, we developed our own carbon-free ODC, which has been optimized for ORR,42,43 and characterized it with advanced imaging techniques (e.g., X-ray tomography, operando X-ray radiography).44,45
As silver is a common catalyst for CO2R, carbon-free ODCs that only use silver as the electrically conductive medium could be an interesting alternative to commonly used carbon-based GDEs. So far, only a limited number of publications has investigated the application of these carbon-free GDEs for CO2R. For example, the commercial ODC from Covestro has been successfully employed for up to 1200 h in CO2 electrolyzers with flowing catholyte (Table 1).34,35 The performance of these electrodes is limited by CO2 mass transfer at higher j, as FECO falls below 80% beyond current densities of −300 mA cm−2.46 Studying the carbon-free GDEs developed in our previous work,42,43 Hoffmann et al. used operando synchrotron imaging to reveal the detrimental effect of electrolyte intrusion into the pore network of the GDE on the CO2 mass transfer to the catalyst. This previous study shows that the electrolyte intrusion into the cathode, or flooding, depends on the applied potential and the PTFE content. They achieved the highest current density of −300 mA cm−2 at a PTFE content of 3 wt% (97 wt% Ag) when testing for ≤50 min.47
The flooding of the GDE with electrolyte is detrimental to the CO2 performance because the intruding electrolyte lowers the effective diffusivity of the pore network by displacing the gas phase.48 At open circuit potential, the flooding resistance of GDEs depends on material properties, such as the pore structure or wettability. For example, high flooding resistance can be achieved with small, hydrophobic pores.48 This can be achieved by the addition of PTFE, which decreases the average pore diameter by filling gaps between the silver particles in the GDE.42,43 Further, the addition of PTFE increases the contact angle, which increases the hydrophobicity of the internal pore walls.42,43
GDE flooding also depends on the electrowetting effect,44,45,49 which describes the physical phenomenon of surfaces becoming more hydrophilic when an electrical potential is applied. This has important implications for the flooding behavior of porous GDEs because the internal contact angles of the pore network are reduced as the electrode is charged during electrolysis. Under these conditions, the electrolyte can infiltrate the pore network and hinder gas diffusion.45,47
In this work, we study the CO2R performance of carbon-free GDEs by assessing the chemical stability and analyzing the Faradaic efficiency for CO at industrially relevant current density (−200 mA cm−2). We conducted experiments with a carbon-free GDE (97 wt% Ag, 3 wt% PTFE) and a typical carbon-based GDE made with a SGL 39BC substrate to allow a direct comparison between these two electrodes types. We assess the impact of electrowetting on the CO2R performance of carbon-free GDEs. In addition, the used electrodes were characterized with XPS and X-ray diffraction (XRD) to measure changes to the chemical composition. Based on these assessments, we discuss the feasibility of adopting carbon-free GDEs for CO2 electrolysis.
Experimental methods
The electrode preparation, physical characterization, and electrochemical experiments are described in more detail in the ESI.†Electrode preparation
The liquid breakthrough pressure (at open circuit potential) was measured by placing the sample in a transparent flow cell and pumping water into the liquid compartment (Fig. S1, ESI†). By closing off the liquid outlet, water was forced to break through the porous sample. We recorded the differential pressure at which the first droplet appeared on the gas side (Fig. S3, ESI†).
The convective mass transfer was analyzed by studying the CO2 permeability. After installing the sample in a flow cell, we passed CO2 through the material at different flow rates and measured the pressure drop (Fig. S4, ESI†). By plotting the flow rate against the pressure drop, we derived the permeability constant from the slope according to Darcy's law.52
The diffusive mass transfer was evaluated by determining the limiting overall O2 mass transfer coefficient. We use this metric as a proxy for the CO2 mass transfer coefficient.30 The GDE was placed in a flow cell with 6 M KOH in the liquid compartment. We flowed air through the gas compartment and measured the gas pressure (Fig. S5, ESI†). We carried out a linear sweep voltammetry (LSV) scan for the ORR. The value of KO2 was derived from the plateau current density (Fig. S6, ESI†).
Scanning electron microscopy (SEM) was carried out with a JSM-6010LA microscope (JEOL, Japan) at an acceleration voltage of 5 kV. The images were recorded with a secondary electron imaging (SEI) and a back-scattered electron composition (BEC) detector.
X-ray diffraction (XRD) patterns were obtained using a Bruker D8 Advance diffractometer equipped with a Co anode (λ(Kα) = 1.7889 Å, 35 kV, 40 mA) and a Lynxeye position-sensitive detector. The diffractograms were acquired in the Bragg–Brentano geometry with a step size of 0.02° and an acquisition time of 4 s. A motorised varied-divergent slit (V6) and constant rotation of the holder (30 RPM) were applied. The diffractograms were processed in DiffracSuite.EVA (v.5.1) software. The Scherrer equation was used to evaluate changes to the crystallite size.53
X-ray photoelectron spectroscopy (XPS) measurements were carried out on a K-Alpha XPS spectrometer (Thermo Scientific), equipped with a small-spot (400 μm) monochromatic X-ray source (Al Kα = 1486.6 eV). Core level spectra were recorded with a pass energy of 50 eV. Low energy Ar+ ions were used to compensate surface charging. CasaXPS software was used for data processing. The spectra were normalized on the C 1s binding energy (BE) of the adventitious carbon (284.8 eV). XPS depth profiles were recorded on the same spectrometer. Ar+ sputtering was done at 3 kV with time steps of 60 s.
 | ||
| Fig. 1 Process flow diagram for CO2 electrolysis setup. The backpressure of the electrolyte stream was controlled (PC) before it was mixed with the purge gas and recirculated. The differential pressure, Δp, across the GDE was measured between the catholyte and gas compartment (ΔPR). The Faradaic efficiency was determined by recording the product gas flow rate (FR) with a mass flow meter (MFM) and analyzing the gas composition by gas chromatography (GC). | ||
The cathode potential was recorded with an Ag/AgCl micro-reference electrode and corrected for the ohmic resistance of the electrolyte. The full cell potentials are measured as well, but are relatively high (2–8 V) due to the thick electrolyte (22 mm) channel. Because the reference electrode was placed close to the cathode, the cathode potential is insensitive to the cell configuration. Hence, unless indicated otherwise, all reported potentials are cathode potentials, given in the reversible hydrogen electrode (RHE) scale. All recorded process parameters, such as cell potentials, pressures, or GC data, are listed in the accompanying excel file of the ESI.†
Results & discussion
The prepared GDE samples were characterized and their CO2 reduction performance assessed with galvanostatic measurements. The chemical stability of the GDEs was assessed by additional characterization after the electrolysis experiments. Supplementary results and the numerical values of all plotted data are included in the ESI.†Electrode characterization
The carbon-free GDE consists of the sintered Ag-PTFE composite forming a uniform layer around the current collector mesh (Fig. S12, ESI†).43 Both sides of the GDE exhibit a static contact angle of θ = 141° at open circuit (Fig. 2). The material is more hydrophobic compared to a flat silver surface (θAg = 95°)54 because of the 3 wt% PTFE binder (θPTFE = 122°).55 In addition, the sintered GDE has a rough surface which allows gas pockets to enhance the contact angle according to the Cassie–Baxter model.50 An overview of all measured contact angles is given in Table S2 (ESI†).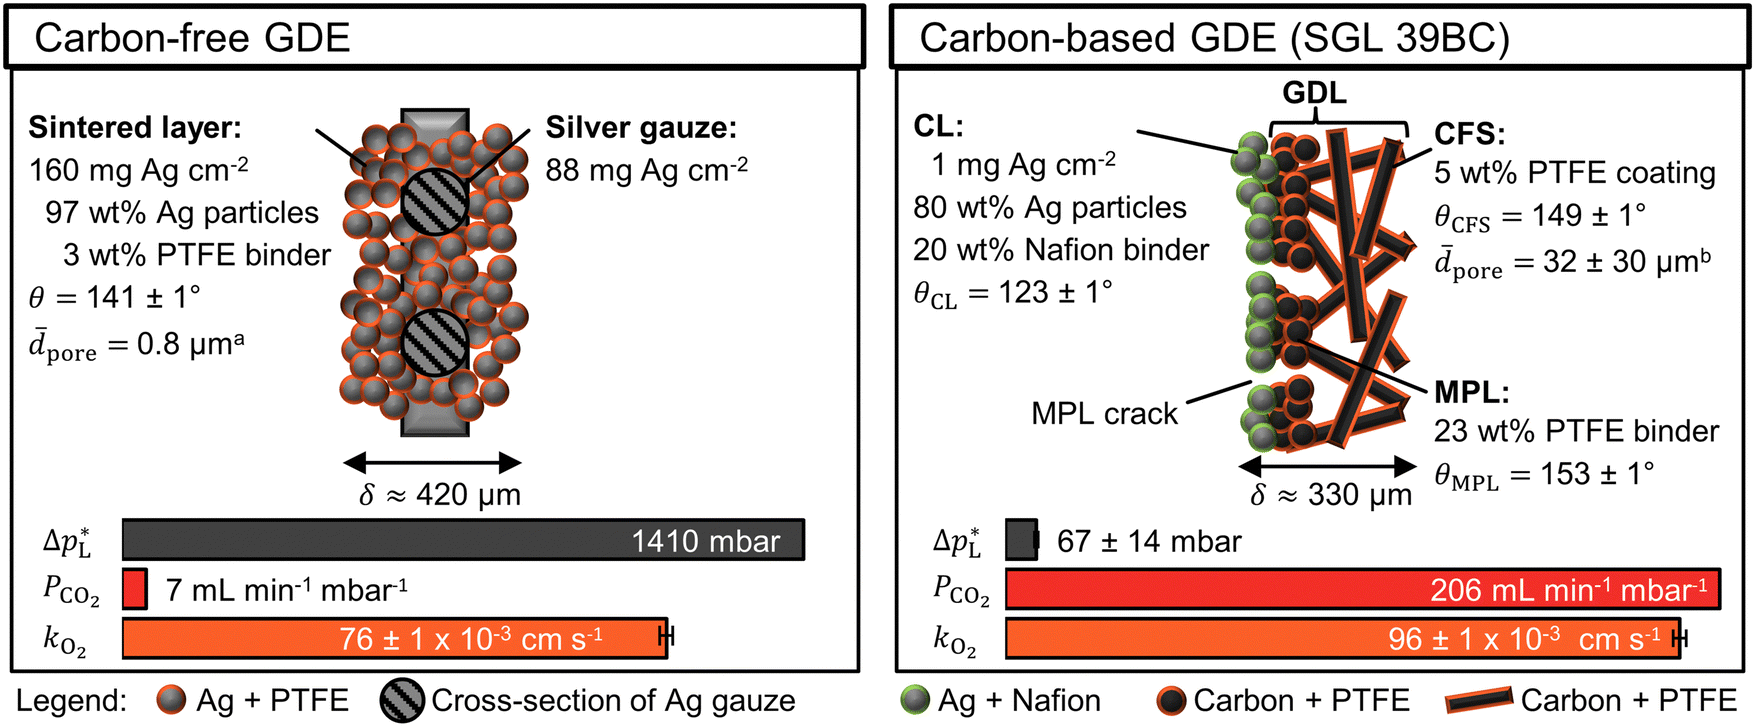 | ||
Fig. 2 Physical properties of carbon-free GDE and carbon-based GDE (GDL: SGL 39BC carbon paper). The static contact angle, θ, ± its standard error were calculated from five or more measurements. aThe average pore diameter, ![[d with combining macron]](https://www.rsc.org/images/entities/i_char_0064_0304.gif) pore, was obtained from Franzen et al.43 for the carbon-free GDE. bThe pore of the SGL 39 BC's carbon fiber substrate (CFS) was obtained from Parikh et al.57 The total thickness of the GDE is δ. The liquid breakthrough pressure is pore, was obtained from Franzen et al.43 for the carbon-free GDE. bThe pore of the SGL 39 BC's carbon fiber substrate (CFS) was obtained from Parikh et al.57 The total thickness of the GDE is δ. The liquid breakthrough pressure is  The CO2 permeability constant is PCO2 The limiting overall O2 mass transfer coefficient is, kO2, (proxy for CO2 mass transfer). Its error bars indicate the standard deviation of the limiting currents. More detailed characterization data are available in the ESI.† The CO2 permeability constant is PCO2 The limiting overall O2 mass transfer coefficient is, kO2, (proxy for CO2 mass transfer). Its error bars indicate the standard deviation of the limiting currents. More detailed characterization data are available in the ESI.† | ||
The carbon-based GDE is made up of the catalyst layer (CL), which is coated on top of the GDL (Fig. 2). The GDL has two components: the microporous layer (MPL) and the carbon fiber substrate (CFS). The MPL consists of carbon black and PTFE particles, which give it a high contact angle (θMPL = 153°). The CFS is comprised of graphitized carbon fibers, which have been impregnated with PTFE (θCFS = 149°). We note that our static contact angles have a mostly qualitative meaning as they do not capture the effects of contact angle hysteresis on rough surfaces or the internal contact angle,56 which are critical to quantify the flooding behavior of the pore network.
The carbon-free GDE has a more than 20× higher liquid breakthrough pressure at open circuit,  than the carbon-based GDE (Fig. 2: 1410 vs. 67 mbar). This high resistance against liquid intrusion is due to the unimodal pore structure with a small average diameter of pore = 0.8 μm,43 In contrast, the carbon-based GDL exhibits a much lower
  . As the MPL commonly features large cracks due to the manufacturing process (Fig. S14, ESI†), this layers adds little flooding resistance despite the high θMPL and small pore size.30,36 Instead,
  is mostly determined by the properties of the CFS, whose pores are much larger (32 μm)57 and consequently exhibit a much lower capillary pressure.
The high  of the carbon-free GDE is very promising for scale-up because it determines how well the GDE could maintain the separation of gas and liquid phase at a large scale. For illustration, a
  of 1.4 bar corresponds to resisting the hydrostatic pressure of an aqueous electrolyte in a 14 m tall cell, which is an order of magnitude larger than the height of commercial cells for alkaline electrolysis (1–2 m)58 or chlor-alkali electrolysis (1–1.5 m).59,60 However, the flooding resistance also has to be assessed under operating conditions because electrowetting can reduce the hydrophobicity and thereby decrease
  29,36
29,36
The mass transfer between the gas bulk and the reaction zone can occur through convection and/or diffusion. The carbon-free GDE has a 30× smaller capacity for convective mass transfer compared to the carbon-based GDE, which is quantified with the CO2 permeability constant, PCO2 (Fig. 2: 7 vs. 206 mL min−1 mbar−1). According to the Hagen–Poiseuille equation (FG,pore ∝ dpore4), the flow rate through a pore scales with the fourth power of the diameter. We can therefore expect the carbon-free GDE's small pores to result in a lower PCO2. In contrast, the carbon-based GDE has relatively large CFS pores and large cracks allowing a large portion of the gas flow to bypass the small pores of the MPL. As proposed in a previous study, we can expect diffusion to be the dominating mass transfer mechanism in the flow-by regime.30 For this reason, the lower PCO2 of the carbon-free GDE should not hamper the CO2 reduction performance significantly.
The carbon-free GDE has a 20% lower capacity for diffusive mass transfer, KO2 (Fig. 2: 76 vs. 96 × 10−3 cm s−1). We quantified this capacity with the limiting overall O2 mass transfer coefficient, kO2, which serves as a proxy for the experimentally less accessible limiting CO2 mass transfer coefficient.30 The lower diffusive mass transport for the carbon-free GDE is explained by its higher thickness and smaller pore size, which lead to a longer, more tortuous diffusion pathway compared to its carbon-based counterpart. It may be beneficial to reduce the thickness of the GDE by using a thinner current collector gauze and depositing fewer layers of silver and PTFE.
The silver loading of the carbon-free GDE is almost 250× higher compared to the carbon-based GDE (Fig. 2: 248 mg Ag cm−2vs.1 mg Ag cm−2). As silver is a relatively expensive metal, we can expect this higher loading to increase the capital expenditure of the electrode significantly. Therefore, we test the CO2R performance to assess if the carbon-free GDE the higher material costs with a higher productivity and/or lifetime.
CO2 electrolysis: electrowetting inhibits performance
The carbon-free GDE has a similar CO2 reduction performance at −100 mA cm−2 as the carbon-based GDE (Fig. 3). At −200 mA cm−2 its FECO becomes significantly lower compared to the carbon-based GDE (35% vs. 86%). Based on the relative diffusivities of the characterization results, we would expect the carbon-free GDE to achieve a proportionally lower FECO of 69%. Because this is not the case, however, we hypothesize that the additional performance drop is caused by the observed electrolyte flooding. Flooding fills empty pores with liquid and decreases the effective diffusivity of the porous GDE. As a consequence, the CO2 mass transfer falls below the supply of electrons, so that the HER takes place instead of the CO2R. The cathode potential, ECath, probably becomes more negative compared to the carbon-based GDE because evolving hydrogen gas bubbles increase the ohmic resistance (−1.4 V compared to −1.7 V vs. RHE). We can further investigate this inferior performance by comparing the short-term stability. | ||
| Fig. 3 CO2 reduction performance in flow-by regime at steady state: the Faradaic efficiency, FE, for CO or H2 is plotted as a function of current density on the left y-axis. The error bars represent the estimated standard errors. The cathode potential, ECath, against the reversible hydrogen electrode (RHE) is plotted on the right y-axis. The potential was corrected for the ohmic potential drop between the reference electrode and the cathode. (a) Carbon-free GDE: each data point represents an average calculated from two GC injections. Flooding occurred after 10 min at −200 mA cm−2. The two injections were taken 30 min later. (b) Carbon-based GDE: each data point is based on three GC injections. The data is taken from a previous publication.29 | ||
The carbon-free GDE does not allow stable CO2R at −200 mA cm−2 and has a much lower FECO compared to the carbon-based GDE (Fig. 4a and c). First droplets of electrolyte appear on the gas side of the GDE 10 min after the current density is applied and the cathode potential drops below −1.3 V. This suggests that the initially high flooding resistance is lost due to electrowetting. As the run proceeds, the FECO declines steadily while the electrolyte droplets increase in size and start to dry out. After a run time of 40 min, (bi)carbonate salts start forming on the surface of the GDE (Fig. S15, ESI†).
 | ||
| Fig. 4 Faradaic efficiency for CO, FECO, as a function of run time after starting the potentiostat. The iR-compensated cathode potential, ECath, against the reversible hydrogen electrode (RHE) is plotted on the right y-axis. Every data point represents a single GC injection. The error bars represent the estimated standard error. (a) Carbon-free GDE at −200 mA cm−2. (b) Carbon-free GDE at −50 mA cm−2. (c) Carbon-based GDE (GDL: SGL 39BC) at −200 mA cm−2.29 | ||
We carried out another electrolysis run with the carbon-free GDE at −50 mA cm−2 in an attempt to mitigate the electrowetting-induced flooding with a less negative cathode potential (Fig. 4b). FECO declines more slowly as the initial ECath is less negative compared to the −200 mA cm−2 run (−1.0 V compared to −1.3 V). This slower flooding is in agreement with X-ray imaging studies, which report that the speed of electrolyte intrusion is potential-dependent.45,49 Ultimately, however, the CO2R performance is also not stable at −1.0 V because the flooding leads to salt formation on the gas side.
Our results (Fig. 4) raise the question why electrowetting leads to a more detrimental flooding for the carbon-free than for the carbon-based GDE. Electrowetting spreads an electrolyte more strongly on bare, conductive surfaces (e.g., silver, carbon) than on surfaces that are covered with a dielectric insulator (e.g., PTFE).45,61 We hypothesize that the carbon-based GDE's higher PTFE content (MPL: 23 wt%, CFS: 5 wt%) covers bare carbon surfaces more effectively, which leads to a stronger insulation against electrowetting. In contrast, the PTFE in the carbon-free GDE has a lower concentration (3 wt%) and is distributed heterogeneously throughout the pore network.44,45 This structure probably allows the electrolyte to transition from a non-wetting Cassie–Baxter state to a wetting Wenzel state, when the potential is decreased sufficiently.61,62 This means that the electrolyte does not rest on the dispersed PTFE, but spreads along the bare silver surfaces through electrowetting.45
Electrowetting leads to a poor performance for CO2R with the carbon-free GDE (Fig. 4). This is interesting because electrowetting and electrolyte breakthrough also occur during ORR, but they do not seem to have such a detrimental effect for this reaction.42,49 We hypothesize that the flooding due to electrowetting is stronger for the CO2R because this reaction requires more negative cathode potentials compared to the ORR (Fig. 5). Therefore, the electrolyte saturates the pore network to a higher extent and the supply of CO2 is severely limited.
 | ||
| Fig. 5 Linear sweep voltammetry scans comparing CO2R and ORR on a carbon-based GDE with a Ag loading of 1 mg cm−2 on the basis of a SGL 39BC GDL. The current density is plotted as a function of the cathode potential, ECath. The potential was corrected for the ohmic potential drop between the reference electrode and the cathode. The experiments were conducted at 20 °C with a scan rate of 20 mV s−1. The CO2R experiment was carried out in 1 M KHCO3 (pH = 7.5) with a CO2 gas feed. The equilibrium potential, E0, was obtained from Jouny et al.63 The ORR experiment used 6 M KOH (pH = 14.8) and an air gas feed. The E0 was obtained from Mousallem et al.39 | ||
The poor CO2R performance of our carbon-free GDEs (3 wt% PTFE) suggests that a different manufacturing approach is required to mitigate the effect of electrowetting and ensure high gas diffusivity under operating conditions. While increasing the PTFE content further, for example to 8 wt% PTFE, significantly reduces the intrusion of electrolyte,47 this is not a viable strategy because the additional PTFE also prevents the wetting of catalyst sites and reduces the amount of open pore space available for gas diffusion.43 Perhaps this problem could be solved by43,47 fabricating the GDE from two layers with varying PTFE content. The (I) reaction layer should have a relatively low PTFE content (≤3 wt%) and would provide a large wetted catalyst surface for the CO2R reaction. The (II) diffusion layer should have a relatively high PTFE content (≥6 wt%) to make it more resilient against electrowetting and ensure the transport of CO2 from the gas bulk to the reaction layer. Perhaps it is also possible to selectively increase the PTFE content of the GDE's gas-facing side by introducing an additional PTFE coating step to the manufacturing process.
Post electrolysis characterization: PTFE degradation occurs at high overpotential
In addition to reversible electrowetting, the GDE can also experience a permanent loss of hydrophobicity through chemical reactions, which also has a negative impact on performance and is detrimental to the long-term stability. After CO2 electrolysis, we rinsed the electrodes with water to remove carbonate salts. We then measured the static contact angle and analyzed chemical changes with SEM, XPS, and XRD.The XPS analysis of the GDE surface shows no clear change in Ag oxidation state (Fig. S20, ESI†), in line with the applied cathodic potentials. The XRD diffractograms of fresh and used GDEs show a single cubic phase of Ag0 with no variation of crystalline parameters (Fig. S17, ESI†). These results indicate that the surface did not oxidize and that the crystallite size of Ag particles did not change by CO2R.
However, elemental contrast imaging with SEM/BEC suggests that the amount of surface PTFE was reduced by the electrolysis at −200 mA cm−2 (Fig. 6). Particularly, the silver backbone of a fresh GDE was covered with finely dispersed PTFE particles, in contrast to the large silver clusters emerged at the surface of the spent sample. The morphology change of spent GDEs was also reflected in a significant reduction of θ (Fig. 6: 111° vs. 141°), which is in line with the observed removal of hydrophobic PTFE domains from the electrode surface. We hypothesize that the removal of PTFE is caused by chemical degradation and/or physical erosion due to restructuring of the silver surface.
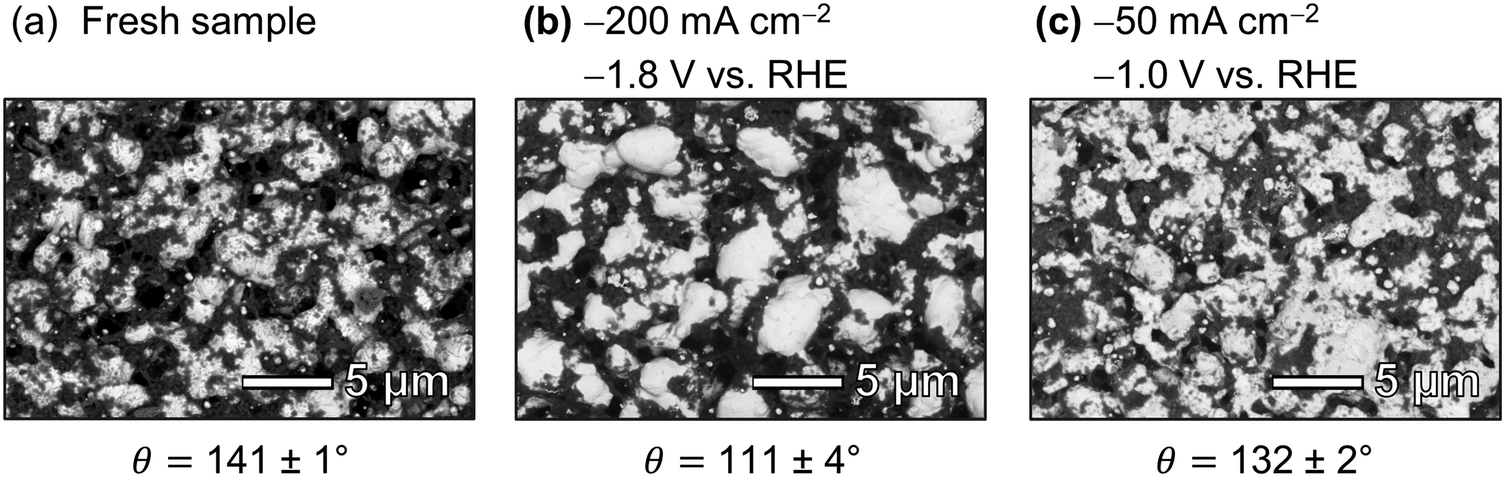 | ||
| Fig. 6 SEM images and static contact angle, θ, of carbon-free GDEs: elemental contrast images were recorded with the BEC detector of the SEM (Light grey domains: Ag, dark grey domains: PTFE). The average θ ± the standard error were determined with the sessile drop method. (a) Fresh GDE sample. (b) After electrolysis at −200 mA cm−2 for 84 min with an initial cathode potential of −1.8 V vs. RHE (potential stabilized at −1.4 V vs. RHE). Additional SEM images are available in Fig. S18 (ESI†). | ||
The XPS survey reveals that the loss of hydrophobicity is accompanied by a change in surface chemistry. The electrolysis reduced the fluorine concentration from 58 at% vs. 40 at%, while the carbon concentration increased from 36 at% vs. 49 at% (Table 2). Further, the chemical state of carbon changes as the fraction of C–R bonds increases at the cost of C–F bonds (Table 2). These results support the hypothesis that PTFE undergoes reductive electrochemical degradation. According to Shapoval et al.,64 this mechanism takes place below the cathode potential threshold of −1.3 V (Fig. S23, ESI†). In its course, fluoride is eliminated from the PTFE polymer chain64 and carbonaceous decomposition products are left behind.64,65
| Sample | (a) Fresh sample | (b) −200 mA cm−2 −1.8 V vs. RHE | (c) −50 mA cm−2 −1.0 V vs. RHE |
|---|---|---|---|
| Elemental surface composition | |||
| F | 58 at% | 40 at% | 51 at% |
| C | 36 at% | 49 at% | 35 at% |
| Ag | 4 at% | 4 at% | 6 at% |
| O | 1 at% | 6 at% | 4 at% |
| Relative fraction of carbon bonds | |||
| CF2/C–X | 84% | 45% | 76% |
| COx/C–X | 4% | 7% | 4% |
| CR/C–X | 13% | 48% | 20% |
The slight increase in the atomic concentration of oxygen and the fraction of COx bonds (Table 2) is probably caused by residual potassium (bi-)carbonate salts. The presence of these salts was confirmed by the small amount of potassium in the XPS signal of the used sample (Table S6 and Fig. S21, ESI†).
XPS depth profile analysis shows a uniform reduction of 14 at% in fluorine content along the surface profiled after electrolysis (Fig. 7a). As a consequence, the relative concentration of Ag increases by an average of 11 at% along the depth profile. The relative carbon content increases only slightly by 4 at% along the profile (Fig. 7c). These findings agree with the hypothesis that electrochemical degradation eliminates fluoride from the PTFE polymer chain and leaves behind carbonaceous degradation products.64,65
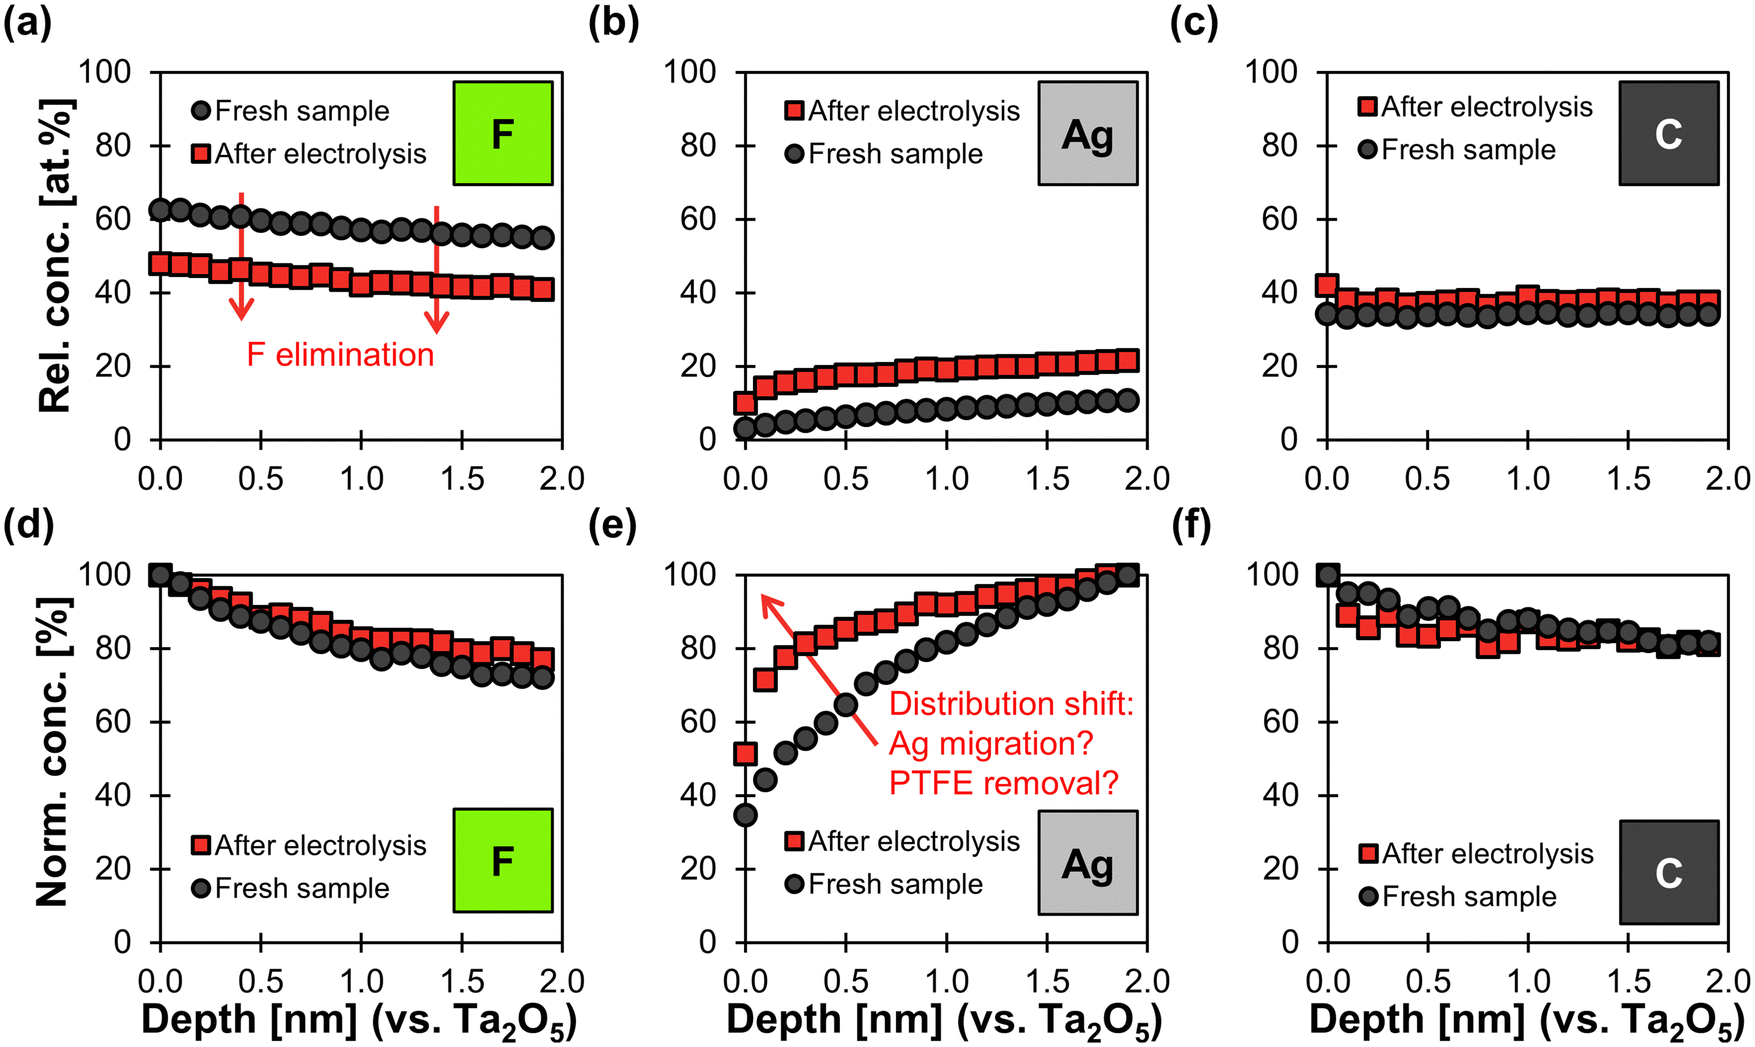 | ||
| Fig. 7 XPS depth profiles of fresh carbon-free GDE and spent sample after electrolysis. Electrolysis was performed at −200 mA cm−2 for 84 min with an initial cathode potential of −1.8 V vs. RHE (stabilized at −1.4 V vs. RHE). The x-axis shows the depth profile calibrated against a Ta2O5 standard sputtered with Ar+ ions. (a)–(c): the y-axis shows the relative atomic concentrations of F, Ag, and C (other elements were not considered in this analysis mode). This means that the three elements together make up 100 at% in this plot. (d)–(f): The y-axis shows the normalized concentrations for each elements along the profile. This means that the depth with the highest atomic concentration along the profile determines the 100% value in the normalized concentration plot. | ||
In addition, the normalized Ag distribution of the used sample is shifted towards the surface (Fig. 7e), which might be due to the migration of Ag and/or the removal of PTFE close to the top surface. This phenomenon could be explained by a potential-induced restructuring of the Ag surface,27,65 which might cause the PTFE to loose adhesion and fall off. Such a restructuring would be in agreement with the smoother Ag surfaces observed in the SEM images (Fig. 6). We can therefore conclude that physical erosion of PTFE due to Ag restructuring probably takes place in parallel to chemical degradation.
The carbon-free GDE that was operated at −50 mA cm−2 and a cathode potential of −1.0 V also underwent chemical changes. The XPS analysis shows that the surface concentration of fluorine is lower than for the fresh sample (Table 2: 58 at% vs. 51 at%). The fraction of CF2 bonds drops from 84% to 76% (Table 2). These changes to the surface chemistry are accompanied by a reduction of θ from 141 ± 1° to 132 ± 2° compared to the fresh sample (Fig. 6). However, the SEM images suggest that the silver matrix remains covered with dispersed PTFE (Fig. 6). The XPS depth profiles vary little compared to a fresh sample (Fig. S22, ESI†). These results show that the degradation of the GDE is less significant at −1.0 V (−50 mA cm−2) compared to the GDE that operating at −1.8 V (−200 mA cm−2).
It is noteworthy that the degradation of PTFE also seems to take place below the reported potential threshold of −1.3 V vs. RHE.64 A possible explanation for this inconsistency might be that the difference in solvent affects the elimination of fluoride from the polymer chain. Shapoval et al.64 studied PTFE degradation in anhydrous DMF, while our electrolyte was aqueous KHCO3. Other interesting questions for future study are how fast the degradation occurs over time and if the mechanism only depends on the cathode potential or also on the total charge passed through the GDE.
Our carbon-free GDEs underwent chemical degradation after less than 1.5 h of CO2 electrolysis. Long-term CO2 electrolysis was successfully performed for more than 1200 h by Haas et al. with the carbon-free GDEs from Covestro.34 These electrodes were characterized after electrolysis, which revealed a restructuring of the silver surface. Further, Raman microscopy showed a shift in signal from PTFE to carbon,27 which is probably a sign of PTFE degradation at the surface. This example suggests that carbon-free GDEs can tolerate some chemical degradation during long-term CO2 electrolysis. A possible explanation for this tolerance might be that the removal and degradation of PTFE occurs primarily close to the surface while leaving the internal pores less affected. Nonetheless, it is critical that the sintered silver backbone retains its morphology and pore size to ensure stable long-term operation.
The investigated carbon-free GDEs are not a feasible cathode for CO2 electrolysis. We can expect carbon-free GDEs to require higher capital expenditure because the substitution of carbon with silver increases the loading by two orders of magnitude (e.g.Fig. 2 carbon-free: 248 mg Ag cm−2vs. carbon-based: 1 mg Ag cm−2). To recover these additional costs, carbon-free GDEs require a higher productivity and/or lifetime compared to carbon-based GDEs. At a j of −200 mA cm−2, the finely dispersed Ag catalyst in carbon-based GDEs achieves a specific productivity of 200 A g−1. This already satisfies the productivity criterion of 100 A g−1 proposed by Masel et al.8 In contrast, our carbon-free GDEs only reach a silver catalyst productivity of 1 A g−1 at the same j. To make matters worse, our carbon-free GDEs achieved a FECO 40% due to the effects of electrowetting.34,46
Conclusion
We have investigated the adoption of a carbon-free GDE for electrochemical CO2 reduction (CO2R), which was originally developed for the oxygen reduction reaction (ORR) in the chlor-alkali process. The GDE experienced a poor FECO (≤40%) at cathode potentials beyond −1.0 V vs. RHE (−50 mA cm−2) due to physical electrowetting. Electrowetting reduces the hydrophobicity of the porous GDE, which blocks gas diffusion paths by electrolyte flooding and (bi)carbonate salt formation. Exposing the GDE to potentials of −1.8 V vs. RHE (−200 mA cm−2) for <90 min resulted in a partial degradation and removal of PTFE from the GDE. This might suggest that a poor chemical stability limits the long-term stability of these electrodes, but it was not possible to deconvolute the effect of degradation from the effect of electrowetting on the FECO. Compared with commonly used carbon-based GDEs, the investigated carbon-free GDE exhibit a worse production rate of CO and did not allow steady state operation. We conclude that the effect of electrowetting has to managed more carefully before the investigated carbon-free GDE can compete with carbon-based GDEs as cathode for CO2 electrolysis.Conflicts of interest
There are no conflicts to declare.Acknowledgements
The authors are grateful for the engineering support provided by Christiaan Schinkel, Stefan ten Hagen, Duco Bosma, and Bart Boshuizen. This research received funding from the Netherlands Organization for Scientific Research (NWO) under project number 733.000.008 in the framework of the Solar to Products programme co-funded by Shell Global Solutions International B.V. David Franzen, Barbara Ellendorff and Thomas Turek acknowledge financial support by the German Research Foundation (DFG) in the framework of the research unit “Multi-scale analysis of complex three-phase systems: oxygen and CO2 reduction” (FOR 2397, grant number 276655287).References
- P. De Luna, C. Hahn, D. Higgins, S. A. Jaffer, T. F. Jaramillo and E. H. Sargent, What Would It Take for Renewably Powered Electrosynthesis to Displace Petrochemical Processes?, Science, 2019, 364(6438), eaav3506 CrossRef CAS PubMed.
- M. G. Kibria, J. P. Edwards, C. M. Gabardo, C.-T. Dinh, A. Seifitokaldani, D. Sinton and E. H. Sargent, Electrochemical CO2 Reduction into Chemical Feedstocks: From Mechanistic Electrocatalysis Models to System Design, Adv. Mater., 2019, 31(31), 1807166 CrossRef PubMed.
- D. W. Keith, G. Holmes, D. S. Angelo and K. Heidel, A Process for Capturing CO2 from the Atmosphere, Joule, 2018, 2(8), 1573–1594 CrossRef CAS.
- W. A. Smith, T. Burdyny, D. A. Vermaas and H. Geerlings, Pathways to Industrial-Scale Fuel out of Thin Air from CO2 Electrolysis, Joule, 2019, 3(8), 1822–1834 CrossRef CAS.
- R. Sharifian, R. M. Wagterveld, I. A. Digdaya, C. Xiang and D. A. Vermaas, Electrochemical Carbon Dioxide Capture to Close the Carbon Cycle, Energy Environ. Sci., 2021, 14(2), 781–814 RSC.
- G. Hammond and M. Newborough, Glasgow Climate Pact: A Step on the Way Towards a Lower Carbon Dioxide World, Proc. - Inst. Civ. Eng., 2022, 175(1), 8–8 Search PubMed.
- Y. Y. Birdja, E. Pérez-Gallent, M. C. Figueiredo, A. J. Göttle, F. Calle-Vallejo and M. T. M. Koper, Advances and Challenges in Understanding the Electrocatalytic Conversion of Carbon Dioxide to Fuels, Nat. Energy, 2019, 4(9), 732–745 CrossRef CAS.
- R. I. Masel, Z. Liu, H. Yang, J. J. Kaczur, D. Carrillo, S. Ren, D. Salvatore and C. P. Berlinguette, An Industrial Perspective on Catalysts for Low-Temperature CO2 Electrolysis, Nat. Nanotechnol., 2021, 118–128 CrossRef CAS PubMed.
- D. Higgins, C. Hahn, C. Xiang, T. F. Jaramillo and A. Z. Weber, Gas-Diffusion Electrodes for Carbon Dioxide Reduction: A New Paradigm, ACS Energy Lett., 2019, 4(1), 317–324 CrossRef CAS.
- D. M. Weekes, D. A. Salvatore, A. Reyes, A. Huang and C. P. Berlinguette, Electrolytic Co2 Reduction in a Flow Cell, Acc. Chem. Res., 2018, 51(4), 910–918 CrossRef CAS PubMed.
- E. W. Lees, B. A. W. Mowbray, F. G. L. Parlane and C. P. Berlinguette, Gas Diffusion Electrodes and Membranes for CO2 Reduction Electrolysers, Nat. Rev. Mater., 2022, 7(1), 55–64 CrossRef CAS.
- Y. Chen, A. Vise, W. E. Klein, F. C. Cetinbas, D. J. Myers, W. A. Smith, T. G. Deutsch and K. C. Neyerlin, A Robust, Scalable Platform for the Electrochemical Conversion of CO2 to Formate: Identifying Pathways to Higher Energy Efficiencies, ACS Energy Lett., 2020, 5(6), 1825–1833 CrossRef CAS.
- B. Endrődi, E. Kecsenovity, A. Samu, T. Halmágyi, S. Rojas-Carbonell, L. Wang, Y. Yan and C. Janáky, High Carbonate Ion Conductance of a Robust Piperion Membrane Allows Industrial Current Density and Conversion in a Zero-Gap Carbon Dioxide Electrolyzer Cell, Energy Environ. Sci., 2020, 4098–4105 RSC.
- R. B. Kutz, Q. Chen, H. Yang, S. D. Sajjad, Z. Liu and I. R. Masel, Sustainion Imidazolium-Functionalized Polymers for Carbon Dioxide Electrolysis, Energy Technol., 2017, 5(6), 929–936 CrossRef CAS.
- F. P. G. De Arquer, C.-T. Dinh, A. Ozden, J. Wicks, C. McCallum, A. R. Kirmani, D.-H. Nam, C. Gabardo, A. Seifitokaldani and X. Wang, CO2 Electrolysis to Multicarbon Products at Activities Greater Than 1 A cm−2, Science, 2020, 367(6478), 661–666 CrossRef PubMed.
- C.-T. Dinh, T. Burdyny, M. G. Kibria, A. Seifitokaldani, C. M. Gabardo, F. P. García de Arquer, A. Kiani, J. P. Edwards, P. De Luna, O. S. Bushuyev, C. Zou, R. Quintero-Bermudez, Y. Pang, D. Sinton and E. H. Sargent, CO2 Electroreduction to Ethylene Via Hydroxide-Mediated Copper Catalysis at an Abrupt Interface, Science, 2018, 360(6390), 783 CrossRef CAS PubMed.
- H. Yang, J. J. Kaczur, S. D. Sajjad and R. I. Masel, Electrochemical Conversion of CO2 to Formic Acid Utilizing Sustainion™ Membranes, J. CO2 Utilizat., 2017, 20, 208–217 CrossRef CAS.
- H. R. M. Jhong, F. R. Brushett and P. J. Kenis, The Effects of Catalyst Layer Deposition Methodology on Electrode Performance, Adv. Energy Mater., 2013, 3(5), 589–599 CrossRef CAS.
- B. Endrődi, G. Bencsik, F. Darvas, R. Jones, K. Rajeshwar and C. Janáky, Continuous-Flow Electroreduction of Carbon Dioxide, Prog. Energy Combust. Sci., 2017, 62, 133–154 CrossRef.
- S. Park, J.-W. Lee and B. N. Popov, A Review of Gas Diffusion Layer in PEM Fuel Cells: Materials and Designs, Int. J. Hydrogen Energy, 2012, 37(7), 5850–5865 CrossRef CAS.
- A. El-kharouf, T. J. Mason, D. J. L. Brett and B. G. Pollet, Ex-Situ Characterisation of Gas Diffusion Layers for Proton Exchange Membrane Fuel Cells, J. Power Sources, 2012, 218, 393–404 CrossRef CAS.
- D. A. Salvatore, D. M. Weekes, J. He, K. E. Dettelbach, Y. C. Li, T. E. Mallouk and C. P. Berlinguette, Electrolysis of Gaseous CO2 to CO in a Flow Cell with a Bipolar Membrane, ACS Energy Lett., 2017, 3(1), 149–154 CrossRef.
- B. De Mot, M. Ramdin, J. Hereijgers, T. J. Vlugt and T. Breugelmans, Direct Water Injection in Catholyte-Free Zero-Gap Carbon Dioxide Electrolyzers, ChemElectroChem, 2020, 7(18), 3839–3843 CrossRef CAS.
- B. Endrődi, E. Kecsenovity, A. Samu, F. Darvas, R. V. Jones, V. Török, A. Danyi and C. Janáky, Multilayer Electrolyzer Stack Converts Carbon Dioxide to Gas Products at High Pressure with High Efficiency, ACS Energy Lett., 2019, 4(7), 1770–1777 CrossRef PubMed.
- B. Endrődi, A. Samu, E. Kecsenovity, T. Halmágyi, D. Sebők and C. Janáky, Operando Cathode Activation with Alkali Metal Cations for High Current Density Operation of Water-Fed Zero-Gap Carbon Dioxide Electrolysers, Nat. Energy, 2021, 6(4), 439–448 CrossRef PubMed.
- J. Park, H. Oh, T. Ha, Y. I. Lee and K. Min, A Review of the Gas Diffusion Layer in Proton Exchange Membrane Fuel Cells: Durability and Degradation, Appl. Energy, 2015, 155, 866–880 CrossRef CAS.
- S. Jovanovic, R. Krause, A. Lüken, J. Ackermann, S. Merz, P. Jakes, R.-A. Eichel and J. Granwehr, Post-Test Raman Investigation of Silver Based Gas Diffusion Electrodes, J. Electrochem. Soc., 2020, 167(8), 086505 CrossRef CAS.
- T. Turek, I. Moussallem, A. Bulan, N. Schmitz and P. Weuta, Oxygen-Consuming Electrode with Multilayer Catalyst Coating and Process for the Production Thereof, US pat. Search PubMed , US9243337B2, 2016.
- L. M. Baumgartner, C. I. Koopman, A. Forner-Cuenca and D. A. Vermaas, When Flooding Is Not Catastrophic – Woven Gas Diffusion Electrodes Enable Stable CO2 Electrolysis, ACS Appl. Energy Mater., 2022, 5, 15125–15135 CrossRef CAS PubMed.
- L. M. Baumgartner, C. I. Koopman, A. Forner-Cuenca and D. A. Vermaas, Narrow Pressure Stability Window of Gas Diffusion Electrodes Limits the Scale-up of CO2 Electrolyzers, ACS Sustainable Chem. Eng., 2022, 10(14), 4683–4693 CrossRef CAS PubMed.
- D. Kopljar, A. Inan, P. Vindayer, N. Wagner and E. Klemm, Electrochemical Reduction of CO2 to Formate at High Current Density Using Gas Diffusion Electrodes, J. Appl. Electrochem., 2014, 44(10), 1107–1116 CrossRef CAS.
- M. E. Leonard, L. E. Clarke, A. Forner-Cuenca, S. M. Brown and F. R. Brushett, Investigating Electrode Flooding in a Flowing Electrolyte, Gas-Fed Carbon Dioxide Electrolyzer, ChemSusChem, 2019, 13(2), 400–411 CrossRef PubMed.
- N. Furuya and H. Aikawa, Comparative Study of Oxygen Cathodes Loaded with Ag and Pt Catalysts in Chlor-Alkali Membrane Cells, Electrochim. Acta, 2000, 45(25), 4251–4256 CrossRef CAS.
- T. Haas, R. Krause, R. Weber, M. Demler and G. Schmid, Technical Photosynthesis Involving Co2 Electrolysis and Fermentation, Nat. Catal., 2018, 1(1), 32–39 CrossRef CAS.
- P. Jeanty, C. Scherer, E. Magori, K. Wiesner-Fleischer, O. Hinrichsen and M. Fleischer, Upscaling and Continuous Operation of Electrochemical CO2 to CO Conversion in Aqueous Solutions on Silver Gas Diffusion Electrodes, J. CO2 Utilizat., 2018, 24, 454–462 CrossRef CAS.
- B. De Mot, J. Hereijgers, M. Duarte and T. Breugelmans, Influence of Flow and Pressure Distribution inside a Gas Diffusion Electrode on the Performance of a Flow-by CO2 Electrolyzer, Chem. Eng. J., 2019, 378, 122224 CrossRef CAS.
- K. Yang, R. Kas, W. A. Smith and T. Burdyny, Role of the Carbon-Based Gas Diffusion Layer on Flooding in a Gas Diffusion Electrode Cell for Electrochemical CO2 Reduction, ACS Energy Lett., 2021, 6(1), 33–40 CrossRef CAS.
- S. Hernandez-Aldave and E. Andreoli, Oxygen Depolarised Cathode as a Learning Platform for CO2 Gas Diffusion Electrodes, Catalysis Science & Technology, 2022 Search PubMed.
- I. Moussallem, J. Jörissen, U. Kunz, S. Pinnow and T. Turek, Chlor-Alkali Electrolysis with Oxygen Depolarized Cathodes: History, Present Status and Future Prospects, J. Appl. Electrochem., 2008, 38(9), 1177–1194 CrossRef CAS.
- T. Morimoto, K. Suzuki, T. Matsubara and N. Yoshida, Oxygen Reduction Electrode in Brine Electrolysis, Electrochim. Acta, 2000, 45(25), 4257–4262 CrossRef CAS.
- M. Sugiyama, K. Saiki, A. Sakata, H. Aikawa and N. Furuya, Accelerated Degradation Testing of Gas Diffusion Electrodes for the Chlor-Alkali Process, J. Appl. Electrochem., 2003, 33(10), 929–932 CrossRef CAS.
- I. Moussallem, S. Pinnow, N. Wagner and T. Turek, Development of High-Performance Silver-Based Gas-Diffusion Electrodes for Chlor-Alkali Electrolysis with Oxygen Depolarized Cathodes, Chem. Eng. Process., 2012, 52, 125–131 CrossRef CAS.
- D. Franzen, B. Ellendorff, M. C. Paulisch, A. Hilger, M. Osenberg, I. Manke and T. Turek, Influence of Binder Content in Silver-Based Gas Diffusion Electrodes on Pore System and Electrochemical Performance, J. Appl. Electrochem., 2019, 49(7), 705–713 CrossRef CAS.
- M. C. Paulisch, M. Gebhard, D. Franzen, A. Hilger, M. Osenberg, S. Marathe, C. Rau, B. Ellendorff, T. Turek, C. Roth and I. Manke, Operando Synchrotron Imaging of Electrolyte Distribution in Silver-Based Gas Diffusion Electrodes During Oxygen Reduction Reaction in Highly Alkaline Media, ACS Appl. Energy Mater., 2021, 4(8), 7497–7503 CrossRef CAS.
- F. Bienen, M. C. Paulisch, T. Mager, J. Osiewacz, M. Nazari, M. Osenberg, B. Ellendorff, T. Turek, U. Nieken and I. Manke, Investigating the Electrowetting of Silver-Based Gas-Diffusion Electrodes During Oxygen Reduction Reaction with Electrochemical and Optical Methods, Electrochem. Sci. Adv., 2022, e2100158 Search PubMed.
- M. Löffelholz, J. Osiewacz, A. Lüken, K. Perrey, A. Bulan and T. Turek, Modeling Electrochemical CO2 Reduction at Silver Gas Diffusion Electrodes Using a TFFA Approach, Chem. Eng. J., 2022, 435, 134920 CrossRef.
- H. Hoffmann, M. C. Paulisch, M. Gebhard, J. Osiewacz, M. Kutter, A. Hilger, T. Arlt, N. Kardjilov, B. Ellendorff, F. Beckmann, H. Markötter, M. Luik, T. Turek, I. Manke and C. Roth, Development of a Modular Operando Cell for X-Ray Imaging of Strongly Absorbing Silver-Based Gas Diffusion Electrodes, J. Electrochem. Soc., 2022, 169(4), 044508 CrossRef CAS.
- A. Z. Weber, Improved Modeling and Understanding of Diffusion-Media Wettability on Polymer-Electrolyte-Fuel-Cell Performance, J. Power Sources, 2010, 195(16), 5292–5304 CrossRef CAS.
- M. C. Paulisch, M. Gebhard, D. Franzen, A. Hilger, M. Osenberg, N. Kardjilov, B. Ellendorff, T. Turek, C. Roth and I. Manke, Operando Laboratory X-Ray Imaging of Silver-Based Gas Diffusion Electrodes During Oxygen Reduction Reaction in Highly Alkaline Media, Materials, 2019, 12(17), 2686 CrossRef CAS PubMed.
- D. Quéré, Rough Ideas on Wetting, Phys. A, 2002, 313(1–2), 32–46 CrossRef.
- C. A. Schneider, W. S. Rasband and K. W. Eliceiri, Nih Image to ImageJ: 25 Years of Image Analysis, Nat. Methods, 2012, 9(7), 671–675 CrossRef CAS PubMed.
- Z. Zeng and R. Grigg, A Criterion for Non-Darcy Flow in Porous Media, Transp. Porous Media, 2006, 63(1), 57–69 CrossRef CAS.
- F. T. L. Muniz, M. A. R. Miranda, C. Morilla dos Santos and J. M. Sasaki, The Scherrer Equation and the Dynamical Theory of X-Ray Diffraction, Acta Crystallogr., Sect. A: Found. Crystallogr., 2016, 72(3), 385–390 CrossRef CAS PubMed.
- F. Bartell and P. H. Cardwell, Reproducible Contact Angles on Reproducible Metal Surfaces. I. Contact Angles of Water against Silver and Gold1, J. Am. Chem. Soc., 1942, 64(3), 494–497 CrossRef CAS.
- C. W. Extrand and Y. Kumagai, An Experimental Study of Contact Angle Hysteresis, J. Colloid Interface Sci., 1997, 191(2), 378–383 CrossRef CAS PubMed.
- D. L. Wood, C. Rulison and R. L. Borup, Surface Properties of Pemfc Gas Diffusion Layers, J. Electrochem. Soc., 2010, 157(2), B195 CrossRef CAS.
- N. Parikh, J. Allen and R. Yassar, Microstructure of Gas Diffusion Layers for PEM Fuel Cells, Fuel Cells, 2012, 12(3), 382–390 CrossRef CAS.
- M. Lehner, R. Tichler, H. Steinmüller and M. Koppe, Power-to-Gas: Technology and Business Models, Springer, 2014 Search PubMed.
- G. Faita and F. Federico, Electrolysis Cell with Gas Diffusion Electrode, US 7670472 B2, 2010 Search PubMed.
- N. Chavan, S. Pinnow, G. Polcyn and T. Turek, Non-Isothermal Model for an Industrial Chlor-Alkali Cell with Oxygen-Depolarized Cathode, J. Appl. Electrochem., 2015, 45, 899–912 CrossRef CAS.
- M. Li, M. N. Idros, Y. Wu, T. Burdyny, S. Garg, X. S. Zhao, G. Wang and T. E. Rufford, The Role of Electrode Wettability in Electrochemical Reduction of Carbon Dioxide, J. Mater. Chem. A, 2021, 9, 19369–19409 RSC.
- E. D. Laird, R. K. Bose, H. Qi, K. K. S. Lau and C. Y. Li, Electric Field-Induced, Reversible Lotus-to-Rose Transition in Nanohybrid Shish Kebab Paper with Hierarchical Roughness, ACS Appl. Mater. Interfaces, 2013, 5(22), 12089–12098 CrossRef CAS PubMed.
- M. Jouny, W. Luc and F. Jiao, General Techno-Economic Analysis of CO2 Electrolysis Systems, Ind. Eng. Chem. Res., 2018, 57(6), 2165–2177 CrossRef CAS.
- G. Shapoval, A. Tomilov, A. Pud and V. Vonsyatskii, Electrochemical Reductive Destruction of Polytetrafluoroethylene, Theor. Exp. Chem., 1984, 20(2), 234–236 CrossRef.
- N. Wagner, M. Schulze and E. Gülzow, Long Term Investigations of Silver Cathodes for Alkaline Fuel Cells, J. Power Sources, 2004, 127(1), 264–272 CrossRef CAS.
Footnote |
| † Electronic supplementary information (ESI) available: Accompanying.pdf file: detailed experimental procedures, technical documentation of the electrolysis setup, additional characterization data. Accompanying excel file: numerical values for all results and figures, characterization raw data, and all recorded process parameters for CO2 electrolysis experiments. See DOI: https://doi.org/10.1039/d3ya00285c |
| This journal is © The Royal Society of Chemistry 2023 |