DOI:
10.1039/D3YA00160A
(Paper)
Energy Adv., 2023,
2, 1051-1063
Photocatalytic activity and pH-induced morphological changes of ZnO/CuO nanocomposites prepared by chemical bath precipitation†
Received
13th April 2023
, Accepted 14th June 2023
First published on 14th June 2023
Abstract
This study presents the morphological and photocatalytic properties of ZnO/CuO nanocomposites as a function of pH. The samples were synthesized through a facile chemical bath precipitation method within a wide range of pH from 1.5 to 11. The effect of the synthesis pH on the formation and structural evolution of the nanocomposites was studied in detail using X-ray diffraction (XRD), field emission scanning microscopy (FESEM), high-resolution transmission electron microscopy (HRTEM), and high-resolution X-ray photoelectron spectroscopy (HRXPS). The Brunauer–Emmett–Teller (BET) method and diffuse reflectance spectroscopy (DRS) showed the changes in the pore size volume and the band gap of the nanocomposites as a function of pH. According to the results, by increasing pH and changing the morphology, a significant enhancement in the recombination rate and the lifetime of photogenerated electrons and holes is achieved. The effect of pH-dependent synthesis on the photocatalytic activity of the as-prepared nanocomposites was investigated for the degradation of MB under visible-light irradiation. The diversity in morphologies of the nanocomposites provides different active facets for exposure to the light and therefore different degradation efficiency. A notable improvement in photocatalytic activity was evaluated for the sample prepared at pH = 10. Eventually, different scavengers were used to examine the effectiveness of photo-generated electrons, holes, hydroxyl and superoxide radicals on the photodegradation of MB under visible light.
1. Introduction
During recent decades, with the increase in population and growth of industrial development, the absorption of toxic contaminants has been raised and become an ecological threat.1,2 Hence, the importance of water treatment and elimination of residual dyes from wastewater streams has received much attention.3 Among the possible solutions for resolving this issue, photocatalysis under visible-light illumination by utilizing semiconductor materials is highly suggested.4 Photocatalysis is light absorption to the surface of a semiconductor that generates electrons and holes through the electronic transition from the valence band (VB) to the conduction band (CB). These charge carriers transfer to the surface and produce reactive oxygen species and play an effective role in the degradation of water organic contaminants.5–7
Among different types of semiconductors employed to achieve a significant photo response in photocatalytic water treatment, ZnO has been attracting interest due to its outstanding characteristics such as room temperature photoluminescence, high photosensitivity, high electron mobility, non-toxicity, and cost-efficiency in fabrication.8–10 Moreover, ZnO crystalizes in various morphologies which provides a variety of functional behaviors for wide use in multiple applications.11 However, the band gap of ZnO (Eg = 3.4 eV) is wide, resulting in a narrow photo response to only ultraviolet (UV) light, restricting exploitation of the complete range of solar energy which is a limiting characteristic in this semiconductor.12,13
To control this limitation, coupling ZnO with a p-type semiconductor has been carried out.14 It has been reported that the formation of a p–n junction between n-type and p-type semiconductors inhibits a fast recombination rate of electrons and holes by the charge transfer from the n-type semiconductor to the p-type which leads to more photocatalysis efficiency.15 Similarly, CuO is a p-type semiconductor with a favorable band gap of 1.2 eV for photocatalytic applications that restricts the high recombination rate of photogenerated electrons and holes of ZnO.16–18
Several facile and cost-efficient synthesis methods such as hydrothermal,19 solvothermal,20,21 sol–gel,22 and co-precipitation23 have been reported for fabricating ZnO/CuO composites with the desired morphologies. Of all the methods, the homogeneous low temperature (below 100 °C) precipitation process is a promising method for synthesizing nanocrystalline metal oxides in light of its capability to better control particle size and shapes.14,24 Having control over the size and shape in this method provides the ability to fabricate nanostructures with higher surface area and eventually, higher photocatalytic activity.25 Studies reported that a small change in the synthesis parameters, such as pH, temperature, and concentration of the precursors, can effectively result in a variety of morphologies, and ultimately increases the adsorption capacity and dye degradation.26–29 Singh et al.30 synthesized the ZnO nanostructures using a co-precipitation technique from pH 5.5 to 13. They reported that the photocatalytic activity of samples increases with an increase in synthesis pH. In a similar study,31 they showed that the ZnO synthesized in alkaline media has higher photocatalytic activity than the one in acidic media. Nonetheless, the effect of the synthesis pH on the morphology and photocatalytic performance of the nanocomposite of ZnO/CuO is yet to be investigated.
Hence, we attempt to find the most effective pH for the synthesis of ZnO/CuO nanocomposites using ammonia and nitric acid to achieve suitable degradation in MB dye. In this work, a facile and low-cost chemical bath precipitation (CBD) method is employed for the fabrication of ZnO/CuO nanocomposites, and structural and optical investigations are carried out to investigate the role of synthesis pH. To study the influence of holes and hydroxyl radicals on the photodegradation performance of the obtained nanocomposites various scavengers were used. Therefore, the ideal nanostructure contains suitable active sites for reinforcing the charge carrier's separation and light-harvesting to be used in wastewater systems.
2. Experimental
2.1. Materials
Zinc nitrate hexahydrate (ZNH, Zn(NO3)2·6H2O) as a Zn precursor, copper nitrate trihydrate (CN, Cu(NO3)2·3H2O) as a Cu precursor, hexamethylenetetramine (HMTA, C6H12N4 as a pH buffer, and ammonia (NH4OH) and nitric acid (HNO3) for pH adjustment were all purchased from Merck KGaA and were used without any further purification. Deionized water (DI, 18.2 MΩ) was the solvent in the synthesis of the ZnO/CuO nanocomposites.
2.2. Preparation of ZnO/CuO nanocomposites
20 mM of zinc nitrate hexahydrate, 2 mM of copper nitrate trihydrate, and 20 mM of hexamethylenetetramine were dissolved separately in DI water. Then, the solutions were added to a bigger beaker and the final solution volume was 100 mL. The above-mentioned solution was put in a water bath and stirred for 3 h at 90 °C. During 3 h of synthesis at the mentioned temperature, the precipitate formed. The fabricated powder was dried at 60 °C on a hot plate in an ambient atmosphere. For pH adjustment, ammonia and nitric acid were added to the obtained solution. The initial pH of the samples was measured and reported in Table 1. The selected molar ratio and pH values were optimized according to our previous study.32,33 Also, the weight percentages of Zn and Cu were determined from the EDS spectra of the samples in Fig. S2 (ESI†), given in Table 1.
Table 1 Experimental parameters and quantitative data from EDS measurements of the ZnO/CuO nanocomposite samples
| Sample |
ZC1.5 |
ZC3.5 |
ZC6.8 |
ZC10 |
ZC11 |
| pH |
1.5 |
3.5 |
6.8 |
10 |
11 |
| Ammonia conc. (M) |
— |
— |
— |
0.2 |
0.8 |
| Nitric acid conc. (mM) |
40 |
20 |
— |
— |
— |
| Zn (wt%) |
16.33 |
45.44 |
72.16 |
65.84 |
80.91 |
| Cu (wt%) |
26.67 |
17.54 |
9.14 |
7.9 |
— |
2.3. Characterization techniques
The morphological properties and crystalline structure of the ZnO/CuO nanocomposites were studied using the X-ray diffraction method (XRD, Philips with Cu Kα radiation, λ = 1.54 Å) and a field emission scanning electron microscope (FESEM, MIRA3 TESCAN) equipped with energy dispersive X-ray (EDS, JEOL Centurio) operated at 15 kV. The microstructure and crystallographic features of the sample were investigated using a high-resolution transmission electron microscope (HRTEM, FEI Tecnai G2 F20 Super Twin) with an acceleration voltage of 200 kV. High-resolution X-ray photoelectron spectroscopy (HRXPS) measurements with monochromatic Al-Kα (1486.6 eV) radiation were recorded using an ESCA+ spectrometer (Scienta Omicron, Germany) for studying the surface chemistry of the synthesized materials and chemical states of elements. To evaluate the specific surface areas (SSA) and pore structure of the ZnO/CuO nanocomposite, Brunauer–Emmett–Teller (BET) analysis was carried out using a BELSORP Mini II instrument with nitrogen (N2) adsorption at 77 K. To eliminate the impurities, the samples were degassed for 6 h at 493 K before analysis. The absorption spectra and the photo-generated charge transfer of the prepared ZnO/CuO nanocomposite were investigated by diffused reflectance spectroscopy (DRS, Shimadzu, MPC-2200) and photoluminescence spectroscopy (PL, Varian Cary Eclipse fluorescence spectrophotometer), respectively.
2.4. Photocatalytic measurements
The photocatalytic performance of the as-prepared powders was evaluated by monitoring the photodegradation of methylene blue (MB) under the irradiation of visible light which was produced using a 150 W lamp (OSRAM, Germany) with a 420 nm cut-off filter located at 30 cm above the solution. First, 15 mg of the synthesized ZnO/CuO sample was dispersed into the 30 mL of 2 ppm MB solution and stirred in the dark for 30 min at room temperature for the absorption and desorption equilibrium between the dye molecules and photocatalysts. To specify the concentration of MB, 2 mL of the solution was extracted every 30 minutes and evaluated using a UV-Vis Unico 2100 spectrophotometer at the maximum peak of the MB spectrum (664 nm). To considerably investigate further the photocatalytic activity of the photocatalysts, the role of four radical scavengers has been studied in the process of photocatalytic degradation of MB dye. The main reactive species (holes and radicals) were identified using methanol (MeOH), disodium ethylenediaminetetraacetate (EDTA), p-benzoquinone (BQ), and cupric nitrate (Cu(NO3)2). Furthermore, the photocatalytic performance of the photocatalysts was examined toward both cationic and anionic dyes. Correspondingly, methylene orange (MO) and rhodamine B (RhB) solutions were used as representative examples of anionic and cationic organic dyes, respectively, under similar conditions to the ones employed for the MB solution.
3. Results and discussion
3.1. Structure and morphology
Fig. 1(a)–(f) show the XRD patterns and FESEM images of the ZnO/CuO nanocomposite samples synthesized at different pH values. According to JCPDS No. 36-1451, the main three peaks of ZnO are located at 31.8°, 34.4°, and 36.3°; however, none of them were found in the ZC1.5 sample. This indicates that nanostructures of ZnO did not form at the pH that the ZC1.5 sample was produced. This conclusion is also supported by the FESEM image of the ZC1.5 sample in Fig. 1b, showing that unlike the other samples synthesized at higher pH values, no distinguished morphology (i.e., nanorod, nanourchin, flower-like, etc.) was found in this sample. The corresponding EDS maps (Fig. S3, ESI†) also depict a uniform distribution of Cu and Zn throughout the sample. Moreover, the same scenario is true for CuO. Neither of the main peaks of CuO (located at 35.5° and 38.8°, based on JCPDS No. 48-1548) were observed and no specific morphology of CuO was detected in the FESEM image.
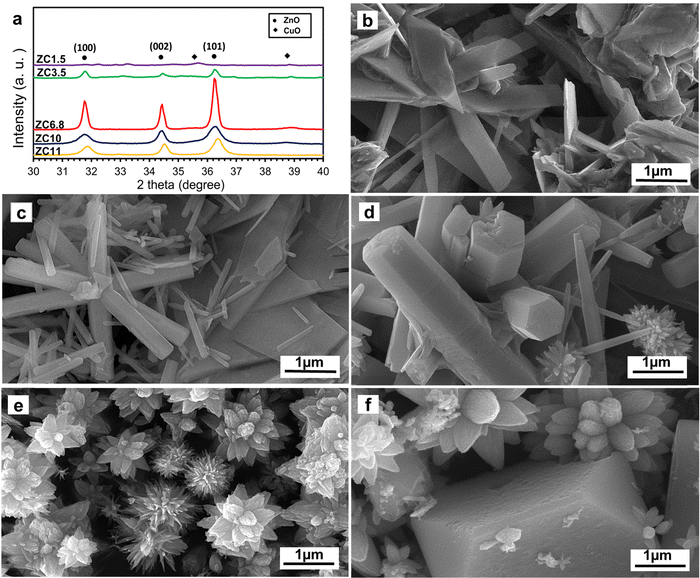 |
| | Fig. 1 (a) XRD patterns and FESEM images of the as prepared ZnO/CuO nanocomposites at different pH values: (b) ZC1.5, (c) ZC3.5, (d) ZC6.8, (e) ZC10, and (f) ZC11. | |
Fig. 2(a)–(e) illustrate the concentration-pH diagrams of Zn(II) and Cu(II) species at 90 °C for the samples forming different nanostructures. In Fig. 2a, in the case of the ZC1.5 sample, Zn2+ and Cu2+ are suggested as the predominant zinc and copper species, i.e., no ZnO and CuO formation under this condition.19 Furthermore, in severe acidic media, HMTA provides NH4+ and CH2O through a hydrolytic decomposition of (CH2)6N4H+, as shown below:34
| | | (CH2)6N4 + H+ → (CH2)6N4H+ | (1) |
| | | (CH2)6N4H+ + 3H+ + 6H2O → 4NH4+ + 6CH2O | (2) |
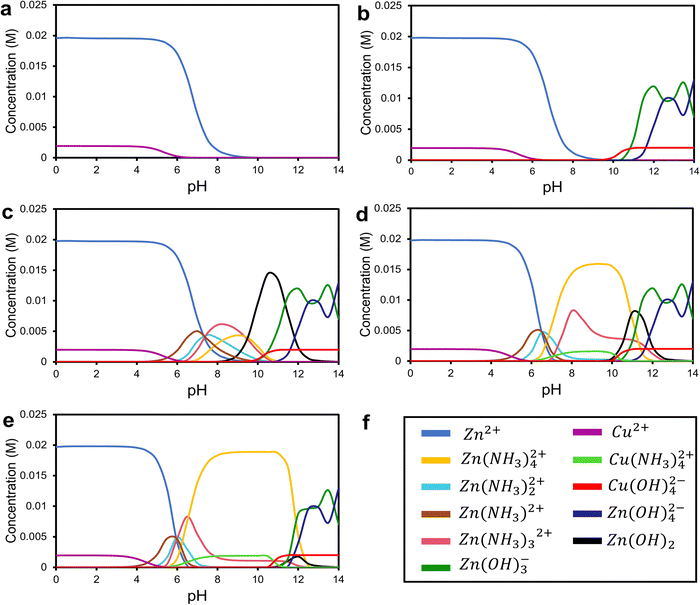 |
| | Fig. 2 The pH-dependent diagrams of Zn(II) and Cu(II) species at 90 °C as a function of pH for the solutions at pH (a) ZC1.5, (b) ZC3.5, (c) ZC6.8, (d) ZC10, and (e) ZC11 corresponding to the ammonia and nitric acid concentrations presented in Table 1. | |
At a lower concentration of nitric acid (mild acidic media), HMTA provides formaldehyde and ammonia according to the following reactions:35
| | | (CH2)6N4 + 6H2O ↔ 6HCHO + 4NH3 | (3) |
| | | NH3 + H2O ↔ NH4+ + OH− | (4) |
The OH− ions formed through reaction (4), react with the Zn2+ and Cu2+ ions, and form Zn(OH)2 and Cu(OH)2, respectively, which is in agreement with the concentration-pH diagrams of ZC3.5 in Fig. 2b. The XRD pattern of the ZC3.5 sample confirms the presence of the ZnO and CuO phases. Moreover, the FESEM image of the ZC3.5 sample (Fig. 1c) shows the ZnO nanorod and CuO nanosheets. The role of HMTA in the formation of ZnO nanorods was proposed by Strano et al.36 HMTA acts as a nonpolar agent and attaches to the lateral plains of ZnO and causes growth along the polar plane of ZnO. Moreover, CuO formed as a nanosheet structure from dehydration of Cu(OH)2 acts as the seed for the formation of ultra-thin CuO nanosheets.37 Furthermore, the area representing ZnO and CuO nanostructures for samples ZC3.5, ZC6.8, and ZC10 are shown in the EDS mapping in Fig. S3 (ESI†) to clarify each morphology in the FESEM images.
Without any pH adjustment in the synthesis of sample ZC6.8, the sharp peaks of wurtzite ZnO and monoclinic CuO were detected in the XRD pattern of this sample, Fig. 1a. According to the FESEM image displayed in Fig. 1d, the sample ZC6.8 reveals ZnO nanorods and CuO urchin-like morphology. The formation of urchin-like CuO is due to the ammonia produced through the reaction of HMTA and water.38 HMTA acts as the main source of OH− to form Cu(OH)2 nuclei which further grows into CuO nanowires through dehydration. Therefore, in order to reduce the high surface energy of the nanowire sides, the nanowires attach to each other and form the urchin-like nanostructure.39 Based on the concentration-pH diagrams in Fig. 2c, the produced OH− ions from the reaction of HMTA with water accelerate the nucleation of Zn and Cu hydroxide complexes.40
With the addition of ammonia to the ZC10 synthesis solution and increasing pH in the ZC10 sample, zinc tetra-ammine and copper tetra-ammine complexes form according to the following reactions:
| | | Zn(NO3)2·6H2O + 4NH3·H2O ↔ Zn(NH3)42+ + 2HNO3 + 2OH− + 8H2O | (5) |
| | | Cu(NO3)2·3H2O + 4NH3·H2O ↔ Cu(NH3)42+ + 2HNO3 + 2OH− + 4H2O | (6) |
and concentration-pH plots of ionic species provided in
Fig. 2d.
41
Under alkaline conditions, when ammonia and HMTA are added to the synthesis solution, the following reactions occur:
| | | Cu/Zn(NH3)42+ + 2OH− → Cu/ZnO + 4NH3 + H2O | (7) |
| | | Cu/Zn(OH)42− → Cu/ZnO + H2O + 2OH− | (8) |
With the ammonia and OH− ions present in the system, two different complexes, Cu/Zn(NH3)42+ and Cu/Zn(OH)42− form. Accordingly, these complexes act as the growth unit to produce ZnO and CuO.42 The XRD pattern and FESEM image of this sample in Fig. 1a and e, respectively, can correspondingly prove the formation of these phases with the flower-like morphology. The probable mechanism for the formation of these nanostructures is provided in the ESI.†
By further addition of ammonia, at pH 11, no obvious CuO peaks in the XRD pattern were seen, Fig. 1a. Lausecker et al.43 reported the same results at the initial pH of ca. 10.9. This could be attributed to the point-of-zero-charge (PZC) which is the number of total positive charges equivalent to the number of total negative charges.44 Since the pH of the chemical bath is higher than the PZC of ZnO c-plane top facets, Cu2+ species attach to the negative-charged top facets of ZnO in the form of Cu(NH3)42+ ions NRs resulting in the dissolution of copper oxide. The absence of the copper oxide phase is in agreement with the EDS mapping and FESEM-EDS spectra of the sample ZC11 as presented in Fig. S2 and S3 (in the ESI†), respectively. All the peaks belong to ZnO and no secondary phase was observed. Fig. 2e shows the concentration-pH diagrams of Zn2+ and Cu2+ complexes of the sample ZC11 and the related FESEM image is provided in Fig. 1f. The detailed mechanism for the formation of the nanostructures in sample ZC11 is discussed in the ESI.†
3.2. Detailed structural properties
Based on the FESEM and XRD characterizations, three out of five samples that had both the ZnO and CuO phases were chosen for further investigations. The detailed structural properties of the as-synthesized samples are demonstrated through (HR)TEM analysis which is displayed in Fig. 3a–c for samples ZC3.5, ZC6.8, and ZC10, respectively. For each sample, a higher magnification (shown as insets) and a high-resolution image are supporting the structural investigation. TEM images of the sample ZC3.5 show the formation of CuO nanosheets and ZnO nanorods. As previously pointed out in the structure and morphology section, the nanosheets of CuO are very thin in a way that ZnO nanorods can be seen through the nanosheets (Fig. 3a).18 The inset and the HRTEM images in Fig. 3a show further details of the interface between ZnO nanorods and CuO nanosheets. TEM images of the randomly oriented ZnO nanorods and CuO nanourchins demonstrate that the diameter and length of ZnO nanorods are increased by increasing the pH to 6.8. Moreover, due to the inset image of Fig. 3b, the brighter ends of the CuO nanourchin petals suggest that the thickness along the growth direction of the nanourchins is decreased. The interface between CuO and ZnO nanoflowers of the sample ZC10 can be observed in the corresponding TEM images. The high concentration of intermediate compounds that act as formation units, provides a facile growth mechanism for ZnO and CuO nanostructures which results in larger grains.45 Therefore, the electron transfer is supposed to become facile with decreasing grain boundaries.18 Also, it is observed that the CuO nanoflowers in the ZC10 sample have a higher number of petals with a smaller diameter compared to CuO nanourchins in the ZC6.8 sample, which can provide more active sites. On the other hand, the larger petals of urchin-like CuO provide larger spacing between the petals and provide more electron transfer paths.46 High magnified images reveal that the interplanar spaces of each sample are measured to be around 0.26 and 0.23 nm, which is referred to the (002) lattice plane of hexagonal ZnO and the (111) planes of monoclinic CuO, respectively. Due to the similar ionic radius of Zn2+ and Cu2+ and the minimal lattice mismatch (<5%) between wurtzite ZnO and monoclinic CuO, no stacking sequence referred to the type III stacking faults were found in the samples.47,48
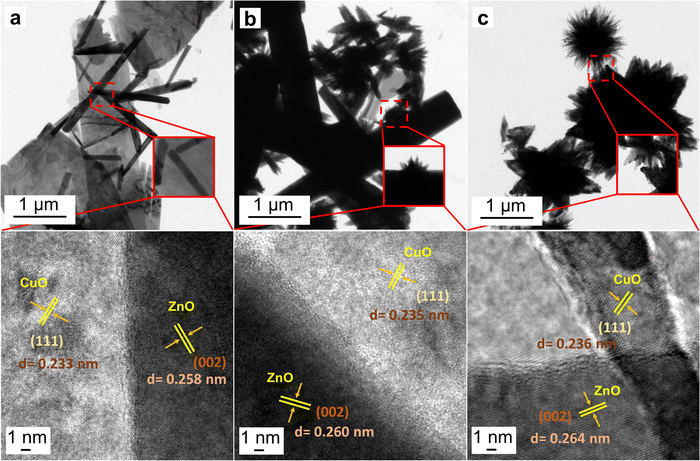 |
| | Fig. 3 TEM and corresponding HRTEM images of (a) ZC3.5, (b) ZC6.8, and (c) ZC10 (insets show the magnified images of the interface between ZnO and CuO nanostructures). | |
3.3. Chemical binding
Fig. 4 demonstrates the HRXPS spectra of the as-synthesized samples. In Fig. 4a, the Cu 2p states of the samples are shown. The Cu 2p XPS spectrum consists of two peaks assigned to Cu 2p3/2, Cu 2p1/2, and two other satellite peaks for Cu2+ with higher binding energies than that of Cu 2p3/2.49 Accordingly, the Cu 2p3/2 peaks appear at 935.1, 933.6, and 934.4 eV, and the Cu 2p1/2 peaks are located at 962.7, 961.6, and 962 eV related to samples ZC10, ZC6.8, and ZC3.5, respectively. Moreover, broad Cu2+ satellite peaks centered at around 942 and 952 eV were observed in all samples, which can be assigned to the presence of Cu2+ in CuO.50 The slight shifts in the binding energies were caused by the presence of Cu–O–Zn bonds as the synthesis pH decreased.51 The diminution of Cu 2p peak intensities in samples ZC6.8 and ZC3.5, suggests a lower content of Cu2+ species in these samples.52
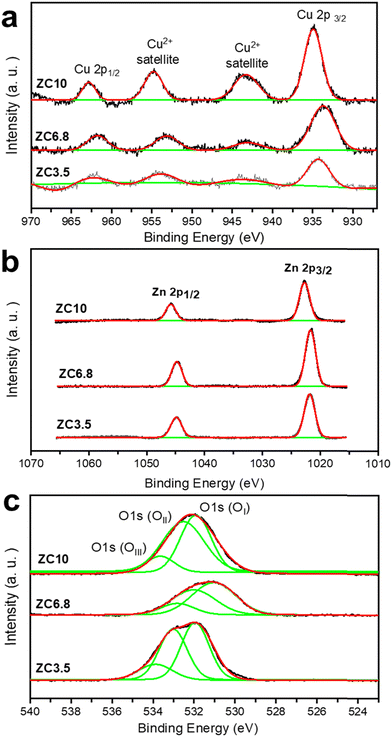 |
| | Fig. 4 HRXPS curves of (a) Cu, (b) Zn, and (c) O elements of the samples. | |
The Zn 2p core-level XPS spectra are shown in Fig. 4b. The corresponding peaks of Zn 2p3/2 and Zn 2p1/2 states belonging to ZC10 are centered in 1022.7 and 1045.8 eV, respectively.53,54 The peak position difference is ca. 23 eV, which is the same as the one reported previously,55 confirming the oxidation state of +2 in the sample and the existence of Zn as ZnO. The peak positions of the samples ZC6.8 and ZC3.5 were shifted from 1022.7 and 1045.8 to 1021.5 and 1044.8 eV, respectively. These shifts in Zn 2p peaks are attributed to the different surface morphologies of ZnO nanostructures.56
Fig. 4c represents the asymmetric peaks of the O 1s spectrum. These peaks are fitted into three types of oxygen levels.57 The low binding energy peak (OI) at 531.94, 531.06, and 531.9 eV for the samples ZC10, ZC6.8, and ZC3.5, respectively, corresponds to lattice oxygen in CuO and ZnO.58 Moreover, the medium binding energy peak (OII) fitted at 500 eV for ZC10, 496 eV for ZC6.8, and 520 eV for sample ZC3.5, is associated with oxygen vacancies.59 The prominent OII peak in ZC3.5 depicts a higher concentration of oxygen vacancies in this sample compared to the samples ZC10 and ZC3.5. The XPS results suggest that the presence of oxygen vacancies changes with the morphological variation, which results from different crystal growth directions.45,60 The high binding energy peak (OIII) is characteristic of chemisorb oxygen,61 which is fitted to 533.7, 532.7, and 533.8 eV for the samples ZC10, ZC6.8, and ZC3.5, respectively. Owing to the similar ionic radius of Cu (0.72 Å) and Zn (0.75 Å), Cu can easily occupy the ZnO matrix which is called unintentional Cu-doping.62 As a result, the peak shifts of Zn 2p, Cu 2p, and O 1s spectra in the sample ZC6.8 towards lower binding energy can be observed.
3.4. Surface area measurements
To provide additional information on the specific surface area and pore volume of the as-prepared samples, the BET method was carried out.63 As shown in Fig. 5a, N2 adsorption–desorption isotherms of all samples demonstrated type-IV in the IUPAC classification, representing mesopores with capillary space between parallel plates or open-slit-shaped capillaries.64 According to the Brunauer–Deming–Deming–Teller (BDDT) and the IUPAC classifications, the H3 hysteresis loop can be seen at a p/p0 range of 0.45 to 0.98, 0.3 to 0.99, and 0.4 to 0.98, respectively for the samples ZC10, ZC6.8, and ZC3.5 suggesting panel-shaped particles.65 The larger hysteresis loop and upward shift in the isotherm of the sample ZC10 compared to ZC6.8 and ZC3.5 suggest a higher surface area and larger pore volumes in ZC10.66 The pore size distribution of ZnO/CuO nanocomposites according to the adsorption isotherm by the Barrett–Joyner–Halenda (BJH) method is demonstrated in Fig. 5b and found to be most varied in the range of 2–7 nm for all materials. With the increase in synthesis pH, the pore size distribution becomes narrower confirming the FESEM results which shows that the nanostructures become denser. Thereby, the reduced pore size in the sample ZC10 is due to the tight-packed petals of ZnO nanoflowers. Furthermore, Table 2 represents the surface structural properties of the ZnO/CuO nanocomposite samples. The mesopore volume (VP) and average pore diameter (DP) changed with altering the synthesis pH. This indicates that the adjustment in synthesis parameters such as pH value can be used to control the surface structures.67 Moreover, the specific surface area of the samples ZC3.5, ZC6.8, and ZC10 were determined to be 4.4733, 2.9249, and 8.1321 m2 g−1, respectively. Accordingly, a significant decrease in surface area and VP of the sample ZC6.8 was observed owing to Cu-doping into ZnO.68 With the occupation of Cu atoms, lattice parameters of ZnO expand which results in a higher surface area of the sample ZC6.8. It is worth mentioning that the considerably higher values of SSA and pore volume values in the sample ZC10, compared to the other samples, are consistent with the TEM results. In other words, this sample is composed of a large number of small-diameter petals, providing more active sites. Hence, it is favorable for better interaction between photocatalyst material and pollutant species and therefore the enhancement of photocatalytic activity.69,70
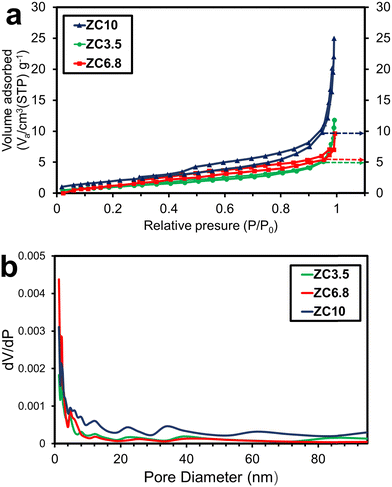 |
| | Fig. 5 (a) N2 adsorption–desorption isotherms and (b) pore size distribution BJH of the samples. | |
Table 2 Surface structural properties of ZnO/CuO nanocomposites
| Sample |
ZC3.5 |
ZC6.8 |
ZC10 |
|
V
P (cm3 g−1) |
0.017077 |
0.016388 |
0.036458 |
|
D
P (nm) |
14.853 |
20.603 |
17.739 |
| BETSSA (m2 g−1) |
4.4733 |
2.9249 |
8.1321 |
3.5. Optical characterizations
The absorbance ability of photocatalysts is closely associated with their band structures which in turn affects their photocatalytic degradation efficiency toward organic dyes.71 To evaluate the absorbance performance of the samples, DRS was conducted at room temperature. Fig. 6a shows the band energy structures of the samples in the range of 300 to 800 nm. Moreover, the band gap energy (Eg) of the as-prepared photocatalysts was evaluated by the DRS spectra employing the Tauc method.72 According to this method, the band gap energy can be evaluated by extrapolating the linear sections of the graph to the x-axis according to:where α is the absorption coefficient, hν is the photon energy and A is the proportionality constant for semiconductor materials. The value of the n index depends on the transition characteristics of the semiconductor which is found to be 2 for direct semiconductors and 0.5 for indirectly allowed transitions.73 The value of n is considered to be 2 for ZnO/CuO nanocomposites based on previous studies.74 Relatively, the inset of Fig. 6a represents the Tauc plots of the samples, revealing that the sample ZC6.8 exhibits the lowest band gap energy (2.9 eV). The low band gap of this sample is related to the redshift in the absorption spectra. The redshift towards the higher wavelengths in sample ZC6.8 can be attributed to the unintentional Cu-doping effect as mentioned earlier in the chemical binding section. Similar results have been reported for the effect of Cu doping on the band gap engineering of ZnO.32,75 To be more specific, when Cu substitute Zn in the ZnO lattice, the produced defects offer new energy states between the valence and the conduction band of the sample ZC6.8 and cause the reduction of the band gap energy.76 The calculated optical band gap energies were shifted to 3.2 and 3 eV for the samples ZC3.5 and ZC10, respectively, by changing the synthesis pH. Accordingly, the variation in band gap energies among the samples may be due to the electron confinement or morphological alteration.50,77 The different morphologies of the nanostructures contain various dominant active facets and show different excitation energies.78 Moreover, the band gap energy shift can be attributed to the intrinsic point defects, such as oxygen vacancies, and varied porosity of the samples, as confirmed by XPS and BET analysis, respectively. Correspondingly, oxygen vacancies, in particular, can adjust the band gap width by rising the valence band of the semiconductors.79
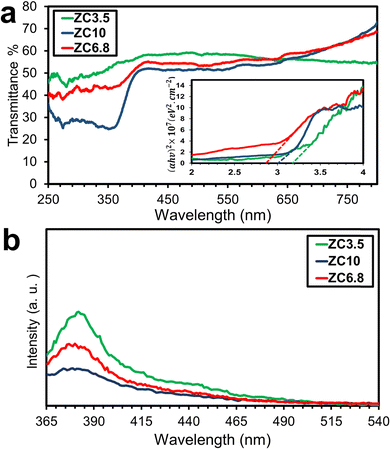 |
| | Fig. 6 (a) DRS spectra, Tauc plots for different samples, and (b) room-temperature PL spectra of samples ZC3.5, ZC6.8, and ZC10. | |
To consider the efficiency of charge carriers migration and recombination behavior, PL spectra were studied.80Fig. 6b shows the room temperature absorption PL spectra of the samples ZC3.5, ZC6.8, and ZC10 with an excitation wavelength of 325 nm in the range of 370–550 nm. The PL spectrum of the samples ZC3.5 and ZC6.8 shows a dominant UV emission peak at ∼370 nm with a relatively higher intensity compared to the sample ZC10. A slight shift in the wavelength of the peaks can be observed, attributed to variations in the band gaps of the samples resulting from different pH values. These distinct PL emission peaks demonstrate the morphological influence on the luminescence properties of the samples. Khusaimi et al.81 pointed out that electron transition along the length of ZnO nanorods is more facile than in other nanostructures of ZnO. Similarly, the peak intensities of the samples ZC3.5 and ZC6.8, with ZnO nanorod morphology, are higher than those of ZC10 with a flower-like morphology. Furthermore, it has been reported that coupling CuO with ZnO suppresses the high electron-hole recombination rate of ZnO and improves the potential for visible light absorption, thus enabling visible-light-driven photocatalysis.82
3.6. Photocatalytic performance
The photocatalytic performance of the samples was studied by measuring the degradation rate of MB, a commonly used organic dye in the industry. Fig. 7a illustrates the photo-decomposition of MB under visible light exposure for the different synthesized ZnO/CuO nanocomposites. After 150 min, the samples ZC3.5 and ZC6.8 exhibited photocatalytic efficiencies of 71% and 85.8%, respectively. Notably, the sample ZC10 with flower-like morphology demonstrated 100% photocatalytic efficiency at that same time, indicating the highest photocatalytic activity among all the samples. Previous research by Nami et al.32 has also demonstrated that ZnO/CuO nanocomposites exhibit enhanced photocatalytic activity in comparison with pure ZnO in a nutrient solution. Hence, it is clear that the ZnO/CuO nanocomposites synthesized in acidic and alkaline solutions, with the same molar ratio, display better photocatalytic performance compared to pure ZnO. Trends in photocatalytic efficiency of the various ZnO/CuO nanocomposites are in strong agreement with the optical and structural properties.
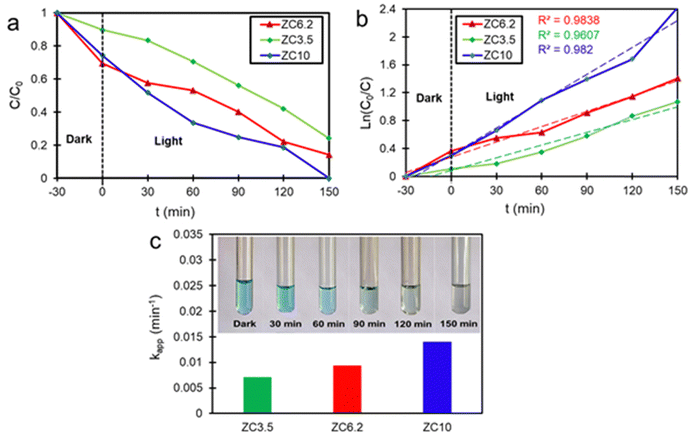 |
| | Fig. 7 (a) Photo-degradation rate, (b) plots of ln(C0/C) as a function of visible light time irradiation fitted with a pseudo-first-order kinetic model, and (c) reaction rate constants upon different catalysts exposed to MB. | |
The flower-like nanostructure in the ZC10 sample provides a higher surface area, lower photogenerated recombination rate, and enhanced charge separation based on BET, PL, and TEM results. Furthermore, the narrower band gap energy of the sample ZC10 makes it a more visible light-active catalyst compared with that of the sample ZC3.5. Thus, the photo-degradation efficiency of the sample ZC10 shows remarkable photocatalytic efficiency enhancement in comparison with sample ZC3.5. Moreover, the higher photocatalytic activity of the sample ZC6.8 than that of the sample ZC3.5 can be attributed to the wide band gap energy of the latter; this limits the photo-reaction of this sample under visible light irradiation. However, narrowing band gap energy and consequently, spectral response enhancement does not necessarily improve the photo-degradation.83 In other words, the more visible light activity does not guarantee the more efficient photo-excited charge separation, generating reductant and oxidant reactive oxygen species (ROS), which is a crucial factor for increasing photocatalytic efficiency. Although a narrower band gap energy results in more photo-responsibility, it can also increase the electron-hole recombination rate which might decrease the photocatalytic performance of the photocatalyst. Thus, it can be claimed that the highest SSA and lowest electron/hole recombination rate are further effective parameters responsible for the highest photocatalytic activity of the sample ZC10 among all the nanocomposites synthesized.84,85 Moreover, more oxygen vacancies in ZC10 than that of ZC6.8 (as confirmed in the detailed analysis of XPS) increases the visible light absorption considerably, due to the position raising of the valence band.86
Fig. 7b and c illustrate the plots of ln(C0/C) as a function of visible light irradiation time and the k values of different samples, respectively. The kinetic study of the samples demonstrates a well fitted pseudo-first-order reaction model under exposure to visible light, according to the following equation:87
| |  | (13) |
where
C0 and
C represent the initial concentration of the organic pollutant and the concentration of the organic pollutant at the time of
t.
88 This kinetic model is consistent with previous reports on the degradation of MB at the liquid–solid interface in ZnO/CuO nanocomposites, under irradiation of visible light. The slope of the lines in
Fig. 7b is the apparent rate constant. The highest degradation rate of the sample ZC10 can be related to the trapping mechanism. Hence, the separation of electrons and holes is more likely in this sample. As a result, decolorization of the solution occurred as presented in
Fig. 7c in which the color changed from blue to a colorless solution, using the ZC10 photocatalyst after 150 min visible light irradiation. The previous reports demonstrated that the kinetics of degradation of MB at the liquid–solid interface follows a pseudo-first-order reaction model under exposure to visible light which confirms the present data.
89
CuO and ZnO are referred to as the reduction photocatalyst (RP) and oxidation photocatalyst (OP), respectively, in an S-scheme heterojunction because their CB energy level (ECB) and Fermi energy level (Ef) are located at higher energy levels than those of ZnO.90 It was previously believed that upon contact, the Ef of both RP and OP would shift downward and upward, respectively, until reaching the same level to achieve a thermal equilibrium state. However, this theory is unlikely due to uneven charge distribution. Zhang et al.91 proposed a possible mechanism for the S-scheme heterojunction where the band positions are staggered and the charge transfer mechanism is different. According to this theory, the Ef of RP gradually decreases while that of OP slowly increases, and they bend at the heterojunction interface region until reaching thermal equilibrium at the contacting point, as shown in Fig. 8. At the same time, a CuO to ZnO-directed internal electric field (IEF) forms. A potential barrier develops as a result of the band bending and IEF.92 After light illumination and construction of the S-scheme heterojunction, the photo-excited electrons of ZnO transfer to the interface region and recombine with the photogenerated holes of CuO. Additionally, charge recombination within RP and OP itself is hindered.93 Moreover, as the Ef in the bulk region of OP and RP remains the same as before contact, the powerful electrons at the CB of the RP and useful holes at the VB of the OP are preserved. These electrons and holes with strong reduction and oxidation potentials, contribute to the redox and oxidizing reactions on the surface of the RP and OP, respectively.94 Hence, the reduction of Cu2+ to Cu+ occurs at the surface of CuO and consequently, the reaction between dissolved oxygen molecules and Cu+ in the MB solution results in the generation of hydrogen peroxide (H2O2). Finally, MB can be degraded according to the following chemical reactions:95
| | | CuO/ZnO + hν → (ZnO)h+ + (CuO)e− | (14) |
| | | 2Cu+ + 2H+ + O2 → 2Cu++ + H2O2 | (16) |
| | | H2O2 + MB → intermediates → degradation | (17) |
It is worth mentioning that due to the large petals of the flower-like nanostructures, the interstitial spacing between each nanostructure facilitates hydrogen trapping or adsorption in the sample ZC10.
96
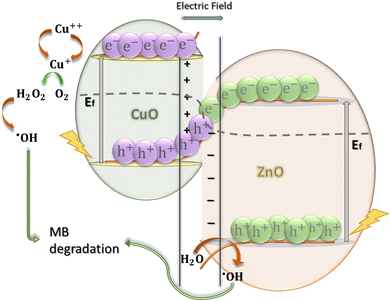 |
| | Fig. 8 Proposed S-scheme mechanism for photocatalytic degradation of MB by the ZnO/CuO nanocomposite. | |
With efficient charge carrier separation, both electrons and holes participate in several redox reactions and generate reactive oxygen (ROS).97 In other words, by reducing the recombination rate of electrons and holes and achieving sufficient charge separation, more electrons become available for reactions. These electrons react with free oxygen molecules in the dye solution and form superoxide radicals (˙O2−):98
| | | ZnO + hν → ZnO(e−) + ZnO(h+) | (18) |
| | | CuO + hν → CuO(e−) + CuO(h+) | (19) |
| | | e−(ZnO/CuO) + O2 → ˙O2− | (20) |
Afterward, through indirect reactions, the superoxide radicals turn into highly reactive hydroxide radicals (˙OH) as follows:
99| | | 2e− + O2 + 2H+ → H2O2 | (21) |
| | | ˙O2− + H2O2 → ˙OH + OH− + O2 | (22) |
| | | ˙O2− + H2O → ˙OH + ˙HO2 + H2O2 | (24) |
Consequently, the ROS interact with the absorbed MB on the surface of the ZnO/CuO catalyst and mineralize MB dye molecules (
reaction (25)):
100
Based on the results obtained from the present study, the sample ZC10 demonstrates enhanced photocatalytic performance due to its higher copper content and reduced presence of grain boundaries. These factors facilitate efficient charge separation, leading to optimized photocatalytic performance of this sample.
The optical and photocatalysis results indicate that the sample ZC10 provides a better photocatalytic performance. According to the calculated weight of the obtained powders sorted in Table 1, the powders from the synthesis of the sample ZC6.8 are 3 times heavier than those of the sample ZC10.
To investigate the role of electrons, holes, and active intermediate species such as ˙OH and ˙O2− in the photodegradation process, hydroxyl radicals and radical trapping agents such as CN, EDTA, MeOH, and BQ were used, respectively.101 In a scavenger-free reaction, the maximum degradation of MB dye was achieved up to 100% for the sample ZC10. Hence, the sample ZC10 was selected to examine the role of active species on the degradation process of MB. Fig. 9a shows the radical scavenging activity during the photocatalytic degradation process of MB over the sample ZC10. Upon the introduction of different scavengers into the photocatalytic reaction, a notable decrease in MB degradation was observed. Particularly, the degradation efficiency of MB was reduced to 42% by applying EDTA, followed by 45% with the addition of MeOH. This indicates that the holes and ˙OH play a significant role in the degradation of MB. This trend is also confirmed by the kinetic study of the samples illustrated in Fig. 9b. The kapp of the samples was determined using the pseudo-first-order equation (eqn (13)). A slight decrease in kapp occurred in the presence of CN and BQ, respectively. Therefore, the results suggest that holes are the most dominant active species in the photocatalytic degradation of MB among the above-mentioned active species.
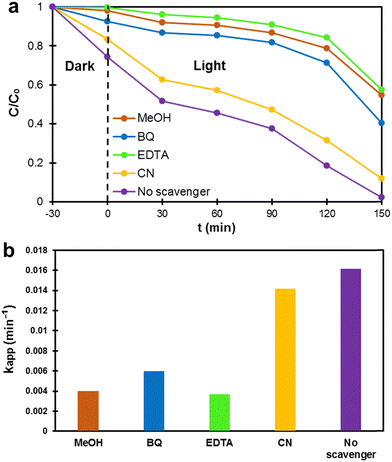 |
| | Fig. 9 The effect of the presence of scavengers on the (a) photocatalytic degradation of MB over the sample ZC10, and (b) kapp values. | |
To further evaluate the photodegradation performance of the sample ZC10 for removal of organic dyes, MO and RhB were used as anionic and cationic organic dyes, respectively. The results, illustrated in Fig. 10, indicate that RhB exhibited the second highest degradation efficiency among cationic dyes, following MB. One the other hand, MO displayed good visibility among anionic dyes.102 Also, MB and MO have similar molecular size, making surface charge the primary controlling parameter for comparing their adsorption processes.103 As shown in Fig. 10a the degradation efficiency of both dyes toward the sample ZC10 is compared to that of MB. Accordingly, the degradation efficiency of MO and RhB was found to be 46% and 64.5% after 150 min of light exposure, respectively. This sample clearly showed photocatalytic degradation of organic dyes in the following order: MB > RhB > MO. This is because the cationic organic dyes (MB and RhB) have a positive charge, while anionic dye (MO) has a negative charge. This means that the positive charge carried by cationic dyes facilitates their reaction with radicals present on the photocatalyst's surface, such as ˙OH and OH−, in comparison to MO. As a result, the adsorption of positively charged dyes onto the surface of the photocatalyst is higher than that of negatively charged dyes.104 Moreover, it should be noted that RhB dye molecules possess a larger volume than MB molecules, resulting in fewer active adsorption sites.105 The photodegradation rate constant values for the sample ZC10 against MO and RhB organic dyes were calculated according to the pseudo-first-order (eqn (13)) and were found to be 0.004111 and 0.006918 min−1, respectively, as shown in Fig. 10b.
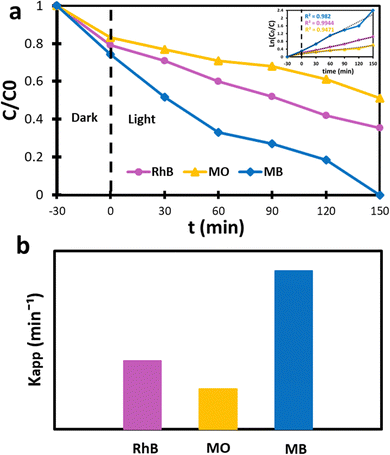 |
| | Fig. 10 (a) The photocatalytic activity of the sample ZC10 toward the degradation of MO, RhB and MB dyes, and (b) the calculated first-order reaction kinetic rate constant. | |
4. Conclusion
In this research, we have successfully synthesized ZnO/CuO nanocomposites at different pH values using the chemical bath deposition method. The effect of pH on structural and optical properties of the as-prepared samples was investigated. The XRD patterns and FESEM images of the samples displayed that at high pH values, attachment of Cu(II) species to the negative top facets of ZnO nanorods resulted in the absence of CuO nanostructures; whilst at low pH values, the components were highly soluble. This was confirmed by data obtained through Visual MINTEQ software. The BET results indicated that with the change in the synthesis pH value and relevantly structural alteration of the nanocomposites, different values of pore size and SSA are obtained. The sample ZC10 showed the enhancement of the pore size and SSA, providing more active sites for better interfacing with dye molecules. The results of DRS further showed that the band gap energy was also altered at each sample. The sample synthesized at pH 10 revealed a higher band gap energy than the one synthesized at pH 6.8, according to the CuO nanoflower structure which is reported to have a higher band gap than the pure CuO. The PL spectral analysis demonstrated that a remarkable enhancement in the recombination rate of photogenerated electrons and holes was observed for ZC10. The photo-degradation measurement supported that the sample ZC10 reveals the optimum result in degradation of MB compared to other catalysts. The photocatalytic degradation of MB is mainly driven by photo-generated holes under irradiation of visible light.
Author contributions
Nargol Jalali: conceptualization, writing – original draft, creating the graphics, investigation, reviewing and editing; Amirhossein Rakhsha: conceptualization, creating the graphics, reviewing and editing; Mohammad Nami: creating the graphics, reviewing and editing; Fereshteh Rashchi: supervision, project administration, reviewing and editing; Valmor Roberto Mastelaro: formal analysis, reviewing, and editing.
Conflicts of interest
The authors declare that they have no known competing financial interests or personal relationships that could have appeared to influence the work reported in this paper.
Acknowledgements
The authors would like to acknowledge the support of the University of Tehran and the Iran Nanotechnology Initiative Council for this research. No external funding was received.
References
- P. Ghasemipour, M. Fattahi, B. Rasekh and F. Yazdian, Sci. Rep., 2020, 10, 1–16 CrossRef PubMed.
- M. E. M. Ali, E. A. Assirey, S. M. Abdel-Moniem and H. S. Ibrahim, Sci. Rep., 2019, 9, 1–9 CrossRef PubMed.
- Y. T. Prabhu, V. N. Rao, M. V. Shankar, B. Sreedhar and U. Pal, New J. Chem., 2019, 43, 6794–6805 RSC.
- Z. Guo, J. Zhou, L. Zhu and Z. Sun, J. Mater. Chem. A, 2016, 4, 11446–11452 RSC.
- H. Yin, K. Yu, C. Song, R. Huang and Z. Zhu, Appl. Mater. Interfaces, 2014, 6, 14851 CrossRef CAS PubMed.
- H. Maleki and V. Bertola, ACS Appl. Nano Mater., 2019, 2, 7237–7244 CrossRef CAS.
- B. Liu, H. Wu and I. P. Parkin, ACS Omega, 2020, 5, 14847–14856 CrossRef CAS PubMed.
- L. Zhu, H. Li, P. Xia, Z. Liu and D. Xiong, ACS Appl. Mater. Interfaces, 2018, 10, 39679–39687 CrossRef CAS PubMed.
- V. Fedorenko, R. Viter, R. Mrówczyński, D. Damberga, E. Coy and I. Iatsunskyi, RSC Adv., 2020, 10, 29751–29758 RSC.
- A. Shafi, N. Ahmad, S. Sultana, S. Sabir and M. Z. Khan, ACS Omega, 2019, 4, 12905–12918 CrossRef CAS PubMed.
- M. L. M. Napi, S. M. Sultan, R. Ismail, K. W. How and M. K. Ahmad, Materials, 2019, 12, 2985 CrossRef CAS PubMed.
- R. Qu, W. Zhang, N. Liu, Q. Zhang, Y. Liu, X. Li, Y. Wei and L. Feng, ACS Sustainable Chem. Eng., 2018, 6, 8019–8028 CrossRef CAS.
- S. Le, T. Jiang, Y. Li, Q. Zhao, Y. Li, W. Fang and M. Gong, Appl. Catal., B, 2017, 200, 601–610 CrossRef CAS.
- R. K. Sharma and R. Ghose, Ceram. Int., 2014, 40, 10919–10926 CrossRef CAS.
- W. Wang, J. Wang, Z. Wang, X. Wei, L. Liu, Q. Ren, W. Gao, Y. Liang and H. Shi, Dalton Trans., 2014, 43, 6735–6743 RSC.
- I. A. Rutkowska, A. Wadas, E. Szaniawska, A. Chmielnicka, A. Zlotorowicz and P. J. Kulesza, Curr. Opin. Electrochem., 2020, 23, 131–138 CrossRef CAS.
- M. B. Gawande, A. Goswami, F.-X. Felpin, T. Asefa, X. Huang, R. Silva, X. Zou, R. Zboril and R. S. Varma, Chem. Rev., 2016, 116, 3722–3811 CrossRef CAS PubMed.
- K. Mageshwari, D. Nataraj, T. Pal, R. Sathyamoorthy and J. Park, J. Alloys Compd., 2015, 625, 362–370 CrossRef CAS.
- M. Taufique, A. Haque, P. Karnati and K. Ghosh, J. Electron. Mater., 2018, 47, 6731–6745 CrossRef CAS.
- J. Morales-Mendoza and F. Paraguay-Delgado, Mater. Lett., 2021, 291, 129494 CrossRef CAS.
- F. Guo, Z. Chen, X. Huang, L. Cao, X. Cheng, W. Shi and L. Chen, Sep. Purif. Technol., 2021, 275, 119223 CrossRef CAS.
- P. Mahajan, A. Singh and S. Arya, J. Alloys Compd., 2020, 814, 152292 CrossRef CAS.
- T. Jan, S. Azmat, Q. Mansoor, H. Waqas, M. Adil, S. Ilyas, I. Ahmad and M. Ismail, Microb. Pathog., 2019, 134, 103579 CrossRef CAS PubMed.
- R. K. Sharma and R. Ghose, Ceram. Int., 2015, 41, 14684–14691 CrossRef.
- L. Cui, Y. Song, F. Wang, Y. Sheng and H. Zou, Appl. Surf. Sci., 2019, 488, 284–292 CrossRef CAS.
- L. Song, S. Zhang, X. Wu and Q. Wei, Ind. Eng. Chem. Res., 2012, 51, 4922–4926 CrossRef CAS.
- M. B. Gawande, A. Goswami, F.-X. Felpin, T. Asefa, X. Huang, R. Silva, X. Zou, R. Zboril and R. S. Varma, Chem. Rev., 2016, 116, 3722–3811 CrossRef CAS PubMed.
- C. Ashok, K. V. Rao and C. S. Chakra, J. Adv. Chem. Sci., 2016, 223–226 Search PubMed.
- D. Saravanakkumar, S. Sivaranjani, K. Kaviyarasu, A. Ayeshamariam, B. Ravikumar, S. Pandiarajan, C. Veeralakshmi, M. Jayachandran and M. Maaza, J. Semicond., 2018, 39, 033001 CrossRef.
- V. Singh, M. Kumar, B. P. Reddy, R. Gangwar and C. Rath, Crystals, 2020, 10, 1025 CrossRef CAS.
- R. Singh and S. Dutta, Nano-Struct. Nano-Objects, 2019, 18, 100250 CrossRef CAS.
- M. Nami, A. Rakhsha, S. Sheibani and H. Abdizadeh, Mater. Sci. Eng., B, 2021, 271, 115262 CrossRef CAS.
- A. H. Rakhsha, H. Abdizadeh, E. Pourshaban, M. R. Golobostanfard, V. R. Mastelaro and M. Montazerian, Materialia, 2019, 5, 100212 CrossRef CAS.
- H. Tada, J. Am. Chem. Soc., 1960, 82, 255–263 CrossRef CAS.
- T. Marimuthu, N. Anandhan and R. Thangamuthu, Appl. Surf. Sci., 2018, 428, 385–394 CrossRef CAS.
- S. Chaudhuri, M. Ghosh, D. Das and A. Raychaudhuri, J. Appl. Phys., 2010, 108, 064319 CrossRef.
- A.-Z. Liao, W.-D. Zhu, J.-B. Chen, X.-Q. Zhang and C.-W. Wang, J. Alloys Compd., 2014, 609, 253–261 CrossRef CAS.
- Y. Zhu, Y. Wang, L. Song, X. Chen, W. Liu, J. Sun, X. She, Z. Zhong and F. Su, RSC Adv., 2013, 3, 9794–9802 RSC.
- J. C. Felizco and F. Mulimbayan, Mater. Sci. Forum, 2016, 866, 166–170 Search PubMed.
- L. Atourki, M. Ouafi, K. Abouabassi, A. Elfanaoui, A. Ihlal and K. Bouabid, Solid State Sci., 2020, 104, 106207 CrossRef.
- J. Li, H. Liu, Y. Ji, Y. Zhang, G. Wang, Y. Zhu, Z. Zhong, X. Hu and F. Su, RSC Adv., 2016, 6, 59737–59748 RSC.
- E. Mohammadi, M. Aliofkhazraei, M. Hasanpoor and M. Chipara, Crit. Rev. Solid State Mater. Sci., 2018, 43, 475–541 CrossRef CAS.
- C. Lausecker, B. Salem, X. Baillin, O. Chaix-Pluchery, H. Roussel, S. Labau, B. Pelissier, E. Appert and V. Consonni, Inorg. Chem., 2021, 60, 1612–1623 CrossRef CAS PubMed.
- G. A. Parks and P. D. Bruyn, J. Phys. Chem., 1962, 66, 967–973 CrossRef CAS.
- A. Hezam, K. Namratha, Q. Drmosh, B. N. Chandrashekar, K. K. Sadasivuni, Z. Yamani, C. Cheng and K. Byrappa, CrystEngComm, 2017, 19, 3299–3312 RSC.
- K. Li, G. Fan, L. Yang and F. Li, Sens. Actuators, B, 2014, 199, 175–182 CrossRef CAS.
- A. Rakhsha, H. Abdizadeh, E. Pourshaban, M. R. Golobostanfard, M. Montazerian and V. R. Mastelaro, Sens. Actuators, A, 2021, 331, 112916 CrossRef CAS.
-
S. Joshi, Tailored nanostructures for CO2 gas sensing applications, Diss., RMIT University, 2017 Search PubMed.
- A. Fouda, S. S. Salem, A. R. Wassel, M. F. Hamza and T. I. Shaheen, Heliyon, 2020, 6, e04896 CrossRef CAS PubMed.
- Z. Li, J. Wang, N. Wang, S. Yan, W. Liu, Y. Q. Fu and Z. Wang, J. Alloys Compd., 2017, 725, 1136–1143 CrossRef CAS.
- V. Kumari, S. Yadav, J. Jindal, S. Sharma, K. Kumari and N. Kumar, Adv. Powder Technol., 2020, 31, 2658–2668 CrossRef CAS.
- Z.-J. Zuo, J. Li, P.-D. Han and W. Huang, J. Phys. Chem. C, 2014, 118, 20332–20345 CrossRef CAS.
- B. Li and Y. Wang, Superlattices Microstruct., 2010, 47, 615–623 CrossRef CAS.
- W. Shi, C. Hao, Y. Fu, F. Guo, Y. Tang and X. Yan, Chem. Eng. J., 2022, 433, 133741 CrossRef CAS.
- S. Harish, J. Archana, M. Sabarinathan, M. Navaneethan, K. Nisha, S. Ponnusamy, C. Muthamizhchelvan, H. Ikeda, D. Aswal and Y. Hayakawa, Appl. Surf. Sci., 2017, 418, 103–112 CrossRef CAS.
- R. Al-Gaashani, S. Radiman, A. Daud, N. Tabet and Y. Al-Douri, Ceram. Int., 2013, 39, 2283–2292 CrossRef CAS.
- G. C. Park, S. M. Hwang, J. H. Lim and J. Joo, Nanoscale, 2014, 6, 1840–1847 RSC.
- F. Cao, T. Wang and X. Ji, Appl. Surf. Sci., 2019, 471, 417–424 CrossRef CAS.
- A. M. Huerta-Flores, E. Luévano-Hipólito, L. M. Torres-Martínez and A. Torres-Sánchez, J. Mater. Sci.: Mater. Electron., 2019, 30, 18506–18518 CrossRef CAS.
- M. Montero-Muñoz, J. E. Ramos-Ibarra, J. Rodríguez-Páez, G. Marques, M. Teodoro and J. Coaquira, Phys. Chem. Chem. Phys., 2020, 22, 7329–7339 RSC.
- X. Wang, S. Li, L. Xie, X. Li, D. Lin and Z. Zhu, Ceram. Int., 2020, 46, 15858–15866 CrossRef CAS.
- N. T. Hanh, N. L. M. Tri, D. Van Thuan, M. H. T. Tung, T.-D. Pham, T. D. Minh, H. T. Trang, M. T. Binh and M. V. Nguyen, J. Photochem. Photobiol., A, 2019, 382, 111923 CrossRef CAS.
- W. Shi, W. Sun, Y. Liu, K. Zhang, H. Sun, X. Lin, Y. Hong and F. Guo, J. Hazard. Mater., 2022, 436, 129141 CrossRef CAS PubMed.
- Y. Zhang, H. M. Yang and S.-J. Park, Curr. Appl. Phys., 2018, 18, 163–169 CrossRef.
-
W. Wang, P. Liu, M. Zhang, J. Hu and F. Xing, The pore structure of phosphoaluminate cement, 2012 Search PubMed.
- Z. Hu, M. P. Srinivasan and Y. Ni, Adv. Mater., 2000, 12, 62–65 CrossRef CAS.
- A. A. Asadi, M. Bazmi, S. M. Alavi and S. J. Royaee, RSC Adv., 2016, 6, 109681–109691 RSC.
- K. R. Aneesiya and C. Louis, J. Alloys Compd., 2020, 829, 154497 CrossRef CAS.
- P. Prasannalakshmi and N. Shanmugam, Mater. Sci. Semicond. Process., 2017, 61, 114–124 CrossRef CAS.
- S. Alikarami, A. Soltanizade and F. Rashchi, Mater. Chem. Phys., 2022, 285, 126174 CrossRef CAS.
- H. Sun, L. Wang, F. Guo, Y. Shi, L. Li, Z. Xu, X. Yan and W. Shi, J. Alloys Compd., 2022, 900, 163410 CrossRef CAS.
- A. Redinger and S. Siebentritt, Copper Zinc Tin Sulfide-Based Thin-Film Sol. Cells, 2014, 363–386 Search PubMed.
- Y. Rammah, G. Kilic, R. El-Mallawany, U. G. Issever and F. El-Agawany, J. Non-Cryst. Solids, 2020, 533, 119905 CrossRef CAS.
- P. Sathishkumar, R. Sweena, J. J. Wu and S. Anandan, Chem. Eng. J., 2011, 171, 136–140 CrossRef CAS.
- B. K. Das, T. Das, K. Parashar, A. Thirumurugan and S. Parashar, J. Mater. Sci.: Mater. Electron., 2017, 28, 15127–15134 CrossRef CAS.
- N. A. Albadarin, M. S. Takriff, S. T. Tan, S. A. Shahahmadi, L. J. Minggu, A. A. H. Kadhum, W. W. Yin, M. N. I. Salehmin, E. M. Alkhalqi and M. A. A. Hamid, Mater. Res. Express, 2020, 7, 125010 CrossRef CAS.
- S. Agarwal, P. Rai, E. N. Gatell, E. Llobet, F. Güell, M. Kumar and K. Awasthi, Sens. Actuators, B, 2019, 292, 24–31 CrossRef CAS.
- M. Umadevi and A. J. Christy, Spectrochim. Acta, Part A, 2013, 109, 133–137 CrossRef CAS PubMed.
- J. Wang, R. Chen, L. Xiang and S. Komarneni, Ceram. Int., 2018, 44, 7357–7377 CrossRef CAS.
- J. Pan, L. Wang, Y. Shi, L. Li, Z. Xu, H. Sun, F. Guo and W. Shi, Sep. Purif. Technol., 2022, 284, 120270 CrossRef CAS.
- Z. Khusaimi, M. H. Mamat, N. Abdullah and M. Rusop, Adv. Mater. Res., 2013, 667, 86–92 Search PubMed.
- J. Yu, S. Zhuang, X. Xu, W. Zhu, B. Feng and J. Hu, J. Mater. Chem. A, 2015, 3, 1199–1207 RSC.
- E. M. Samsudin and S. B. Abd Hamid, Appl. Surf. Sci., 2017, 391, 326–336 CrossRef CAS.
- K. N. Abbas and N. Bidin, Appl. Surf. Sci., 2017, 394, 498–508 CrossRef CAS.
- M. C. d Oliveira, V. Fonseca, N. A. Neto, R. A. P. Ribeiro, E. Longo, S. de Lazaro, F. V. d Motta and M. Bomio, Ceram. Int., 2020, 46, 9446–9454 CrossRef CAS.
- J. Wang, Z. Wang, B. Huang, Y. Ma, Y. Liu, X. Qin, X. Zhang and Y. Dai, ACS Appl. Mater. Interfaces, 2012, 4, 4024–4030 CrossRef CAS PubMed.
- G. Zhao, J. Zou, X. Chen, T. Zhang, J. Yu, S. Zhou, C. Li and F. Jiao, Ind. Eng. Chem. Res., 2020, 59, 6479–6487 CrossRef CAS.
- W. Shi, C. Hao, Y. Shi, F. Guo and Y. Tang, Sep. Purif. Technol., 2023, 304, 122337 CrossRef CAS.
- I. L. P. Raj, A. J. Christy, R. D. Prabu, N. Chidhambaram, M. Shkir, S. AlFaify and A. Khan, Inorg. Chem. Commun., 2020, 119, 108082 CrossRef.
- Q. Xu, S. Wageh, A. A. Al-Ghamdi and X. Li, J. Mater. Sci. Technol., 2022, 124, 171–173 CrossRef.
- L. Zhang, J. Zhang, H. Yu and J. Yu, Adv. Mater., 2022, 34, 2107668 CrossRef CAS PubMed.
-
Y. Lv, J. Liu, Z. Zhang, W. Zhang, A. Wang and F. Tian, Available at SSRN 4314778.
- D. Barman, J. Borah, S. Deb and B. K. Sarma, Colloids Surf., A, 2023, 663, 131077 CrossRef CAS.
- W. T. Alsaggaf, A. Shawky and M. Mahmoud, Inorg. Chem. Commun., 2022, 143, 109778 CrossRef CAS.
- K. Wang, W. Zhang, F. Lou, T. Wei, Z. Qian and W. Guo, J. Solid State Electrochem., 2018, 22, 2413–2423 CrossRef CAS.
- Y. Lin, H. Hu and Y. H. Hu, Appl. Surf. Sci., 2020, 502, 144202 CrossRef CAS.
- N. Jalali, M. Nami, F. Rashchi and A. Rakhsha, J. Ultrafine Grained Nanostruct. Mater., 2022, 55, 21–30 CAS.
- P. Bharathi, S. Harish, J. Archana, M. Navaneethan, S. Ponnusamy, C. Muthamizhchelvan, M. Shimomura and Y. Hayakawa, Appl. Surf. Sci., 2019, 484, 884–891 CrossRef CAS.
- J. Huo, C. Yuan and Y. Wang, ACS Appl. Nano Mater., 2019, 2, 2713–2724 CrossRef CAS.
- H. Ullah, L. Mushtaq, Z. Ullah, A. Fazal and A. M. Khan, Inorg. Nano-Met. Chem., 2021, 51, 963–975 CrossRef CAS.
- F. Bayat and S. Sheibani, Mater. Res. Bull., 2022, 145, 111561 CrossRef CAS.
- R. Sharma, H. Saini, D. R. Paul, S. Chaudhary and S. P. Nehra, Environ. Sci. Pollut. Res., 2021, 28, 7116–7122 CrossRef CAS PubMed.
- S. Kumari, A. A. Khan, A. Chowdhury, A. K. Bhakta, Z. Mekhalif and S. Hussain, Colloids Surf., A, 2020, 586, 124264 CrossRef CAS.
- S. Yadav, N. Rani and K. Saini, Environ. Sci. Pollut. Res., 2022, 1–25 Search PubMed.
- A. Mahdizadeh, S. Farhadi and A. Zabardasti, RSC Adv., 2017, 7, 53984–53995 RSC.
|
| This journal is © The Royal Society of Chemistry 2023 |
Click here to see how this site uses Cookies. View our privacy policy here.  Open Access Article
 *a and
Valmor Roberto
Mastelaro
d


