
 Open Access Article
 This Open Access Article is licensed under a Creative Commons Attribution-Non Commercial 3.0 Unported Licence
Effect of membrane mechanics on AEM fuel cell performance†
Aniket
Raut
 a,
Haoyan
Fang
a,
Yu-Chung
Lin
a,
David
Sprouster
a,
Yifan
Yin
a,
Yiwei
Fang
a,
Shi
Fu
a,
Sunil
Sharma
c,
Likun
Wang
d,
Chulsung
Bae
b and
Miriam
Rafailovich
*a
a,
Haoyan
Fang
a,
Yu-Chung
Lin
a,
David
Sprouster
a,
Yifan
Yin
a,
Yiwei
Fang
a,
Shi
Fu
a,
Sunil
Sharma
c,
Likun
Wang
d,
Chulsung
Bae
b and
Miriam
Rafailovich
*a
aDepartment of Materials Science and Chemical Engineering, State University of New York at Stony Brook, NY 11794, USA
bDepartment of Chemistry and Chemical Biology, Rensselaer Polytechnic Institute, Troy, New York 12180, USA. E-mail: baec@rpi.edu
cDepartment of Chemistry, State University of New York at Stony Brook, NY 11794, USA
dDepartment of Mechanical Engineering, University of South Carolina, SC 29208, USA
First published on 11th November 2022
Abstract
Anion exchange membranes (AEMs) are membranes with positively charged functional groups that enable anion transport. AEMs can be used as a solid ion conductor in hydrogen fuel cells, which have the potential for providing clean energy in an alkaline environment at low operating temperatures and with non-precious metals. AEMs are also used in water filtration, including in the process of desalination. As more applications of AEMs are explored, especially in non-ideal operational conditions, it is important to understand how their performance depends on the specific properties of their environment. For example, physical properties, such as shear modulus, Young's modulus, and storage modulus, can be correlated with an increased barrier to ion conduction and peak power output. This suggests that there is an optimum pH for performance because the alkaline solution interacts with the membranes to yield maximum flexibility that allows charges to flow through. In this study, meta-terphenyl fluoro-alkylene trimethylammonium (mTPN1-TMA) membranes and Sustainion membranes were incorporated in a membrane electrode assembly (MEA) operated at different flow rates: (a) 600 sccm on the anode and 1200 sccm on the cathode (b) 700 sccm on the anode and 1400 sccm on the cathode. The pH of the solution inside the MEA was measured, and the membranes’ relative surface modulus, Young's modulus, and storage modulus were measured by atomic force microscopy, Instron, and dynamic mechanical analysis, respectively. The modulus data suggest that the membrane stiffens at pH-9 and becomes more flexible at pH-10. Both mTPN1-TMA and sustainion membranes demonstrated higher power output at pH-10 suggesting that membrane flexibility is indeed necessary for ion conduction, without affecting durability. X-ray computed tomography (XCT) was performed on the cross-section of MEA to confirm the change in the thickness of the membrane owing to the different modulus at pH-9 and 10.
1. Introduction
Global concern over greenhouse gas emissions is growing with the escalating need for energy as our society becomes increasingly industrialized. Sustainable development though requires finding alternate energy sources, which are renewable, with minimal CO2 production,1–3 and whose only waste products are air and water.4–8 Polymer electrolyte membrane fuel cells are promising scalable technologies that have the potential to displace internal combustion engines in stationary power generation and transportation applications. These energy sources do not require rare or toxic catalysts, have high-power density and low start-up and operation temperatures (below 100 °C).9–12 Currently, the majority of fuel cells are based on acidic PEM,11–16 though new technologies are developing for production of fuel cells such as anion exchange membranes (AEM).17–20 In contrast to PEM fuel cells, AEM fuel cells utilize alkaline electrolytes where the cathodic oxygen reduction reaction (ORR) possesses faster kinetics compared to the acidic conditions found in PEM fuel cells.21 AEMs for energy conversion are still in the early stages of development and face many obstacles before being used commercially. A major obstacle appears to be the lower stability of the polymer membrane. The membrane is exposed to hydroxide ions in an AEM's alkaline environment, where they may damage the ionic group attached to the polymer or the polymer backbone itself. In recent AEM research, many studies have been focused on increasing ion concentration (i.e., higher ion exchange capacity) since the mobility of hydroxide ions is inherently slower than that of protons in PEMs.22 However, increasing the ion concentration also increases water sorption and can result in excessive dimensional swelling, which alters the mechanical durability of the membrane.23 Furthermore, since the membrane is also in close contact with the catalyst, changes in the structure of the membrane impacts the catalytic activity. Hence since all these factors are interelated, simultaneous studies of ionic transport, water sorption, mechanical durability, and structural integrity are necessary in order to understand the mechanism of degradation and produce an optimized AEM.In this work, we probe these properties using MEAs assembled from two types of membranes, as shown in Fig. 1 and 2, with different backbone structures and different cation species. We investigate both the surface and bulk mechanical properties of the AEMs as a function of pH using surface modulation force spectroscopy (SMFM), tensile testing, and through temperature sweeps in the dynamic-mechanical thermal analysis for determination of storage and loss moduli. Since the components of the MEA are assembled under pressure, these data are then correlated with images of the catalyst in the gas diffusion layer which are imaged using micro-XCT (X-ray computed tomography). In this manner we were able to propose a possible model which links the flexibility of polyelectrolyte polymer membranes with the ion content of the electrolyte and the power output of anion exchange membrane fuel cells, and highlight the structure/property phenomenon inherent in the design of membrane which is critical to the operation of a sustainable energy systems. This is the first direct observation of interdependence of pH, moduli and power output.
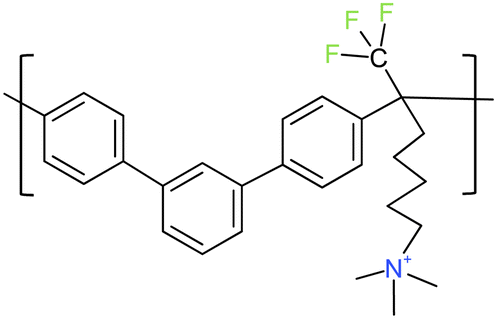 | ||
| Fig. 1 Chemical structure of mTPN1-TMA (Br-form). | ||
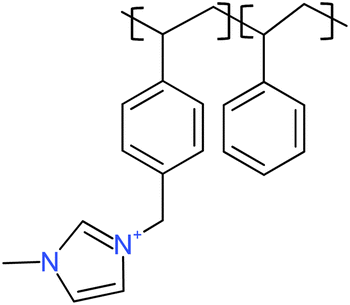 | ||
| Fig. 2 Chemical structure of Sustainion membrane. | ||
2. Experimental
2.1 Chemicals and materials
All chemicals were analytically pure and used without further purification. Poly(terphenylene) mTPN1-TMA membranes (see Fig. 1 for chemical structure) and Ionomer were prepared by the literature method.24 Sustainion membranes were bought from dioxide materials. The membrane thickness of the mTPN1-TMA membrane is 25–35 microns while for Sustainion membranes it is 50 microns. KOH pellets were purchased from Sigma Aldrich, Toray papers, Pt/C (40 wt%) were purchased from the Fuel Cells Store, H2, O2, and N2 were purchased from airgas.2.2 Catalyst layer preparation
The homogenous catalyst ink was prepared by stirring a mixture of Pt/C, mTPN1-TMA ionomer, and 2-propanol with a mass ratio of 5![[thin space (1/6-em)]](https://www.rsc.org/images/entities/char_2009.gif) :1:157. The catalyst ink was then air sprayed onto the Toray paper with microporous carbon and polytetrafluoroethylene coating and moved onto a hot stage at 85 °C with a platinum loading of 0.76 mg cm−2 for the anode and cathode.
:1:157. The catalyst ink was then air sprayed onto the Toray paper with microporous carbon and polytetrafluoroethylene coating and moved onto a hot stage at 85 °C with a platinum loading of 0.76 mg cm−2 for the anode and cathode.
2.3 MEA fabrication
The prepared anode and cathode along with the membrane were immersed in 1 M KOH for 1 h and replaced with fresh KOH every 20 minutes to ensure complete ion exchange. After 1 hour, the excess KOH was drained from the electrodes and the membrane with the help of a paper towel. The MEA was then assembled by sandwiching the AEM (mTPN1-TMA/Sustainion) between the electrodes and distributing the pressure uniformly across the MEA.2.4 Fuel cell testing
The testing was performed using 99.99% pure hydrogen at the anode and oxygen at the cathode. The gases were heated to seven degrees above the operating temperature to prevent condensation and humidified at 93% relative humidity (RH). Testing was performed using an MEA having an active area of 5 cm2 at 58 °C. Performance was measured after cell break-in at a constant voltage of 0.5 V for an hour each time before running the polarization test to purge the carbonate and bicarbonate ions.To change the pH inside the MEA, different flow rates of gases at the anode and cathode were used. For pH-9, testing was performed using pure H2 with a flow rate of 600 sccm at the anode and 1200 sccm of O2 at the cathode. For pH-10, testing was performed using pure H2 with a flow rate of 700 sccm at the anode and 1400 sccm of O2 at the cathode.
The stoich value of 7.2 was set at the anode and 16.2 at the cathode which determines the minimum flow rate. The stability test was performed by operating the test station at a constant current of 0.15 A cm−2 (corresponding to an initial voltage of ∼0.83 V).
2.5 pH measurement
For measuring the pH inside the MEA, the water coming out of the test station from the anode and cathode vent was used.2.6 Shear modulation force microscopy
The surface morphology of the mTPN1-TMA membranes at different pHs from 8 to 11 was measured using atomic force microscopy (AFM). Strips of the membrane were placed in different pH solutions for 1 hour and the modulus was measured at 3 points on the membrane while immersed in the solution.The principle of the SMFM method was described in an earlier paper.25,26 Relative surface modulus measurements were made using a Veeco/DI dimension 3000 AFM. We used the etched silicon cantilever (Digital Instrument) with a spring constant of ∼0.1 N m−1 for all measurements. A sinusoidal drive signal with a frequency of 1400 Hz was applied to the x-piezo controlling the cantilever and inducing a small oscillatory motion of the tip parallel to the sample surface. A drive frequency of 1400 Hz was chosen for the measurements because it lies in the flattest region of the response curve of the cantilever. We used a drive signal amplitude of 15 mV, which corresponds to an x-piezo displacement of 3 nm. A normal load force of 25 nN was applied to maintain tip contact with the sample. The lateral deflection of the cantilever was detected through a position-sensitive diode and was fed into a dual-phase lock-in amplifier set at the tip modulation frequency.
2.7 Dynamic mechanical analysis (DMA)
DMA was performed on a DMA Q 800 apparatus (TA instruments) in extension mode with samples of approximately 15 mm × 7 mm size. The mTPN1-TMA membrane samples were immersed overnight in KOH solutions with pH ranging from 8 to 12 before testing. The storage modulus spectra versus temperature were obtained between 30 and 65 °C.2.8 Stress–strain tests
The mechanical properties of the mTPN1-TMA membranes and sustainion membranes were investigated using Instron 3400 series single column Universal testing machine at 25 °C at a constant crosshead speed of 5 mm min−1. The membrane samples were 25 mm long and 5 mm wide. These samples were immersed overnight in KOH solutions with pH ranging from 8 to 12 before testing.2.9 Electrochemical measurements
Electrochemical measurements were carried out using a Biologic P200 Potentiostat before and after the durability test. To that end, cyclic voltammetry (CV) and electrical impedance spectroscopy (EIS) measurements were performed in an inert nitrogen gas atmosphere on the working electrode. Cell activation was carried out in the same manner as the performance test described above at 60 °C with H2 and O2 gas flows at 93% relative humidity. A gas change was initiated for 1 h, changing the gas flow on the working electrode from oxygen to nitrogen to create an inert gas atmosphere. The H2 flow was fixed at 200 sccm while the N2 flow was 75 sccm. After 1 h, a 10-min potentiostatic hold at 0.5 V was performed to reduce residual oxygen lingering in the electrode compartment. After the gas change was completed, five cyclic voltammetry sweeps were performed at 50 mV s−1 scan rate, in a cell voltage range from 0.1–0.9 V. Five additional cyclic voltammetry sweeps were performed subsequently at 100 mV s−1 scan rate and otherwise identical conditions. Afterwards, the EIS measurement was carried out potentiostatically at 0.4 V, with an AC-amplitude of 5 mV, in a frequency range from 20 kHz to 1 Hz at a rate of 10 steps taken per decade. This procedure for CV was repeated after the durability test.2.10 X-ray computed tomography (XCT)
Full-field X-ray computed tomography data sets were collected for a series of the cross-section of MEAs after operating at pH-9 and 10 for 5 h, employing a Zeiss Xradia 520 Versa X-ray microscope. The X-ray source was operated at 40.20 kV and 74.7 μA (3 W). The isotropic voxel size was set to 2.1 μm and a series of 1601 projections were collected over 360° with a 2.5 s image collection time per step. Data reconstruction was performed using a filtered back-projection algorithm. Data was visualized in ImageJ software.3. Results and discussion
3.1 Shear modulation force microscopy
The principle of SMFM was discussed in some early papers25,27,28 and the tip-surface interaction is shown in Fig. 3. In our measurements, a small fixed sinusoidal drive signal, ΔXp, was applied to the x-piezo in a direction perpendicular to the fast scan direction, inducing a small oscillatory motion of the cantilever tip parallel to the sample surface. At the same time, a normal force was applied to maintain tip contact with the sample. The lateral deflection amplitude of the cantilever, ΔX, which is proportional to the torsion of the cantilever, ΔXlever, can be measured using a lock-in amplifier, tuned to the drive frequency.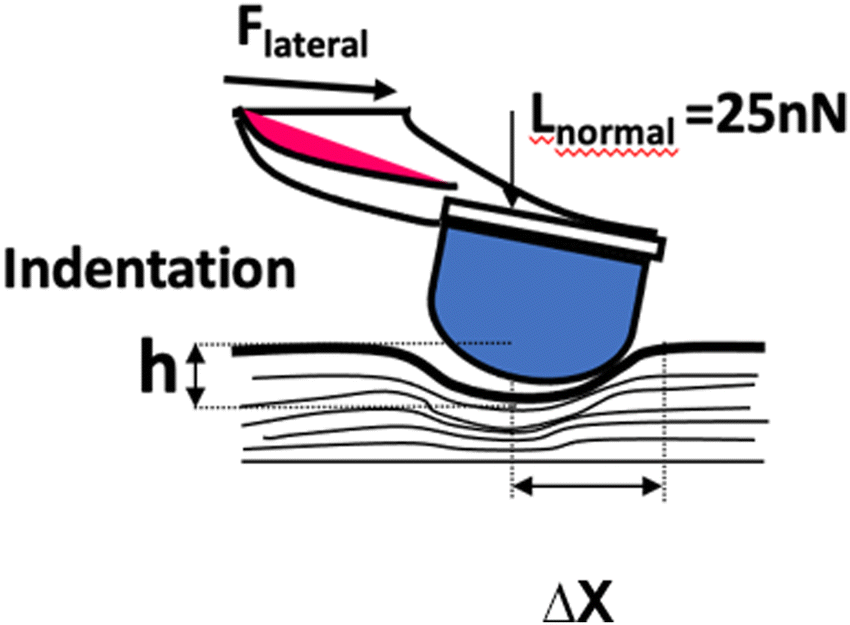 | ||
| Fig. 3 Tip-surface interaction in SMFM. | ||
The indentation of an elastic substrate by a hard spherical tip of radius R, h, is given in the Hertz model29 by
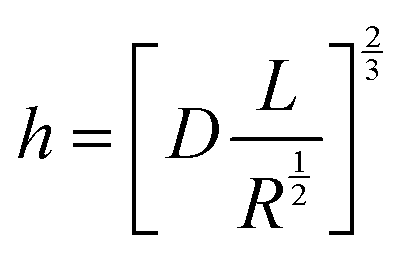 | (1) |
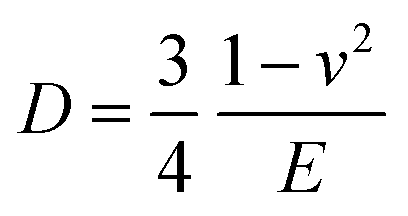 | (2) |
| E = 2(1 + ν)G | (3) |
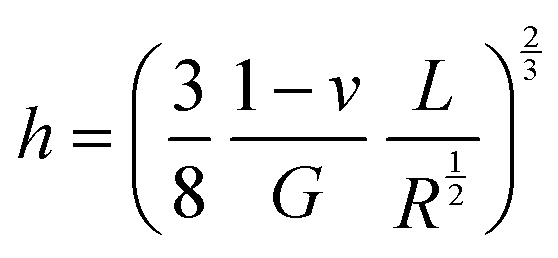 | (4) |
The lateral deflection, ΔX, or the response amplitude plotted against the drive amplitude for the mTPN1-TMA membrane immersed in different pH, is shown in Fig. 4.
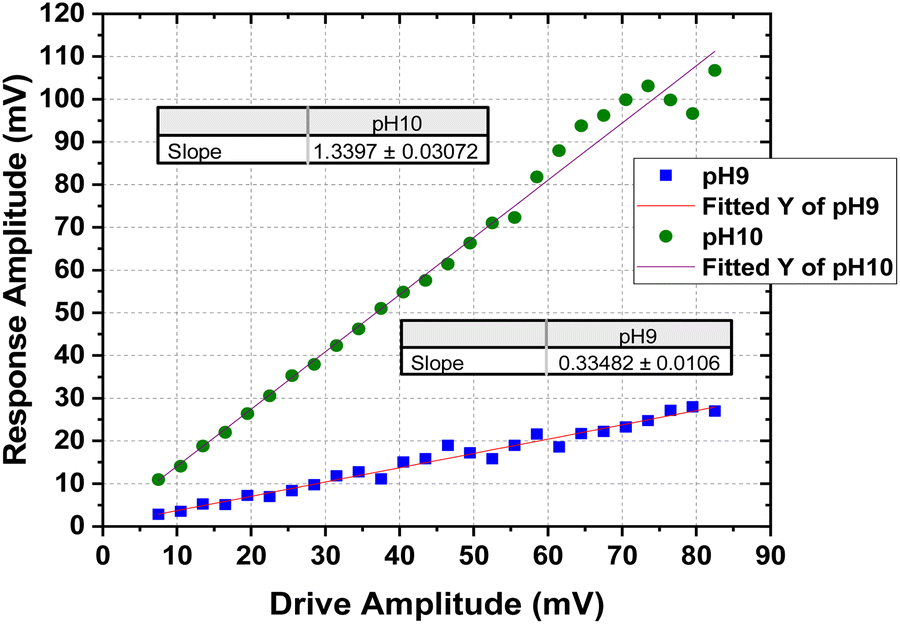 | ||
| Fig. 4 Response Amplitude of the mTPN1-TMA membranes as a function of drive amplitude at pH-9 and pH-10. | ||
Therefore, we have,

The relative surface modulus as a function of pH is plotted in Fig. 5.
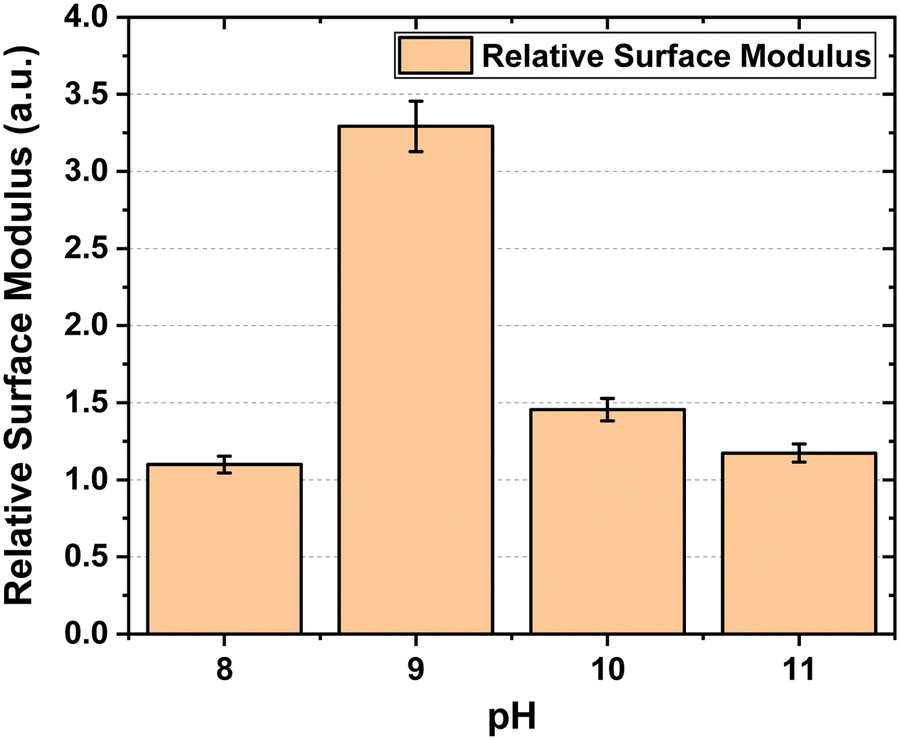 | ||
| Fig. 5 Relative shear modulus at pH-8, 9, 10, 11 for mTPN1-TMA membranes. | ||
Surface modulus data shows us that the membrane hardens significantly at pH-9 as compared to other pH solutions. At higher pH, the increased concentration of OH− ions leads to higher water content and thus has a plasticizing effect on the membrane reducing its stiffness.
3.2 Dynamic mechanical analysis
DMA curves for the mTPN1-TMA membranes in different pH conditions are shown in Fig. 6. The storage modulus is represented versus temperature. This representation shows us that it remains constant over the temperature range of 30 to 65 degrees. At 60 degrees, which is the operating temperature of the fuel cell, it can be seen that pH-9 shows us the highest storage modulus which means the membrane exhibits higher stiffness at pH-9 as compared to other pHs, supporting the surface modulus data.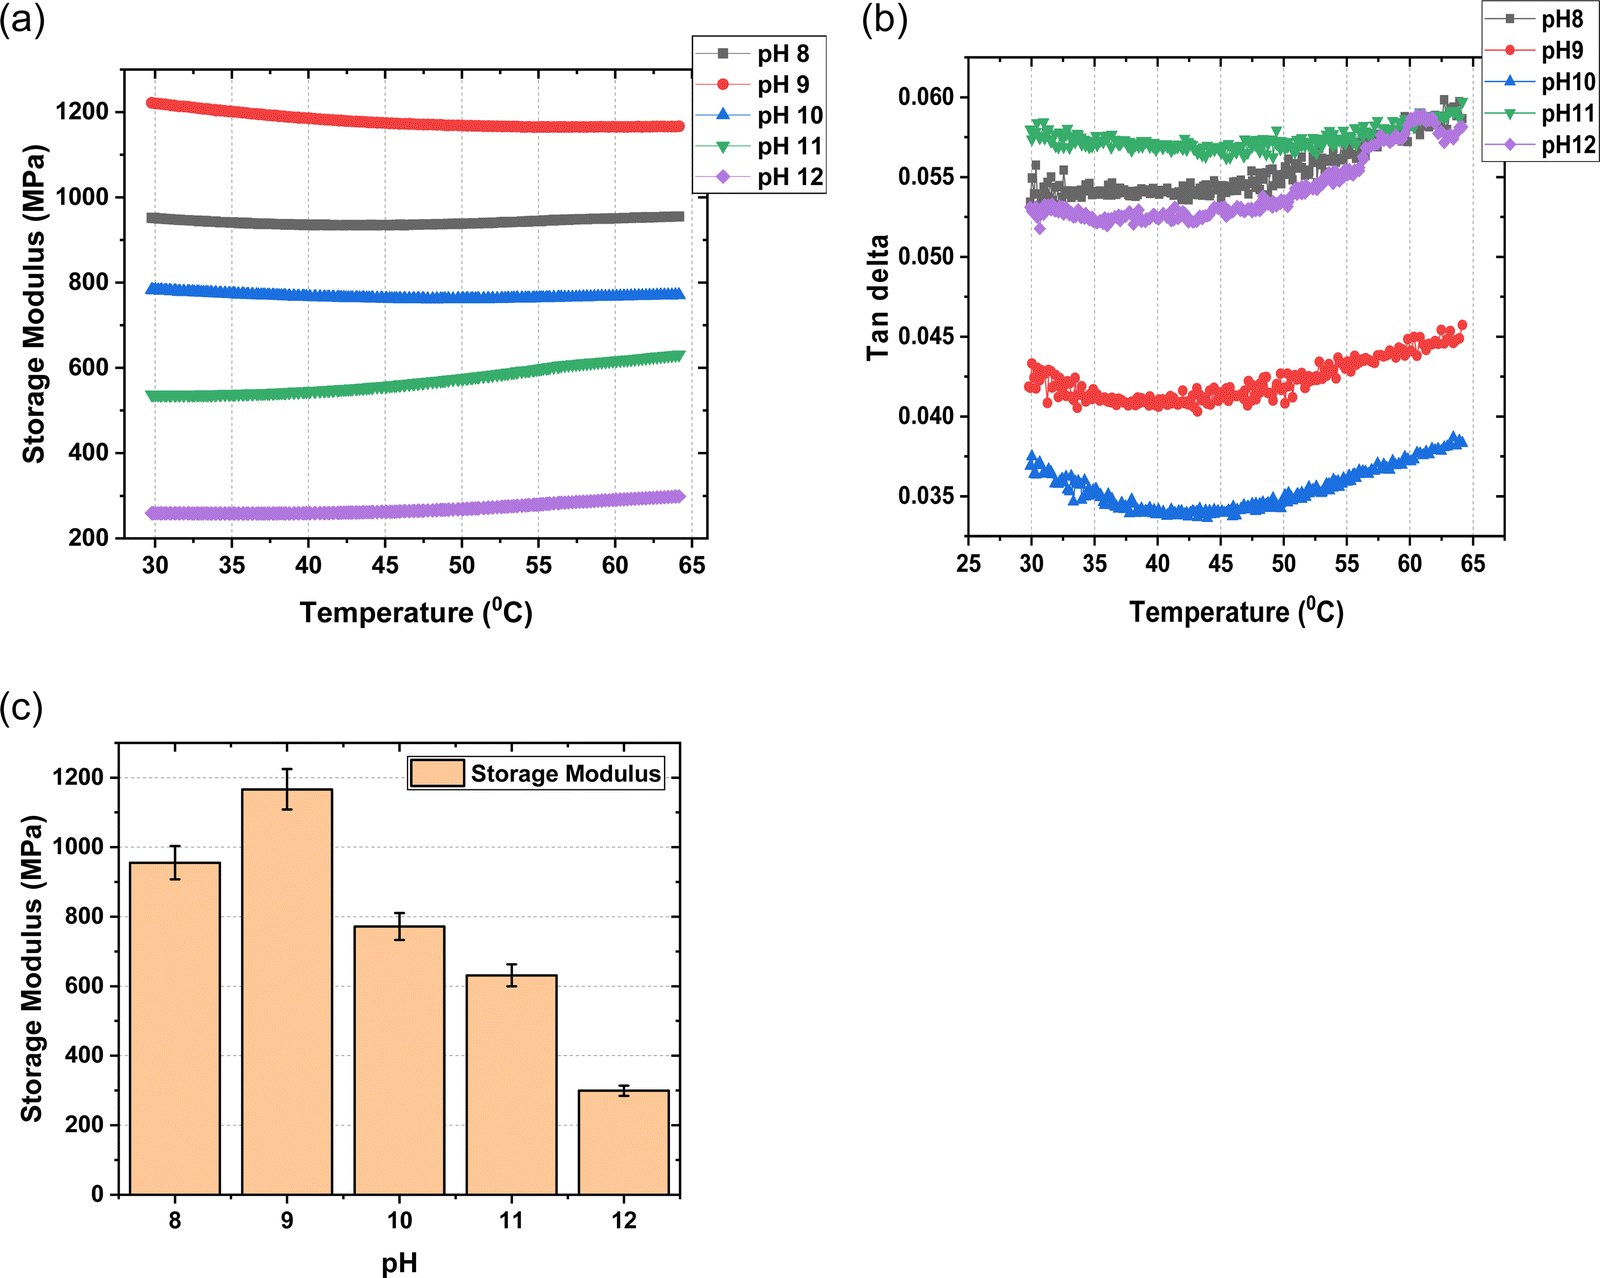 | ||
| Fig. 6 Comparison of DMA curves for mTPN1-TMA membranes at different pHs. | ||
At pH > 9, there is an increase in the water content of the membranes. This increase is due to the absorption of the highly hydrated OH− ions. At higher pHs, the concentration of OH− ions in membranes increases significantly thus hydrating the membrane even more.
Sorption of water into the polymer can have a plasticizing effect on the membrane, which is quantified by increases in elasticity and elongation as well as a reduction in membrane strength.30,31 Generally, the water uptake is proportional to ion exchange capacity, and the water uptake can be translated to the number of water molecules associated with each cationic group.
3.3 Instron
Fig. 7 represents stress–strain test curves obtained with mTPN1-TMA membranes and sustainion membranes in different pH KOH solutions from 8 to 12. The elastic modulus, E, was determined from the slope of the linear part of the curve, where the elastic behavior of the polymer is observed. Toughness was calculated from the area under the stress–strain curve. The maximum elastic modulus was of the order of 0.5 GPa at pH-9 and pH-10 for mTPN1-TMA membranes. At pH-10, the membrane demonstrated the highest toughness.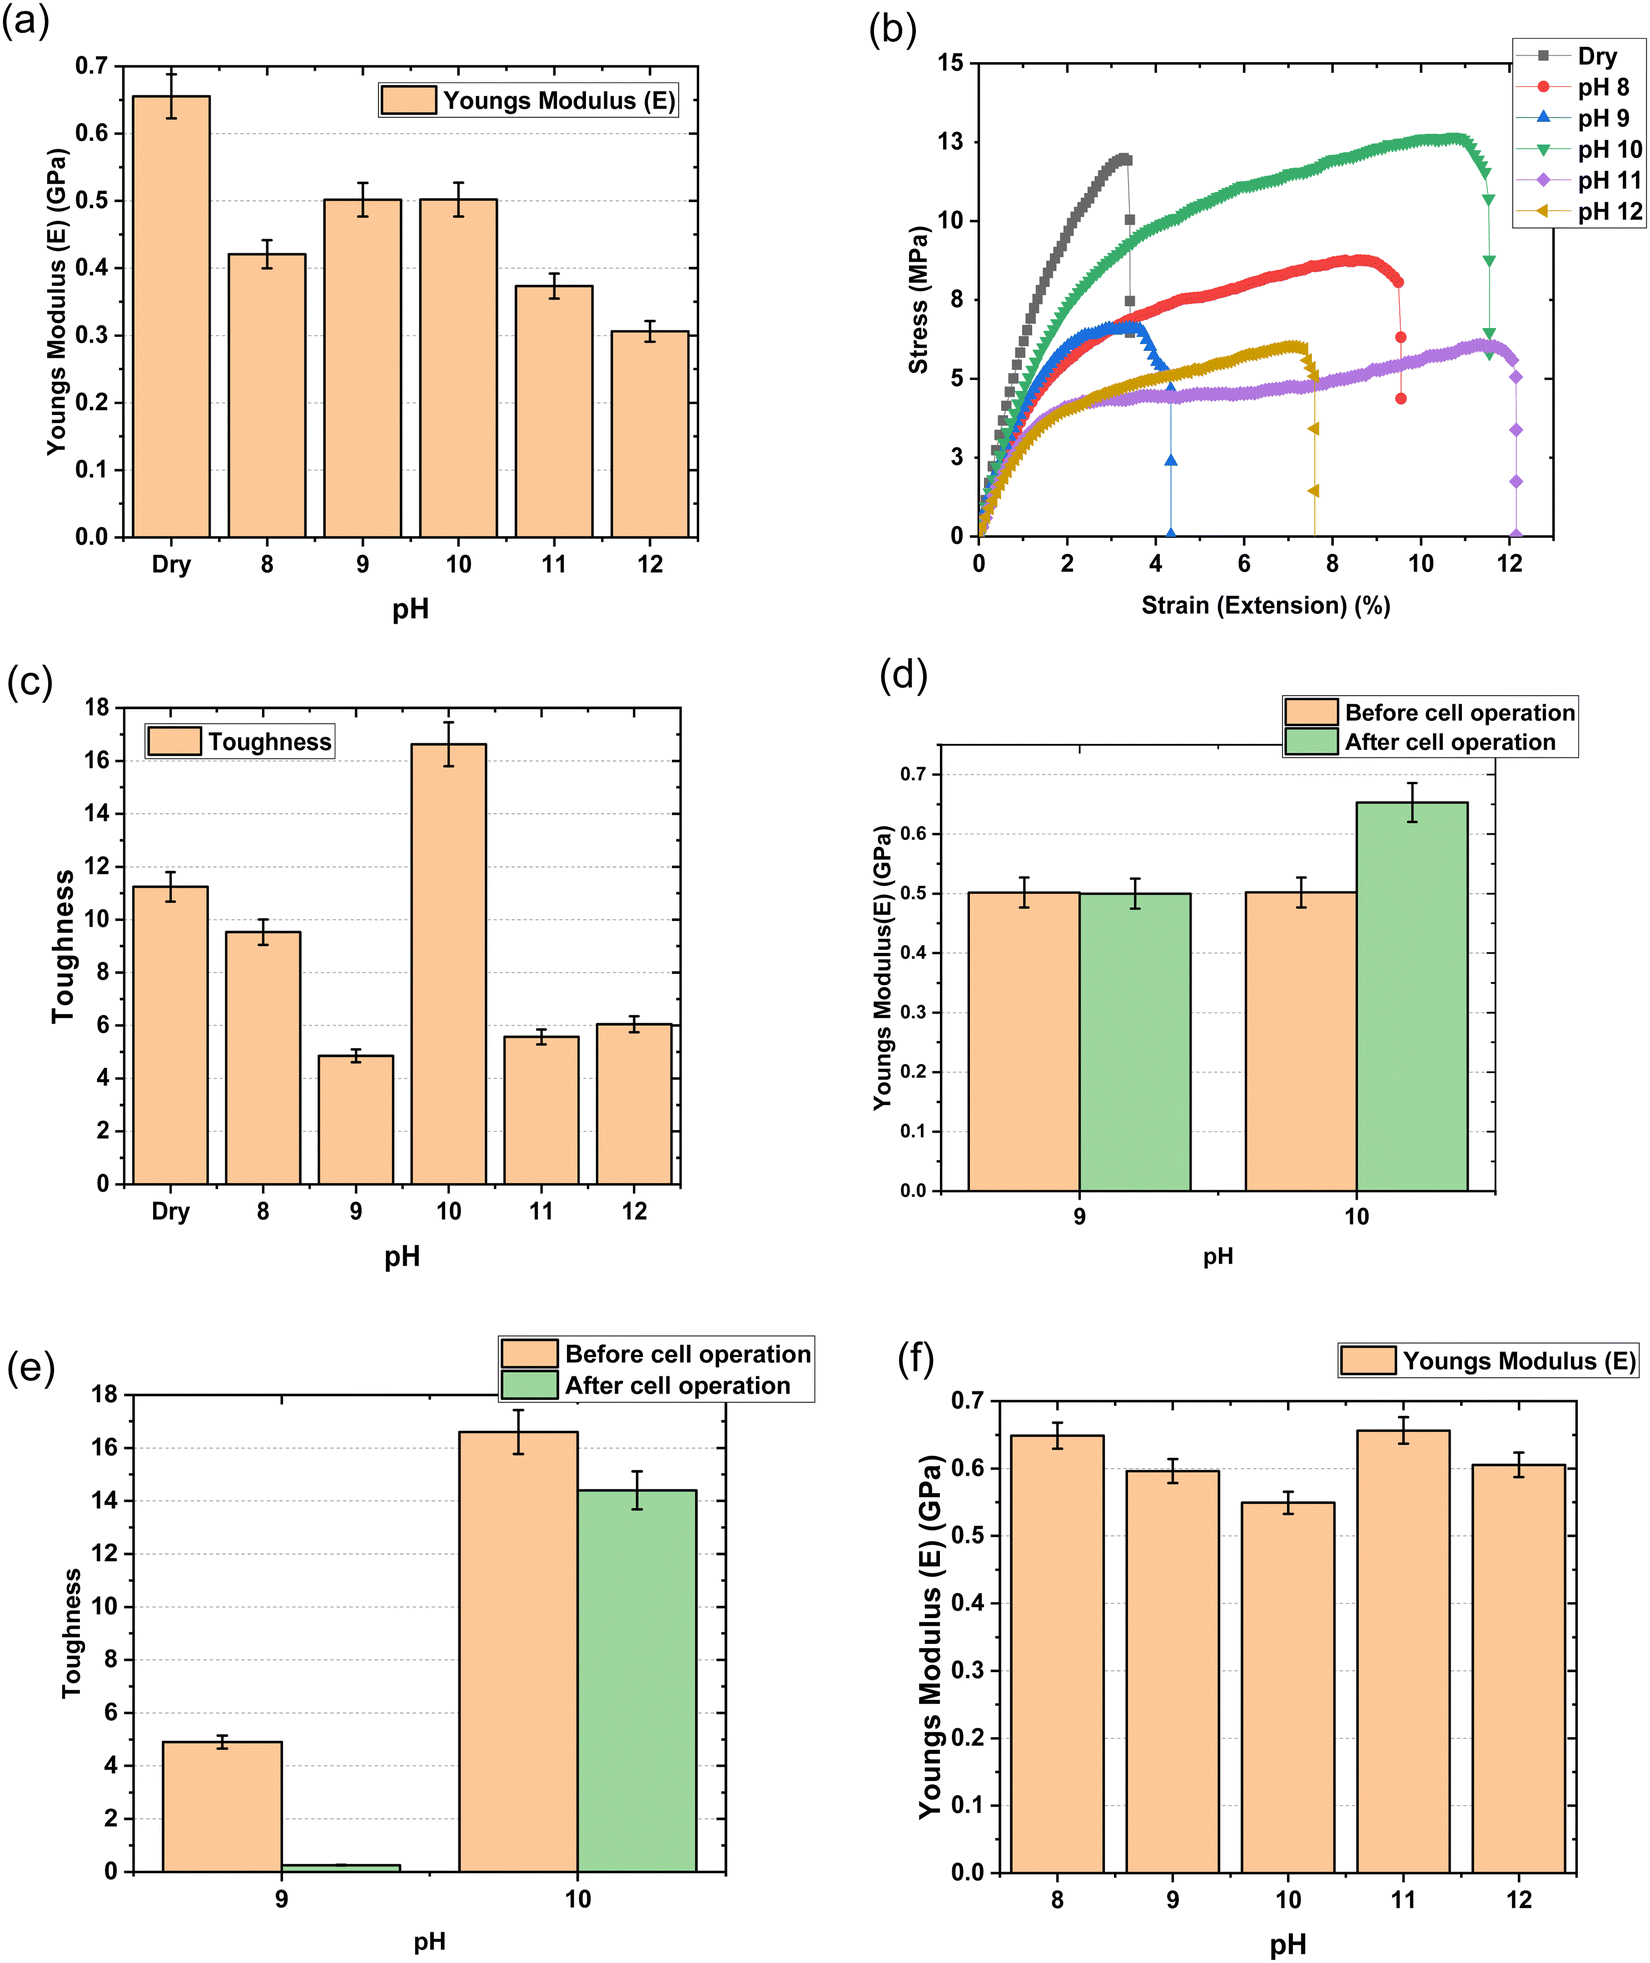 | ||
| Fig. 7 For mTPN1-TMA membranes (a) Youngs Modulus vs. pH (b)Typical stress–strain curves at different pH (c) Toughness vs. pH (d) Youngs modulus at pH-9 and 10 before and after the cell operation and (e) Toughness at pH-9 and 10 before and after the cell operation (f) Youngs modulus vs. pH for Sustainion membranes. | ||
The elastic modulus for Sustainion membranes was of the order of 0.6 GPa at pH-9 which was higher than at pH-10 which supports the claim of membranes being stiff at pH-9.
For the chemical stability test, the mTPN1-TMA membrane was assembled in the fuel cell test station and tested at a constant current of 0.15 mA cm−2 current density where it lasted about 20 hours.
After cell operation, the mechanical properties were tested, where it shows that the modulus doesn’t change for pH-9 but it increases at pH-10. The toughness of the membrane decreases a lot after testing at pH-9 while it decreases slightly for pH-10.
3.4 Fuel cell test
The assembled MEAs were then inserted into the fuel cell test station and the flow rates of hydrogen and oxygen were varied to change the pH inside the MEA. The maximum power output for the mTPN1-TMA membrane at pH-9 was 0.34 W cm−2 while it was 0.57 W cm−2 for the MEA at pH-10. And the same trend was observed with the Sustainion membrane where the power output was higher at pH-10 with the power density of 0.55 W cm−2 while at pH-9 it was 0.33 W cm−2 (Fig. 8). The relationship between current density and pH was also studied in order to estimate the effect of current on the pH of the water exiting the cell and is discussed in ESI,† Section 1.1.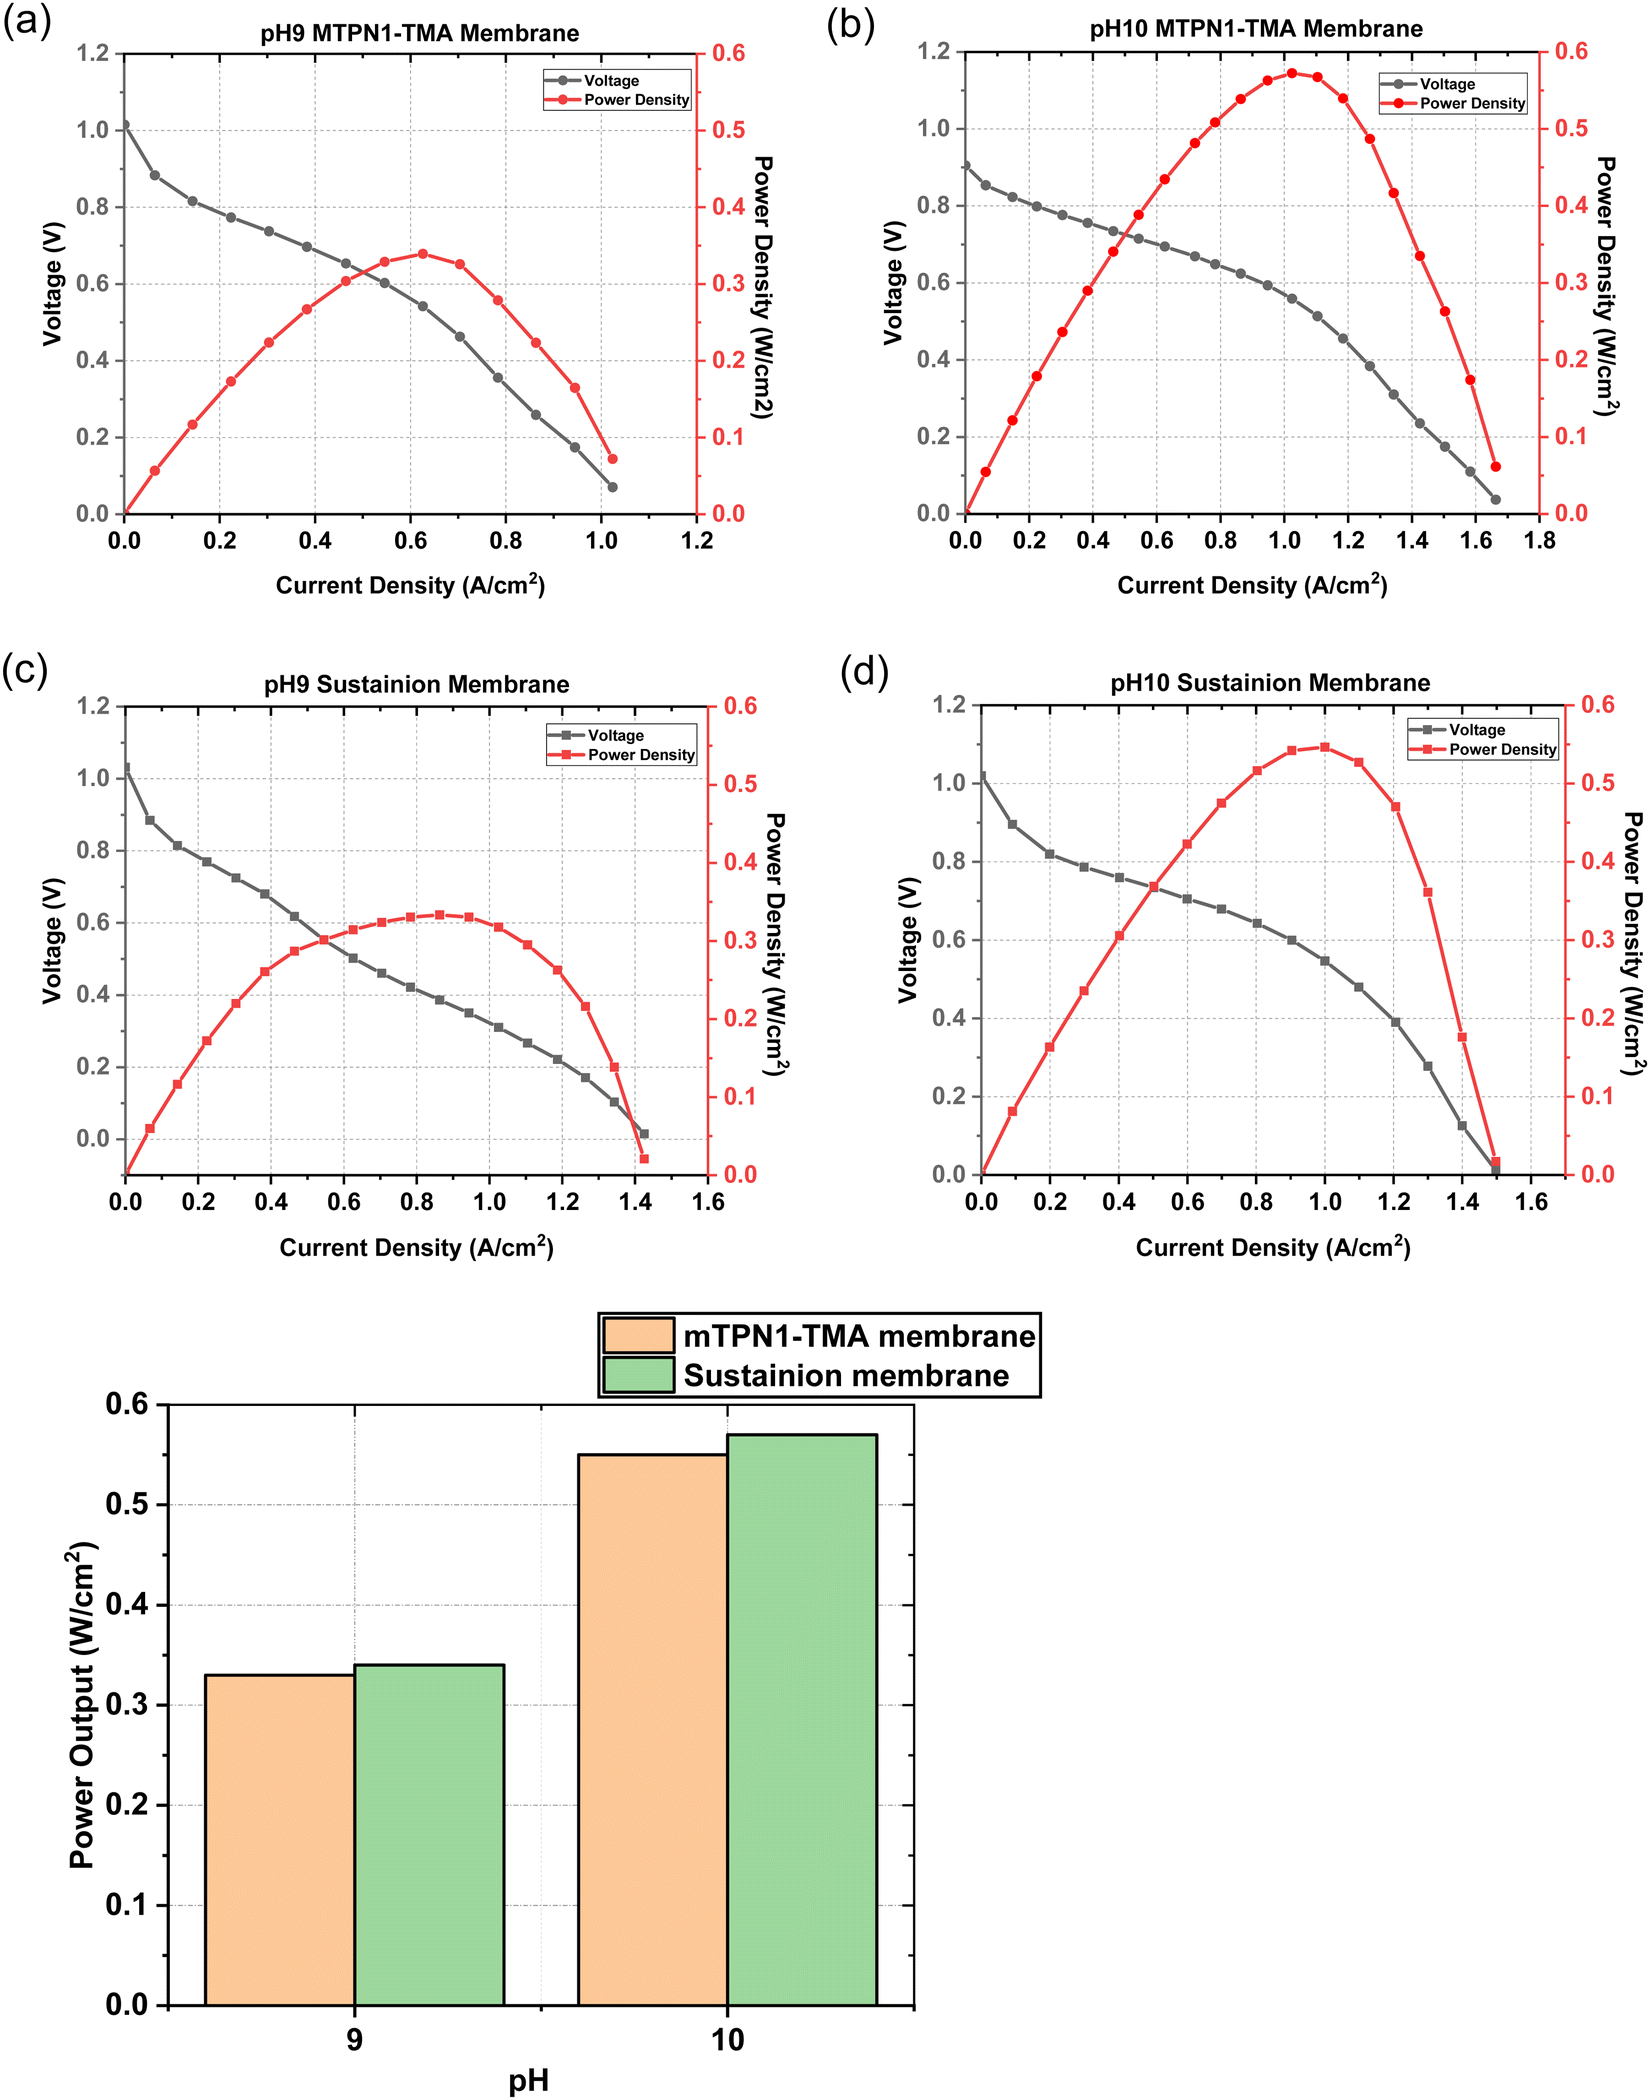 | ||
| Fig. 8 Polarization Curves for (1) mTPN1-TMA membranes at (a) pH-9 (b) pH-10 and for (2) Sustainion membranes at (c) pH-9 (d) pH-10 (3) Power output vs. pH for mTPN1-TMA membranes and Sustainion membranes. | ||
As it can be seen from Fig. 9, the mTPN1-TMA membranes lasted about 20 hours before dropping below 0.1 V while the Sustainion membrane lasted around 63 hours at pH-9 and around 72 hours at pH-10. The current density was kept constant at 0.15 A cm−2.
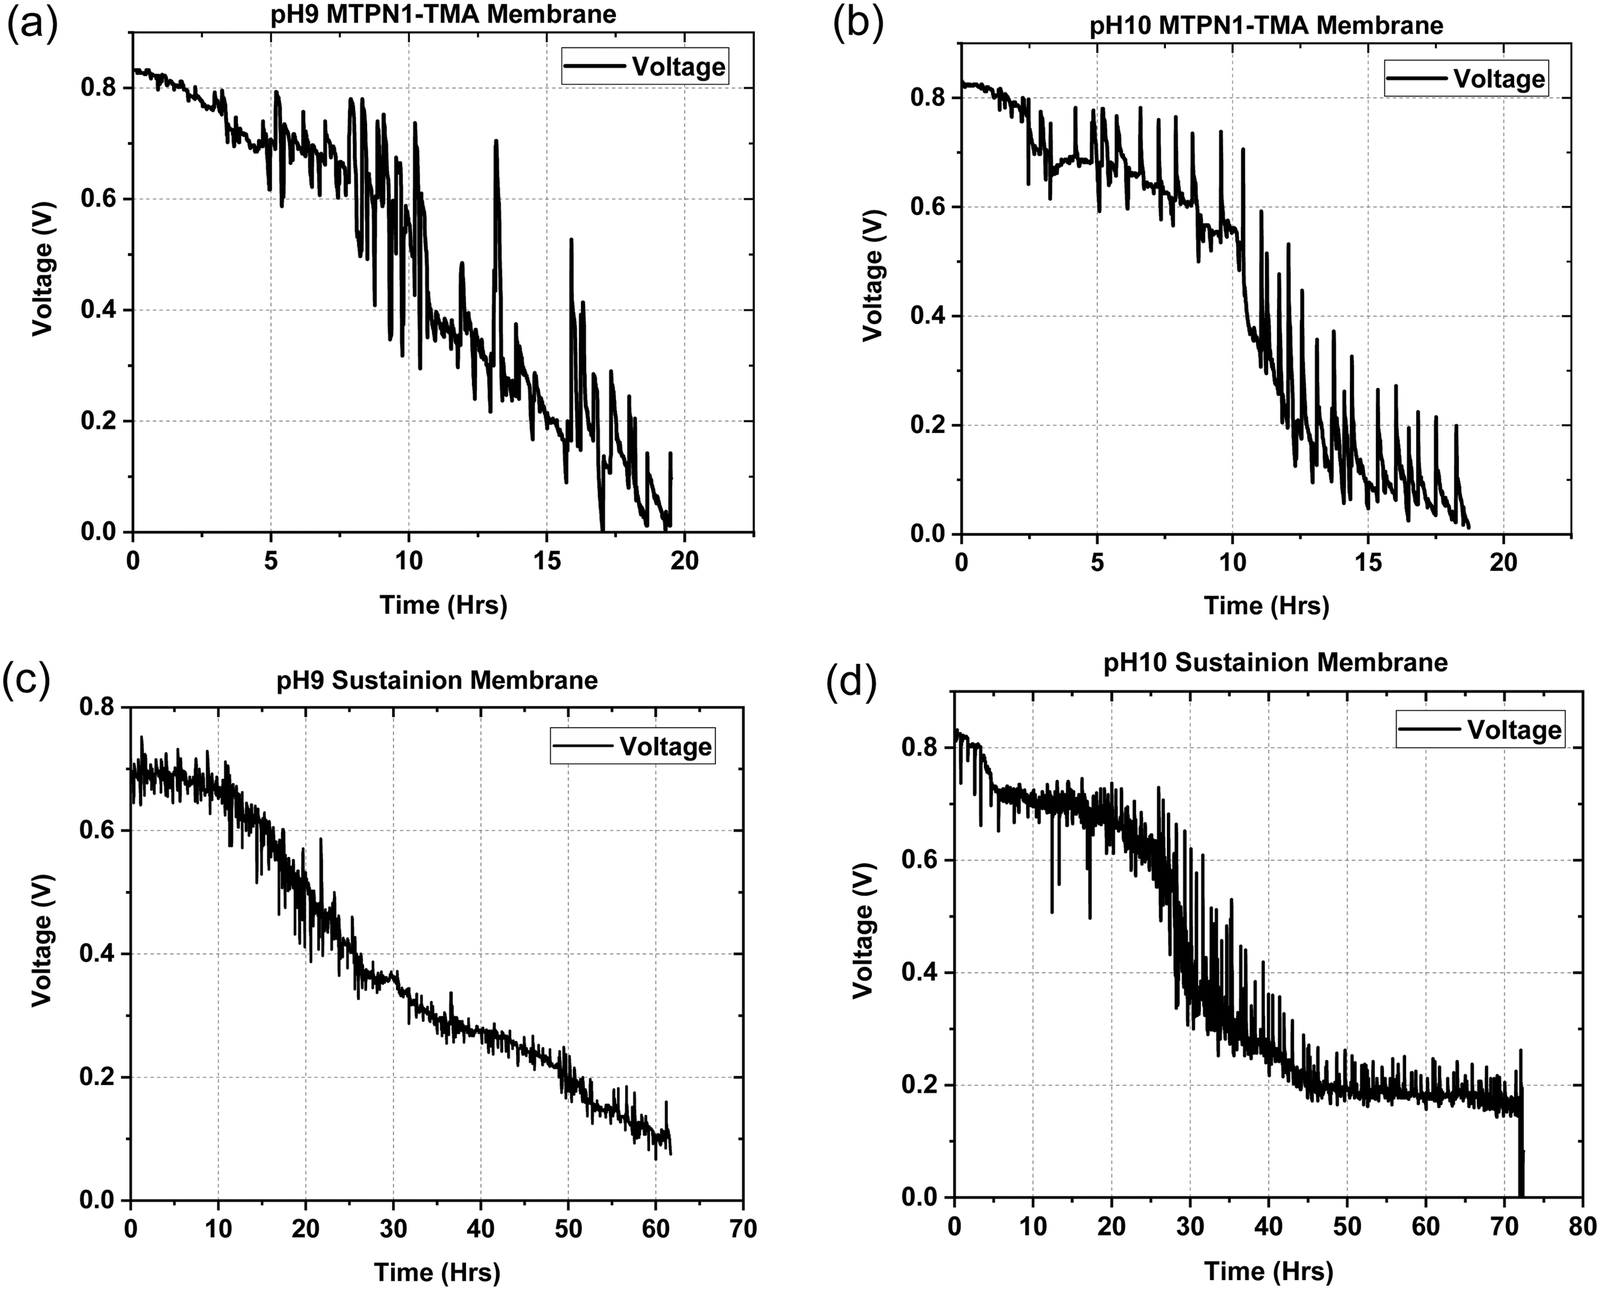 | ||
| Fig. 9 Durability data for (1) mTPN1-TMA membranes at (a) pH-9 (b) pH-10 (2) Sustainion membranes at (c) pH-9 (d) pH-10 at a constant current density of 0.15 A cm−2. | ||
The Sustainion membrane was found to be more chemically stable than the mTPN1-TMA membrane where EIS and CV measurements before and after the durability test are discussed in the ESI,† Section 1.2 indicate more rapid degradation of the Pt catalyst for this might be because of the imidazolium functionalized Sustainion membrane which has shown excellent alkaline stability probably due to the resonance effect of the conjugated imidazole rings, which weakens the interaction of imidazolium groups and the hydroxide while quaternary ammonium functionalized mTPN1-TMA membranes degraded faster because of the nucleophilic substitution reaction.32 Hence, pH did not affect the durability of either membrane.
3.5 Electrochemical measurements
The EIS measurements for both mTPN1 and sustainion membranes at pH 9 and 10 in Fig. 10 suggest that the ohmic resistance of the cell is 0.17 Ω at pH 10 for both membranes while the resistance is higher i.e., 0.21 Ω for mTPN1-TMA and 0.19 Ω for sustainion membranes at pH 9. Both membranes experience higher resistance at pH9.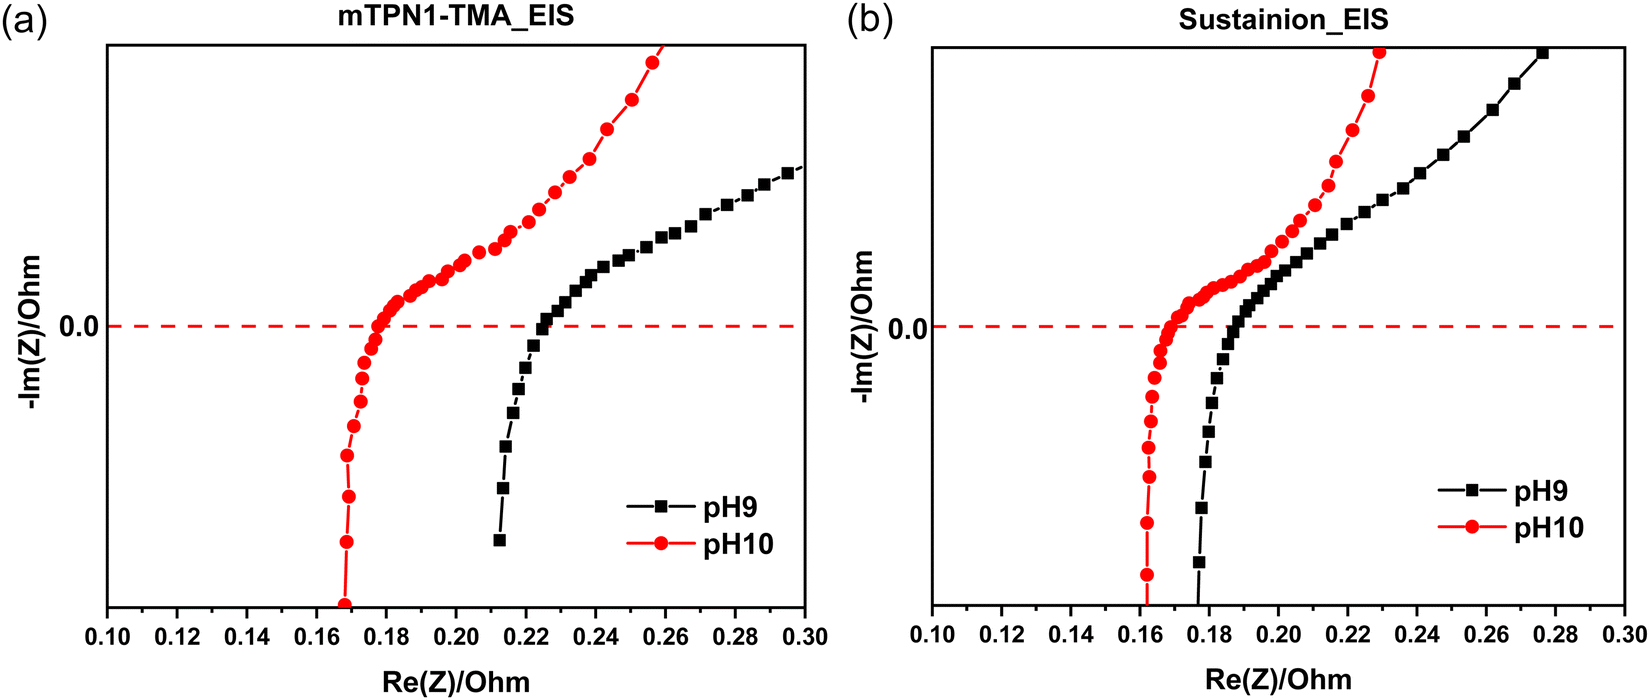 | ||
| Fig. 10 EIS spectra of AEMFC in inert gas (a) mTPN1-TMA membrane (b) sustainion membrane at pH9 and pH10. | ||
3.6 X-ray computed tomography
X-ray computed tomography was conducted on the MEAs assembled with both membrane samples after operating for 5 h under the conditions described in Section 2.4 and at pH of 9 and 10. These grayscale XCT images depict the anode and cathode catalyst layers (white depicts the Platinum catalyst layer) and the membrane sandwiched between them. XCT images of the cross-section of the MEA after the test can be seen in Fig. 11 along with the thickness of the membranes measured using the ImageJ software. Both sets of MEAs were assembled with equal force of 10-pound inch. The original thickness of both membranes was 50 microns, which was reduced to 44 and 42 microns, respectively for the mTPN1-TMA and sustainion polymers. Increasing the operational pH further reduced the thickness to 35 and 36 microns, where the reduction in thickness scales roughly with the decreased moduli measured as a function of pH.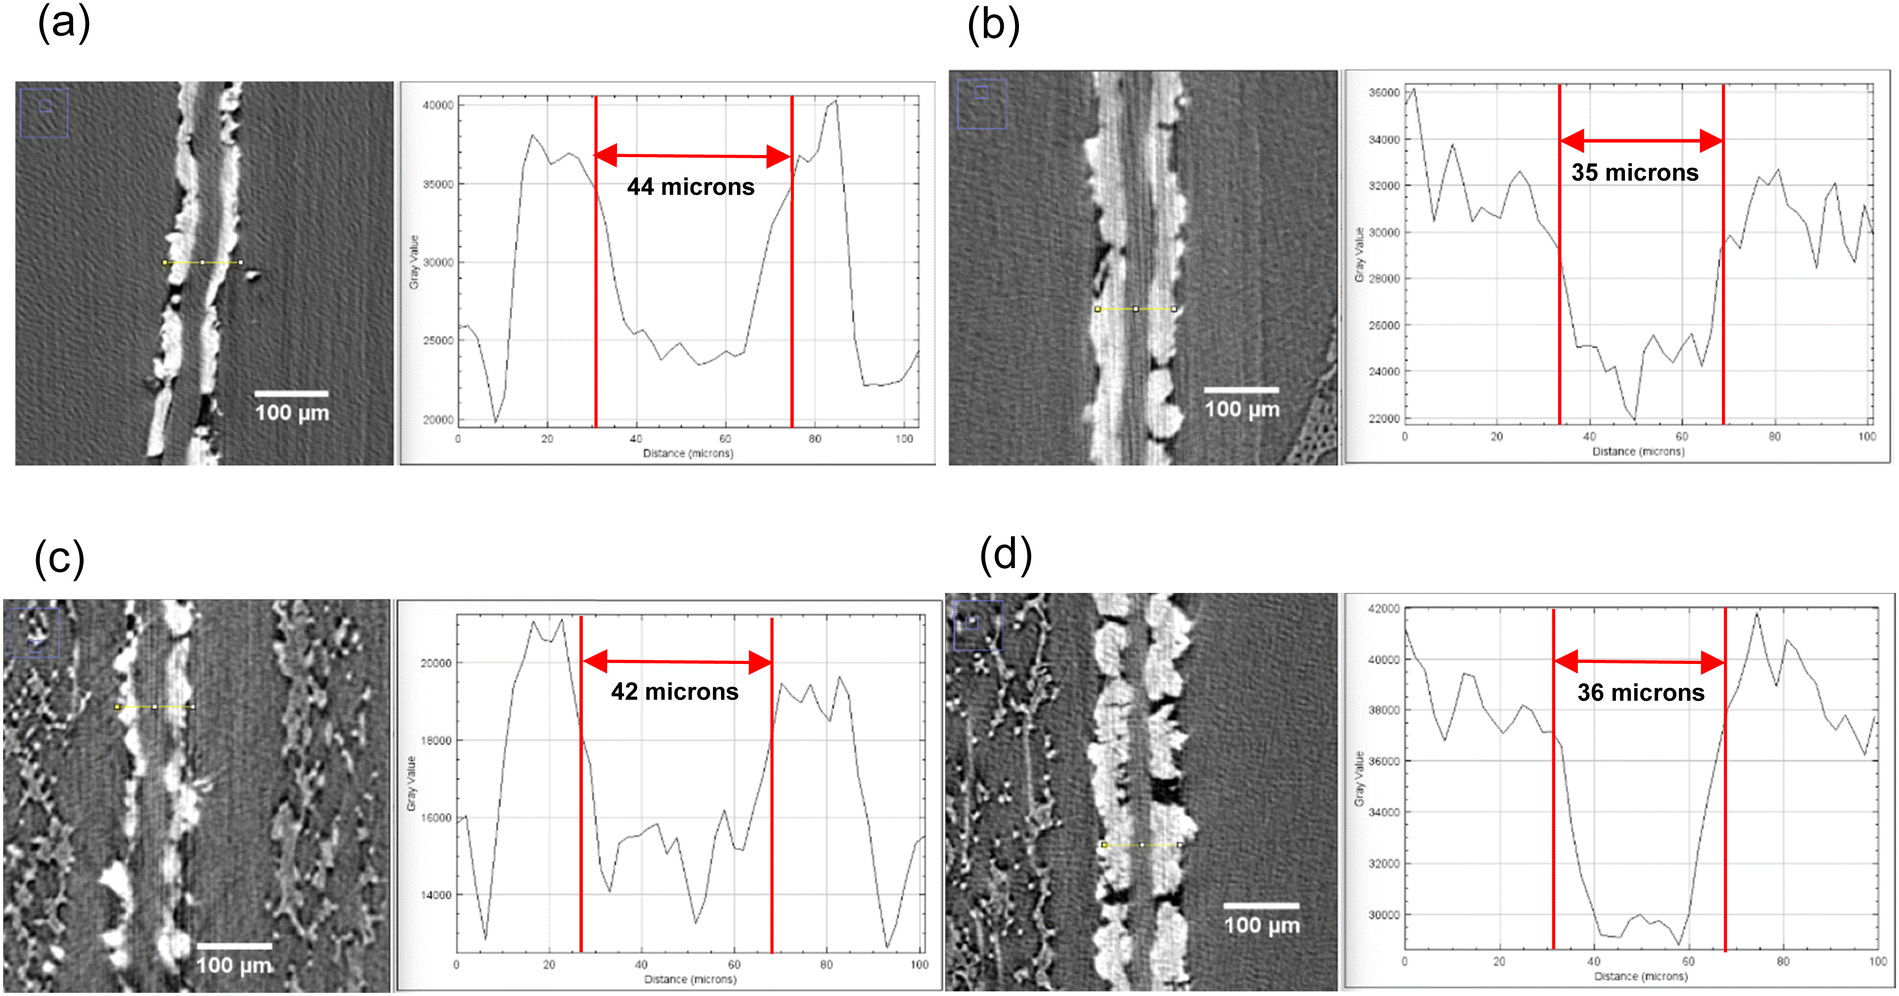 | ||
| Fig. 11 X-ray computed tomography images (1) cross-section of the MEA with mTPN1-TMA membranes at (a) pH-9 (b) pH-10 and (2) cross-section of the MEA with Sustainion membranes at (c) pH-9 (d) pH-10. | ||
The resistivity of membranes is tabulated in Table 1, where we can see that the decrease in membrane thickness scales directly with the decreased resistivity as measured using EIS. In ref. 33 and 34, an empirical model of ionic resistivity of membrane Rions was developed as a function of the membrane specific resistivity Rm, membrane active area A and thickness of membrane l. Rm is a function of cell temperature, current, membrane active area Afc.
 | (5) |
| Ohmic resistance at pH-9 (Ohm) | Ohmic resistance at pH-10 (Ohm) | |
|---|---|---|
| mTPN1-TMA membrane | 0.21 | 0.17 |
| Sustainion membrane | 0.19 | 0.17 |
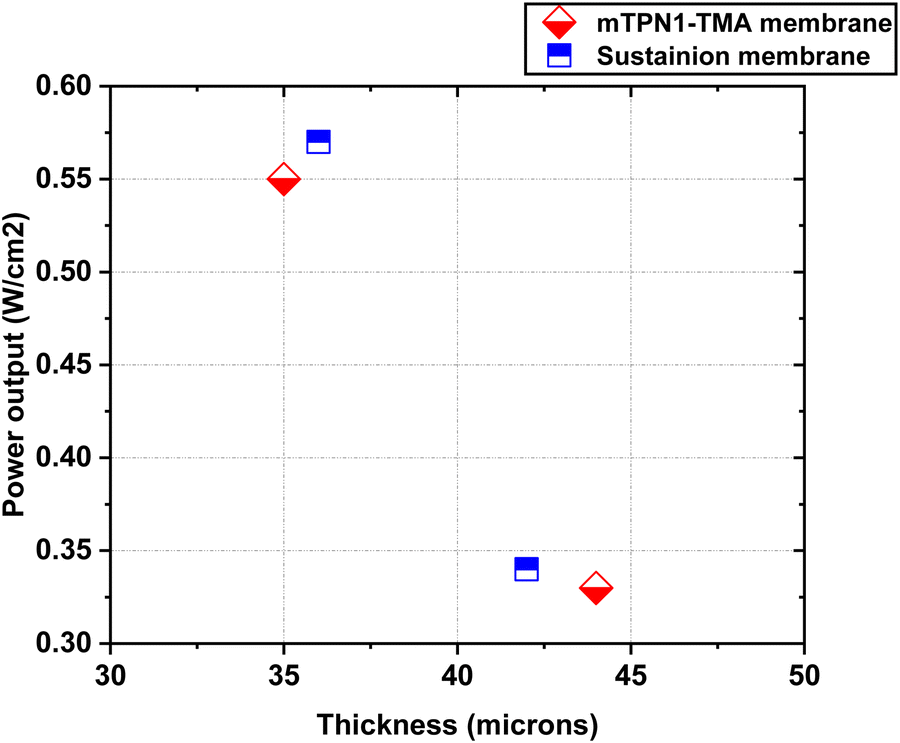 | ||
| Fig. 12 Power output of both mTP1-TMA membranes and sustainion membranes at different thickness caused by pH. | ||
Thus, the flexibility of the membrane allows the membrane to be squeezed more while operating, thus allowing higher ion conduction and higher power output.
4. Conclusion
We have successfully studied the dependence of mechanical properties and fuel cell performance on the pH inside the MEA. The surface morphology of the mTPN1-TMA was studied using shear modulation force microscopy which revealed that the relative surface modulus for mTPN1-TMA membranes at pH-9 was higher than at pH-10. DMA and stress–strain tests of the mTPN1-TMA and Sustainion membranes showed the same trend that the membrane has higher stiffness at pH-9. The reason for this is the increase in the water content of the membranes with increasing pH due to the absorption of highly hydrated OH− ions. Since the flexibility of the membrane is one of the parameters required for the free flow of ions, at pH-9 a lower power output (around 0.34 W cm−2) was demonstrated as compared to that at pH-10 (around 0.56 W cm−2) for both the membranes. The mTPN1-TMA membrane is found to be less stable than Sustainion membranes at a constant current density of 0.15 mA cm−2 possibly due to the excellent alkaline stability of the imidazolium functionalized sustainion membranes. Also, the deterioration in the mechanical properties was found to be higher at pH-9 after the chemical stability test. This shows us that pH has an effect on the mechanical properties of the anion exchange membrane and at pH-10, the membranes display better mechanical strength and have higher power output. The X ray-computed tomography images show that membranes operated at pH-10 have smaller membrane thickness as compared to the membranes operated at pH-9 for 5 h operation suggesting that the membranes become more flexible at pH-10 and hence are more easily compressed. EIS measurements indicated a reduction of 10.5% and 19% for sustainion and mTPN1-TMA membranes in the resistivity of the membranes when the operating pH was increased from 9 to 10 which was consistent with reductions of 6 and 9 microns in membrane thickness, in excellent agreement with the empirical model. Since membranes with lower thickness value provide less resistance to the flow of ions, the membranes at pH-10 demonstrated higher power output as compared to those operated at pH-9. This information can be very helpful in the design of next-generation membranes which can increase power output and improve durability.Author contributions
Aniket Raut: Data curation, formal analysis, investigation, methodology, validation, writing – original draft. Haoyan Fang: formal analysis, investigation, validation. Yu-Chung Lin: formal analysis, methodology. David Sprouster: formal analysis, methodology, software. Yifan Yin: formal analysis, methodology. Yiwei Fang: formal analysis, software. Shi Fu: methodology. Sunil Sharma: methodology. Likun Wang: formal analysis. Chulsung Bae: formal analysis, resources. Miriam H. Rafailovich: conceptualization, formal analysis, supervision, writing – review & editing.Conflicts of interest
There are no conflicts to declare.Acknowledgements
This work was supported by the Department of Navy award [N00014-29-1-2858] issued by the Office of Naval Research. The authors acknowledge the access to the facilities at Advanced Energy Research and Technology Center (AERTC) at Stony Brook University.References
- A. Baccioli, et al., Potential energy recovery by integrating an ORC in a biogas plant, Appl. Energy, 2019, 256, 113960 CrossRef CAS.
- G. Frate, et al., Ramp rate abatement for wind power plants: A techno-economic analysis, Appl. Energy, 2019, 254, 113600 CrossRef.
- H. Kopnina, The victims of unsustainability: a challenge to sustainable development goals, Int. J. Sustainable Dev. World Ecology, 2016, 23(2), 113–121 CrossRef.
- M. K. Debe, Electrocatalyst approaches and challenges for automotive fuel cells, Nature, 2012, 486(7401), 43–51 CrossRef CAS PubMed.
- H. Zhang, et al., Enhancing fuel cell durability for fuel cell plug-in hybrid electric vehicles through strategic power management, Appl. Energy, 2019, 241, 483–490 CrossRef.
- Z. P. Cano, et al., Batteries and fuel cells for emerging electric vehicle markets, Nat. Energy, 2018, 3(4), 279–289 CrossRef.
- M. Vujanović, et al., Recent progress in sustainable energy-efficient technologies and environmental impacts on energy systems, Appl. Energy, 2021, 283, 116280 CrossRef.
- J. N. Behera, A. Padhy and A. K. Samantara, Cobalt pyrophosphate (Co2P2O7) derived from an Open-Framework Cobalt Phosphite: A Durable Electroactive Material for Electrochemical Energy Conversion and Storage Application, Sustainable Energy Fuels, 2021, 5(14), 3729–3736 RSC.
- B. C. Steele and A. Heinzel, Materials for fuel-cell technologies, in Materials for sustainable energy: a collection of peer-reviewed Research and review articles from nature publishing group, 2011, World Scientific, pp. 224–231 Search PubMed.
- B. Smitha, S. Sridhar and A. Khan, Solid polymer electrolyte membranes for fuel cell applications—a review, J. Membr. Sci., 2005, 259(1–2), 10–26 CrossRef CAS.
- L. Wang, et al., Operation of proton exchange membrane (PEM) fuel cells using natural cellulose fiber membranes. Sustainable, Energy Fuels, 2019, 3(10), 2725–2732 CAS.
- L. Wang, et al., Enhancing proton exchange membrane fuel cell performance via graphene oxide surface synergy, Appl. Energy, 2020, 261, 114277 CrossRef CAS.
- M. P. Rodgers, et al., Fuel cell perfluorinated sulfonic acid membrane degradation correlating accelerated stress testing and lifetime, Chem. Rev., 2012, 112(11), 6075–6103 CrossRef CAS.
- M. A. Hickner, et al., Alternative polymer systems for proton exchange membranes (PEMs), Chem. Rev., 2004, 104(10), 4587–4612 CrossRef CAS.
- O. T. Holton and J. W. Stevenson, The role of platinum in proton exchange membrane fuel cells, Platinum Met. Rev., 2013, 57(4), 259–271 CrossRef.
- S. K. Sharma, et al., Nitro-oxidized Carboxylated Cellulose Nanofibers based Nanopaper and their PEM Fuel Cell Performance, Sustainable Energy Fuels, 2022, 6(15), 3669–3680 RSC.
- M. A. Hickner, A. M. Herring and E. B. Coughlin, Anion exchange membranes: current status and moving forward, J. Polym. Sci., Part B: Polym. Phys., 2013, 51(24), 1727–1735 CrossRef CAS.
- C. G. Arges, V. K. Ramani and P. N. Pintauro, The chalkboard: anion exchange membrane fuel cells, Electrochem. Soc. Interface, 2010, 19(2), 31 CrossRef CAS.
- A. Filpi, M. Boccia and H. Gasteiger, Pt-free cathode catalyst performance in H2/O2 anion-exchange membrane fuel cells (AMFCs), ECS Trans., 2008, 16(2), 1835 CrossRef CAS.
- R. Zeng and J. R. Varcoe, Alkaline anion exchange membranes for fuel cells-a patent review. Recent Patents on, Chem. Eng., 2011, 4(2), 93–115 CrossRef CAS.
- H. A. Firouzjaie and W. E. Mustain, Catalytic advantages, challenges, and priorities in alkaline membrane fuel cells, ACS Publications, 2019, pp. 225–234 Search PubMed.
- D. R. Lide, Handbook of chemistry and physics, CRC press, Boca Raton, 1998 Search PubMed.
- M. A. Vandiver, et al., Mechanical characterization of anion exchange membranes by extensional rheology under controlled hydration, J. Electrochem. Soc., 2014, 161(10), H677 CrossRef CAS.
- W.-H. Lee, et al., Poly(terphenylene) anion exchange membranes: the effect of backbone structure on morphology and membrane property, ACS Macro Lett., 2017, 6(5), 566–570 CrossRef CAS.
- Y. Pu, et al., Surface transitions by shear modulation force microscopy, Langmuir, 2001, 17(19), 5865–5871 CrossRef CAS.
- Y. Ji, et al., Structure and nanomechanical characterization of electrospun PS/clay nanocomposite fibers, Langmuir, 2006, 22(3), 1321–1328 CrossRef CAS.
- S. Ge, et al., Shear modulation force microscopy study of near surface glass transition temperatures, Phys. Rev. Lett., 2000, 85(11), 2340 CrossRef CAS.
- Y. Zhang, et al., Surface characterization of cross-linked elastomers by shear modulation force microscopy, Polymer, 2003, 44(11), 3327–3332 CrossRef CAS.
- M. Lantz, et al., Lateral stiffness of the tip and tip-sample contact in frictional force microscopy, Appl. Phys. Lett., 1997, 70(8), 970–972 CrossRef CAS.
- J. Varcoe, P. A. Kohl, A. R. Kucernak, W. E. Mustain, K. Nijmeijer, K. Scott, T. Xu and L. Zhuang, et al. , Energy Environ. Sci., 2014, 7, 3135–3191 RSC.
- E. Sgreccia, et al., Mechanical properties of hybrid proton conducting polymer blends based on sulfonated polyetheretherketones, J. Power Sources, 2008, 178(2), 667–670 CrossRef CAS.
- B. Qiu, et al., Alkaline imidazolium-and quaternary ammonium-functionalized anion exchange membranes for alkaline fuel cell applications, J. Mater. Chem., 2012, 22(3), 1040–1045 RSC.
- R. F. Mann, et al., Development and application of a generalised steady-state electrochemical model for a PEM fuel cell, J. Power Sources, 2000, 86(1–2), 173–180 CrossRef CAS.
- Y. Wang and C.-Y. Wang, Modeling polymer electrolyte fuel cells with large density and velocity changes, J. Electrochem. Soc., 2005, 152(2), A445 CrossRef CAS.
Footnote |
| † Electronic supplementary information (ESI) available. See DOI: https://doi.org/10.1039/d2ya00207h |
| This journal is © The Royal Society of Chemistry 2023 |