Exploring regression-based QSTR and i-QSTR modeling for ecotoxicity prediction of diverse pesticides on multiple avian species†
Received
12th June 2023
, Accepted 23rd July 2023
First published on 24th July 2023
Abstract
Ensuring the protection of endangered bird species from pesticide exposure plays a vital role in safeguarding ecosystem integrity. The task of predicting pesticide toxicity and conducting risk assessments has become increasingly challenging in recent times. Within this research endeavor, we have undertaken the development of regression-based quantitative structure–toxicity relationship (QSTR) and interspecies (i-QSTR) models. These models were constructed employing an extensive dataset of 664 pesticides following the guidelines set forth by the Organization for Economic Co-operation and Development (OECD). Our primary objective was to identify the fundamental characteristics responsible for the toxicity of pesticides on various avian species, including the mallard duck (MD), bobwhite quail (BQ), and zebra finch (ZF). By evaluating various globally accepted internal and external statistical parameters, we have demonstrated that our models exhibit reliability and robustness. An intelligent consensus algorithm was used to make the models more predictive. As a result of intelligent consensus prediction (ICP), test compound consensus predictability (winner model is CM3) showed better results than individual models. An attempt has been made to interpret the descriptors of the developed model from a mechanistic perspective, catering to principle 5 of OECD guidelines, in which the presence of phosphate, oxygen, ether linkage, carbamates and halogens in the backbone structure of pesticides is associated with avian toxicity. Finally, we have concluded that groups that are linked with the electronegativity and lipophilicity of a compound may escalate pesticide-induced toxicity. Developed i-QSTR models can be employed for the prediction of species-specific pesticide toxicity.
Environmental significance
The protection of endangered bird species from pesticide exposure is of utmost importance when assessing the safety of ecosystems. This study focuses on the development of robust and validated models, known as quantitative structure–toxicity relationship (QSTR) and interspecies-QSTR (i-QSTR) models, to predict the ecotoxicity of pesticides toward avian species. To enhance the accuracy of these models, intelligent consensus prediction (ICP) was employed. Through this research, we have identified the key structural features that influence the toxicity of pesticides toward avian species. Additionally, the development of interspecies models enables the assessment of cross-toxicity between different species. These predictive models serve to address gaps in toxicity datasets and can aid in predicting the toxicity of novel pesticides. By utilizing the developed models derived from this study, it becomes possible to predict the toxicity of new pesticides even before their synthesis, and based on the predicted toxicity, we can classify them into non-toxic (safe and environmentally friendly) and toxic (harmful). This, in turn, contributes to the reduction of time, resources, costs, and the need for animal experimentation, aligning with the principles of reduction, refinement, and replacement (RRR) in research practices.
|
Introduction
The role of birds in maintaining the world's ecosystem cannot be overstated, so it would be hard to imagine it without them. Avian species are very much important for contributing to agricultural escalation and environmental protection. Producing food to meet world consumption demands is always a major part of it.1–3 As pesticides can kill a wide range of agricultural pests and increase crop yields, they are extensively used in agriculture. These pesticides are highly toxic to birds. From the 1500s until now, large numbers of bird species have vanished, and currently, 200 bird species are at risk.4 Food or skin can introduce pesticides into a bird's body. However, the oral route stands out as the predominant pathway of exposure. In recent years, various regulatory bodies have prioritized the testing of toxic chemicals (pesticides) for birds. As part of their testing guidelines, the Organization for Economic Co-operation and Development (OECD) and the United States Environmental Protection Agency (USEPA) have included the northern bobwhite quail (Colinus virginianus) as well as mallard ducks (Anas platyrhynchos) and zebra finches (Taeniopygia guttata) as model organisms.5,6 Several avian species poisoning incidents have been reported all over the world (including those caused by organophosphates and carbamate).7 Acetyl cholinesterase (AChE) is a protein that binds to these toxic compounds, resulting in serious damage to the nervous system of avian species, which encompasses blindness, blurred vision, lethargy in the coordination of muscular movement, convulsions, paralysis and difficulty breathing.8–11
All the previous models (both in vivo and in vitro) were more time-consuming, expensive, and unethical. Chemical toxicology can be simplified using computational approaches. Computational approaches can cut down on the number of experiments and costs and provide methods for the early detection of toxicity.11,12 The EPA, ECB and REACH are three of the regulatory agencies that emphasize the importance of non-animal models to predict chemical elemental properties, including quantitative structure–activity/property/toxicity relationships ((QSARs, QSPRs and QSTRs), read-across and others).7,10–14 QSAR is an important computational technique that is used to make a quantitative correlation between the chemical structure (i.e. the descriptor) and activity (physicochemical and biological properties).15,16 Rats, mice and fish were among the animals that were modeled in silico by many research groups.17–19 However, the reported in silico models for avian species are very less in number.4,5,20–26 After a thorough analysis of the reported models, we have seen that until now all the models were built using a small dataset except Zhang et al., 2015,5 who used 663 diverse chemicals (pesticides) to build models for 17 different avian species. Until now, all QSTR models were built for single or multiple species,5,27,28 using different machine learning approaches such as classification-based applications using LDA29 and GFA followed by PLS.22 In addition, QSTR models for interspecies toxicity correlation to predict species sensitivity distributions have been reported.30 In some research studies, perturbation-theory machine learning methodology (PTML) approaches have been adopted to develop advanced multi-target and multi-tasking QSTR models to demonstrate quantitative structure-biological effect relationships. Kleandrova et al., 2015,31 developed a multitasking (mtk)-QSTR model based on artificial neural networks (ANNs), allowing the classification of compounds as toxic or non-toxic. Another highly predictive multitasking model for quantitative structure-biological effect relationships was created from a large dataset of 46![[thin space (1/6-em)]](https://www.rsc.org/images/entities/char_2009.gif) 229 cases by Speck-Planche et al., 2017.32 Speck-Planche et al., 2015,33 developed the first mtk-QSBER model employing a large and heterogeneous dataset of chemicals, which integrates dissimilar kinds of chemical and biological data. Tenorio-Borroto et al., 2014,34 utilized the TOPS-MODE approach to develop an mt-QSAR model to calculate drug molecular descriptors and the linear discriminant analysis (LDA) function, adding a new tool in the domain of high-throughput screening in drug discovery. Tenorio-Borroto et al., 2019,35 employed perturbation theory machine learning (PTML) methodology for predicting the immunotoxicity of drugs targeting inflammatory cytokines and studying the antimicrobial G1 using cytometric bead arrays.
229 cases by Speck-Planche et al., 2017.32 Speck-Planche et al., 2015,33 developed the first mtk-QSBER model employing a large and heterogeneous dataset of chemicals, which integrates dissimilar kinds of chemical and biological data. Tenorio-Borroto et al., 2014,34 utilized the TOPS-MODE approach to develop an mt-QSAR model to calculate drug molecular descriptors and the linear discriminant analysis (LDA) function, adding a new tool in the domain of high-throughput screening in drug discovery. Tenorio-Borroto et al., 2019,35 employed perturbation theory machine learning (PTML) methodology for predicting the immunotoxicity of drugs targeting inflammatory cytokines and studying the antimicrobial G1 using cytometric bead arrays.
The present study aims to identify the structural attributes, which are associated with pesticide toxicity towards avian species using QSTR and i-QSTR approaches.4 Our study is based on a large collection of 664 pesticides with 14 days oral LD50 values for three avian species, MD, BQ and ZF. Herein, regression-based 2D-QSAR and i-QSTR models of pesticides obey OECD guidelines. For improving the external prediction of developed models, we employed the “intelligent consensus prediction” algorithm. Note that, we have used only 2D descriptors to reduce molecular expansion and to magnify the consistency of the built models. Furthermore, the quality of the models has been validated using globally accepted internal and external statistical metrics.
Materials and methods
Collection of toxicity data and data curation
In the current work, diverse classes of 664 pesticides were studied and data for 14-day oral LD50 values were obtained for three avian species, including BQ, MD and ZF from Banjare et al., 2021 (ref. 36) and the EPA-OPP database (https://ecotox.ipmcenters.org/). In these datasets, there are some common compounds that are harmful to more than one avian species which are used as references. The dataset compounds comprise diverse classes of compounds such as ether, carbonyl, triphosphate, carbamate, phosphate, thiosulfate, etc. with LD50 (half-maximal effective concentration used to cause the death of 50% of the tested population after a particular test interval) endpoint values expressed in mg kg−1 unit, which is the dose. For model development, the LD50 values were converted to moles per kg, then log scale equivalents (pLD50), and then negative logarithmic scale equivalents. Initially, we screened a total number of 738 pesticides, among which 399 pesticides were for BQ, 284 pesticides for MD and 55 pesticides for ZF. There are two types of avian species in the ecosystem, the first one is aquatic avian species and the second one is terrestrial avian species. In order to cover both types of avian species, QSTR modeling was conducted on two terrestrial and one aquatic avian species. It is recommended to study toxicity using the mallard duck (Anas platyrhynchos (Anseriform), feral pigeon (Columba livia (Collumbiform), budgerigar (Melopsittacus undulatus (Psittaciform), and zebra finch (Taeniopygia guttata (Passeriform)) according to the OECD principles (test number 223) (https://www.oecd-ilibrary.org/environment/test-no-223-avian-acute-oral-toxicity-test9789264264519-en). Several metalloids, such as As and Si, were also deleted from the dataset, as were equivalent pesticides such as Na+, Mn++, Cu++, Li+, K+, Ca++, and Zn++. We used the KNIME chemical curation workflow (https://www.knime.com/cheminformatics-extensions) for data curation. Some pesticides were withdrawn for their higher residual response values for model development. In this large dataset, we have tried to find outliers that affect the quality of the models. Here, we have employed an approach to find the outliers as follows: first, we have employed a descriptor thinning approach. For this, we have adopted stepwise regression utilizing an initial descriptor pool and selected the significant descriptors and kept them aside. The process was repeated, followed by the application of a genetic algorithm to further select some descriptors. From this, a total of 32 descriptors for BQ and 30 descriptors for MD and ZF each were obtained. We developed MLR models using this reduced set of descriptors. Based on the PLS model, we have removed some compounds having residuals 1.5 and above (in the case of BQ and MD) and having greater than one (in the case of ZF). Ultimately, the toxicity data set consists of 364 compounds for BQ, 247 compounds for MD, and 53 compounds for ZF. In ESI 1,† we hereby provide a compilation of pesticides sourced from both the EPA-OPP database and relevant literature (Banjare et al., 2021).
Molecular structure drawing, descriptor calculation, and data pretreatment
The structures of the pesticides in 2D form were retrieved from the PubChem database (https://pubchem.ncbi.nlm.nih.gov/) and ChemSpider (http://www.chemspider.com) in .mol and .sdf formats. Then, the downloaded structures were employed to compute descriptors. Here, we have used AlvaDesc software37,38 to calculate 2D descriptors including (a) ring descriptors, (b) constitutional descriptors, (c) molecular properties descriptors, (d) functional group count, (e) 2D atom pairs, (f) atom centered fragments, (g) connectivity index, (h) atom type E-state indices, and (i) ETA index descriptors. Although AlvaDesc software was used for both descriptor calculation and data pretreatment all correlating descriptors having only one value are not able to delete this software. Consequently, we have used both AlvaDesc and DTC Lab's Data Pre-Treatment Tool (https://dtclab.webs.com/software-tools) software for the extraction of accurate descriptors for further use. Finally, 809 descriptors for BQ, 750 descriptors for MD, and 533 descriptors for ZF were utilized as input to conduct a comprehensive analysis for the development of (QSTR + i-QSTR) models.
Dataset splitting
Splitting a dataset is an important aspect of QSTR modeling. We have used the “modified k-medoid” (https://dtclab.webs.com/software-tools)) clustering technique39 in all three cases for dividing the entire dataset compounds into training set and test set for model development. Clustering is a machine-learning technique that causes the grouping of similar compounds into one cluster. If two compounds are present in two different clusters that means they are dissimilar to each other. Those characteristic compounds within a cluster are denoted as medoids. This approach is rooted in k-means clustering, which aims to select ‘k’ initial medoids from the set of objects or compounds that lie in the middle range. The datasets were split into training (75% compounds) and test sets (25% compounds). We get twenty clusters for the dataset of BQ, sixteen clusters for the dataset of MD, and five clusters for the dataset of ZF. After dividing the dataset, there could be a chance of obtaining correlated descriptors, which were eliminated by Data Pre-Treatment Train-Test 1.0 (https://dtclab.webs.com/software-tools) software. Descriptor pretreatment and Data Pre-Treatment for train-test are different in the programming aspect. We used data pre-treatment before the division of datasets. After division, we used “Data Pre-Treatment Train-Test 1.0” to omit descriptors with redundant values. The QSTR model was constructed using the training set compounds while the test set compounds were used for model validation. The training set was used to construct the model, while the test set was employed to validate the model's predictive performance.
Selection of variables and development of models
The final predictive models were developed by extracting significant descriptors by employing feature selection strategies40,41 such as stepwise regression42 and the genetic algorithm43 in each case. After descriptor thinning, we used the Best Subset Selection v2.1 (https://dtclab.webs.com/software-tools) tool for the development of models in the case of all the datasets with a reduced number of descriptors. Out of the equations derived from the best subset selection, there are five best subset models based on MAE (mean absolute error) criteria along with additional statistical validation matrices for all three datasets.44 We have developed seven descriptor models for BQ, eight descriptor models for MD, and five descriptor models for ZF. Three i-QSTR models were also developed between BQ-MD, MD-ZF, and BQ-ZF. The best subset models were developed using the same division in the case of all three datasets. Here, the Pearson correlation coefficient was estimated for all the developed models with the help of SPSS software version 9 (ref. 45) to check if there is any inter-correlation between the variables used for the model.
Intelligent consensus prediction (ICP).
The ICP tool46 (https://dtclab.webs.com/software-tools) was utilized to test the hypothesis that judicious model selection could improve the performance of external predictions. It is evident that a single QSTR model alone cannot effectively predict all test compounds. Hence, different test compounds may require different QSTR models, with one model performing well for predicting certain compounds and another model excelling for other compounds. To execute the ICP tool for intelligent consensus prediction in the case of each dataset, we have selected five models.
Metrics for statistical validation
The validation phase of QSAR modeling is crucial. To validate the developed models, we have used different statistical metrics such as internal and external matrices for model validation.47 Here, we have used internal validation metrics44 such as the coefficient of determination R2 and R2adj (R2 adjusted) to assess the fitting performance and cross-validated correlation coefficient Q2(LOO) (leave-one out) to measure the robustness of the model. Threshold values for R2 and Q2(LOO) are greater than 0.6 and 0.5 respectively. To assess the models' predictive power, we also employed some significant external statistical parameters viz. predictive R2 (R2pred)/Q2F1 and Q2F2.44 Afterwards, we used r2m metrics such as average r2m(LOO) and Δr2m(LOO) to check the predictivity of the QSTR and i-QSTR models. Threshold values for Q2F1, Q2F2, and  are greater than 0.5 in all cases while Δr2m values should be less than 0.2.44 The equations employed for the estimation of internal and external statistical parameters are given in ESI 2.†
Applicability domain (AD)
Defining the hypothetical chemical space expressed as the AD within which the predictivity of the model is reliable is crucial for ensuring the accuracy of the forecasts. According to OECD principle 3, it is strictly recommended to check the AD (applicability domain) of the developed models. In the present work, the AD of all the developed QSTR models has been checked by using a simple standardization technique. Applicability domain study is used to identify structural outlier compounds (for training set compounds) or compounds outside of the AD (for test set compounds).48 Here, we have used MLR Plus Validation 1.3 (https://dtclab.webs.com/software-tools) software to check the applicability domain (AD) of developed MLR models. ESI 2† in-depth discusses the standardization technique. A schematic representation of QSTR and i-QSTR model development workflow steps is provided in Fig. 1.
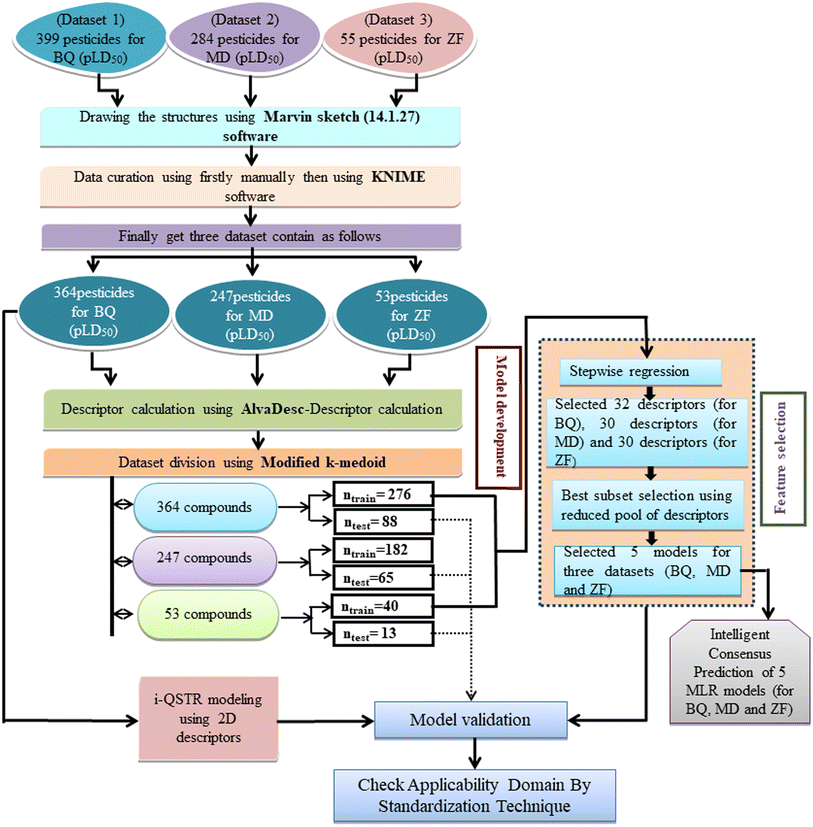 |
| | Fig. 1 Schematic representation of the QSTR and i-QSTR model development workflow. | |
Results and discussion
We have built QSTR and i-QSTR models for all datasets comprising various classes of pesticides with well-defined endpoints against three avian species using a reduced descriptor pool obtained in different ways discussed in the Materials and methods section. No inter-correlation was present among the modeled descriptors as depicted by the Pearson correlation coefficient values that were less than the threshold value of 0.7. We used widely recognized statistical metrics to assess the models' quality. The determination coefficient (R2) (R2: 0.715–0.719 for dataset 1 (BQ); 0.689–0.708 for dataset 2 (MD); and 0.754–0.758 for dataset 3 (ZF)), as well as the leave-one-out (LOO) cross-validated correlation coefficient (Q2(LOO)) are both above the threshold value of 0.5. These results indicate how reliable the generated models are. We also used predictive R2 (R2pred) or Q2F1 (Q2F1: 0.722–0.732) (Dataset 1), 0.620–0.639 (Dataset 2), and 0.790–0.830 (Dataset 3) and Q2F2 0.722–0.731 (Dataset 1), 0.620–0.638 (Dataset 2), and 0.789–0.829 (Dataset 3) to assess the model predictivity. Apart from validation metrics, the MAE44 values for all the QSTR models were also obtained. The results from the obtained models, which are shown in Table 1, confirmed the models' resilience. After performing the consensus prediction of all the models for each of the three datasets using the “Intelligent Consensus Predictor” tool,46 it was shown that the consensus forecasts performed better than the outcomes of separate MLR models according to MAE-based criteria and additional external validation parameters as shown in Table 1. We interpreted consensus model 3 (CM3) as the winner model in every situation based on the MAE. Furthermore, we have developed three interspecies QSTR models (i-QSTR) for extrapolating data on toxicity within species which shows that i-QSTR models are robust, fit, and predictable. The QSTR + i-QSTR models were thoroughly validated utilizing internationally recognized validation metrics. The obtained metrics inferred that the developed models are robust enough. Note that this is the first regression-based QSTR model for this large dataset.
Table 1 Parameters for statistical quality and validation built from MLR models
| Dataset |
Type of model |
Models |
Training set statistics |
Test set statistics |
| Model R2 |
Model Q2(LOO) |

|
Δr2m(LOO) |
MAE95% |
R
2
pred or Q2(F1) |
Q
2
(F2)
|
Q
2
(F3)
|
MAE95% |
| 364 pesticides for Bobwhite quail (BQ) |
Individual models (M1–M5) |
IM1 |
0.719 |
0.700 |
0.596 |
0.187 |
0.209 |
0.729 |
0.728 |
0.687 |
0.175 |
| IM2 |
0.715 |
0.698 |
0.593 |
0.200 |
0.212 |
0.722 |
0.723 |
0.680 |
0.186 |
| IM3 |
0.715 |
0.697 |
0.591 |
0.196 |
0.213 |
0.732 |
0.732 |
0.690 |
0.184 |
| IM4 |
0.716 |
0.696 |
0.589 |
0.193 |
0.213 |
0.722 |
0.722 |
0.679 |
0.178 |
| IM5 |
0.715 |
0.694 |
0.587 |
0.194 |
0.220 |
0.727 |
0.727 |
0.685 |
0.186 |
| Consensus models |
CM0 |
— |
— |
— |
— |
— |
0.729 |
0.729 |
0.687 |
0.180 |
| CM1 |
— |
— |
— |
— |
— |
0.727 |
0.727 |
0.685 |
0.180 |
| CM2 |
— |
— |
— |
— |
— |
0.729 |
0.729 |
0.687 |
0.180 |
|
CM3
|
—
|
—
|
—
|
—
|
—
|
0.739
|
0.739
|
0.698
|
0.174
|
| 247 pesticides for mallard duck (MD) |
Individual models (N1–N5) |
IM1 |
0.708 |
0.695 |
0.537 |
0.170 |
0.323 |
0.623 |
0.623 |
0.602 |
0.320 |
| IM2 |
0.691 |
0.673 |
0.511 |
0.180 |
0.326 |
0.620 |
0.620 |
0.600 |
0.340 |
| IM3 |
0.697 |
0.627 |
0.519 |
0.172 |
0.338 |
0.626 |
0.625 |
0.606 |
0.346 |
| IM4 |
0.689 |
0.626 |
0.515 |
0.186 |
0.342 |
0.639 |
0.638 |
0.619 |
0.357 |
| IM5 |
0.697 |
0.626 |
0.517 |
0.171 |
0.330 |
0.624 |
0.624 |
0.604 |
0.331 |
| Consensus models |
CM0 |
— |
— |
— |
— |
— |
0.643 |
0.642 |
0.623 |
0.324 |
| CM1 |
— |
— |
— |
— |
— |
0.650 |
0.650 |
0.632 |
0.388 |
| CM2 |
— |
— |
— |
— |
— |
0.647 |
0.647 |
0.628 |
0.322 |
|
CM3
|
—
|
—
|
—
|
—
|
—
|
0.645
|
0.645
|
0.626
|
0.319
|
| 53 pesticides for zebra finch (ZF) |
Individual models (S1–S5) |
IM1 |
0.758 |
0.722 |
0.642 |
0.122 |
0.298 |
0.790 |
0.789 |
0.794 |
0.309 |
| IM2 |
0.754 |
0.716 |
0.632 |
0.156 |
0.307 |
0.807 |
0.806 |
0.811 |
0.301 |
| IM3 |
0.757 |
0.697 |
0.632 |
0.132 |
0.308 |
0.791 |
0.789 |
0.795 |
0.309 |
| IM4 |
0.758 |
0.717 |
0.632 |
0.164 |
0.309 |
0.830 |
0.829 |
0.833 |
0.288 |
| IM5 |
0.756 |
0.717 |
0.634 |
0.144 |
0.308 |
0.787 |
0.786 |
0.792 |
0.315 |
| Consensus models |
CM0 |
— |
— |
— |
— |
— |
0.805 |
0.804 |
0.809 |
0.306 |
| CM1 |
— |
— |
— |
— |
— |
0.805 |
0.804 |
0.809 |
0.306 |
| CM2 |
— |
— |
— |
— |
— |
0.806 |
0.804 |
0.810 |
0.305 |
|
CM3
|
—
|
—
|
—
|
—
|
—
|
0.852
|
0.853
|
0.857
|
0.293
|
Mechanistic interpretation of QSTR models
Mechanistic interpretation is among the key components of QSTR model development, according to Principle 5 of the OECD. The structural characteristics that cause pesticides to be hazardous to various avian species are described via the mechanistic interpretation of the models. To explain, the extracted features obtained from different models are grouped according to their chemical properties as described below.
Dataset 1 (BQ)
We have developed five individual MLR (M1–M5) models as mentioned below for BQ using pLD50 as a defined endpoint. For model development, we used 276 compounds in the training set and 88 compounds in the test set. The model descriptors of all five MLR models are p-117, F05[S-P], nCXr, F09[C-P], minssCH2, F04[Br-Br], X2A, F06[S-Cl], F02[O-O], X4v & B02[N-N], which are responsible for the toxicity of pesticides on BQ. Among these descriptors, we have found that six descriptors (p-117, nCXr, F04[Br-Br], F06[S-Cl], F02[O-O] & X4v) have positive regression coefficients and thus contributed positively and five descriptors (F05[S-P], F09[C-P], minssCH2, X2A & B02[N-N]) have negative regression coefficients thus contributed negatively towards the toxicity of pesticides against BQ.
Five individual MLR (M1–M5) models of BQ
Model M1
| pLD50 = 2.850(±0.149) + 2.068(±0.087) × p-117 − 1.397(±0.181) × FO5[S-P] + 0.259(±0.042) × nCXr − 0.551(±0.098) × F09[C-P] − 0.145(±0.051) × minssCH2 + 0.915(±0.116) × F04[Br-Br] − 1.777(±0.483) × X2A |
Model M2
| pLD50 = 2.868(±0.150) + 2.036(±0.088) × p-117 − 1.394(±0.183) × FO5[S-P] + 0.207(±0.052) × nCXr − 0.531(±0.099) × F09[C-P] + 0.133(±0.070) × F06[S–Cl] + 0.918(±0.117) × F04[Br-Br] − 1.912(±0.484) × X2A |
Model M3
| pLD50 = 2.846(±0.151) + 1.977(±0.096) × p-117 − 1.359(±0.184) × FO5[S-P] + 0.252(±0.043) × nCXr − 0.549(±0.099) × F09[C-P] + 0.902(±0.117) × F04[Br-Br] + 0.036(±0.020) × F04[O-O] − 1.914(±0.484) × X2A |
Model M4
| pLD50 = 2.732(±0.166) + 2.004(±0.090) × p-117 − 1.540(±0.194) × FO5[S-P] + 0.238(±0.044) × nCXr − 0.531(±0.099) × F09[C-P] + 0.890(±0.118) × F04[Br-Br] − 1.696(±0.497) × X2A + 0.030(±0.015) × X4v |
Model M5
| pLD50 = 2.928(±0.153) + 2.042(±0.088) × p-117 − 1.415(±0.183) × FO5[S-P] + 0.256(±0.043) × nCXr − 0.542(±0.099) × F09[C-P] − 0.0.84(±0.048) × B04[N-N] + 0.905(±0.117) × F04[Br-Br] − 2.001(±0.486) × X2A |
According to the AD study, we have seen that one test set compound for model M1 (281) and one test set compound for model M3 (243) are situated outside the AD, respectively; however for models M2, M4, and M5, all compounds of the test set lie within the AD. Fig. 2 shows the scatter plot between the observed and predicted pLD50 values for each model.
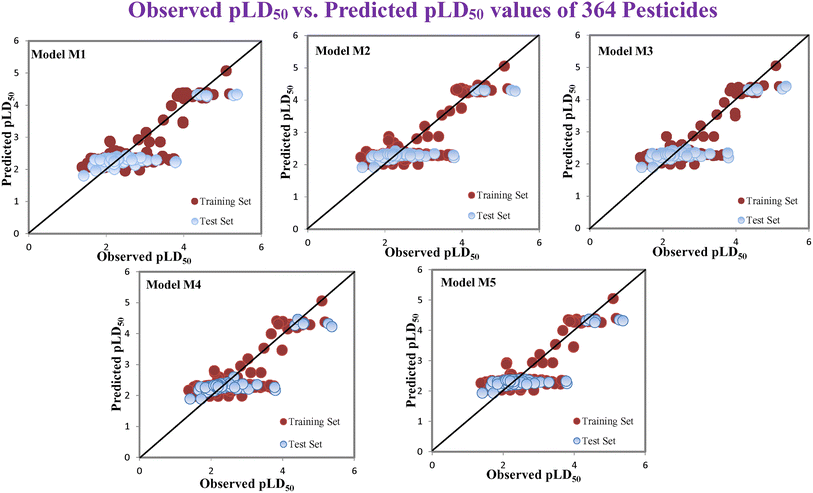 |
| | Fig. 2 The scatter plot representation of observed and predicted lethal dose toxicity (pLD50) against BQ of the developed QSTR models (models M1–M5). | |
Descriptors related to electronegativity
In chemistry, the concept of electronegativity refers to the capacity of an atom or functional group to attract electrons toward itself. The atom-centered descriptor p-117, denoted as X3–P![[double bond, length as m-dash]](https://www.rsc.org/images/entities/char_e001.gif) X, signifies the presence of a phosphate group within the molecules. The presence of P atoms in the molecule increases electronegativity, thus favoring bonding with the receptor. The positive regression coefficient of p-117 implied that the occurrence of O and P atoms makes the pesticides more toxic as depicted in 71, 143, and 208 and their absence makes the pesticides less toxic as explained in 3, 7 and 19.
X, signifies the presence of a phosphate group within the molecules. The presence of P atoms in the molecule increases electronegativity, thus favoring bonding with the receptor. The positive regression coefficient of p-117 implied that the occurrence of O and P atoms makes the pesticides more toxic as depicted in 71, 143, and 208 and their absence makes the pesticides less toxic as explained in 3, 7 and 19.
The nCXr enumerates the electronegative atoms (X) attached to ring sp3 hybridized C. Electronegativity increases lipophilicity thus enhancing the toxicity of the compounds for model species.4 The positive value of the regression coefficient associated with nCXr highlights that the incidence of additional electronegative atoms enhances the propensity of pesticides to enter the system. This has been demonstrated in the cases of 109, 127 and 292 and oppositely occurs in 3, 9 and 19.
F04[Br-Br], F06[S-Cl] and F02[O-O] descriptors are the two-dimensional atom pair type descriptors, which account for the occurrence of 2 bromine atoms, S–Cl and 2 oxygen atoms at topological distances of 6 and 2 respectively. These descriptors contributed positively as these descriptors have a positive regression coefficient closer to the toxicity of pesticides in opposition to BQ. These structural features if present makes the pesticides more lipophilic19 enhancing their toxicity towards BQ as evidenced in 54 and 55 in the case of F04[Br-Br], 2, 127 and 152 in the case of F06[S-Cl], and 19, 36 and 105 in the case of F02[O-O]. On the other hand, the pesticides that do not have such fragments are less toxic against BQ as shown in 3, 7, 9 and 18 in the cases of F04[Br-Br], F06[S-Cl], and F02[O-O].
All the descriptors, their associated definitions, contributions, and mechanistic interpretations are outlined in Fig. 3 and Table S1 (ESI 2†).
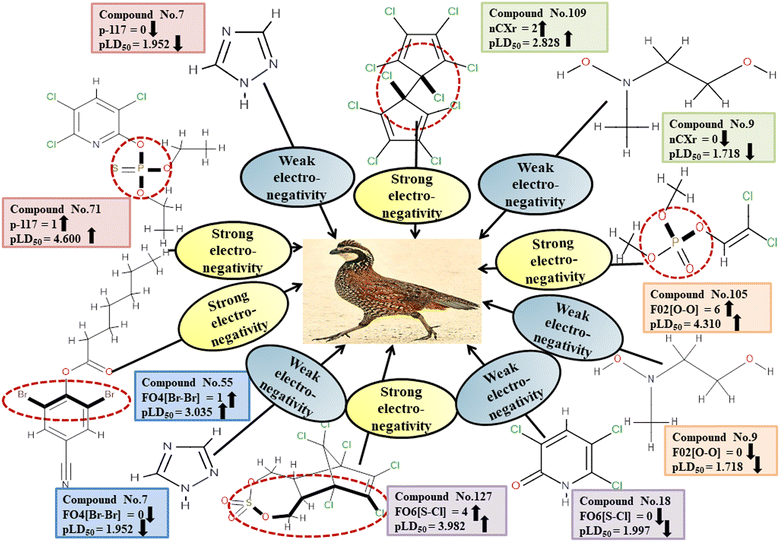 |
| | Fig. 3 Mechanistic interpretation of modelled descriptors associated with electronegativity between pesticides and BQ. | |
Descriptors related to hydrophilicity
Hydrophilicity can have an inverse relationship with pesticide toxicity due to its ability to cause compounds to dissolve in water and be excreted more quickly. The 2D atom pair descriptors (B02[N-N], F05[S-P], and F09[C-P]) are key factors in regulating the toxicity of pesticides against BQ. Roy et al. (2019)19 noted that the presence of two polar atoms (two nitrogen atoms for B02[N-N], sulfur and phosphorus atoms for F05[S-P], and carbon and phosphorus atoms for F09[C-P]) makes pesticides more hydrophilic. The negative regression coefficient associated with these descriptors demonstrates an inverse relationship between the involvement of these markers and the pesticide toxicity towards BQ. These fragments increase the hydrophilic nature of the pesticides, thus causing them to be less toxic to BQ due to their inability to enter the biological system as demonstrated by 7, 103 and 240 for B02[N-N], 45 and 135 for F05[S-P], and 45 and 324 for F09[C-P] descriptors. Conversely, 55, 265 and 286 (for B02[N-N]), 55, 265 and 286 (for F05[S-P]), and 54, 177 and 286 (for F09[C-P]) increase the toxicity towards BQ.
All of these descriptors, along with their definitions, contributions, and mechanistic interpretations, are outlined. in Fig. 4 and Table S2 (ESI 2†).
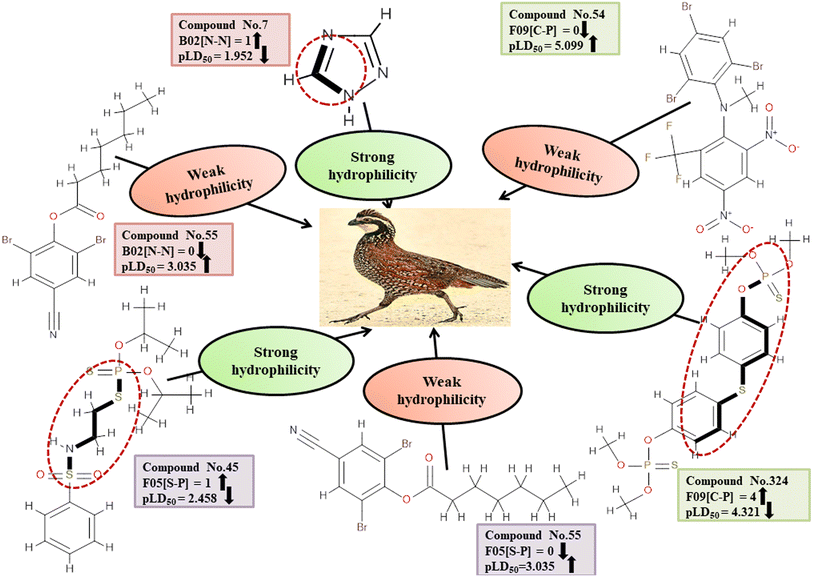 |
| | Fig. 4 Mechanistic interpretation of the modeled descriptors associated with hydrophilicity between pesticides and BQ. | |
Descriptors related to hydrophobicity
Hydrophobicity can be defined as the correlation between water and low water-soluble molecules such as hydrophobes. Hydrophobes are nonpolar molecules having long carbon chains with no interaction with water molecules. X2A enumerates the mean of the secondary connectivity index of order 2 and encodes the ‘chi’ value between consecutive bonds.50 Hydrophobic interactions between the pesticides and reference species may be increased by increasing molecular surface area. This descriptor was found to be negatively correlated to pesticide toxicity towards BQ, as indicated by a negative regression coefficient. Compounds with a higher X2A value viz.3, 235 and 281 showed lower toxicity, while those with a lower X2A value viz.6, 153 and 210 were more toxic. Another descriptor, known as minssCH2, is an electrotopological (E)-state atomic index descriptor. It specifically represents the minimal atom-type E-state, –CH2−, which corresponds to the presence of methylene (–CH2−) groups in aliphatic chains. The negative regression coefficient associated with this descriptor indicates that pesticides with higher values of minssCH2viz.8, 91 and 352 tend to display lower toxicity levels and 14, 43 and 256 have the opposite effect. The X4v descriptor accounts for the 4th-order valence connectivity index of compounds.50 The size of pesticides plays a crucial role in determining their toxicity towards avian species. Larger molecules exhibit increased surface area, leading to enhanced hydrophobicity of the pesticides. Consequently, the hydrophobic interaction between pesticides and the reference species intensifies. The positive regression coefficient associated with this descriptor indicates its positive contribution to the toxicity of pesticides against BQ. Therefore, high values of X4v may result in higher toxicity towards BQ, as observed in 25, 45 and 135. Conversely, pesticides containing a lower X4v value (reduced surface area of the molecules) may reduce the pesticide toxicity as seen in 135, 320 and 348.
Fig. 5 and Table S3 (ESI 2†) present a comprehensive overview of all descriptors, including their definitions, contributions and mechanistic interpretations.
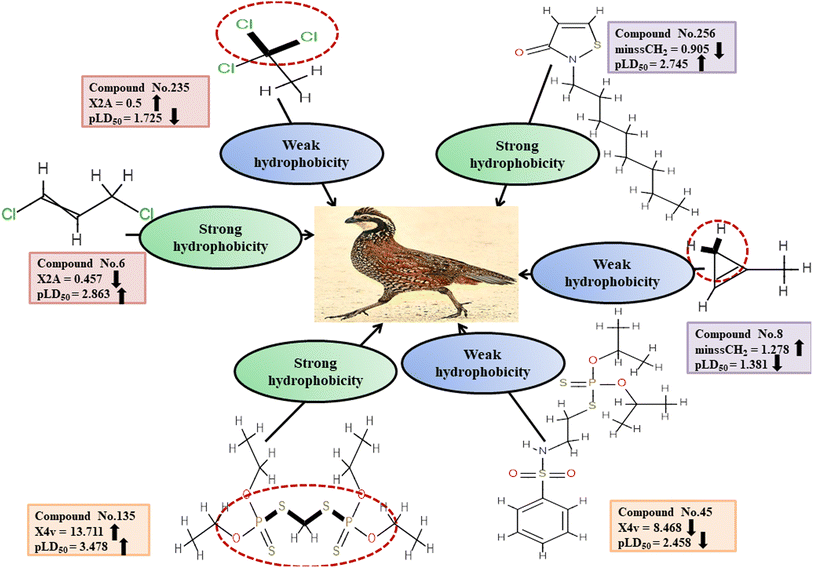 |
| | Fig. 5 Mechanistic interpretation of the descriptors associated with hydrophobicity between pesticides and BQ. | |
Dataset 2 (MD)
For MD, five individual MLR-based models were developed using pLD50 as their endpoint. The contributing descriptors for all five models which regulate the toxicity of the pesticide for MD are nArOCON, nRSR, F02[O-O], F10[C-S], F06[C-P], B01[O-P], nBridgeHead, T(P⋯Cl), B06[C-N], B05[O-S] & F08[C-S]. The positive regression coefficients of seven descriptors (nArOCON, nRSR, F02[O-O], B01[O-P], nBridgeHead, B06[C-N] & B05[O-S]) indicated that these descriptors are influential for pesticide toxicity against MD while the remaining four descriptors (F10[C-S], F06[C-P], T(P⋯Cl) & F08[C-S]) have negatively contributed towards the pesticide toxicity against MD as these descriptors have negative regression coefficients.
Five individual MLR (N1–N5) models of MD
Model N1
| pLD50 = 2.080(±0.049) + 0.865(±0.208) × nArOCON + 0.517(±0.147) × nRSR + 0.213(±0.035) × F02[O-O] − 0.354(±0.091) × F10[C-S] − 0.492(±0.095) × F06[C-P] + 1.772(±0.147) × B01[O-P] + 0.440(±0.068) × nBridgeHead − 0.097(±0.017) × T(P⋯Cl) |
Model N2
| pLD50 = 1.999(±0.066) + 0.887(±0.214) × nArOCON + 0.338(±0.144) × nRSR + 0.166(±0.034) × F02[O-O] − 0.450(±0.098) × F06[C-P] + 0.172(±0.079) × B06[C-N] + 1.875(±0.153) × B01[O-P] + 0.483(±0.071) × nBridgeHead − 0.088(±0.017) × T(P⋯Cl) |
Model N3
| pLD50 = 2.148(±0.049) + 0.832(±0.213) × nArOCON + 0.165(±0.034) × F02[O-O] + 1.636(±0.148) × B01[O-P] + 0.870(±0.201) × B05[O-S] − 1.245(±0.250) × F04[O-P] + 0.436(±0.069) × nBridgeHead − 0.227(±0.017) × F08[C-S] − 0.091(±0.018) × T(P⋯Cl) |
Model N4
| pLD50 = 1.975(±0.066) + 0.827(±0.215) × nArOCON + 0.648(±0.215) × nRSR + 0.177(±0.035) × F02[O-O] + 0.245(±0.081) × B06[C-N] + 1.746(±0.143) × B01[O-P] + 0.484(±0.071) × nBridgeHead − 0.243(±0.054) × F08[C-S] − 0.094(±0.017) × T(P⋯Cl) |
Model N5
| pLD50 = 2.102(±0.050) + 0.910(±0.211) × nArOCON + 0.490(±0.152) × nRSR + 0.182(±0.034) × F02[O-O] − 0.376(±0.101) × F06[C-P] + 1.877(±0.151) × B01[O-P] + 0.445(±0.069) × nBridgeHead − 0.159(±0.054) × F08[C-S] − 0.098(±0.017) × T(P⋯Cl) |
Based on the AD, we have found that 23, 35, 68, 192 and 203 are outside the AD for N1 and N2 models, while 23, 35, 68 and 203 are outside the AD for N3, N4, and N5 models; however, based on these models, these compounds exhibited strong predictive performance. The scatter plot between observed and predicted pLD50 for all five models is shown in Fig. 6.
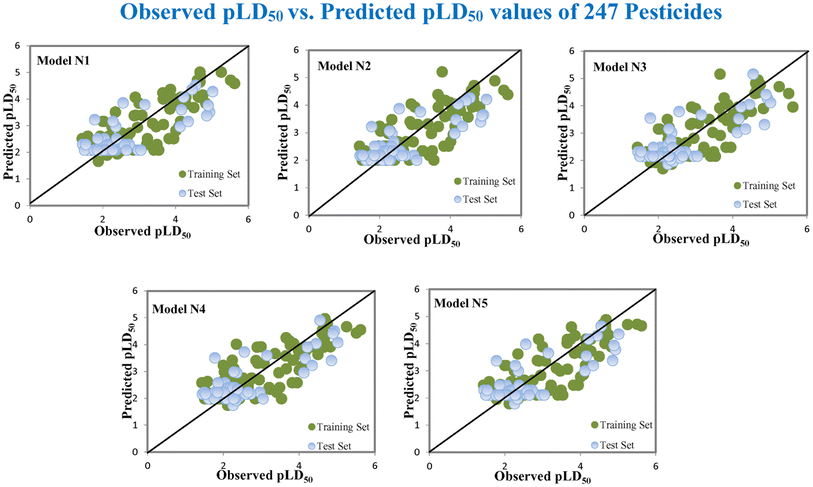 |
| | Fig. 6 The scatter plot of observed and predicted lethal dose toxicity (pLD50) against MD of the QSTR models (N1–N5). | |
Descriptors related to electronegativity
In chemical bonding, electronegativity plays a crucial role in imparting pesticide toxicity. nRSR accounts for sulfide groups attached to the backbone structure of compounds. The sulfur atom (S) has electronegative properties which help improve the compound's electronegativity. The positive regression coefficient associated with this descriptor indicates that an increase in its numerical value corresponds to an elevation in pesticide toxicity. This is demonstrated by 103 and 190, where higher values of the descriptor are associated with increased toxicity levels and the opposite was traced in 2, 11 and 37.
The presence of two electronegative atoms boosts the overall electronegativity of a pesticide, resulting in free radical generation leading to the death of the organism.19 Therefore, pesticides featuring 2D atom pair descriptors such as F02[O-O], B01[O-P] and B05[O-S] (incidence of double oxygen atoms, oxygen and phosphorus atoms and oxygen and sulfur atoms at a topological distance of 2, 1 and 5 respectively) are more likely to cause high toxicity when interacting with MD, as demonstrated by 5, 103, and 163 for F02[O-O], 103, 123, and 159 for B01[O-P], and 74, 152 and 154 for B05[O-S]. Conversely, 11, 49 and 80 for F02[O-O], 11, 37 and 149 for B01[O-P], and 5, 123 and 291 for B05[O-S] have shown lower levels of toxicity. All the descriptors, their definitions, contributions, and mechanistic interpretations are provided in Fig. 7 and Table S4 (ESI 2†).
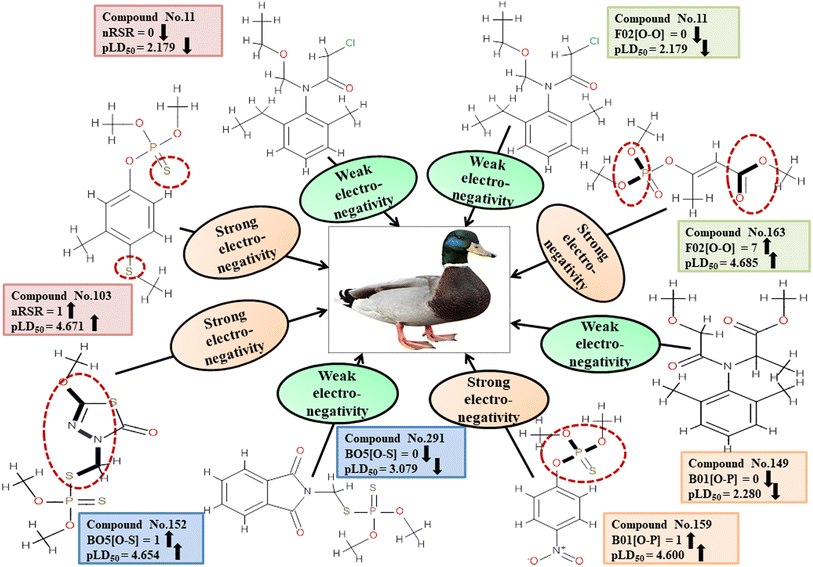 |
| | Fig. 7 An analysis of the descriptors associated with the electronegativity between pesticides and MD using a mechanistic approach. | |
Descriptors related to hydrophilicity
The important 2D atom pair descriptors that were present in the models are F10[C-S], F08[C-S], and F06[C-P] (the occurrence of carbon and sulfur atoms, carbon and sulfur atoms and carbon and phosphorus atoms at topological distances of 10, 8 and 6 respectively). The polar atom fragments make pesticides hydrophilic since carbon atoms attached to other atoms apart from hydrogen atoms impart electronegativity. The negative regression coefficient obtained for these variables indicates that they are inversely correlated to pesticide toxicity in MD. These features increase the hydrophilicity of pesticides, resulting in reduced harm to the MD (reference species) which reduces hydrophilicity and hinders easy entry into the MD body. This is evidenced in 166, 200 and 213 (for F10[C-S]), 91, 122 and 191 (for F08[C-S]), and 91, 191 and 225 (for F06[C-P]) contrary to 103, 123 and 179 (for F10[C-S]), 42, 123 and 159 (for F08[C-S]), and 103, 121 and 159 (for F06[C-P]).
Detailed definitions of these descriptors along with their contributions and mechanistic interpretations can be found in Fig. 8 as well as Table S5 within ESI 2.†
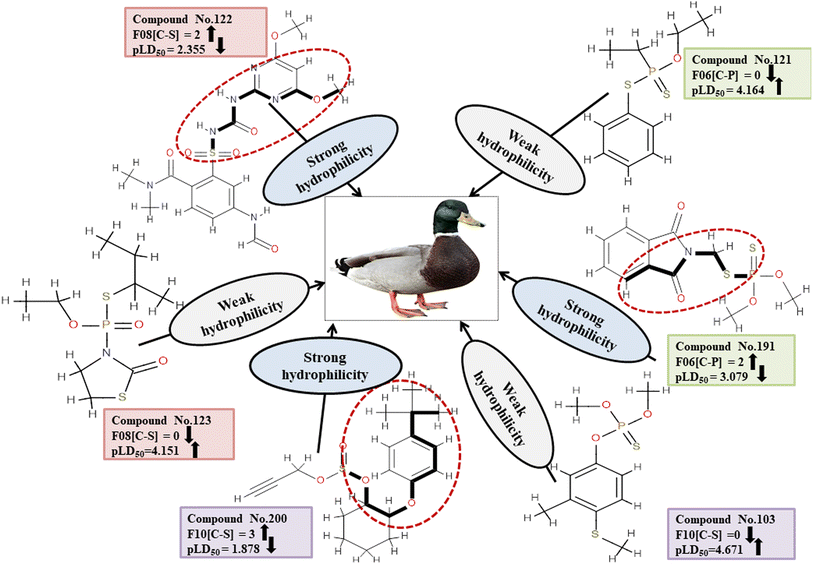 |
| | Fig. 8 Mechanistic interpretation of the descriptors associated with hydrophilicity of pesticides. | |
Descriptors related to π–π interaction
Chemically, π–π interactions are non-covalent interactions that involve π-systems. In a similar manner to electrostatic interaction, in which a negatively charged region interacts with a positively charged area, a π-system feasibly reacts with neutral, anionic, cationic metal, another molecule, and other π-systems. The two-dimensional atom pair descriptor T(P⋯Cl) accounts for the topological distances between phosphorus and chlorine atoms.19 Reduction of inductivity in chlorine substituents causes a decrease in electron density for the relevant compounds. Therefore, the incidence of the P–Cl bond in aromatic chemicals reduces the electron density of the aromatic ring, and finally, electron–donor–acceptor interactions cannot happen easily between pesticides and the reference species. This descriptor has a negative regression coefficient, indicating that the presence of this fragment will result in a decrease in the pesticide toxicity profile, as exemplified by 43, 51 and 225, while it would have the opposite effect when present in 70, 103 and 159.
All of the descriptors, their definitions, contributions, and mechanistic interpretations are detailed in Fig. 9 and Table S6 (ESI 2†).
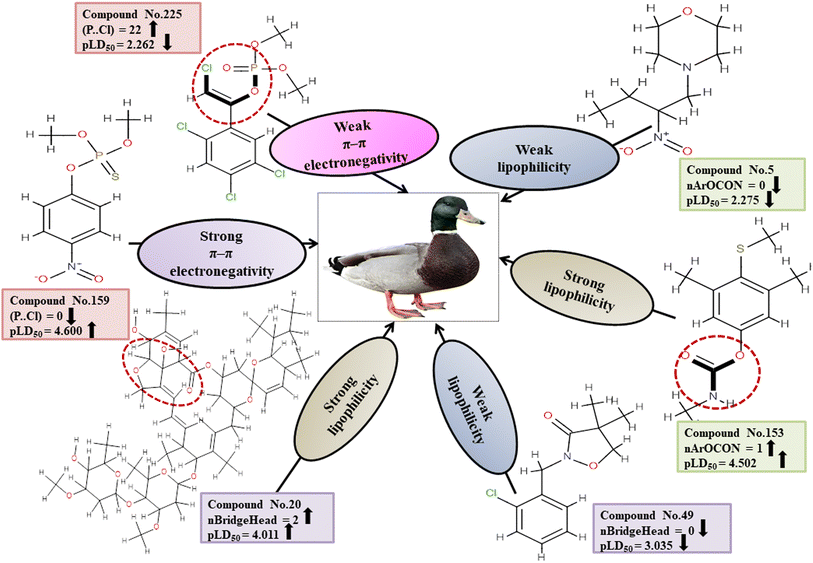 |
| | Fig. 9 Interpretation of features associated with π–π interaction and lipophilic interaction in a mechanistic approach. | |
Descriptors associated with lipophilicity
The compound's lipophilicity refers to its tendency to partition between a polar aqueous phase and a lipophilic organic phase. The lipophilicity of a compound is usually expressed as the distribution coefficient, log![[thin space (1/6-em)]](https://www.rsc.org/images/entities/char_2009.gif) D, or partition coefficient, log
D, or partition coefficient, log![[thin space (1/6-em)]](https://www.rsc.org/images/entities/char_2009.gif) P. nBridgeHead accounts for the bridgehead atoms present in the ring structure, such as phosphates, sulfates, and thiophosphate. A cyclic compound has a higher lipophilicity than an open-chain compound.51 Lipophilic substances are more likely to accumulate within cells, resulting in a heightened concentration within the organism that can lead to heightened toxic effects.52 This descriptor displays a positive regression coefficient and, therefore, has a positive impact on the response. Therefore, the pesticides as shown in 20, 85 and 86 containing bridgehead atoms are more toxic than those compounds without bridgehead atoms as shown in 49, 180 and 235.
P. nBridgeHead accounts for the bridgehead atoms present in the ring structure, such as phosphates, sulfates, and thiophosphate. A cyclic compound has a higher lipophilicity than an open-chain compound.51 Lipophilic substances are more likely to accumulate within cells, resulting in a heightened concentration within the organism that can lead to heightened toxic effects.52 This descriptor displays a positive regression coefficient and, therefore, has a positive impact on the response. Therefore, the pesticides as shown in 20, 85 and 86 containing bridgehead atoms are more toxic than those compounds without bridgehead atoms as shown in 49, 180 and 235.
The functional group count descriptor, nArOCON, denotes the aromatic (thio-) carbamate groups present in a compound.47 The aromatic thio-carbamate group enhances lipophilicity and facilitates inhibition of the acetyl cholinesterase (AChE) enzyme by permeating cell membranes for maximum toxicity.49 This descriptor has been shown to have a positive effect on toxicity endpoints through its regression coefficients. Therefore, pesticides containing this fragment as shown in 34, 136 and 153 are more toxic than those which do not have such a fragment as shown in 2, 5 and 180.
All the descriptors, their definitions, contributions, and mechanistic interpretations are provided in Fig. 9 and Table S7 (in ESI 2†).
Dataset 3 (ZF)
Five individual MLR models (S1–S5) are mentioned below for ZF also by taking pLD50 as a defined end point. The model descriptors of all five models are F01[O-P], nRSR, T(O⋯Br), F04[O-S], c-031, B04[Cl-Cl], F06[C-S], B04[C-C] & F05[C-S], which are responsible for the toxicity of pesticides on ZF. We have found that three descriptors (F01[O-P], nRSR & c-031) have positive regression coefficients and thus contributed positively and six descriptors (nRSR, T(O⋯Br), B04[Cl-Cl], F06[C-S], B04[C-C] & F05[C-S]) have negative regression coefficients and thus contributed negatively towards the toxicity of pesticides against ZF.
Five individual MLR (S1–S5) models of ZF
Model S1
| pLD50 = 2.525(±0.093) + 0.621(±0.087) × F01[O-P] + 2.233(±0.425) × nRSR − 0.011(±0.012) × T(O⋯Br) − 0.425(±0.200) × F04[O-S] + 1.061(±0.434) × c-031 |
Model S2
| pLD50 = 2.516(±0.094) + 0.592(±0.083) × F01[O-P] + 2.263(±0.427) × nRSR − 0.417(±0.202) × F04[O-S] + 1.106(±0.434) × c-031 − 0.233(±0532) × B04[Cl-Cl] |
Model S3
| pLD50 = 2.527(±0.095) + 0.597(±0.082) × F01[O-P] + 2.325(±0.433) × nRSR − 0.382(±0.205) × F04[O-S] + 1.137(±0.434) × c-031 − 0.057(±0.078) × F06[C-S] |
Model S4
| pLD50 = 2.078(±0.520) + 0.591(±0.082) × F01[O-P] + 2.261(±0.424) × nRSR − 0.419(±0.200) × F04[O-S] + 1.104(±0.431) × c-031 + 0.444(±0.528) × B04[C-C] |
Model S5
| pLD50 = 2.528(±0.096) + 0.597(±0.082) × F01[O-P] + 2.271(±0.425) × nRSR − 0.364(±0.213) × F04[O-S] + 1.059(±0.438) × c-031 − 0.052(±0.073) × F05[C-S] |
Assessing the AD, it was observed that only one test set compound (40) for models S1, S3, and S5, two compounds (7 and 40) for models S2 and two compounds (19 and 40) for models S4 appear outside the AD; however, these compounds still showed good predictability. The scatter plots between the experimental pLD50 and predicted pLD50 for the QSTR models are provided in Fig. 10.
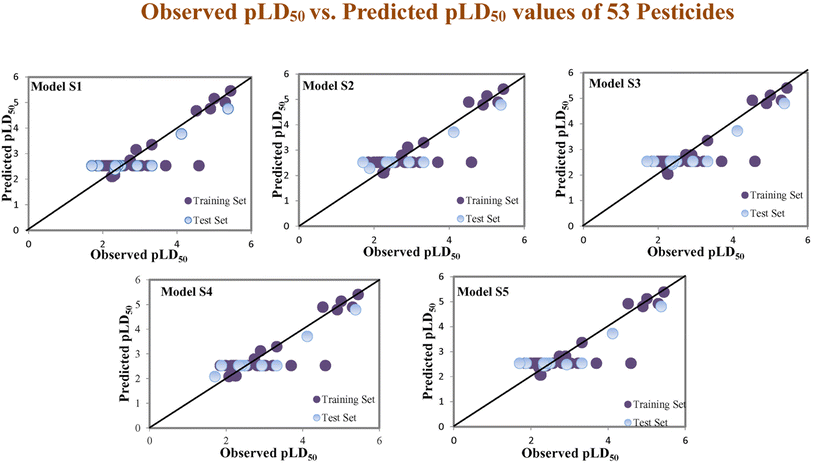 |
| | Fig. 10 The scatter plots of experimental and predicted lethal dose toxicity (pLD50) against BQ in the developed QSTR models (models S1–S5). | |
Descriptors related to electronegativity
Electronegativity has a dominant role in the interactions between pesticides and receptors. The 2D atom pair descriptor F01[O-P] enumerates the frequency of oxygen and phosphorus atoms in proximity. If two adjacent electronegative atoms are present, such as oxygen and phosphorus atoms, the overall electronegativity is enhanced which results in oxidative stress on reference species, ultimately resulting in death. This descriptor has a positive correlation coefficient indicating that having more electronegative elements makes pesticides more likely to enter the system (examples being 1, 37 and 43) while having fewer leads to a decreased chance of entry (i.e., 12, 15 and 24). The functional group count descriptor, nRSR, enumerates sulfide groups in a compound. A sulfur atom (S) has electronegative properties which help improve the compound's electronegative properties.4 The presence of a positive regression coefficient for this descriptor indicates that as the numerical value of the descriptor increases, there is a corresponding increase in the level of toxicity observed, as exemplified by 34, 40 and 42 whereas those without the nRSR feature are less toxic against ZF as shown in 19, 29 and 35.
The c-031 atom-centric fragment descriptor is defined as X–CR–X, indicating two electronegative atoms attached to the carbon with another group. The incidence of these electronegative atoms increases the pesticide's electronegativity, thus favoring its binding to a receptor. The positive value of the associated regression coefficient suggests that the inclusion of oxygen and phosphorus atoms enhances the toxicity of pesticides. This is exemplified by 51 and 52, which demonstrate a higher level of toxicity in relation to this descriptor, while the absence of those atoms results in less toxicity, as evidenced by 17, 24 and 29.
All the descriptors, their definitions, contributions, and mechanistic interpretations are provided in Fig. 11 and Table S8 (ESI 2†).
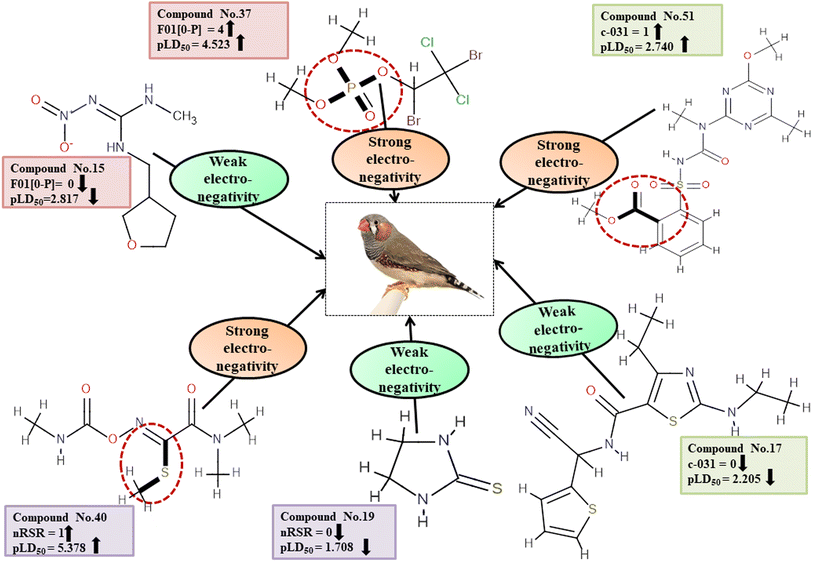 |
| | Fig. 11 Mechanistic interpretation of the descriptors associated with electronegativity between pesticides and ZF. | |
Descriptors related to hydrophilicity
There are two ways in which hydrophilicity can be manifested: either with polarity or with features such as branching. The incidence of two polar atoms in a compound makes it more hydrophilic, which has been linked to reduced chemical toxicity.4 The important 2D atom pair descriptors appearing in models are F04[O-S], B04[C-C], F06[C-S] and F05[C-S] (frequency of the oxygen and sulfur atoms, double carbon atoms, and carbon and sulphur atoms at topological distances 4, 4, 6 and 5 respectively). In our work, it was found that these descriptors were associated with negative regression coefficients which is indicative of their negative correlation with the toxicity of pesticides towards ZF being inversely proportional, i.e. compounds with more polar atoms become increasingly hydrophilic, thereby reducing their toxicity towards ZF. This is supported by 38, 45 and 51 (for F04[O-S]), 19 and 29 (for B04[C-C]), 17, 51 and 52 (for F06[C-S]), and 17, 46 and 52 (for F05[C-S]). Conversely, 14, 33 and 43 (for F04[O-S]), 1, 11 and 12 (for B04[C-C]), 2, 35 and 45 (for F06[C-S]) as well as 1, 34 and 43 (for F05[C-S]) demonstrate an increase in toxicity when fewer polar atoms are present.
All the descriptors, their definitions, contributions and mechanistic interpretation are depicted in Fig. 12 and summarized in Table S9 (ESI 2†).
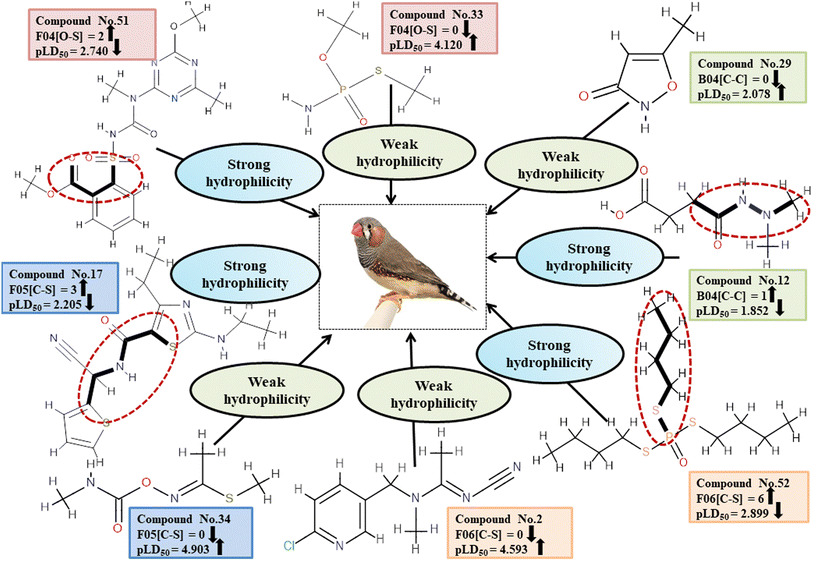 |
| | Fig. 12 Mechanistic interpretation of model descriptors associated with hydrophilicity. | |
Descriptors related to π–π interaction
In biological events, such as the recognition of proteins with their ligands, non-covalent interactions such as π–π interaction are crucial. T(O⋯Br), a type of 2D atom pair descriptor, accounts for the localization of oxygen and bromine atoms relative to each other. Moreover, there is a type of 2D atom pair descriptor known as B04[Cl-Cl], which is distinguished by the incidence of two chlorine atoms positioned at a topological distance of four. Electronegative substituents have an inductive effect, which reduces the electron density of the compounds.49 Therefore, when an O–Br fragment (for T(O⋯Br)) and a Cl–Cl fragment (for B04[Cl-Cl]) are added to an aromatic compound, the density of electrons around the ring structures declines, preventing electron–donor–acceptor interactions between pesticides and the reference species. The descriptor T(O⋯Br) negatively contributed to the toxicity of pesticides against ZF. Thus, the occurrence of T(O⋯Br) decreases pesticide toxicity towards ZF as shown in 8, 35 and 37; conversely, it has a higher level of toxicity for 2, 15 and 18. Similarly, a negative regression coefficient of the descriptor B04[Cl-Cl] highlights that the incidence of this feature decreases the toxicity profile of pesticides against ZF as demonstrated by 25 and 37. On the other hand, this same effect is not seen in 16, 42 and 43. All the descriptors, their definitions, contributions, and mechanistic interpretations are illustrated in Fig. 13 and presented in Table S10 of ESI 2.†
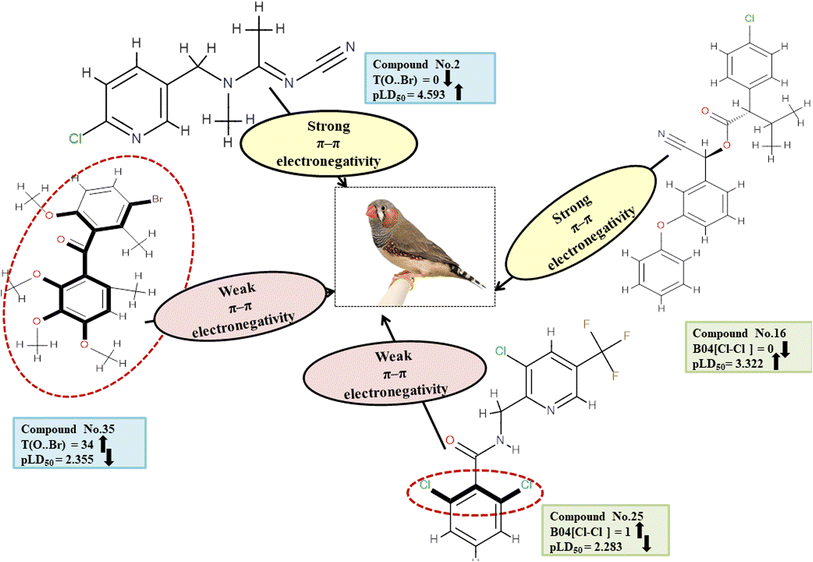 |
| | Fig. 13 Mechanistic interpretation of descriptors associated with π–π electronegativity. | |
i-QSTR models
We have generated interspecies QSTR models between BQ, MD, and ZF. Table 2 presents the statistical outcomes of the created interspecies models.
Table 2 Validation matrices for i-QSTR models
| Serial no. |
Variable |
Model equation |
Internal validation parameters |
External validation parameters |
|
X
|
Y
|
| 1 |
MD |
BQ |
pLD50 = 1.04409–0.44948 × SdsssP − 0.03983 × T(S⋯P) + 0.56158 × MD |
R
2 = 0.885,  |
R
2
(pred)/Q2(F1) = 0.916, Q2(F2) = 0.916, MAE95% = 0.116, Q2(F3) = 0.929 |
| Δr2m(LOO) = 0.083 |
| 2 |
ZF |
BQ |
pLD50 = 0.90861 + 1.6832 × X4Av + 0.37234 × B05[O-Cl] + 0.5457 × ZF |
R
2 = 0.967,  , Δr2m(LOO) = 0.041 , Δr2m(LOO) = 0.041 |

|
|
Q
2
(F3) = 0.966 |
| 3 |
ZF |
MD |
pLD50 = 0.48715 + 0.24639 × T(S⋯S) − 0.50816 × F05[C-P] + 0.73268 × ZF |
R
2 = 0.940,  , Δr2m(LOO) = 0.054 , Δr2m(LOO) = 0.054 |

|
|
Q
2
(F3) = 0.688 |
Interpretation of model descriptors of i-QSTR
The response is assigned as the Y-variable for the i-QSTR model. The organisms' toxicity is used as an end point, while the toxicity of other endpoint organisms serves as the independent variable (variable X) for prediction. A significant overlap between the numerical value of toxicity of selected chemicals for one endpoint and the corresponding values for the other endpoint indicates a similar mechanism of action of these compounds.
MD toxicity (predictor variable X) and BQ toxicity (response variable Y) and vice versa
Toxicity endpoints of two avian species, which exhibit a direct association (indicated by positive regression coefficients), serve as vital descriptors for their respective interspecies models. The MD(X)–BQ(Y) interspecies model was developed using SdsssP and T(S⋯P), two additional descriptors with positive regression coefficients.
SdssP is a type of atom E-state molecular feature that accounts for the sum of the dsssP (>P![[double bond, length as m-dash]](https://www.rsc.org/images/entities/char_e001.gif) ) E-states. It has a negative contribution against BQ, which means higher values of SdssP render pesticides less toxic as shown in 6 (nonanoic acid) and 69 (carboxyl) and oppositely occurs in the case of 51 (Phorate) and 42 (fenamiphos).
) E-states. It has a negative contribution against BQ, which means higher values of SdssP render pesticides less toxic as shown in 6 (nonanoic acid) and 69 (carboxyl) and oppositely occurs in the case of 51 (Phorate) and 42 (fenamiphos).
Another important 2D atom pair descriptor, T(S⋯P), provides the sum of the topological separations between the atoms S and P. The incidence of two polar atoms makes the pesticides hydrophilic. The negative regression coefficient of this descriptor indicated that T(S⋯P) is inversely correlated with the toxicity of pesticides as shown in 55 (temephos) & 72 (ethion) and oppositely in the cases of 52 (disulfoton sulfoxide degradation) and 116 (fosthiazate).
ZF toxicity (predictor variable X) and BQ toxicity (response variable Y) and vice versa
The two avian species' toxicity end points are primary predictors for the interspecies models, with direct correlation resulting from positive regression coefficients. The descriptors X4Av and B05[O-Cl] were used for interspecies model development between MD (X) and BQ (Y). X4Av accounts for the mean of the 4th order valence connectivity index. The size of pesticides impacts their toxicity to avian species significantly. If the size increases, it enhances the hydrophobicity of the pesticides by increasing the surface area of the molecules. This descriptor contributed positively to chemical toxicity towards BQ as evidenced in 7 (dichlorvos) and 9 (ethaboxam) and oppositely occurs in 1 (alpha-cypermethrin) and 3 (cyantraniliprole).
The 2D atom pair descriptor, B05[O-Cl], defines the occurrence of oxygen and chlorine atoms at topological distance 5. When both electronegative atoms are present at this distance, the compounds become more electronegative. The positive regression coefficient associated with B05[O-Cl] reveals that the presence of O and Cl atoms at the stated topological distance contributes to higher toxicity in pesticides, as exemplified by 5 (cymoxanil) and 6 (dicamba) and the opposite was characterized in 19 (methamidophos) and 24 (oxamyl Vydate L formulation).
ZF toxicity (predictor variable X) and MD toxicity (response variable Y) and vice versa
The toxicity endpoints of two avian species, which are correlated and exhibit positive contributions towards toxicity, are the important X variables for the corresponding interspecies model development. The creation of the MD(X)-BQ(Y) interspecies model also makes use of the extra descriptors T(S⋯S) and F05[C-P], both of which have positive values of regression coefficients. A 2D atom pair descriptor known as T(S⋯S) is referred to as the total topological distance between two sulphur atoms. The sulfur atom (S) has electronegative properties, which helps improve the compound's electronegative properties.4 The positive value of the regression coefficient corresponding to T(S⋯S) indicates its direct correlation with pesticide toxicity as demonstrated by 23 (phorate) and 26 (tribufos) and the reverse by 6 (cymoxanil) and 12 (flazasulfuron).
F05[C-P] is a 2D atom pair type descriptor, that accounts for the carbon and phosphorus atoms in a compound at a topological distance of 5. 24 (phostebupirim oxygen analogue tebupirimphos) and 26 (tribufos) showed that increasing the F05[C-P] feature renders pesticides less toxic, whereas 19 (methamidophos) and 20 (methomyl) are showing higher toxicity due to higher numerical values of F05[C-P].
Applicability domain of i-QSTR models
In the present work, it was observed that all test compounds lie within the AD of i-QSTR except for the zebra finch (X)-bobwhite quail (Y) model, which showed 2 (ZF) is located outside the AD.
Comparison of the current study and previous research studies
Although it is not feasible to make a direct comparison due to variations in training and test sets, alongside differences in the modeling approach, we have endeavored to evaluate the present study with previously published studies.
In contrast, Banjare et al., 2021 (ref. 36) presented the QSTR and i-QSTR models of 3 avian species using a classification-based approach. Regression-based models can provide explicit quantitative predictions, whereas classification approaches can be employed for data filtration to commence research. The current models are also built utilizing a regression-based methodology with only a few well-chosen 2D characteristics. The utilization of scaling on the original descriptors, which are derived from linear combinations of the primary descriptors, within regression-based techniques offers a straightforward approach that effectively handles challenges such as descriptor inter-correlation, collinearity, high levels of noise, and a large number of descriptors.
Although Mukherjee et al., 2022 (ref. 4) used a regression-based GA-PLS method to develop the QSTR and interspecies models of five different avian species (bobwhite quail, mallard duck, house sparrow, ring-necked pheasant, and Japanese quail) they used a very small number of compounds in their datasets for BQ and MD whereas we have used a large dataset for BQ and MD. Additionally, we have used ZF species for model development. Several types of tree-based approaches were adopted by Basant et al., 2015 (ref. 5) to construct QSTR and i-QSTR models for multiple avian species. Some of the descriptors that appeared in their models are difficult to understand for beginners. Furthermore, no conformational analysis or energy minimization is required because the existing models are built just using chosen, simply understandable 2D descriptors. Furthermore, unlike machine learning models, the produced models are clear and easily transferable. In contrast, we have developed 15 QSTR and three i-QSTR models to extrapolate toxicity data for different avian species. As well, consensus modeling has been applied for the first time to reduce model error targeting diverse pesticide eco-toxicity on multiple avian species. In our work, intelligent consensus prediction using developed QSTR models has been carried out to achieve better predictions. Table 3 provides a comparison of current work and previous research studies.
Table 3 Analysis of the current study in contrast to earlier published studies
| Slno |
Models |
Number of compounds |
N
training/Ntest |
Type of avian species used for model development |
Defined endpoint |
QSTR method |
Results and discussion |
| 1 |
Present work |
BQ-364 |
276/88 |
Bobwhite quail |
14-day |
Regression based models along with ICP |
BQ: R
2
= 0.715–0.719, Q2
(LOO)
= 0.694–0.700, Q2
F1
= 0.722–0.732, Q2
F2
= 0.722–0.732, Q2
(F3)
= 0.679–0.690
|
| MD-247 |
182/65 |
Mallard duck |
LD50 |
MD: R
2
= 0.689–0.708, Q2
(LOO)
= 0.626–0.695, Q2
F1
= 0.620–0.639, Q2
F2
= 0.620–0.638, Q
2
(F3)
= 0.600–0.619
|
| ZF-53 |
40/13 |
Zebra finch |
|
ZF: R
2
= 0.754–0.758, Q2
(LOO)
= 0.697–0.722, Q
F1
2
= 0.787–0.830, Q
F2
2
= 0.786–0.829, Q2
(F3)
= 0.792–0.833
|
| 2 |
Banjare et al., 2021 (ref. 36) |
BQ-270 |
203/67 |
Bobwhite quail |
14 day |
GA-LDA along with interspecies correlation |
Classification-based QSAR approaches |
| MD-203 |
143/60 |
Mallard duck |
LD50 |
| ZF-44 |
31/12 |
Zebra finch |
|
| 3 |
Mukherjee et al., 2022 (ref. 4) |
BQ-128 |
103/25 |
Bobwhite quail |
14 day |
GA-PLS along with interspecies correlation |
BQ: R2 = 0.659, Q2(LOO) = 0.582, Q2F1 = 0.648, Q2F2 = 0.648 |
| MD-62 |
49/13 |
Mallard duck |
LD50 |
MD: R2 = 0.659, Q2(LOO) = 0.567, Q2F1 = 0.654, Q2F2 = 0.575 |
| HS-10 |
10/ |
House sparrow |
|
HS: R2 = 0.918, Q(LOO)2 = 0.861, QF12 = 0.943, QF22 = 0.883 |
| RNH-29 |
22/7 |
Ring-necked pheasant |
RNH: R2 = 0.760, Q2(LOO) = 0.601, Q2F1 = 0.648, Q2F2 = 0.643 |
| JQ-15 |
15/ |
Japanese quail |
JQ: R2 = 0.737, Q2(LOO) = 0.594 |
| 4 |
Basant et al., 2015 (ref. 5) |
BQ-131 |
98/33 |
Bobwhite quail |
14 day |
SDT, DTF, DTB |
Tree-based QSAR approaches |
| LD50 |
| 5 |
Mazzatorta et al., 2006 (ref. 23) |
BQ-116 |
94/19 |
Bobwhite quail |
14 day |
GA-SVM |
Support vector machines QSAR approaches |
| LD50 |
| 6 |
Leszczynski et al., 2020 (ref. 22) |
BQ-60 |
41/15 |
Bobwhite quail |
14 day |
GFA-PLS |
BQ: R2 = 0.67, Q2(LOO) = 0.63, Q2F1 = 0.70, Q2F2 = 0.68 |
| MD-60 |
42/14 |
Mallard duck |
LD50 |
MD: R2 = 0.75, Q2(LOO) = 0.67, Q2F1 = 0.88, Q2F2 = 0.87 |
| RNH-27 |
20/7 |
Ring-necked pheasant |
|
RNH: R2 = 0.89, Q2(LOO) = 0.80, Q2F1 = 0.87, Q2F2 = 0.87 |
Future scope
In the current work, we have employed QSTR and i-QSTR modelling using traditional linear regression-based approaches. Furthermore, advanced machine learning techniques viz. non-linear regression (https://github.com/ncordeirfcup/Non-linear-Regression-tools), convolutional neural networks (CNNs) and more specifically transformer-CNN (https://github.com/bigchem/transformer-cnn), etc. can be applied to develop more predictive QSTR and i-QSTR models on the currently employed dataset.53
Conclusions
The present study deals with one of the largest ever assembled dataset comprising 664 varied pesticides with defined pLD50 values against multiple avian species. Validation of all the developed models is strictly monitored to make sure that they are sufficient and robust for acceptance. The QSTR and i-QSTR model findings indicated that the models are statistically sound. Intelligent model consensus prediction revealed that the findings from the combined MLR models were better than those from the separate models. Furthermore, the results highlight the use of consensus modeling to reduce prediction errors. Consensus modelling is also expected to become a permanent part of hazard identification as in silico techniques advance, as single QSAR models cannot explain all variances inherent to hazard identification. According to MAE, the winning model is CM3 for all cases. Based on the developed models, we have found that electronegativity and lipophilicity contributed positively towards pesticide toxicity while polarity may reduce pesticide toxicity. The insights obtained from different models suggested that pesticides might show toxicity to different avian species through electrostatic interactions, π–π interactions, hydrophobic interactions, and hydrophilic interactions. Additionally, it has been proposed that compounds such as carbamate, oxygen, ether linkage, phosphate, and halogens (Cl and Br) affected avian toxicity in three different bird species. Finally, it can be said that these predictive QSTR and i-QSTR models will be helpful ing filling gaps in the toxicity dataset and assessing the toxicity profile of novel insecticides against various bird species.
Abbreviations
| 2D descriptors | Two dimensional descriptors |
| 2D-QSTR | Two dimensional-quantitative structure- toxicity relationship |
| AChE | Acetyl cholinesterase |
| AD | Applicability domain |
| BQ | Bobwhite quail |
| CM | Consensus model |
| CNS | Central nervous system |
| ECB | The European Chemicals Bureau |
| ECVAM | European center for the Validation of Alternative Methods |
| EPA | Environment Protection Agency |
| ETA | Extended topo chemical atom |
| GA | Genetic algorithm |
| GA-SVR method | Genetic algorithm (GA)-support vector regression (SVR) method |
| ICP | Intelligent consensus prediction |
| IM | Individual models |
| i-QSTR | Inter-species quantitative structure–toxicity relationship |
| LDA | Linear discriminant analysis |
| MD | Mallard duck |
| MLR | Multiple linear regression |
| OECD | The Organization for Economic Cooperation and Development |
| OPP | Office of Pesticides Program |
| pLD50 | Negative of the logarithmic value of half-maximal effective concentration (LD50) |
| PLS | Partial least squares |
| PNS | Peripheral nervous system |
| QSAR | Quantitative structure–activity relationship |
| QSPR | Quantitative structure–property relationship |
| REACH | Registration, Evaluation, Authorization, and Restrictions of Chemicals |
| REACH | Registration, Evaluation, Authorization, and Restriction of Chemicals |
| RMSEP | Root mean square error of prediction |
| SDs | Standard deviations |
| SVR | Support vector regression |
| US EPA | United States Environmental Protection Agency |
| ZF | Zebra finch |
Author contributions
Trina Podder: conceptualization, data curation, formal analysis, investigation, visualization, writing-review & editing. Ankur Kumar: conceptualization, investigation, visualization writing – review & editing. Arnab Bhattacharjee: writing – review & editing.
Conflicts of interest
The authors affirm that they have no known financial or interpersonal conflicts that would have appeared to have an impact on the research presented in this study.
Acknowledgements
We gratefully recognize the financial support provided to TP and AK in the form of a scholarship by the AICTE, New Delhi. AK acknowledges the financial assistance in the form of a project assistant received from the GPC regulatory India private limited. PKO expresses gratitude to Prof. Kunal Roy for providing the lab space necessary to complete this work.
References
- R. N. C. Guedes, G. Smagghe, J. D. Stark and N. Desneux, Pesticide Induced Stress in Arthropod Pests for Optimized Integrated Pest Management Programs, Annu. Rev. Entomol., 2016, 61, 43–62, DOI:10.1146/annurev-ento-010715-023646.
- M. Hamadache, O. Benkortbi, S. Hanini and A. Amrane, QSAR modeling in ecotoxicological risk assessment: application to the prediction of acute contact toxicity of pesticides on bees (Apis mellifera L.), Environ. Sci. Pollut. Res., 2018, 25, 896–907, DOI:10.1007/s11356-017-0498-9.
- R. Schmuck and G. Lewis, Review of field and monitoring studies investigating the role of nitro-substituted neonicotinoid insecticides in the reported losses of honey bee colonies (Apis mellifera), Ecotoxicology, 2016, 25, 1617–1629, DOI:10.1007/s10646-016-1734-7.
- R. K. Mukherjee, V. Kumar and K. Roy, Ecotoxicological QSTR and QSTTR Modeling for the Prediction of Acute Oral Toxicity of Pesticides against Multiple Avian Species, Environ. Sci. Technol., 2022, 56(1), 35–348, DOI:10.1021/acs.est.1c05732.
- N. Basant, S. Gupta and K. P. Singh, Predicting Toxicities of Diverse Chemical Pesticides in Multiple Avian Species Using Tree Based QSAR Approaches for Regulatory Purposes, J. Chem. Inf. Model., 2015, 55, 1337–1348, DOI:10.1021/acs.jcim.5b00139.
- G. M. Hilton, E. Odenkirchen, M. Panger, G. Waleko, A. Lowit and A. J. Clippinger, Evaluation of the avian acute oral and sub-acute dietary toxicity test for pesticide registration, Regul. Toxicol. Pharmacol., 2019, 105, 30–35, DOI:10.1016/j.yrtph.2019.03.013.
- M. W. Aktar, D. Sengupta and A. Chowdhury, Impact of pesticides use in agriculture: their benefits and hazards, Interdiscip. Toxicol., 2009, 2(1), 1–12, DOI:10.2478/v10102-009-0001-7.
- A. W. Hawkes, L. W. Brewer, J. F. Hobson, M. J. Hooper and R. J. Kendall, Survival and the cover-seeking response of northern bobwhites and mourning doves dosed with aldicarb, Environ. Toxicol. Chem., 1996, 15, 1538–1543, DOI:10.1002/etc.5620150916.
- A. Mitra, C. Chatterjee and F. B. Mandal, Synthetic chemical pesticides and their effects on birds, Res. J. Environ. Toxicol., 2011, 5, 81–96, DOI:10.3923/rjet.2011.81.96.
- K. L. Stromborg, Reproductive toxicity of monocrotophos to bobwhite quail, Poult. Sci., 1986, 65, 51–57, DOI:10.3382/ps.0650051.
- E. F. Hill, M. B. Camardese, G. H. Heinz, J. W. Spann and A. B. Debevec, The acute toxicity of diazinon is similar for eight stocks of bobwhite, Environ. Toxicol. Chem., 1984, 3, 61–66, DOI:10.1002/etc.5620030108.
- J. S. Jaworska, M. Comber, C. Auer and C. J. Van Leeuwen, Summary of a workshop on regulatory acceptance of (Q)SARs for human health and environmental endpoints, Environ. Health Perspect., 2003, 111, 1358–1360, DOI:10.1289/ehp.5757.
- S. K. Pandey, P. K. Ojha and K. Roy, Exploring QSAR models for assessment of acute fish toxicity of environmental transformation products of pesticides (ETPPs), Chemosphere, 2020, 252, 126508, DOI:10.1016/j.chemosphere.2020.126508.
- M. Pavan and A. P. Worth, Publicly-accessible QSAR software tools developed by the Joint Research Centre, SAR QSAR Environ. Res., 2008, 19, 785–799, DOI:10.1080/10629360802550390.
-
P. Jeschke, W. Kramer, U. Schirmer and M. Witschel, Modern methods in crop protection research, Wiley-VCH, Germany., 2012, 21– 41 Search PubMed.
- J. C. Dearden, The history and development of quantitative structure-activity relationships (QSARs), Int. J. Quant. Struct.-Prop. Relat., 2016, 1(1), 1–44, DOI:10.4018/978-1-5225-0549-5.ch003.
- P. Banjare, J. Singh and P. P. Roy, QSTR analysis of acute rat oral toxicity of amide pesticides, Int. J. Quant. Struct.-Prop. Relat., 2020, 5(2), 73–99, DOI:10.4018/IJQSPR.2020040103.
- N. Klüver, C. Vogs, R. Altenburger, B. I. Escher and S. Scholz, Development of a general baseline toxicity QSAR model for the fish embryo acute toxicity test, Chemos, 2016, 164, 164–173, DOI:10.1016/j.chemosphere.2016.08.079.
- J. Roy, S. Ghosh, P. K. Ojha and K. Roy, Predictive quantitative structure–property relationship (QSPR) modeling for adsorption of organic pollutants by carbon nanotubes (CNTs), Environ. Sci.: Nano, 2019, 6, 224, 10.1039/c8en01059e.
- J. Devillers, H. Devillers, E. Bro and F. Millot, Expert judgment based multicriteria decision models to assess the risk of pesticides on reproduction failures of grey partridge, SAR QSAR Environ. Res., 2017, 28(11), 889–911, DOI:10.1080/1062936X.2017.1402449.
- E. Benfenati, N. Piclin, A. Roncaglioni and M. R. Varìous, Factors influencing predictive models for toxicology, SAR QSAR Environ. Res., 2011, 12(6), 593–603, DOI:10.1080/10629360108039836.
- S. Kar and J. Leszczynski, Is intraspecies QSTR model answer to toxicity data gap filling: Ecotoxicity modeling of chemicals to avian species?, Sci. Total Environ., 2020, 738, 139858, DOI:10.1016/j.scitotenv.2020.139858.
- P. Mazzatorta, M. T. D. Cronin and E. Benfenati, A QSAR study of avian oral toxicity using support vector machines and genetic algorithms, QSAR Comb. Sci., 2006, 25(7), 616–628, DOI:10.1002/qsar.200530189.
- A. A. Toropov and E. Benfenati, QSAR models of quail dietary toxicity based on the graph of atomic orbitals, Bioorg. Med. Chem. Lett., 2006, 16, 1941–1943, DOI:10.1016/j.bmcl.2005.12.085.
- A. A. Toropov and E. Benfenati, Optimization of correlation weights of SMILES invariants for modeling oral quail toxicity, Eur. J. Med. Chem., 2007, 42, 606–613, DOI:10.1016/j.ejmech.2006.11.018.
- C. Zhang, F. Cheng, L. Suna, S. Zhuang, W. Li, G. Liu, P. W. Lee and Y. Tang,
In silico prediction of chemical toxicity on avian species using chemical category approaches, Chemos, 2015, 122, 280–287, DOI:10.1016/j.chemosphere.2014.12.001.
- K. Wu and G. W. Wei, Quantitative toxicity prediction using topology based multitask deep neural networks, J. Chem. Inf. Model., 2018, 58, 520–531, DOI:10.1021/acs.jcim.7b00558.
-
A. Speck-Planche, Multi-Scale QSAR Approach for Simultaneous Modeling of Ecotoxic Effects of Pesticides, in Ecotoxicological QSARs, Methods in Pharmacology and Toxicology, Humana Press, New York, NY, 2020, pp. 639–660 Search PubMed.
- A. Speck-Planche, V. V. Kleandrova, F. Luan and M. N. D. Cordeiro, Predicting multiple ecotoxicological profiles in agrochemical fungicides: a multi-species chemoinformatic approach, Ecotoxicol. Environ. Saf., 2012, 80, 308–313, DOI:10.1016/j.ecoenv.2012.03.018.
- J. A. Awkerman, S. Raimondo and M. G. Barron, Development of species sensitivity distributions for wildlife using interspecies toxicity correlation models, Environ. Sci. Technol., 2008, 42, 3447–3452, DOI:10.1021/es702861u.
- V. Kleandrova, F. Luan, A. Speck-Planche and N. D. Cordeiro, In silico assessment of the acute toxicity of chemicals: recent advances and new model for multitasking prediction of toxic effect, Mini-Rev. Med. Chem., 2015, 15(8), 677–686, DOI:10.2174/1389557515666150219143604.
- A. Speck-Planche and M. N. D. Cordeiro, De novo computational design of compounds virtually displaying potent antibacterial activity and desirable in vitro ADMET profiles, Med. Chem. Res., 2017, 26, 2345–2356, DOI:10.1007/s00044-017-1936-4.
- A. Speck-Planche and M. N. D. S. Cordeiro, Enabling virtual screening of potent and safer antimicrobial agents against noma: mtk-QSBER model for simultaneous prediction of antibacterial activities and ADMET properties, Mini-Rev. Med. Chem., 2015, 15(3), 194–202 CrossRef CAS PubMed.
- E. Tenorio-Borroto, C. G. Penuelas-Rivas, J. C. Vasquez-Chagoyan, N. Castanedo, F. J. Prado-Prado, X. Garcia-Mera and H. Gonzalez-Diaz, Model for high-throughput screening of drug immunotoxicity–study of the anti-microbial G1 over peritoneal macrophages using flow cytometry, Eur. J. Med. Chem., 2014, 72, 206–220, DOI:10.1016/j.ejmech.2013.08.035.
- E. Tenorio-Borroto, N. Castanedo, X. Garcia-Mera, K. Rivadeneira, J. C. Vazquez Chagoyan, A. Barbabosa Pliego, C. R. Munteanu and H. Gonzalez-Diaz, Perturbation theory machine learning modeling of immunotoxicity for drugs targeting inflammatory cytokines and study of the antimicrobial g1 using cytometric bead arrays, Chem. Res. Toxicol., 2019, 32(9), 1811–1823, DOI:10.1021/acs.chemrestox.9b00154.
- P. Banjare, J. Singh and P. P. Roy, Predictive classification-based QSTR models for toxicity study of diverse pesticides on multiple avian species, Environ. Sci. Pollut. Res., 2021, 28, 17992–18003, DOI:10.1007/s11356-020-11713-z.
- D. Ballabio, V. Consonni, A. Mauri, M. Claeys-Bruno, M. Sergent and R. Todeschini, A novel variable reduction method adapted from space-filling designs, Chemom. Intell. Lab. Syst., 2014, 136, 147–154, DOI:10.1016/j.chemolab.2014.05.010.
-
A. Mauri, alvaDesc: A Tool to Calculate and Analyze Molecular Descriptors and Fingerprints, in Ecotoxicological QSARs, Methods in Pharmacology and Toxicology, Humana Press, New York, NY, 2020, pp. 801–820, DOI: DOI:10.1007/978-1-0716-0150-1_32.
- H. S. Park and C. H. Jun, A simple and fast algorithm for K-medoids clustering, Expert Syst. Appl., 2009, 36, 3336–3341, DOI:10.1016/j.eswa.2008.01.039.
- S. Das, P. K. Ojha and K. Roy, Multilayered variable selection in QSPR: a case study of modeling melting point of bromide ionic liquids, Int. J. Quant. Struct.-Prop. Relat., 2017, 2(1), 106–124, DOI:10.4018/IJQSPR.2017010108.
- P. K. Ojha and K. Roy, Comparative QSARs for antimalarial endochins: importance of descriptor-thinning and noise reduction prior to feature selection, Chemom. Intell. Lab. Syst., 2011, 109(2), 146–161, DOI:10.1016/j.chemolab.2011.08.007.
-
R. B. Darlington, in Regression and linear models, McGraw-Hill, New York, 1990 Search PubMed.
- D. Rogers and A. J. Hopfinger, Application of genetic function approximation to quantitative structure-activity relationships and quantitative structure-property relationships, J. Chem. Inf. Comput. Sci., 1994, 34, 854–866 CrossRef CAS.
- K. Roy, R. N. Das, P. Ambure and R. B. Aher, Be aware of error measures. Further studies on validation of predictive QSAR models, Chemom. Intell. Lab. Syst., 2016, 152, 18–33, DOI:10.1016/j.chemolab.2016.01.008.
- K. Roy and S. Kar, The rm2 metrics and regression through origin approach: reliable and useful validation tools for predictive QSAR models (Commentary on ‘Is regression through origin useful in external validation of QSAR models?’), Eur. J. Pharm. Sci., 2014, 62, 111–114, DOI:10.1016/j.ejps.2014.05.019.
- K. Roy, S. Kar, P. Ambure and P. K. Ojha, Is it possible to improve the quality of predictions from an “intelligent” use of multiple QSAR/QSPR/QSTR models?, J. Chemom., 2018, 32(4), 2992, DOI:10.1002/cem.2992.
- P. K. Ojha, I. Mira, R. N. Das and K. Roy, Further exploring rm 2 metrics for validation of QSPR models, Chemom. Intell. Lab. Syst., 2011, 107(1), 194–205, DOI:10.1016/j.chemolab.2011.03.011.
- K. Roy, S. Kar and P. Ambure, On a simple approach for determining applicability domain of QSAR models, Chemom. Intell. Lab. Syst., 2015, 145, 22–29, DOI:10.1016/j.chemolab.2015.04.013.
- P. P. Roy, P. Banjare, S. Verma and J. Singh, Acute rat and mouse oral toxicity determination of anticholinesterase inhibitor carbamate pesticides: a QSTR approach, Mol. Inf., 2019, 38, 1–16, DOI:10.1002/minf.201800151.
- L. B. Kier and L. H. Hall, The meaning of molecular connectivity: A bimolecular accessibility model, Croat. Chem. Acta, 2002, 75(2), 371–382 CAS.
- P. Jeschke and R. Nauen, Neonicotinoids from zero to hero in insecticide chemistry, Pest Manage. Sci., 2008, 64, 1084–1098, DOI:10.1002/ps.1631.
- S. Ghosh, P. K. Ojha, E. Carnesecchi, A. Lombardo, K. Roy and E. Benfenati, Exploring QSAR modeling of toxicity of chemicals on earthworm, Ecotoxicol. Environ. Saf., 2020, 190, 110067, DOI:10.1016/j.ecoenv.2019.110067.
- H. Sandhu, R. N. Kumar and P. Garg, Machine learning-based modeling to predict inhibitors of acetyl cholinesterase, Mol. Diversity, 2021, 27, 1008, DOI:10.1007/s11030-021-10223-5.
Footnote |
| † Electronic supplementary information (ESI) available: Toxicity values against BQ (bobwhite quail), MD (mallard duck), and ZF (zebra finch) for each drug in the entire dataset, along with its SMILES and CAS number; model descriptors for the BQ (bobwhite quail) five individual QSTR models (M1–M5), the MD (mallard duck) five individual QSTR models (N1–N5), the ZF (zebra finch) five individual QSTR models (S1–S5), and the three i-QSTR models (IS1–IS3). Different statistical parameters, the domain-standardization process' applicability, and the mechanistic interpretation of descriptors in the dataset of each distinct QSTR model for BQ (Tables S1–S3), MD (Tables S4–S7), and ZF (Tables S8–S10) are all used. See DOI: https://doi.org/10.1039/d3va00163f |
|
| This journal is © The Royal Society of Chemistry 2023 |
Click here to see how this site uses Cookies. View our privacy policy here.  Open Access Article
 *
*
![[thin space (1/6-em)]](https://www.rsc.org/images/entities/char_2009.gif) 229 cases by Speck-Planche et al., 2017.32 Speck-Planche et al., 2015,33 developed the first mtk-QSBER model employing a large and heterogeneous dataset of chemicals, which integrates dissimilar kinds of chemical and biological data. Tenorio-Borroto et al., 2014,34 utilized the TOPS-MODE approach to develop an mt-QSAR model to calculate drug molecular descriptors and the linear discriminant analysis (LDA) function, adding a new tool in the domain of high-throughput screening in drug discovery. Tenorio-Borroto et al., 2019,35 employed perturbation theory machine learning (PTML) methodology for predicting the immunotoxicity of drugs targeting inflammatory cytokines and studying the antimicrobial G1 using cytometric bead arrays.
229 cases by Speck-Planche et al., 2017.32 Speck-Planche et al., 2015,33 developed the first mtk-QSBER model employing a large and heterogeneous dataset of chemicals, which integrates dissimilar kinds of chemical and biological data. Tenorio-Borroto et al., 2014,34 utilized the TOPS-MODE approach to develop an mt-QSAR model to calculate drug molecular descriptors and the linear discriminant analysis (LDA) function, adding a new tool in the domain of high-throughput screening in drug discovery. Tenorio-Borroto et al., 2019,35 employed perturbation theory machine learning (PTML) methodology for predicting the immunotoxicity of drugs targeting inflammatory cytokines and studying the antimicrobial G1 using cytometric bead arrays. are greater than 0.5 in all cases while Δr2m values should be less than 0.2.44 The equations employed for the estimation of internal and external statistical parameters are given in ESI 2.†

![[double bond, length as m-dash]](https://www.rsc.org/images/entities/char_e001.gif) X, signifies the presence of a phosphate group within the molecules. The presence of P atoms in the molecule increases electronegativity, thus favoring bonding with the receptor. The positive regression coefficient of p-117 implied that the occurrence of O and P atoms makes the pesticides more toxic as depicted in 71, 143, and 208 and their absence makes the pesticides less toxic as explained in 3, 7 and 19.
X, signifies the presence of a phosphate group within the molecules. The presence of P atoms in the molecule increases electronegativity, thus favoring bonding with the receptor. The positive regression coefficient of p-117 implied that the occurrence of O and P atoms makes the pesticides more toxic as depicted in 71, 143, and 208 and their absence makes the pesticides less toxic as explained in 3, 7 and 19.


![[thin space (1/6-em)]](https://www.rsc.org/images/entities/char_2009.gif) D, or partition coefficient, log
D, or partition coefficient, log![[thin space (1/6-em)]](https://www.rsc.org/images/entities/char_2009.gif) P. nBridgeHead accounts for the bridgehead atoms present in the ring structure, such as phosphates, sulfates, and thiophosphate. A cyclic compound has a higher lipophilicity than an open-chain compound.51 Lipophilic substances are more likely to accumulate within cells, resulting in a heightened concentration within the organism that can lead to heightened toxic effects.52 This descriptor displays a positive regression coefficient and, therefore, has a positive impact on the response. Therefore, the pesticides as shown in 20, 85 and 86 containing bridgehead atoms are more toxic than those compounds without bridgehead atoms as shown in 49, 180 and 235.
P. nBridgeHead accounts for the bridgehead atoms present in the ring structure, such as phosphates, sulfates, and thiophosphate. A cyclic compound has a higher lipophilicity than an open-chain compound.51 Lipophilic substances are more likely to accumulate within cells, resulting in a heightened concentration within the organism that can lead to heightened toxic effects.52 This descriptor displays a positive regression coefficient and, therefore, has a positive impact on the response. Therefore, the pesticides as shown in 20, 85 and 86 containing bridgehead atoms are more toxic than those compounds without bridgehead atoms as shown in 49, 180 and 235.


![[double bond, length as m-dash]](https://www.rsc.org/images/entities/char_e001.gif) ) E-states. It has a negative contribution against BQ, which means higher values of SdssP render pesticides less toxic as shown in 6 (nonanoic acid) and 69 (carboxyl) and oppositely occurs in the case of 51 (Phorate) and 42 (fenamiphos).
) E-states. It has a negative contribution against BQ, which means higher values of SdssP render pesticides less toxic as shown in 6 (nonanoic acid) and 69 (carboxyl) and oppositely occurs in the case of 51 (Phorate) and 42 (fenamiphos).


