
 Open Access Article
 This Open Access Article is licensed under a Creative Commons Attribution-Non Commercial 3.0 Unported Licence
Synthesis and characterization of fluorescent gold clusters encapsulated in PNIPAM and PAAM hydrogels for selective detection of mercury in water†
Gustavo A.
Monti
 *ab,
Gustavo A.
Pino
cde and
Diego
Acevedo
ab
*ab,
Gustavo A.
Pino
cde and
Diego
Acevedo
ab
aInstituto de Investigaciones en Tecnologías Energéticas y Materiales Avanzados, IITEMA, (CONICET-UNRC) Universidad Nacional de Río Cuarto, Facultad de Ingeniería, Dpto. de Tecnología Química, 5800, Río Cuarto, Argentina. E-mail: gmonti@exa.unrc.edu.ar
bInstituto de Investigaciones en Tecnologías Energéticas y Materiales Avanzados, IITEMA, (CONICET-UNRC) Universidad Nacional de Río Cuarto, Facultad de Ciencias Exactas Físico-Químicas y Naturales, Dpto. de Química, 5800, Río Cuarto, Argentina
cINFIQC: Instituto de Investigaciones en Fisicoquímica de Córdoba (CONICET – UNC) – Haya de la Torre y Medina Allende, Ciudad Universitaria, X5000HUA, Córdoba, Argentina
dDepartamento de Fisicoquímica, Facultad de Ciencias Químicas – Universidad Nacional de Córdoba – Haya de la Torre y Medina Allende, Ciudad Universitaria, X5000HUA, Córdoba, Argentina
eCentro Láser de Ciencias Moleculares – Universidad Nacional de Córdoba - Haya de la Torre s/n, Pabellón Argentina, Ciudad Universitaria, X5000HUA, Córdoba, Argentina
First published on 13th September 2023
Abstract
The present work describes the synthesis of new nanomaterials based on gold nanoclusters (AuNCs) supported on poly(N-isopropylacrylamide) (PNIPAM) and polyacrylamide (PAAM) hydrogels, as well as their characterization in terms of structure and physicochemical properties. AuNCs were synthesized by incorporating the metallic precursor (Au3+) into the polymeric matrices and subsequently reducing it with UV-vis light (λ = 365 nm). The materials were characterized by UV-vis, FT-IR, fluorescence spectroscopy, TEM and SEM. Likewise, the thermal properties and the swelling capacity of the different polymer matrices were determined. In addition, we present a comparative study with two nanomaterials regarding their behavior for the selective detection of Hg2+ in water. Furthermore, it is demonstrated that the polymer matrices influence the nanomaterials' selectivity to mercury. As the AuNCs fluorescence incorporated in both matrices is quenched by Hg2+, the materials can be used to sense sensitively and selectively Hg2+ in water with a detection limit of 4.1 nM and 1.3 nM for Au-PNIPAM and Au-PAAM NCs, respectively. Summarizing, our study presents a novel, easy and straightforward route to synthesized nanomaterials with unique optical and chemical properties, which could be used for the construction of a portable Hg2+ detection device.
Environmental significancePrecise and efficient detection of mercury in water is a fundamental challenge to protect the environment and human health. In this work, we present a novel approach for the detection of mercury in water using gold nanoclusters supported on polymer matrices. Our approach has demonstrated high sensitivity and selectivity for the detection of mercury in water samples. The approach could have a significant impact on protecting the environment and human health by enabling early detection of mercury, which can help prevent exposure to this dangerous pollutant and reduce negative effects on aquatic life and the ecosystem. In addition, the technology we have developed could be applied in other areas where early and efficient detection of pollutants in the environment is required, which could have a positive impact on environmental protection and human health around the world. |
Introduction
Contamination of drinking water and food with heavy metals is a social problem in many regions of the world. Especially in the Pampas plains of our country, with a rural population of more than 1![[thin space (1/6-em)]](https://www.rsc.org/images/entities/char_2009.gif) 000000 inhabitants, soil and groundwater can be contaminated with Hg, Cr, and As.1 The presence of heavy metals in water can be harmful to human health, for this reason the World Health Organization (WHO) has set the limit of Hg in drinking water at 0.001 mg L−1.2,3 The determination and quantification of these contaminants demand expensive and sophisticated instruments and complicated sample preparation processes.4 A fast, simple, and efficient alternative for the sensitive optical detection of heavy metals is the use of highly fluorescent metal nanoclusters (MNCs) supported on different matrices.5 MNCs consist of only a few atoms of the metal (Mn, n = 2–20) and are interesting because of their ultra-small size, excellent fluorescent properties, low toxicity, and high stability.6 An interesting strategy is to synthesize MNCs supported on scaffolded matrices such as polymers, DNA, and hydrogels.7–9 It is known that the matrix-MNC combination affects the optical properties of the systems, giving them great selectivity for the specific detection of some heavy metals in water by fluorescence quenching.10,11 Several matrices can be employed, the hydrogels present several advantages such as high hydrophilicity, easy synthesis, and high swelling in water, among others.12,13 In this sense, three-dimensional crosslinked networks of hydrophilic polymer chains where the free polymer segments are solvated by water constitute a hydrogel. Among the most studied hydrogels are those formed by different polyacrylamides such as poly(N-isopropylacrylamide) (PNIPAM) and polyacrylamide (PAAM).14–17 Polyacrylamide gels can be easily fabricated into macroscopic shapes. Polymerization of an acrylamide monomer together with an appropriate cross-linker in a concentrated aqueous solution produces a solid gel that fills the mold or copies the shape of the solution container.18 Since the radical polymerization produces a distribution of chain lengths with a random distribution of cross-links, the structures are a 3D network with open and connected nanopores.19 One of the most interesting features is their capability of swelling greatly in water exposing the polymer chains to the aqueous media.13 The ability of hydrogels to absorb water arises from hydrophilic functional groups attached to the polymer backbone while their resistance to dissolution arises from cross-links between network chains.20 Water inside the hydrogel allows free diffusion of some solute molecules, while the polymer serves as a matrix to hold water together. Hydrogels may exhibit drastic volume changes in response to specific external stimuli, such as temperature, solvent quality, pH, electric field, etc.21 Such is the case of PNIPAM that in addition to great swelling in water, PNIPAM presents thermosensitive properties since it undergoes a hydrophilic to hydrophobic phase transition at temperatures (32–34 °C).22 In addition, the mechanical properties of hydrogels allow them to be used as matrix not only to contain active materials but also to sense different chemical species, such as heavy metals (As,23 Fe24), dopamine,25 among others.
000000 inhabitants, soil and groundwater can be contaminated with Hg, Cr, and As.1 The presence of heavy metals in water can be harmful to human health, for this reason the World Health Organization (WHO) has set the limit of Hg in drinking water at 0.001 mg L−1.2,3 The determination and quantification of these contaminants demand expensive and sophisticated instruments and complicated sample preparation processes.4 A fast, simple, and efficient alternative for the sensitive optical detection of heavy metals is the use of highly fluorescent metal nanoclusters (MNCs) supported on different matrices.5 MNCs consist of only a few atoms of the metal (Mn, n = 2–20) and are interesting because of their ultra-small size, excellent fluorescent properties, low toxicity, and high stability.6 An interesting strategy is to synthesize MNCs supported on scaffolded matrices such as polymers, DNA, and hydrogels.7–9 It is known that the matrix-MNC combination affects the optical properties of the systems, giving them great selectivity for the specific detection of some heavy metals in water by fluorescence quenching.10,11 Several matrices can be employed, the hydrogels present several advantages such as high hydrophilicity, easy synthesis, and high swelling in water, among others.12,13 In this sense, three-dimensional crosslinked networks of hydrophilic polymer chains where the free polymer segments are solvated by water constitute a hydrogel. Among the most studied hydrogels are those formed by different polyacrylamides such as poly(N-isopropylacrylamide) (PNIPAM) and polyacrylamide (PAAM).14–17 Polyacrylamide gels can be easily fabricated into macroscopic shapes. Polymerization of an acrylamide monomer together with an appropriate cross-linker in a concentrated aqueous solution produces a solid gel that fills the mold or copies the shape of the solution container.18 Since the radical polymerization produces a distribution of chain lengths with a random distribution of cross-links, the structures are a 3D network with open and connected nanopores.19 One of the most interesting features is their capability of swelling greatly in water exposing the polymer chains to the aqueous media.13 The ability of hydrogels to absorb water arises from hydrophilic functional groups attached to the polymer backbone while their resistance to dissolution arises from cross-links between network chains.20 Water inside the hydrogel allows free diffusion of some solute molecules, while the polymer serves as a matrix to hold water together. Hydrogels may exhibit drastic volume changes in response to specific external stimuli, such as temperature, solvent quality, pH, electric field, etc.21 Such is the case of PNIPAM that in addition to great swelling in water, PNIPAM presents thermosensitive properties since it undergoes a hydrophilic to hydrophobic phase transition at temperatures (32–34 °C).22 In addition, the mechanical properties of hydrogels allow them to be used as matrix not only to contain active materials but also to sense different chemical species, such as heavy metals (As,23 Fe24), dopamine,25 among others.
Several research articles demonstrate that toxic heavy-metal ions may be detected by hydrogels through the spectroscopic method. For example, mercury can be detected using thymine-rich DNA-polyacrylamide hydrogels.26 The Hg2+ in the gel was detected by green fluorescence, after the binding mercury between two thymine bases and the addition of SYBR Green I dye. A reliable visual detection of 10 nM Hg2+ ions is possible with additional value-added capabilities, such as mercury removal through interaction with acrylamide. On the other hand, other authors showed that heavy metal ions can be detected by the fluorescence of MNCs embedded in hydrogels, such as AuNC, AgNC, CuNC, etc.27–30 Particularly, the fluorescence of gold nanocluster (AuNCs) is quenched through electron transfer from heavy-metal ions.27 AuNC-based sensors provide a 5 nM linear detection range for Hg2+ ions.31 One strategy for MNCs preparation is to use pre-formed hydrogels. A pre-formed hydrogel acts as a microreactor, in which metal nanostructures are formed from its precursor, after a series of required treatments. The metal ions can be absorbed by the hydrogels functional group by electrostatic or dipole ion interaction. During the absorption, the ion exchange occurs between metal ions present in the solution and the functional group present within the hydrogel. After absorption, metal ions can be reduced with reducing agents such as NaBH4,32 H2,33 citrate,34 our UV-vis light,35,36 which contribute to different particle sizes from nanoparticles to MNCs.37 Therefore, it is expected that this synthetic method of matrix-MNCs allows the design and construction of metal ion sensors and photocatalysts for the remediation of contaminated water suitable for use, without the problem of being released into the water that is being purified. The use of MNCs-embedded hydrogels for the fluorescence detection of mercury ions in water offers numerous advantages and practical applications compared to other methods. The hydrogels can be designed with high affinity and selectivity towards the mercury ion, allowing highly sensitive and specific detection. They generally have a fast response time, which results in shorter detection times.
Moreover, the MNCs incorporated into the matrix could enable the construction of a portable and straightforward sampling material to mercury detection. In this way, the MNCs hydrogel can be transported to a specific location where sampling is required, allowed for water uptake, and then determinate the Hg content in the laboratory. In addition, hydrogel-based sensors are relatively easy to use and do not require complex laboratory equipment, which increases their ease of use and portability.
This work describes the synthesis and physicochemical characterization of AuNCs supported on polymeric matrices based on PNIPAM and PAAM hydrogels. Also, the active AuNCs inside the matrix was employed and tested as a probe of concept for the development of a portable fluorescent sensor to detect and quantify heavy metals (Hg2+) in contaminated water. In summary, this work shows a simple, straightforward manner to produce a useful device that allows the detection of Hg2+ in concentration above the allowed WHO limit in drinking water.
Experimental
Material and methods
Hydrogel synthesis
The N-isopropylacrylamide (PNIPAM, Scheme 1E) and poly(acrylamide) (PAAM, Scheme 1F) hydrogels were synthetized using the same method. Firstly, 1.5 mmol of the monomer (either NIPAM or PAAM), and 0.06 mmol of BIS (as a crosslinking agent) were dissolved in 3 mL of distilled water, resulting in a 0.5 M monomer solution. The hydrogel free radical polymerization was carried out in a glass tube at room temperature (22 °C) for 3 h, using APS (0.01 mmol) and TEMED (0.03 mL) as redox initiators. After the polymerization, the hydrogel pieces were immersed in distilled water at room temperature for 48 h. The distilled water was renewed every hour to remove soluble by-products4,38 Then, the hydrogels were dried for 48 h at 25 °C and moderate vacuum (0.1 atm) for later use. | ||
| Scheme 1 Chemical structure of reagents and polymeric hydrogels synthesized: (A) NIPAM, (B) AAM, (C) TEMED, (D) BIS, (E) PNIPAM, and (F) PAAM. | ||
The chemical composition of the hydrogels and the nanocomposites were analyzed by FTIR-ATR. The spectra were obtained by an ATR-FTIR Bruker Tensor 27 spectrometer in absorbance mode using air as a background. In the first place, the samples were dried for 48 h at 30 °C under a dynamic vacuum system.
Also, A Carl Zeiss EVO MA10 scanning electron microscope with an integrated EDX system was used to examine the morphology of the polymers and the nanocomposites. The materials were lyophilized to preserve the gel structure during drying, after that the samples were gold-coated for conductance.
A Fluoromax Horiba Plus spectrofluorometer was employed to analyze the fluorescent properties of the nanomaterials.
The thermo-responsive performance of hydrogels was characterized via differential scanning calorimetry (DSC). A Netzsch DSC-204-F1-Phoenix differential scanning calorimeter equipped with a cooling device was used to perform the test. The hydrogels were characterized at a 5.0 °C min−1 heating and cooling rate for 2 cycles from −10 °C to 40 °C to study the effects of gold nanomaterials in the hydrogels.
Transmission electron microscopy (TEM) micrographs were recorded by using a Joel JEM-1400 microscope at 20–120 kV. For TEM analysis, a drop of AuNCs was suspended onto a copper-coated grid. The grids were dried in a desiccator for 24 h and then they were examined. Histogram AuNCs by number (n) were made with “ImageJ” program, which captures the scale of TEM micrographs.
Hydrogels swelling kinetics
Swelling kinetic measurements were carried out for PNIPAM and PAAM hydrogels employing two different media: (i) distilled water, and (ii) solutions of gold nanoparticles precursor HAuCl4 (Au3+ 0.5 mM and Au3+ 1 mM). Dried hydrogel disks, previously washed and weighed, were placed in the media at room temperature (20 °C). The samples were removed from the solution, at certain time intervals, superficially dried with tissue paper, weighed in an analytic balance, and placed back in the solution. The swelling percentage is calculated as a function of time according to eqn (1):13 | (1) |
Detection of heavy metals contaminants
A stock solution of HgCl2 (10 mM) was prepared, which was then diluted in bidistilled water to form 1 μM Hg2+ solutions. In Hg2+ detection experiments, an aliquot of dilute Hg2+ solution was taken and added to a vial containing Au-PNIPAM NCs to obtain a final volume of 1 mL. The same procedure was used for Au-PAAM NCs. The samples were incubated for 30 min at room temperature. The fluorescence spectra of the nanomaterials were recorded before and after the addition of the heavy metals.Results and discussion
Polymer matrix characterization
Fig. 1A shows the absorption spectra of Au nanomaterials supported on PNIPAM (black line) and PAAM (red line) hydrogel, while the corresponding spectra of PNIPAM (black line) and PAAM (red line) pure hydrogels are shown in Fig. 1B. In Fig. 1A a strong absorption band can be observed between 500 and 600 nm. Similarities in both sets of spectra are observed in these figures. This band is associated with the surface plasmon resonance of Au nanoparticles (Au-NPs). The maximum absorption wavelengths of the SPR bands (λmax) are located at 540 nm and 544 nm for Au nanomaterials supported on PNIPAM and PAAM polymer matrices, respectively. Chen et al.9 demonstrate that the bands located at 540–544 nm correspond to Au-NPs, and they are originate from Au nanomaterial complexes by charge transfer from the ligand to the metal. In addition, hydrogels without incorporated metals do not present an absorption band in this region of the spectrum (Fig. 1B). Furthermore, it is noted that for Au-NPs supported in PNIPAM, the bandwidth is large and the λmax is shifted to the blue compared to the Au-NPs supported in PAAM. The SPR hypsochromic shift provides information about the size and stabilization of nanomaterials. According to Mie's theory,39 there is a relationship between SPR maximum and size, the Au-NPs are smaller when there is a hypsochromic shift in the SPR maximum.40 The different λmax obtained could be suggesting that the size, growth, and, collective dipole oscillations of Au-free electrons depend on the stabilizing matrix chemical nature used in the synthesis.41 The hydrogel's different chemical properties depend on the monomer's chemical structure, which affects the nanomaterial optical properties incorporated into the hydrogel. In addition, the absence of an important shift of the maximum absorbance peak suggests a good Au-NPs dispersion within the hydrogels.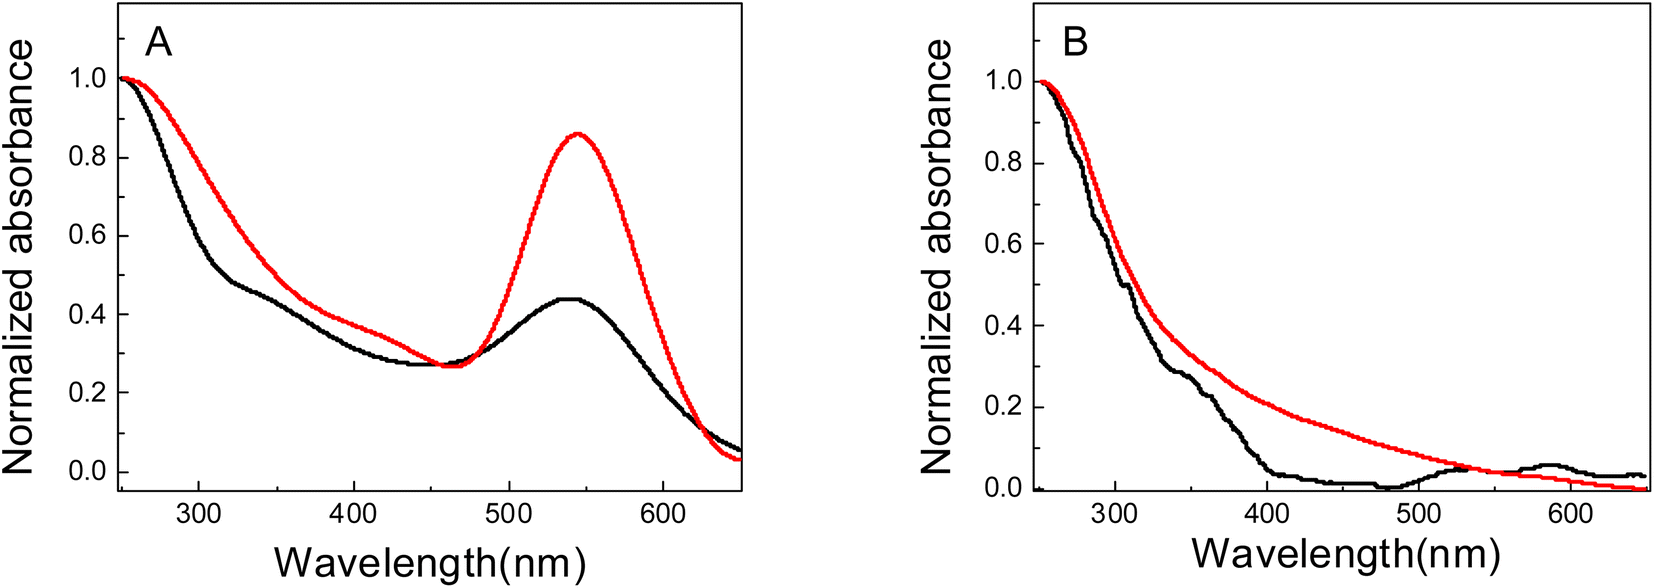 | ||
| Fig. 1 UV-vis spectra of: (A) Au nanomaterials obtained in PNIPAM (Au-PNIPAM NCs, black line) and PAAM (Au-PAAM NCs, red line) hydrogels. (B) NIPAM (black line) and PAAM (red line) hydrogels. | ||
The hydrogels microstructure was investigated by SEM, examining the samples cross-sections. In Fig. 2, micrographs of the pristine hydrogels and gold-based nanomaterials are presented. The pure hydrogel and the metal-embedded material are compared before and after irradiation with UV light.
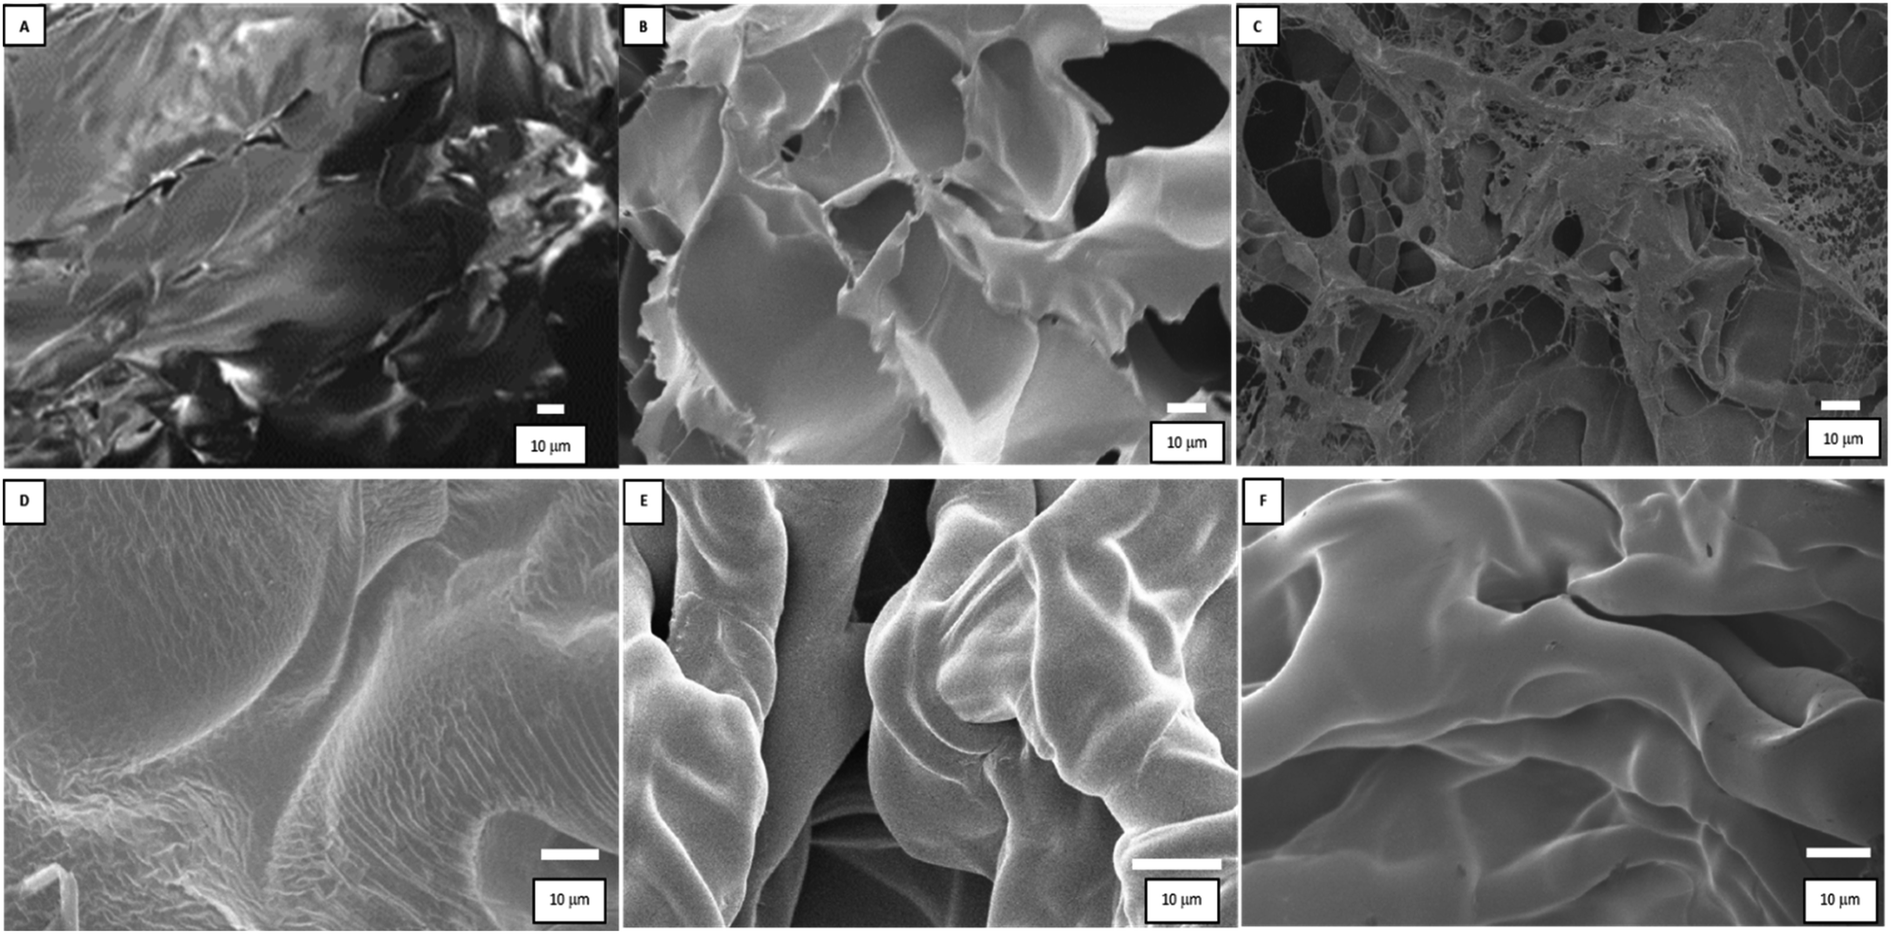 | ||
| Fig. 2 SEM images of the materials: (A) PNIPAM, (B) Au3+-PNIPAM, (C) Au-PNIPAM NCs, (D) PAAM, (E) Au3+-PAAM, and (F) Au-PAAM NCs. | ||
The SEM images (B, C, E, and F) correspond to the materials synthesized by impregnating the hydrogels with 0.5 mM metal precursor.
In the case of PNIPAM (Fig. 2A), the surface presents a regular and compact structure, while the Au3+-PNIPAM and Au-PNIPAM NCs (Fig. 2B and C) show additional layered structures probably due to the presence of Au nanostructures. However, the Au nanostructures, due to their small size, cannot be seen. Comparing the PNIPAM-based nanomaterials (B and C), it can be noted that UV light irradiation modifies their structure. In this way, UV light not only contributes to the formation of metallic nanostructures but also causes the polymeric matrix framework to break. The irradiated Au3+-PNIPAM hydrogel (Au-PNIPAM NCs) presents “holes” in the order of microns and is more porous and less compact as compared to pure PNIPAM and Au3+-PNIPAM.
On the other hand, it can be observed that the PAAM hydrogel has a smooth surface (Fig. 2D). In contrast, PAAM-based materials containing gold exhibit a rough surface (Fig. 2E and F). It should be noted that no differences were observed between the materials with gold (Fig. 2E and F) before and after irradiation. The SEM images of the two hydrogels show a homogeneous polymer surface with similar surface properties The SEM images of both hydrogels show a homogeneous polymer surface of similar surface characteristics. In this case, irradiation would not alter the microstructure of the hydrogel.
Also the chemical structure of the polymers was characterized by infrared spectroscopy. FT-IR measurements were performed for the pure hydrogels and their respective gold-based nanomaterials. The most relevant stretch mode bands for polymeric hydrogels were identified by FT-IR. The analysis was focused on the stretching bands of the CH2 and CH3 and the isopropyl groups because important information about the Au-polymer matrix interaction strength can be obtained in this spectral region. Fig. 3 shows the spectra of pure PNIPAM and PMAA hydrogel and the gold-modified nanomaterials. Well, resolved bands are observed in the 2900 cm−1 region for the polymeric materials based on PNIPAM, Fig. 3A. The 2980–2870 cm−1 region is assigned to CH2 and CH3 stretches. In addition, the bands observed at 1540 and 1457 cm−1 correspond to isopropyl groups, which confirms the presence of these groups in the materials. These bands are present not only in the pristine polymer but also remain in the Au-PNIPAM NCs indicating that the hydrogel backbone is not altered during the nanomaterials formation.
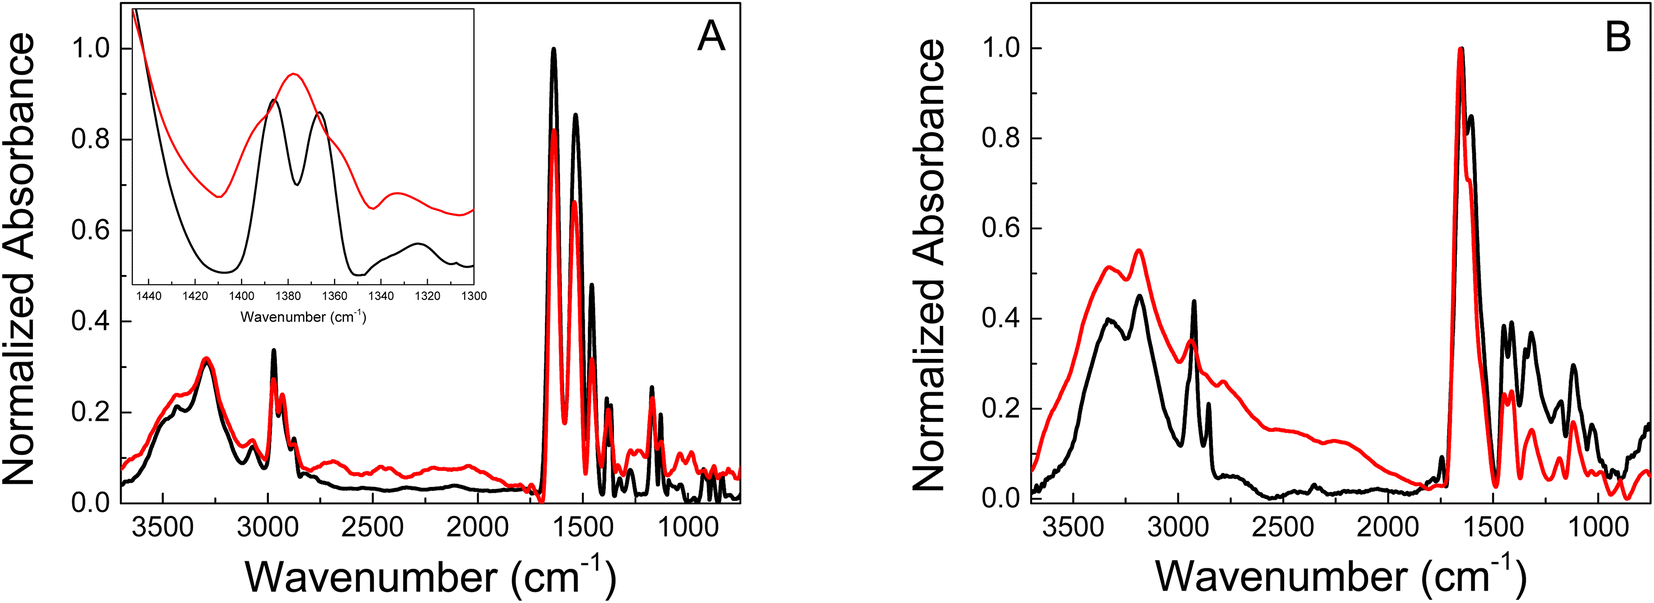 | ||
| Fig. 3 FT-IR spectra of (A) pure PNIPAM (black) and Au-PNIPAM NCs (red) lyophilizated materials. (B) Pure PAAM (black) and Au-PAAM NCs (red) lyophilizated materials. | ||
Pure PNIPAM (Fig. 3A, black line) shows two bands (doublet) at 1385 and 1365 cm−1 corresponding to the umbrella mode of isopropyl groups.42 The appearance of this doublet is due to the presence of two independent CH3 groups in different environments. The interaction between hydrogen atoms in two different methyl groups depends on whether these groups are moving closer to or further from each other.43 In contrast the spectrum of Au-PNIPAM NCs (Fig. 3A, red line) shows a single band at 1377 cm−1, suggesting that the umbrella mode of the isopropyl group is perturbed when the material is modified with Au. Thus, this indicates the success of PNIPAM coating on the surface of Au nanostructures.44 Furthermore, the results suggest that the freedom of movement of the isopropyl groups is restricted in Au-PNIPAM NCs. This interaction could be responsible for the stability of the nanostructures, avoiding the collapse of the system.
On the other hand, the PAAM-based materials only show changes in the 2900 cm−1 region corresponding to the CH2 and CH3 stretching modes (Fig. 3B). The pure PAAM hydrogel presents a narrow band at 2920 cm−1 and a less intense one at 2855 cm−1 (Fig. 3B, black line). In contrast, the Au-PAAM NCs (Fig. 3B, red line) shows a single band located at 2926 cm−1 that is less defined and with lower relative intensity as compared to the pure PAAM matrix. Likewise, the band at 2855 cm−1 disappears when the material contains gold nanostructures. The observed behavior suggests that the Au nanostructures interact with the alkyl groups of the polymeric matrix. Due to the magnitude of the observed changes, the interaction of the Au nanostructures with PAAM hydrogel would be stronger than with PNIPAM hydrogel.
Swelling is one of the most important parameters in hydrogel technology. The hydrogel swelling capacity was studied in two different media: (i) distilled water, (ii) gold precursor solution HAuCl4 (Au3+ 0.5 mM). The swelling capacity (swelling%) was determined as a function of time according to eqn (1). Fig. 4 shows the PNIPAM (A) and PAAM (B) hydrogels swelling kinetic in the distilled water and metallic precursor solutions (Au3+ 0.5 mM). Also, a swelling percentage in the equilibrium state (%Sweq) is shown in Table 1.
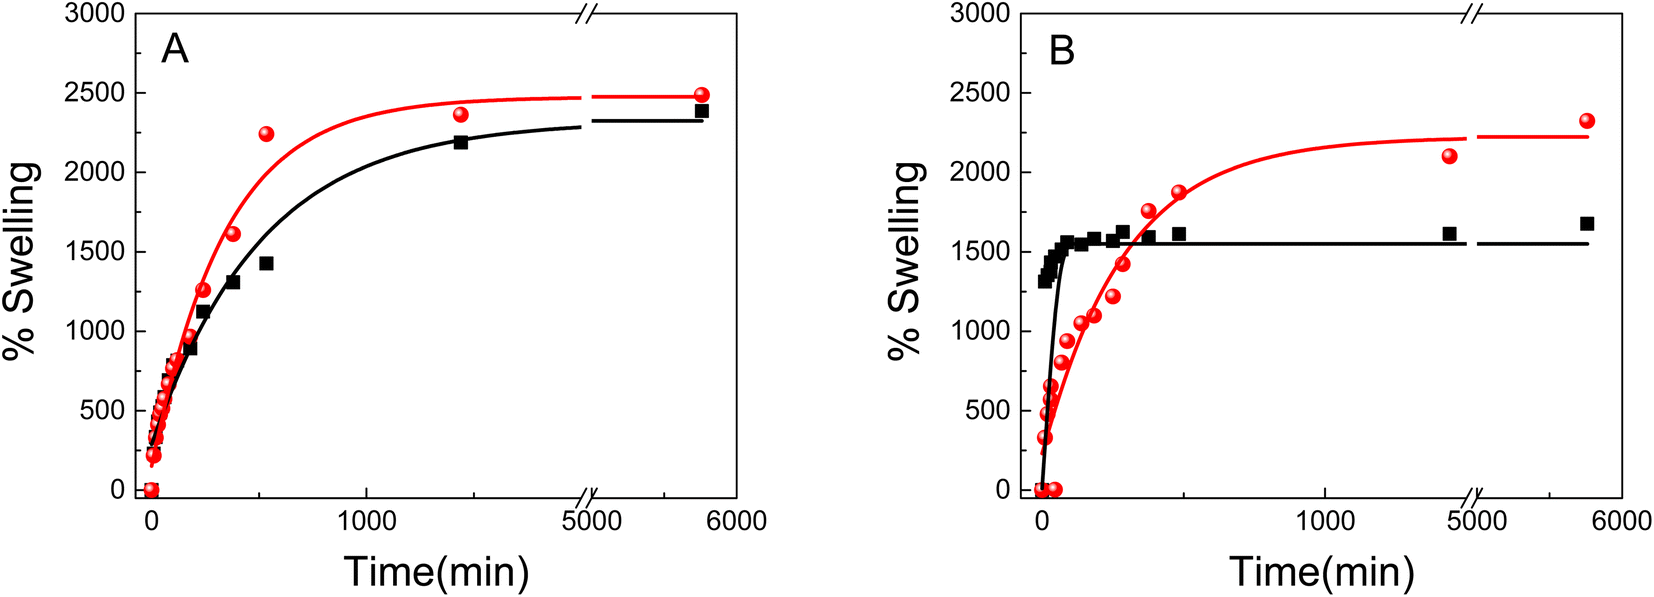 | ||
| Fig. 4 Swelling kinetics of materials based on (A) PNIPAM and (B) PAAM. The profiles correspond to the materials immersed in metal precursors solutions 0.5 mM (red line) and in bidistilled water (black line). | ||
| Sample | Metal concentration Au (mM) | Initial weight W0 (mg) | Final weight Wd (mg) | Swelling (%) |
|---|---|---|---|---|
| PNIPAM | 0 | 13.1 | 299.5 | 2386 |
| PAAM | 0 | 6.3 | 99.4 | 1677 |
| Au3+-PNIPAM | 0.5 | 2487 | ||
| Au3+-PAAM | 0.5 | 4.5 | 117 | 2323 |
| Au3+-PAAM | 1 | 9.6 | 267.1 | 2682.29 |
| Au3+-PAAM | 5 | 7.3 | 271.1 | 3613.69 |
As shown in Fig. 4 and Table 1, the swelling capacity for the different polymeric matrices increase gradually with the time at room temperature. All samples exhibited exponential growth curves, characteristic of hydrophilic hydrogels. No significant differences are observed for the PNIPAM-based hydrogels in the equilibrium swelling value (%Sweq) in both mediums, which is approximately 2500% (Fig. 4A). On the other hand, it can be noted that the initial swelling velocity is different for each material.
The initial swelling rate for pure PNIPAM in water is lower than for the same hydrogel in the metal solution. The hydrogels swelling process is known to be controlled by three consecutive steps: the diffusion of the solvent molecule in the polymer system, the relaxation of the polymer chains, and the expansion of the polymer network in the solution.45 Strong inter/intra-molecular interactions would greatly restrict the polymer chain relaxation, resulting in a slower swelling rate. The results suggest that the gold solution uptake diminish the inter/intra-molecular interactions in the PNIPAM, resulting in a high swelling rate in comparison with pure water.
In addition, the materials behavior is different for the PAAM hydrogels (Fig. 4B). The PAAM hydrogel swelling in Au3+ solutions has the higher equilibrium swelling value (2323% Sweq), which could be due to the three-dimensional network having the lowest degree of cross-linking and/or the highest hydrophilic character, than pure PAAM (1677% Sweq). Furthermore, it is observed that the metal incorporation decreases the initial swelling rate, indicating a strong interaction between the gold nanostructures and the polymer matrix. Also, the results also suggest that pure PAAM is less hydrophilic than Au3+-PAAM.
The hydrogels swelling with different concentrations of metal precursor solutions was evaluated (Table 1).
It was found that the swelling capacity of PAAM-increases with the concentration of the metal solution. The presence of Au3+ in the materials enhance the %SWeq because it weakens the inter/intra-molecular interactions of the polymer chains, opens channels and pores, and thus allows an easy diffusion into the material. This behavior could be due to that the gold 3+ charge of the metal cation makes the material more hydrophilic. Moreover, the same behavior was observed in the materials based on PNIPAM.
Metal incorporation in polymeric matrices
A UV-vis spectroscopy study was carried out to determine the incorporation profiles of the metals in the different polymer matrices. Fig. 5 shows the UV-vis absorption spectra over time of the 0.5 mM solutions (initial concentration) of metal precursor where the PNIPAM and PAAM hydrogels were immersed.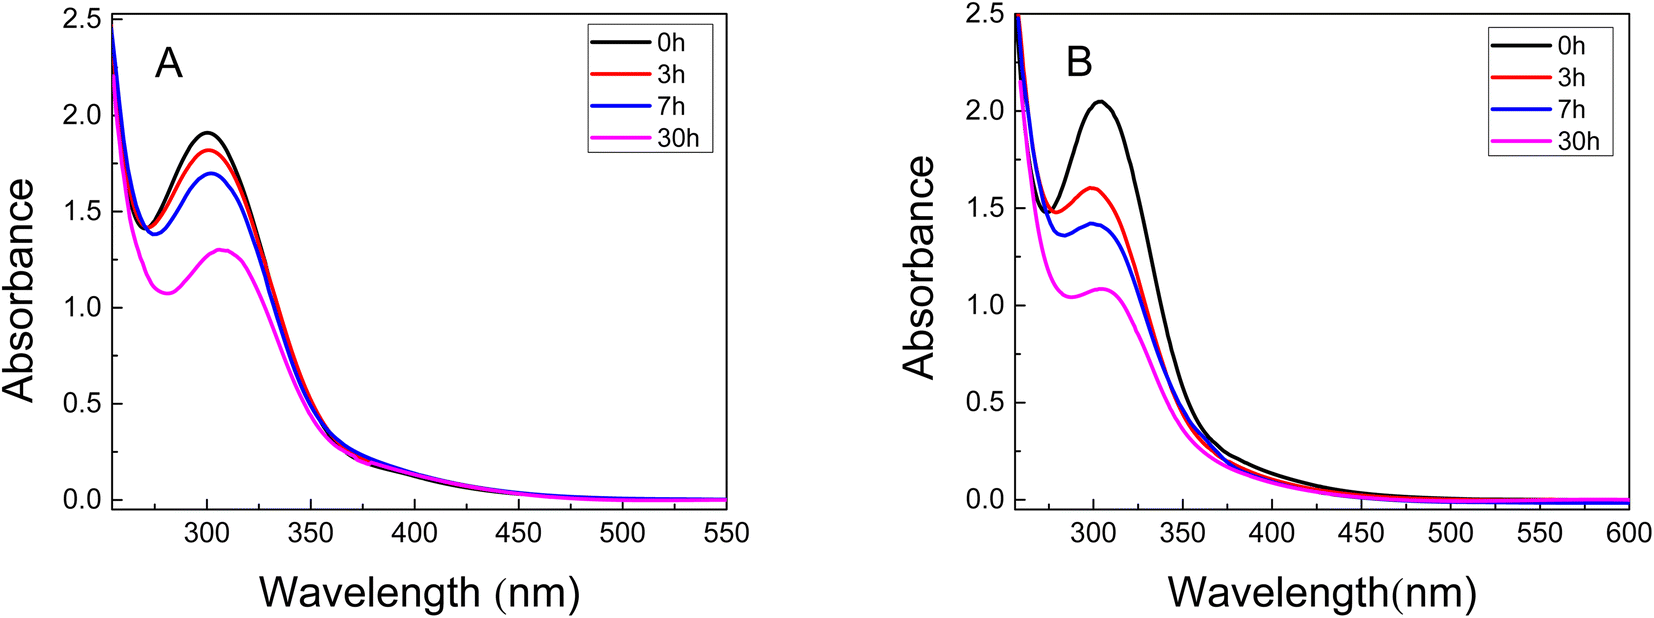 | ||
| Fig. 5 UV-vis spectra of Au3+ solution at different time during the swelling of (A) PNIPAM (B) PAAM. 0 h (black line), 3 h (red line), 5 h (blue line), and 30 h (pink line). | ||
In the UV-vis spectra of the gold solution show a band located between 230-300 nm corresponding to the absorption of Au3+. It can be observed that the absorbance decreases with the time (Fig. 5A and B) indicating less quantity of Au3+ ions in the solution. This result confirms that the precursor metal concentration decreases in the solution in which the material is immersed due to the incorporation of Au3+ in both hydrogels. The data of %Sweq and incorporation kinetics can also be used to calculate the Au3+ moles and the amount of water incorporated into the hydrogels. These calculated values can then be used to estimate the molality of Au3+ in each hydrogel. The amount of Au3+ incorporated in the hydrogels was 0.30 mol and 0.38 mol for Au3+-PNIPAM and Au3+-PAAM, respectively. According to the results, the PAAM hydrogel contains approximately 20% more metal precursor compared to PNIPAM.
In addition, the UV-vis spectra of the Au3+-hydrogels show no SPR band (not shown), suggesting that Au NPs do not form in the PNIPAM and PAAM hydrogels without UV light irradiation. This conclusion is consistent with the UV-vis spectra showed in Fig. 5, which shows that the materials does not release nanomaterials to the external solution for at least 30 hours.
The thermal properties of the pristine hydrogel PNIPAM and Au-PNIPAM NCs were evaluated by differential scanning calorimetry (DSC). The DSC thermogram of pure PNIPAM (Fig. 6A) shows an endothermic peak at 33.6 °C. PNIPAM is known to be a thermosensitive material with a lower critical solution temperature (LCST) of around 32 °C.22 This peak is attributed to the endothermic process, which corresponds to the energy required to break the hydrogen bonds between the polymer and the water molecules. The thermogram of Au-PNIPAM NCs also shows an LCTS proving that this new material is also thermosensitive (Fig. 6B). In the latter case, the peak presented at about 36.7–40.6 °C in the DSC thermogram (Fig. 6B) is similar to the LCST of pure PNIPAM (Fig. 6A). The differences in the LCTS value is attributed to the fact that one material is a pristine NIPAM and the other, Au-PNIPAM NC is a nanocomposite of PNIPAM and gold nanostructures inside of the 3D matrix. The effects of gold nanostructures on the network were not enough to destroy the balance of hydrophilic/hydrophobic interactions allowing the nanocomposite experiment the phase transition. Also, the endothermic peaks have a similar enthalpy, which is typical of hydrogen bonding interactions. However, it should be noted that Au-PNIPAM NCs has a higher phase transition temperature than pure hydrogel. This phenomenon could be attributed to the stronger electrostatic and steric interactions between gold nanomaterial and PNIPAM in the modified polymer network structures.46 In addition, Schild and Tirrell found that phase transition temperatures are sensitive to the presence of different substances in the PNIPAM structure, such as comonomers, solutes, surfactants, etc.47 Therefore, this could indicate a strong hydrogen bond interaction between water and gold nanostructures. The interaction would be stronger compared to the interaction between the water molecules and the polymeric matrix. Furthermore, the results show that the gold nanostructures remain incorporated into the polymer matrix after heating. It is important to mention that PAAM-based materials are not sensitive to temperature changes.
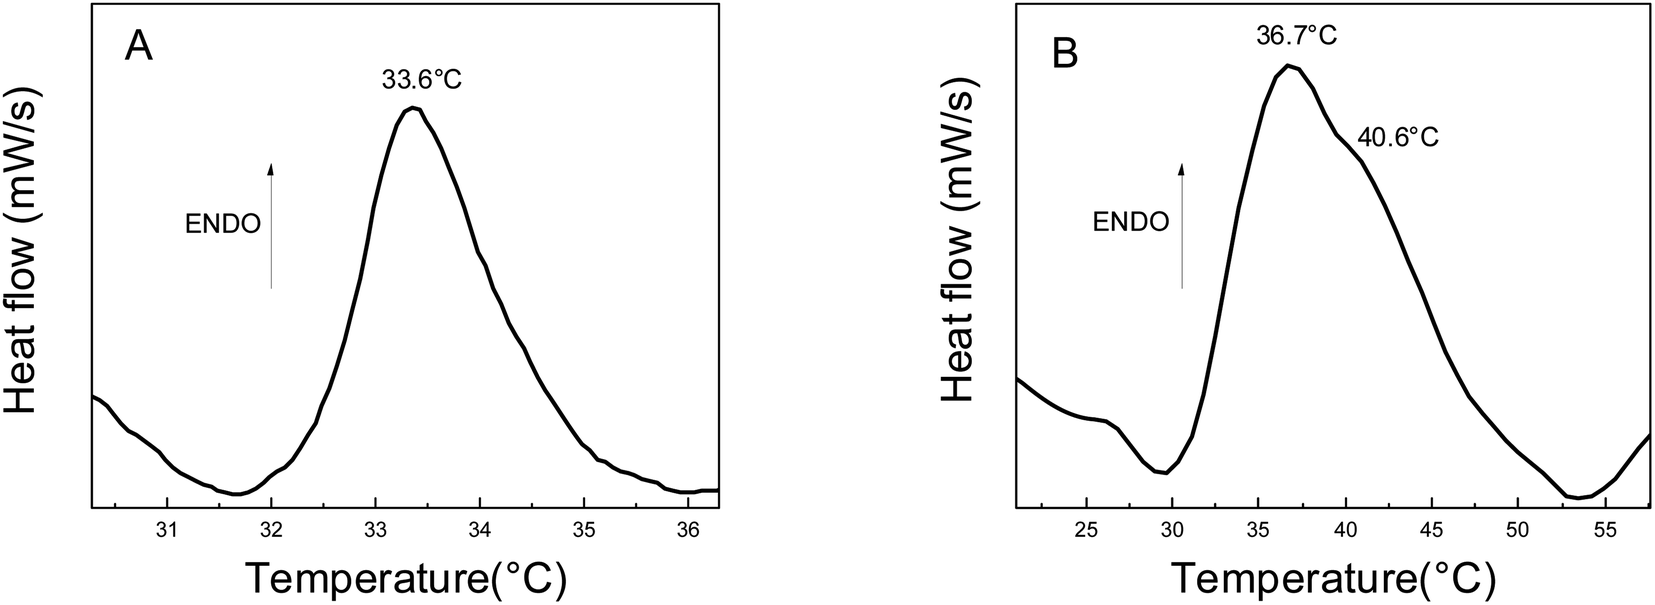 | ||
| Fig. 6 DSC thermograms of (A) pure PNIPAM (B) Au-PNIPAM NCs. | ||
AuNCs incorporated in matrices
TEM images of the nanomaterials synthesized inside of the PMIPAM and PAAM are shown in Fig. 7. When PNIPAM hydrogels is employed as support Au-NPs are produced with a bimodal composed a main population with particles size distribution peaking at 6.5 nm and a less populated distribution peaking at 10.5 nm as shown in Fig. S1A.† In addition, numerous smaller AuNCs are observed in Fig. 7A. In the case of the material produced in PAAM hydrogels (Fig. 7B) a monodisperse and homogeneous Au-NP with an average diameter of approximately 7.5 nm is observed (Fig. S1B†). The AuNCs are too small to be observed by TEM and they are probably absorbed on the Au-NPs. However, their presence is confirmed by fluorescence spectroscopy since it is well known that Au-NPs do not fluoresce.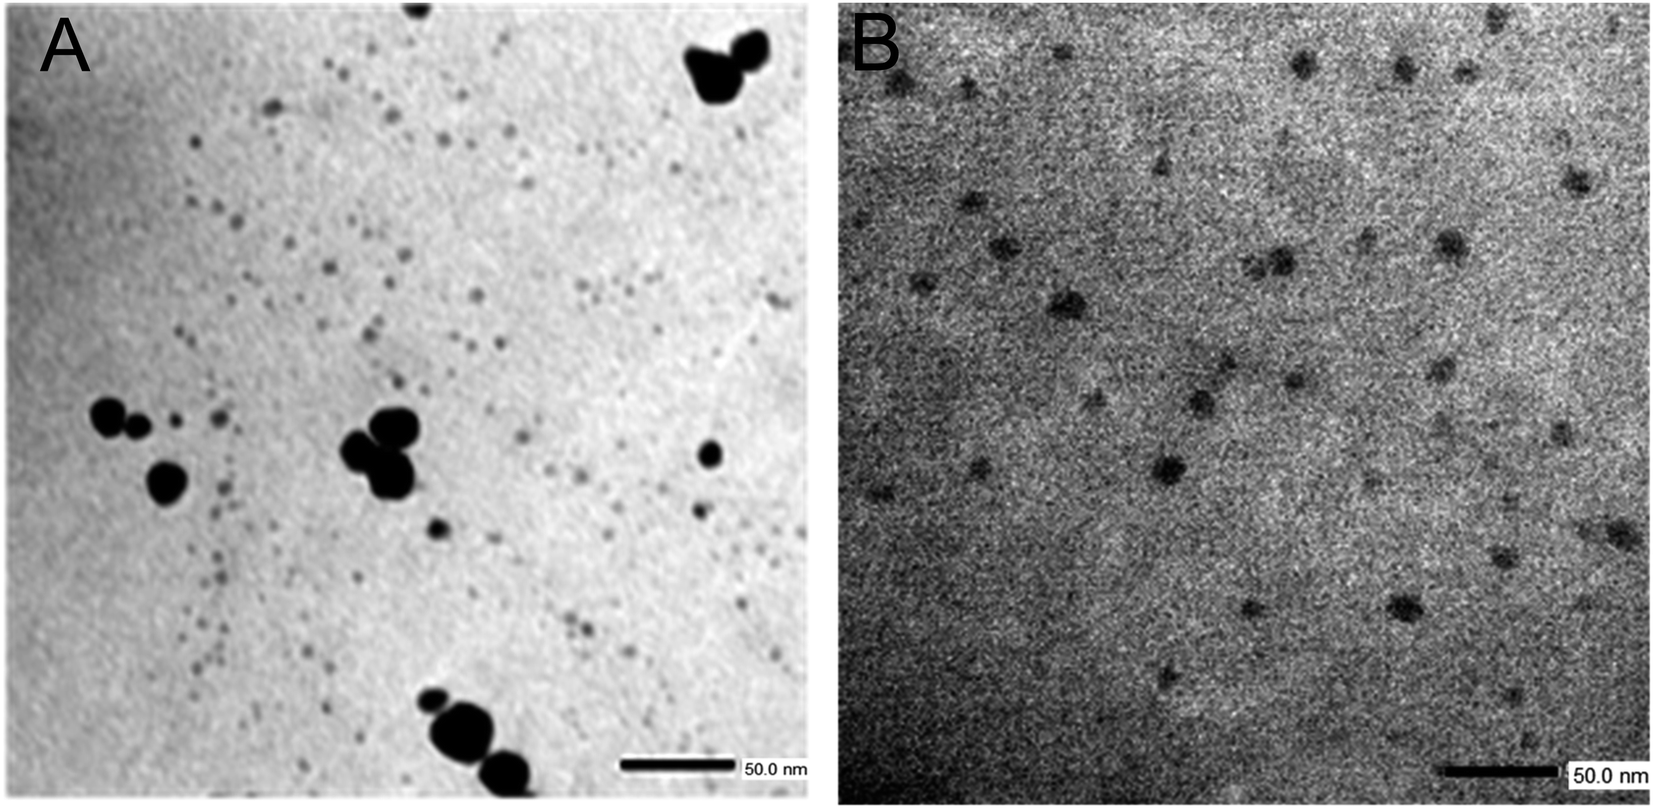 | ||
| Fig. 7 TEM images of nanomaterials. (A) Au-PNIPAM NCs and (B) Au-PAAM NCs. | ||
The fluorescent properties of the synthesized nanomaterials were also evaluated. Fluorescence was determined using a special holder and hydrated samples, recording the emission at a 45° angle. Excitation was performed at 535 nm, as the formed nanomaterials and all samples showed absorption between 500–550 nm. The fluorescence spectra of pure PNIPAM and PAAM hydrogels and Au-based nanomaterials are shown in Fig. 8. While the UV-irradiated Au-PNIPAM and Au-PAAM NCs (Fig. 8A and B, blue line) show strong fluorescence emission around 620 nm, the fluorescence of pristine hydrogels (Fig. 8A and B, black line) and non-irradiated Au3+-PNIPAN and Au3+-PAAM hydrogels (Fig. 8A and B, red line) is insignificant under the same conditions. Likewise, it can be noted that the emission intensity of Au-PAAM NCs is higher compared to Au-PNIPAM NCs. On the other hand, we found that the fluorescence of these nanomaterials depends on the pH of the solution in which the hydrogels are immersed (Fig. S2†). As shown in Fig. S2,† the Au-PNIPAM NCs show a maximum emission at pH 7, while the maximum emission of Au-PAAM takes place at pH 4. However, the fluorescence of the synthesized NCs in both matrices is detectable in the whole range of studied pH (pH = 4.0–10.0).
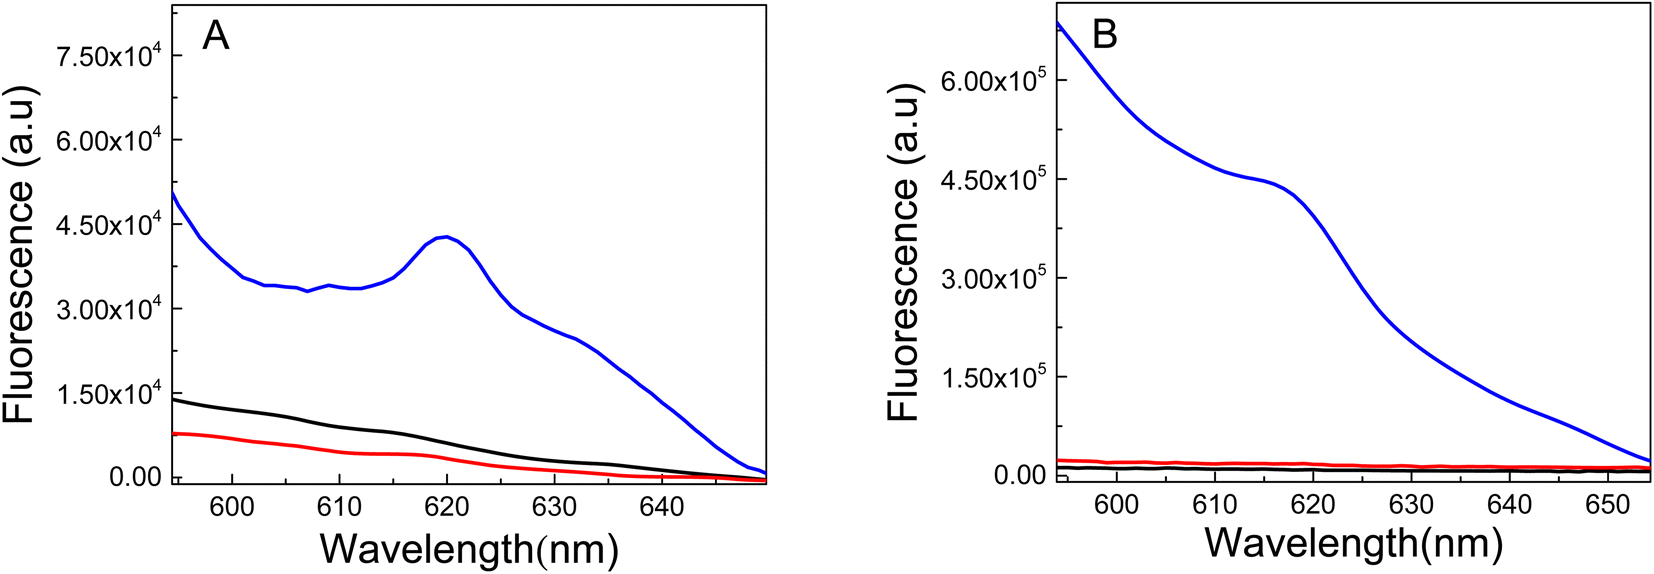 | ||
| Fig. 8 Fluorescence spectra of (A) pure PNIPAM (black line), non-irradiated Au3+-PNIPAM (red line), irradiated Au-PNIPAM NCs (blue line). (B) Pure PAAM (black line), non-irradiated Au3+-PAAM (red line), and irradiated Au-PAAM NCs (blue line). Excitation wavelength: 535 nm. | ||
Several research studies had demonstrated that the AuNCs fluorescence depends on the pH.48–50 In that sense Csapó et al.48 shows that the nicotinamide-stabilized AuNCs present detectable fluorescence in the pH range 1–12, showing a fluorescence decrease at pH < 3.0 and pH > 10.0. Moreover, the decreasing of the fluorescence a low pH is attributed to the formation of aggregates of NAM-Au NCs and at high pH the clusters lose their stability again thanks to the high electrostatic shielding. Evidently the chemical structure and swelling degree of the hydrogel changes with pH, which affects the emission of AuNC. However, since the goal of this work is to develop a new fluorescent material to detect Hg2+ in water as obtained from the tap or any natural water course, without further treatment, the sensitivity and selectivity experiments were all performed at pH 7.
As it is known Au-NPs do not exhibit fluoresces because the optical properties of Au-NPs are defined as collective electrons oscillations of hundreds of atoms supporting a surface plasmon (Fig. 1A), thus it is expected that hydrogels impregnated with Au-NPs will not fluoresce either. Therefore, the fluorescence of the materials is due to the formation of AuNCs in the UV-irradiated hydrogels. AuNCs consist of several to a few tens of Au atoms with a small size. Hence, cannot be observed in TEM and SEM images. It is well known that, when the size of the metal system is sufficiently reduced, quantum confinement effects appear in the material and make new optical and chemical properties arise.31,51 The main effect of quantum confinement in metal nanoclusters is the appearance of HOMO–LUMO energy gaps due to a discretization of the energy levels within the nanocluster that behaves as a molecule-like system.52 This energy discretization is responsible for molecular properties such as fluorescence. The origin of metal nanoclusters fluorescence has been attributed to the ligand-to-metal charge transfer or ligand-to-metal–metal charge transfer.53 Therefore, the obtained results prove that the observed fluorescence originates from the gold core of the AuNCs supported on the PNIPAM and PAAM hydrogel. Also, the results demonstrate that the AuNCs are formed by photoreduction of the Au3+ cations loaded inside of the hydrogel upon UV light irradiation, as it has been previously shown for similar systems.54,55
In order to study deeply the spectroscopic properties of the new materials, the excitation–emission matrix (EEM) of both, Au-PNIPAM NCs and Au-PAAM NCs, were determined and are shown in Fig. 9. The EEM fluorescence spectroscopy enables the identification and characterization of complex mixtures of nanoclusters.51,56 Using EEM spectroscopy, it is possible to visualize the complete fluorescence profile of each of the obtained cluster species. The EEMs recorded for both materials, Au-PNIPAM NCs and Au-PAAM NCs, show an island peaking at λexc = 520 nm and λem = 612 nm superimposed on a continuous background observed over a wide range of excitation–emission wavelengths. The continuous background is most likely due to the light scattering produced by the Au-NPs, while the islands at λexc/λem = 520/612 nm are due to the actual fluorescence of the AuNCs incorporated into the materials. The Au-NPs supported on PNIPAM and PAAM polymer matrices show a SPR at 540 nm and 544 nm, respectively, as observed in the UV absorption spectra (Fig. 1A). However, the excitation wavelength at the maximum fluorescence of the AuNCs is blue shifted at λexc = 520 nm (Fig. 9) and is not observed in the corresponding UV spectra. These results indicate that both, Au-NPs and AuNCs are produced upon UV irradiation of the Au3+-PNIPAM and Au3+-PAAM polymer matrices. In addition, the fact that only the SPR of the Au-NPs is seen in the UV spectra (Fig. 1A) strongly suggests that AuNCs are a minor product of the synthesis compared to Au-NPs. Furthermore, the fluorescence quantum yield of the AuNCs is high enough to allow the detection of these minority species by fluorescence spectroscopy.
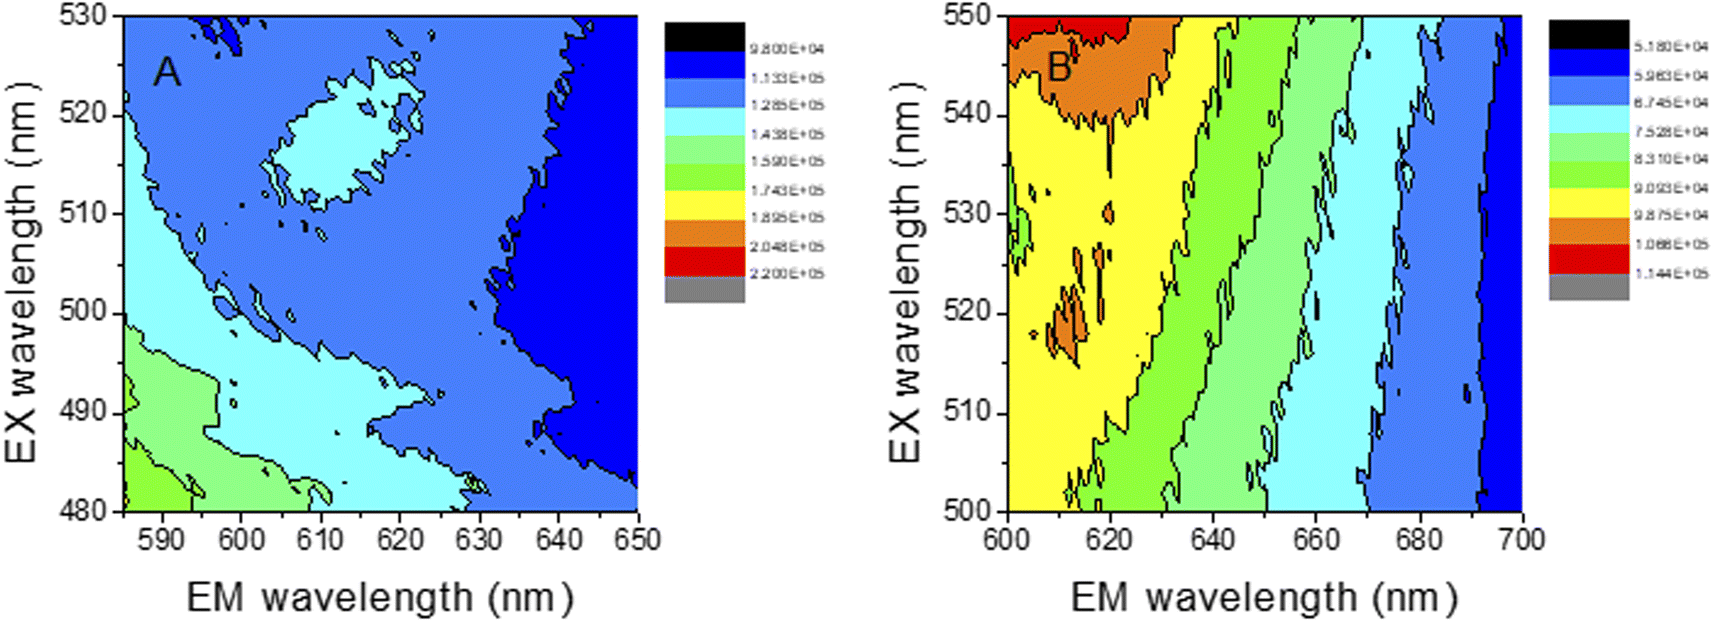 | ||
| Fig. 9 AuNCs emission–excitation matrices, recorded at different emission and excitation wavelengths. (A) Au-PNIPAM NCs (B) Au-PAAM NCs. | ||
Heavy metals detection
Liu et al. have shown that the fluorescent material (Ag-PMAA) based on silver NCs and poly(methacrylic acid) can be used to sense Cr3+ since this cation selectively quenches the clusters fluorescence in solution.57 The materials reported in these work contain Au instead of Ag and different polymers that allow studying the quenching of the fluorescence by different heavy metal cations in the hydrogel. Also, the present work the AuNC are incorporated inside of the matrix polymer allowing to build a portable device to detect the contaminant. The performance of these materials as heavy metal sensors is estimated by the fluorescence quenching measurement.As a probe of concept to test the performance of the new materials, heavy metal ions (Hg2+) were added to each Au-matrix NCs to test the AuNCs response. The irradiated samples were incubated for 30 min with Hg2+ solutions of different concentrations and the excitation was performed at 535 nm. The quenching of the fluorescence by Hg2+ was evaluated as the fluorescence intensity decay (I0/I) of AuNCs after (I) and before (I0) adding metal ions at λem = 618 nm. Fig. 10 shows the Au-PNIPAM NCs and Au-PAAM NCs fluorescence spectra in the presence of different concentrations of Hg2+ ions. As shown in Fig. 10A and B, the emission intensity of AuNCs is gradually reduced with increasing the Hg2+ concentration in the solution (pH: 7). A good linear Stern–Volmer correlation can be obtained (R = 0.999 and R = 0.954 for Au-PNIPAM and Au-PAAM NCs, respectively) based on the Hg2+ ions quenching effects over the range 10–100 nM, as indicated in the inset in Fig. 10. The limits of detection (LD) were calculated as LD = 3σb/m, where σb and m are the standard deviation of the blank and the slope of the Stern–Vomer graph, respectively. The LDs were determined to be 4.1 nM and 1.3 nM for Au-PNIPAM and Au-PAAM NCs, respectively.
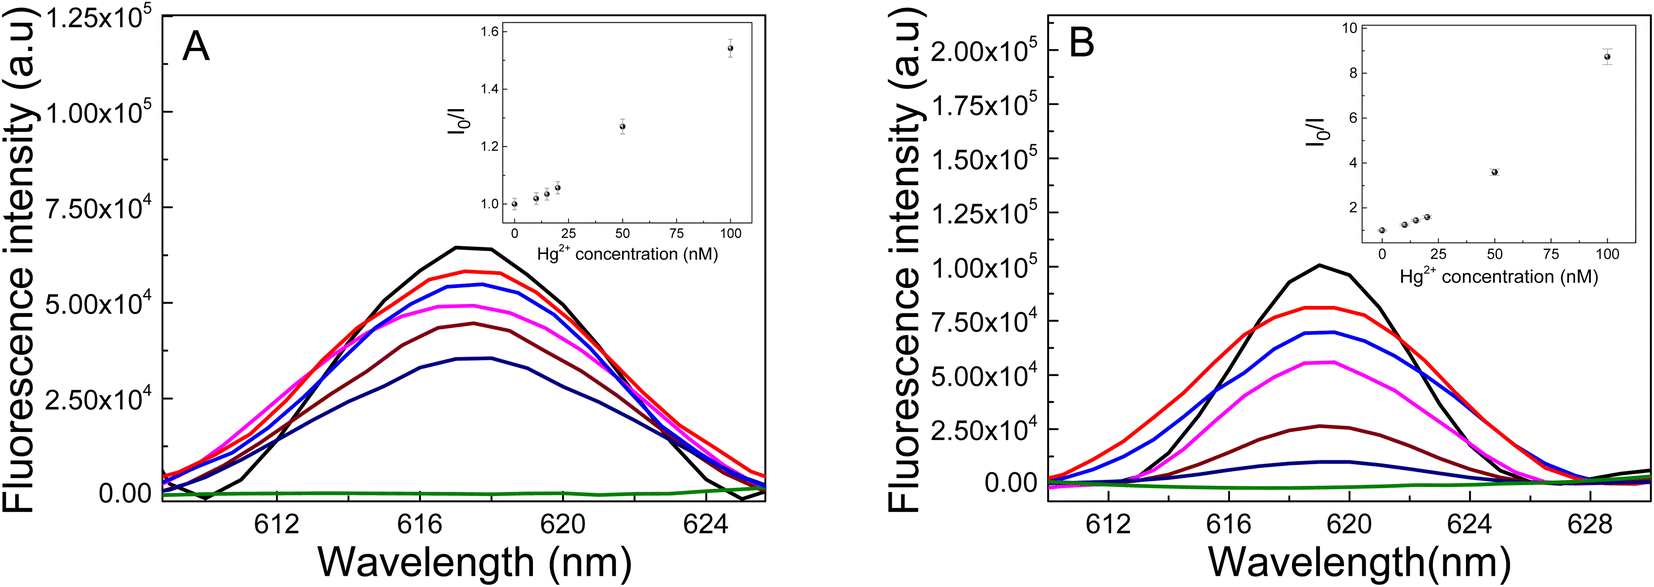 | ||
| Fig. 10 Sensitivity of the (A) Au-PNIPAM NCs and (B) Au-PAAM NCs for Hg2+ at pH: 7 (λexc = 535 nm). Initial fluorescence of the AuNCs (black line). Hg2+ concentrations: 10 nM (red line), 15 nM (blue line), 20 nM (pink line), 50 nM (board line), 100 nM (dark blue line) and 200 nM (green line) inset: Stern–Volmer plot (I0/I vs. [Hg2+]) over the concentration range 10–100 nM. For the Stern–Volmer plot, the fluorescence intensity was determined at λem = 618 nm and the reported values correspond to the average of three replicated measurements (RSD ≤ 4%). | ||
We notice that the presence of Hg2+ changes the absorbance of nanomaterials at 540 nm (Fig. S3†). This result would indicate that the fluorescence quenching is associated with an static quenching mechanism due to the formation of a complex between Hg2+ and the AuNCs. It is important to note that our results are in agreement with previous results by Chen et al.9 These authors reported that the quenching of the AuNCs synthesized on PNIPAM microgels is produced by the deposition of Hg2+ ions on the surfaces of the AuNCs supported on the matrix. The possible formation of an Hg–Au amalgam would lead to an aggregation of the AuNCs and, consequently, to a progressive extinction of the fluorescent species with increasing Hg2+ concentration.
The selectivity of the assay was evaluated by challenging it with other environmentally relevant metal cations (Na+, K+, Ca2+, Zn2+, Al3+ and Fe3+). In this sense, the effect of each of these metal cations on the fluorescence quenching was evaluated by adding of 20 nM of the metal cations to samples containing AuNCs and 20 nM of Hg2+ ions. The corresponding fluorescence spectra are shown in Fig. S4 and S5† and the plot of [I0 − I]/I0 for each metal cation is shown in Fig. 11.
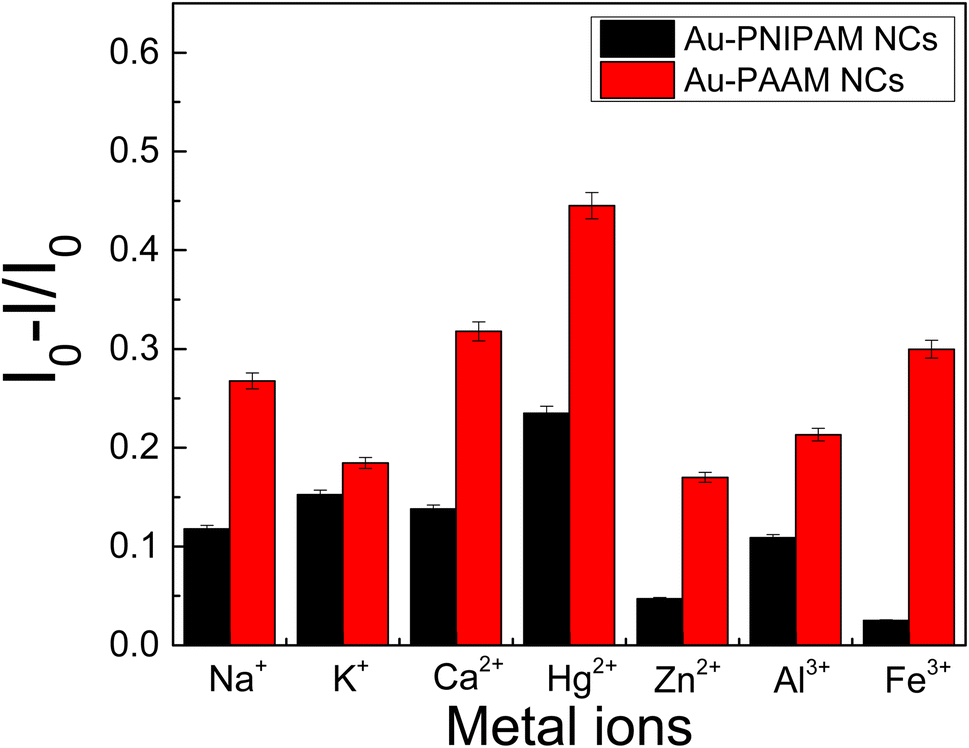 | ||
| Fig. 11 Selectivity of Au-PNIPAM NCs (black bar) and Au-PAAM NCs (red bar) to Hg2+. Plots of relative fluorescence intensity spectra [(I0 − I)/I0] of the Au-NIPAM NCs and Au-PAAM NCs in the presence of Hg2+ (20 nM) and various metal ions (20 nM) in water at pH: 7, incubation time 30 min. | ||
For both nanomaterials (Au-PNIPAM NC and Au-PAAM NC), the larger quenching effect is observed for Hg2+ ions, although the selectivity is not as good as in other materials previously reported.9 However, it must be noticed that the goal of this work was to develop a new platform to detect Hg2+ directly from the tap or any course of natural water without any previous treatment and is the simplest way to be used as a first probe for drinkable water conditions in remote regions. In this sense, none buffer is used to adjust the pH to the optimum quenching fluorescence response and this fact could lead to the precipitation of the hydroxides of some of the metal cations probed which could mask the selectivity of the system.
Nevertheless, the detection limit of Hg2+ by Au-PNIPAM NC and Au-PAAM NC are comparable and even lower than for other AuNCs, especially those using biomolecules for the synthesis of AuNC (see Table 2). In addition, the detection limits of the materials presented in this work are below the value recommended by the WHO for drinkable water.3 Consequently, the AuNCs synthesized in this work reached acceptable validation parameters, exhibiting a good linear range and detection limit for been used as a first probe to ensure Hg2+ free water, even though the selectivity of the method is not as good.
| Technique | Nanomaterial | Stabilizer/support | Linear range | Detection limit (nM) | Ref. |
|---|---|---|---|---|---|
| a NCQDs: nitrogen-doped carbon quantum dots. MGDA: methyl glycine diacetic acid trisodium salt, MPD: m-phenylenediamine. | |||||
| Fluorescence | AuNCs | PNIPAM | 10–100 nM | 4.1 nM | This work |
| Fluorescence | AuNCs | PAAM | 10–100 nM | 1.3 nM | This work |
| Fluorescence | AuNCs | Cytidine | 0.01–6 μM | 30 nM | 58 |
| Fluorescence | AuNCs | Ovalbumin | 0–10 μM | 10 nM | 59 |
| Fluorescence | AuNCs | PNIPAM microgels | 2–20 nM | 1.7 nM | 9 |
| Fluorescence | NCQDsa | MGDA-MPDa | 0–100 μM | 0.9 μM | 60 |
| Colorimetric | AgNPs | Gelatin and Tween-20 | 0.01–0.5 mM | 2.25 μM–0.65 μM | 61 |
Finally, the results reveal that Au-PNIPAM NCs are more selective and less sensitive than Au-PAAM, while Au-PAAM are more sensitive and less selective for detecting Hg2+ ions in water at pH: 7. In this regard, we consider that Au-PNIPAM NCs at pH: 7 are more adequate to detect Hg2+ since they are more selective and the detection limit is still below the value recommended by the WHO.
Conclusion
In this work, AuNCs were successfully synthesized and supported on two different polymeric matrices PNIPAM and PAAM. The materials were characterized by UV-Vis, FT-IR, fluorescence spectroscopy, TEM and SEM. Likewise, the thermal properties and the swelling capacity of the different polymer matrices were determined. The results reveal that the incorporation of Au3+ in the PNIPAM and PAAM hydrogels modifies the structure and physicochemical properties of the material. The Au3+ presence in the hydrogels favors the water incorporation inside the polymeric network because it opens the channels and pores of the hydrogel. Moreover, the supported nanomaterial fluorescent properties (PNIPAM NCs and PAAM NCs) were determined. It is demonstrate that AuNCs are only formed when the Au3+ incorporated material is irradiated with UV light. Also, the Au-PNIPAM NCs and Au-PAAM NCs exhibit fluorescence emission at ca. 620 nm when they are excited at 535 nm. In addition, our study demonstrates that the AuNCs supported on each polymeric matrix present a unique characteristic and optical signature. Furthermore, the AuNCs supported on the polymer matrices were used for the detection of Hg2+ in water at pH: 7. The AuNCs showed a remarkably rapid response and high sensitivity for Hg2+ and a moderate but higher selectivity as compared to other metal cations. The Stern–Volmer relationship graphs were linear over the range of 10–100 nM, and the corresponding LD was 4.1 nM and 1.3 nM for Au-PNIPAM and Au-PAAM NCs, respectively.In summary, this research work shows an easy, one pot synthesis and characterization of new applied materials that are good candidates as potential material for detecting Hg2+ in water at pH: 7 and it is worth exploring the possibility to build a portable device in the future.
Conflicts of interest
There are no conflicts to declare.Acknowledgements
Financial support from CONICET, UNRC, SeCyT-UNC, ANPCyT (PICT-2018-4627, PICT-2019-0241 and PICT-2021-00099), is gratefully acknowledged. D. F. A. and G. A. P. hold research positions at CONICET. G. A. M. thanks CONICET for a research postdoctoral fellowship.References
- E. E. Mariño, G. T. Ávila, P. Bhattacharya and C. J. Schulz, J. South Am. Earth Sci., 2020, 100, 102547 CrossRef.
- C. Bilos, L. M. Tatone, C. N. Skorupka, M. J. Astoviza, C. L. Romero and J. C. Colombo, Int. J. Environ. Health, 2019, 9(3), 271–287 CrossRef.
- K. P. Lisha, A. Anshup and T. Pradeep, Gold Bull., 2009, 42(2), 144–152 CrossRef CAS.
- B. R. M. Alsehli, Egypt. J. Chem., 2021, 64(2), 869–881 Search PubMed.
- Z. Yan, Y. Cai, J. Zhang and Y. Zhao, Measurement, 2022, 187, 110355 CrossRef.
- J. P. Wilcoxon and B. L. Abrams, Chem. Soc. Rev., 2006, 35(11), 1162–1194 RSC.
- J. Qiao, X. Mu, L. Qi, J. Deng and L. Mao, Chem. Commun., 2013, 49(73), 8030–8032 RSC.
- H. Jiang, Z. Qin, Y. Zheng, L. Liu and X. Wang, Small, 2019, 15(18), 1901170 CrossRef PubMed.
- L.-Y. Chen, C.-M. Ou, W.-Y. Chen, C.-C. Huang and H.-T. Chang, ACS Appl. Mater. Interfaces, 2013, 5(10), 4383–4388 CrossRef CAS PubMed.
- X.-P. Zhang, K.-Y. Huang, S.-B. He, H.-P. Peng, X.-H. Xia, W. Chen and H.-H. Deng, J. Hazard. Mater., 2021, 405, 124259 CrossRef CAS PubMed.
- M. Cui, Y. Zhao and Q. Song, TrAC, Trends Anal. Chem., 2014, 57, 73–82 CrossRef CAS.
- E. Caló and V. V. Khutoryanskiy, Eur. Polym. J., 2015, 65, 252–267 CrossRef.
- M. V. Martinez, M. Molina and C. A. Barbero, J. Phys. Chem. B, 2018, 122(38), 9038–9048 CrossRef CAS.
- C. A. Barbero, M. V. Martínez, D. F. Acevedo, M. A. Molina and C. R. Rivarola, Macromol, 2022, 2(3), 440–475 CAS.
- M. V. Martinez, M. A. Molina, S. B. Abel and C. A. Barbero, MRS Adv., 2018, 3(63), 3735–3740 CrossRef CAS.
- V. Packirisamy and P. Pandurangan, BioTechniques, 2022, 74, 51–62 CrossRef PubMed.
- P. Thoniyot, M. J. Tan, A. A. Karim, D. J. Young and X. J. Loh, Advanced Science, 2015, 2(1–2), 1400010 CrossRef PubMed.
- T.-H. Yang, Recent Patents on Materials Science, 2008, pp. 29–40 Search PubMed.
- M. A. Molina, C. R. Rivarola, M. C. Miras, D. Lescano and C. A. Barbero, Nanotechnology, 2011, 22(24), 245504 CrossRef CAS PubMed.
- O. Okay, G. Gerlach and K.-F. Arndt, Hydrogel Sensors and Actuators, 2009, vol. 6, pp. 165–195 Search PubMed.
- K. S. Anseth, C. N. Bowman and L. Brannon-Peppas, Biomaterials, 1996, 17(17), 1647–1657 CrossRef CAS PubMed.
- H. Feng, N. Tang, M. An, R. Guo, D. Ma, X. Yu, J. Zang and N. Yang, J. Phys. Chem. C, 2019, 123(51), 31003–31010 CrossRef CAS.
- M. V. Martinez, R. C. Rodriguez, M. M. Bruno, D. F. Acevedo and C. A. Barbero, J. Electrochem. Soc., 2018, 165(16), H1021–H1027 CrossRef CAS.
- M. V. Martínez, C. R. Rivarola, M. C. Miras and C. A. Barbero, Sens. Actuators, B, 2017, 241, 19–32 CrossRef.
- J. Pereyra, M. V. Martinez, C. Barbero, M. Bruno and D. Acevedo, J. Compos. Sci., 2019, 3(1), 1–14 CAS.
- N. Dave, M. Y. Chan, P.-J. J. Huang, B. D. Smith and J. Liu, J. Am. Chem. Soc., 2010, 132(36), 12668–12673 CrossRef CAS.
- X. Lei, H. Li, Y. Luo, X. Sun, X. Guo, Y. Hu and R. Wen, J. Taiwan Inst. Chem. Eng., 2021, 123, 79–86 CrossRef CAS.
- J. L. MacLean, K. Morishita and J. Liu, Biosens. Bioelectron., 2013, 48, 82–86 CrossRef CAS PubMed.
- J.-S. Shen, Y.-L. Chen, Q.-P. Wang, T. Yu, X.-Y. Huang, Y. Yang and H.-W. Zhang, J. Mater. Chem. C, 2013, 1(11), 2092–2096 RSC.
- Z. Zhao and Y. Li, Colloids Surf., B, 2020, 195, 111244 CrossRef CAS PubMed.
- L.-Y. Chen, C.-W. Wang, Z. Yuan and H.-T. Chang, Anal. Chem., 2015, 87(1), 216–229 CrossRef CAS PubMed.
- O. Ozay, N. Aktas, E. Inger and N. Sahiner, Int. J. Hydrogen Energy, 2011, 36(3), 1998–2006 CrossRef CAS.
- A. Contin, A. Biffis, S. Sterchele, K. Dörmbach, S. Schipmann and A. Pich, J. Colloid Interface Sci., 2014, 414, 41–45 CrossRef CAS PubMed.
- H. A. H. Alzahrani, M. A. Buckingham, W. P. Wardley, R. D. Tilley, N. Ariotti and L. Aldous, Chem. Commun., 2020, 56(8), 1263–1266 RSC.
- H. Dong, J. F. Snyder, D. T. Tran and J. L. Leadore, Carbohydr. Polym., 2013, 95(2), 760–767 CrossRef CAS PubMed.
- X.-Q. Wu, X.-W. Wu, Q. Huang, J.-S. Shen and H.-W. Zhang, Appl. Surf. Sci., 2015, 331, 210–218 CrossRef CAS.
- F. Wahid, C. Zhong, H.-S. Wang, X.-H. Hu and L.-Q. Chu, Polymers, 2017, 9(12), 636 CrossRef PubMed.
- M. A. Molina, C. R. Rivarola and C. A. Barbero, Eur. Polym. J., 2011, 47(10), 1977–1984 CrossRef CAS.
- S. Mourdikoudis, R. M. Pallares and N. T. K. Thanh, Nanoscale, 2018, 10(27), 12871–12934 RSC.
- G. A. Monti, G. A. Fernández, N. M. Correa, R. D. Falcone, F. Moyano and G. F. Silbestri, R. Soc. Open Sci., 2017, 4(7), 170481 CrossRef PubMed.
- G. A. Monti, N. M. Correa, R. D. Falcone, G. F. Silbestri and F. Moyano, ChemistrySelect, 2020, 5(36), 11264–11271 CrossRef CAS.
- D. W. Mayo, in Course Notes on the Interpretation of Infrared and Raman Spectra, 2004, pp. 33–72 Search PubMed.
- I. J. D. Ebenezar, S. Ramalingam, C. R. Raja and P. C. J. Prabakar, J. Nanotechnol. Adv. Mater., 2014, 2, 11–25 CrossRef.
- K. Kusolkamabot, P. Sae-ung, N. Niamnont, K. Wongravee, M. Sukwattanasinitt and V. P. Hoven, Langmuir, 2013, 29(39), 12317–12327 CrossRef CAS PubMed.
- X.-F. Sun, Q. Zeng, H. Wang and Y. Hao, Cellulose, 2019, 26(3), 1909–1922 CrossRef CAS.
- J. Yin and B. Deng, J. Membr. Sci., 2015, 479, 256–275 CrossRef CAS.
- H. G. Schild, Prog. Polym. Sci., 1992, 17(2), 163–249 CrossRef CAS.
- G. Gombár, D. Ungor, G. F. Samu, O. Dömötör and E. Csapó, J. Mol. Liq., 2022, 359, 119372 CrossRef.
- L. Xi, X. Zhang, Y. Chen, J. Peng, M. Liu, D. Huo, G. Li and H. He, Chem. Phys. Lett., 2022, 807, 140085 CrossRef CAS.
- H. Zhuang, X. Jiang, S. Wu, S. Wang, Y. Pang, Y. Huang and H. Yan, Sci. Rep., 2022, 12(1), 6624 CrossRef CAS PubMed.
- M. I. Taccone, R. A. Fernández, F. L. Molina, I. Gustín, C. G. Sánchez, S. A. Dassie and G. A. Pino, Phys. Chem. Chem. Phys., 2020, 22(29), 16813–16821 RSC.
- K. Kwak and D. Lee, Acc. Chem. Res., 2019, 52(1), 12–22 CrossRef CAS PubMed.
- N. Cao, J. Xu, H. Zhou, Y. Zhao, J. Xu, J. Li and S. Zhang, Microchem. J., 2020, 159, 105406 CrossRef CAS.
- L. E. Mulko, M. Rossa, J. P. Aranguren-Abrate and G. A. Pino, Appl. Surf. Sci., 2019, 485, 141–146 CrossRef CAS.
- F.-N. Wu, J. Zhu, G.-J. Weng, J.-J. Li and J.-W. Zhao, J. Mater. Chem. C, 2022, 10(40), 14812–14833 RSC.
- H. Ramsay, D. Simon, E. Steele, A. Hebert, R. D. Oleschuk and K. G. Stamplecoskie, RSC Adv., 2018, 8(73), 42080–42086 RSC.
- S. Liu, F. Lu and J. J. Zhu, Chem. Commun., 2011, 47(9), 2661–2663 RSC.
- Y. Zhang, H. Jiang and X. Wang, Anal. Chim. Acta, 2015, 870, 1–7 CrossRef CAS PubMed.
- H. Shi, M. Y. Ou, J. P. Cao and G. F. Chen, RSC Adv., 2015, 5(105), 86740–86745 RSC.
- G. Wang, S. Zhang, J. Cui, W. Gao, X. Rong, Y. Lu and C. Gao, Spectrochim. Acta, Part A, 2023, 286, 122010 CrossRef CAS.
- L. Sulistiawaty, S. Sugiarti and N. Darmawan, Indones. J. Chem., 2015, 15(1), 1–8 CrossRef CAS.
Footnote |
| † Electronic supplementary information (ESI) available. See DOI: https://doi.org/10.1039/d3va00114h |
| This journal is © The Royal Society of Chemistry 2023 |