 Open Access Article
Study of the different morphologies of Zn0.5Cd0.5S for photocatalytic H2 production†
Wei
Ren‡
ab,
Ruiru
Si‡
a,
Jiahui
Wang
b,
Yang
Yang
b,
Xiuzhen
Zheng
 *ab and
Shifu
Chen
 *b
*b
aInstitute of Quality Standards & Testing Technology for Agro-products, Fujian Academy of Agricultural Sciences, Fujian Key Laboratory of Agro-products Quality and Safety, Fuzhou, 350003, China. E-mail: zhengxz@chnu.edu.cn
bCollege of Chemistry and Material Science, Huaibei Normal University, Huaibei, 235000, P. R. China. E-mail: chshifu@chnu.edu.cn
First published on 4th April 2023
Abstract
As catalytic reaction usually occur on the surface of a catalyst, regulating the catalyst morphology may largely affect the photocatalytic properties. A series of Zn0.5Cd0.5S catalysts with different shapes, namely nanoparticles, nanorods, microsheets, and microspheres, were prepared through hydrothermal/solvothermal reaction by controlling the sulfur source, solvent, and the adding sequence of the raw material. Moreover, their photocatalytic H2 production in different solvents, including H2O, formic acid, lactic acid, and Na2S/Na2SO3, were investigated. The addition of the sacrificial agents could inhibit the photocorrosion caused by the strong oxidation of holes (h+), increasing the amount of photogenerated electrons (e−) to produce H2. Zn0.5Cd0.5S nanoparticles and nanosheets displayed much higher activity than other samples due to the effective separation of photogenerated charge carriers (PCCs), large specific surface area, and negative position of the conduction band.
Environmental significanceThe search for clean and renewable energy sources has become a prominent research area in recent decades due to the rise in environmental pollution and the fast consumption of fossil fuels. H2 has been one of the well-known and viable clean energy alternatives to fossil fuels for a long time, and research into it has never stopped. Many scientists have carried out a lot of research on photocatalytic H2 production, as it can convert solar energy into chemical energy. Although considerable progress has been made, it has not always been satisfactory. In many studies, people have employed H2O, Na2SO3 solution, formic acid, lactic acid, and other reactants as the H2 source. This work provides a simple and easy method for the preparation of Zn0.5Cd0.5S with notable photocatalytic activity, facilitating its further application in choosing the optimal photocatalyst. |
1. Introduction
Photocatalytic H2 evolution from water splitting has attracted increasing attention because it can convert solar energy into chemical energy. However, some single-component catalysts (like TiO2 and ZnO) have low H2-production efficiency, as they can only absorb UV light.1–4 Recently, many research works have focused on the development of photocatalysts with visible-light activity, for instance, metal sulfides,5–7 C3N4 materials,8,9 and solid-solution materials.10 Metal sulfides (such as CdS,11–13 ZnS,14–16 ZnxCd1-xS,17,18 and ZnIn2S4) are considered as effective visible-light photocatalysts for H2 production. Among them, ZnxCd1−xS, as a solid solution of ZnS and CdS, has been widely studied because of its high activity and sufficient negative overpotential.19 With an adjustable band gap, ZnxCd1−xS can trigger some new redox reactions and facilitate the chemo-adsorption of specific reactants.20,21 However, the photogenerated e− and h+ can be recombined on the interior or surface of the ZnxCd1−xS in a few nanoseconds, dissipating the energy and being detrimental to the overall photocatalytic efficiency. Regulating the structural parameters of ZnxCd1−xS, such as the size and morphology, may be a good method to reduce the recombination efficiency of PCCs, as it can enhance the absorption of the catalyst and shorten the carrier migration path.As the catalytic reaction usually occurs on the surface of a catalyst, the different morphologies of ZnxCd1−xS may largely influence its photocatalytic properties.21–25 Researchers have found that the photocatalytic activity of ZnxCd1−xS can be effectively increased by changing its size, shape, comparative area, and other factors.20,26,27 In the work of Gao et al., ZnxCd1–xS quantum dots were prepared and showed to have a much higher photocatalytic H2-production activity (1220 μmol g−1 h−1) compared to that of a ZCS sample prepared by the conventional co-precipitation method.28 Additionally, a one-dimensional (1D) Cd0.6Zn0.4S nanorod solid solution with rich sulfur vacancies was synthesized by Yu et al., which achieved an excellent photocatalytic H2-production activity of 59.3 mmol g−1 h−1 under visible-light irradiation.29 Moreover, a sulfur vacancy-rich Zn0.5Cd0.5S nanocage photocatalyst with interstitial phosphorus doping was prepared by using zeolitic-imidazolate-framework-8 (ZIF-8) rhombic dodecahedrons as the templates. Its H2-production rate was enhanced (57.21 μmol h−1) compared to that of the pristine ZnCdS nanocages (21.58 μmol h−1).30 These works indicate that morphology regulation is an effective method to improve the photocatalytic activity of ZnxCd1–xS. Studying the relation between the morphology and the photocatalytic performance would also be beneficial to promote the application of ZnxCd1–xS in photocatalysis.
In this work, Zn0.5Cd0.5S was chosen as a representative example to explore the relation between the morphology and photocatalytic properties, as it has the best activity in lactic acid solution (Fig. S1†). First, the synthetic methods of Zn0.5Cd0.5S with different shapes were studied in detail, with controlling the sulfur source, solvent, and the adding sequence of the raw material. In the hydrothermal/solvothermal reaction, Cd(NO3)2·4H2O, Zn(Ac)2·2H2O, and sulfur source (Na2S·9H2O, thioacetamide and thiourea) were used as the raw materials, with deionized water or a mixed solution of deionized water and diethylenetriamine (DETA) used as the solvent. The obtained Zn0.5Cd0.5S nanomaterials displayed rich and diverse morphologies, and tests on their photocatalytic H2 production in different solvents were carried out, such as in H2O, formic acid, lactic acid, and Na2S/Na2SO3. The work provides a simple and easy method for the preparation of Zn0.5Cd0.5S with referable photocatalytic activity, facilitating further applications in choosing the optimal photocatalyst.
2. Experimental section
2.1. Catalyst preparation
![[thin space (1/6-em)]](https://www.rsc.org/images/entities/char_2009.gif) :
:![[thin space (1/6-em)]](https://www.rsc.org/images/entities/char_2009.gif) 1. After stirring for 30 min, the mixture was transferred to a 100 mL Teflon liner, sealed in a steel sleeve, and heated at 180 °C for 10 h. After the reaction, the solution was cooled to room temperature, and the precipitate was collected by centrifugation, washed with deionized water and ethanol, and dried in a vacuum oven at 60 °C for 12 h. The intermediate product was obtained, and named as CdS-DETA.
1. After stirring for 30 min, the mixture was transferred to a 100 mL Teflon liner, sealed in a steel sleeve, and heated at 180 °C for 10 h. After the reaction, the solution was cooled to room temperature, and the precipitate was collected by centrifugation, washed with deionized water and ethanol, and dried in a vacuum oven at 60 °C for 12 h. The intermediate product was obtained, and named as CdS-DETA.
Next, 5.00 mmol CdS-DETA (722 mg) was dissolved in 70 mL ethylene glycol. After 1 h ultrasound treatment, 2.5 mmol Zn(Ac)2·2H2O was added, and then ultrasound was continued for another 1 h. The solution was then transferred to a 100 mL Teflon liner, sealed, and heated at 160 °C for 6 h. At the end of the reaction, the sample was cooled to room temperature, collected by centrifugation, and freeze-dried for 12 h. Finally, Zn0.5Cd0.5S nanomaterial with a 1D nanorods morphology was obtained, and denoted as ZCS-1D.
![[thin space (1/6-em)]](https://www.rsc.org/images/entities/char_2009.gif) :
:![[thin space (1/6-em)]](https://www.rsc.org/images/entities/char_2009.gif) 1. After the solvothermal reaction at 180 °C for 10 h, the intermediate product was obtained, and named as ZnS-DETA. Then, 5 mmol ZnS-DETA (487 mg) was dissolved in 70 mL ethylene glycol. After 1 h ultrasonic reaction, 2.5 mmol Cd(NO3)2·4H2O was added, and the ultrasonic reaction was continued for 1 h. Following the same solvothermal reaction like for the ZCS-1D at 160 °C for 6 h, the ZnxCd1–xS nanomaterial with a two-dimensional (2D) microsheet morphology was thus prepared, and labeled as ZCS-2D.
1. After the solvothermal reaction at 180 °C for 10 h, the intermediate product was obtained, and named as ZnS-DETA. Then, 5 mmol ZnS-DETA (487 mg) was dissolved in 70 mL ethylene glycol. After 1 h ultrasonic reaction, 2.5 mmol Cd(NO3)2·4H2O was added, and the ultrasonic reaction was continued for 1 h. Following the same solvothermal reaction like for the ZCS-1D at 160 °C for 6 h, the ZnxCd1–xS nanomaterial with a two-dimensional (2D) microsheet morphology was thus prepared, and labeled as ZCS-2D.
The characterization of these ZCS samples is provided in the ESI.†
2.2. Photocatalytic H2 production from using ZCS catalysts with different morphologies
The photocatalytic H2 production of the ZCS catalysts as tested using an on-line system (MC-SH2II-AG, Beijing MerryChange Technology Co., LTD.). Their activity was investigated in different solvents, such as H2O, Na2S/Na2SO3, formic acid, and lactic acid. The detailed process and steps are as following: the solvent (100 mL H2O, 100 mL 0.25 mol L−1 Na2S/0.35 mol L−1 Na2SO3, 10 mL formic acid + 90 mL H2O or 10 mL lactic acid + 90 mL H2O) and 100 mg catalyst were added to the reactor. Then, the reactor was connected to the photocatalytic reaction system and vacuumed. The reaction solution was stirred in the dark for half an hour to reach dynamic adsorption/desorption equilibrium. A xenon lamp light source (λ > 400 nm) was then used for illumination to initiate the photocatalytic reaction. During the whole photocatalytic process, the reactor temperature was controlled by the circulating condensing unit and kept at 5 °C. During the reaction, H2 was detected by TCD on-line gas chromatography (GC9790II, FULI). After the reaction, the amount of H2 was calculated.3. Results and discussion
3.1. Characterization of the ZCS catalysts with different morphologies
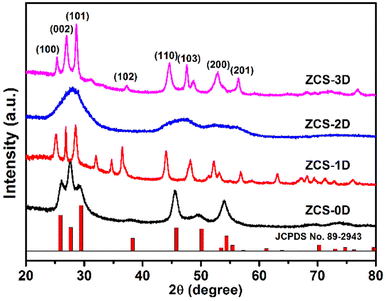
The ZCS samples prepared in this work were fully ground, and characterized by X-ray powder diffractometry (XRD, Fig. 1). First, ZCS-0D was prepared with Cd(NO3)2·4H2O, Zn(Ac)2·2H2O, and Na2S·9H2O as the Cd, Zn, and S sources, respectively. When using thioacetamide to replace Na2S·9H2O, ZCS with 3D microspheres was synthesized. Their XRD patterns were basically consistent with JCPDS card no. 89-2943. Moreover, their diffraction peaks were very sharp, indicating that both the samples possessed high crystallinity. ZCS-1D and ZCS-2D samples were prepared by a two-step solvothermal method, with CdS-DETA and ZnS-DETA first prepared. They also displayed similar XRD patterns to ZCS-3D. For ZCS-1D, there were some other diffraction peaks related to impurity phases, which may be attributed to the solvent effect of ethylene glycol. To confirm the real contents of the ZCS with different dimensions, the amount of Zn and Cd were tested by ICP-OES technology (Table S1†). The molar ratios of Zn and Cd were all close to 1![[thin space (1/6-em)]](https://www.rsc.org/images/entities/char_2009.gif) :
:![[thin space (1/6-em)]](https://www.rsc.org/images/entities/char_2009.gif) 1, indicating that Zn0.5Cd0.5S materials with different shapes were successfully synthesized.
1, indicating that Zn0.5Cd0.5S materials with different shapes were successfully synthesized.
The morphology of a material largely influences its properties, such as electrical conductivity, thermal conductivity, and catalytic activity. Therefore to investigate the photocatalytic performances of the ZCS samples, their morphologies were first observed from SEM images. ZCS-0D consisted of nanoparticles (Fig. 2a and b), which agglomerated to form blocks, sized ca. 30 nm. ZCS-1D showed nanorod shapes (Fig. 2e and f), hundreds of nanometers in length and tens of nanometers in width. This unique long-axis structure provides a path for the rapid transport of PCCs. Compared with 0D and 1D materials, ZCS-2D sheets with a micron size had a larger exposed surface area and more effective active sites (Fig. 2i and j). For the ZCS-3D microspheres (Fig. 2m and n), their shape was conducive to the absorption of visible light. In order to gain more effective active sites, ZCS-3D could increase the contact area with the reactants, thereby promoting the photocatalytic reaction.
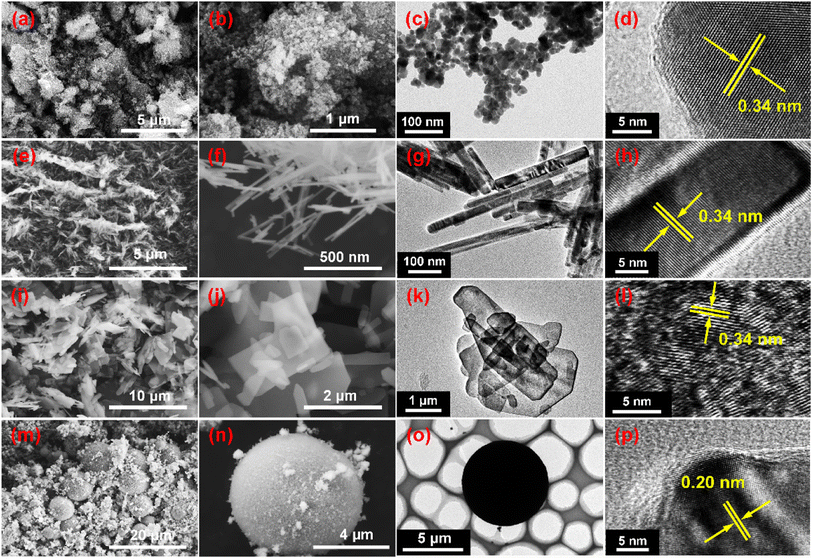 | ||
| Fig. 2 SEM images of the synthesized Zn0.5Cd0.5S nanomaterials with different shapes: ZCS-0D (a–d), ZCS-1D (e–h), ZCS-2D (i–l), and ZCS-3D (m–p). | ||
Meanwhile, the EDX spectrum and element mapping images were studied from the SEM images of ZCS (Fig. S2–S5†). The Zn, Cd, and S elements could be clearly observed, and were evenly distributed on the surface of the catalyst. Moreover, their shapes were investigated by TEM images, which gave consistent results with the SEM results. Nanoparticles (Fig. 2c), nanorods (Fig. 2g), microsheets (Fig. 2k), and microspheres (Fig. 2o) could be clearly observed. Lattice fringes at 0.34 nm were detected for ZCS-0D (Fig. 2d), ZCS-1D (Fig. 2h), and ZCS-2D (Fig. 2l), belonging to the (100) crystal plane. For ZCS-3D (Fig. 2p), the lattice fringe was found at 0.20 nm, corresponding to its (110) crystal plane.
The surface properties of ZCS with different shapes were further investigated by X-ray photoelectron spectroscopy (XPS) measurements. By calibrating the C peak (284.6 eV, Fig. 3b), the Zn, Cd, and S elements could be observed (Fig. 3a). Zn 2p (Fig. 3c) and Cd 3d (Fig. 3d) both possessed two peaks, and S 2p was divided into two peaks (Fig. 3e).32 These spectra indicate that the ZCS samples were composed of Zn, Cd, and S elements.33 Due to the different synthesis methods, some deviations appeared in the binding energies of Zn 2p, Cd 3d, and S 2p. For Cd elements, no obvious changes were found in the ZCS samples. However, the Zn 2p peaks of ZCS-2D were significantly shifted to lower binding energies due to its high electron density, resulting from the presence of S vacancies (Fig. 9c). Reversely, the S 2p peaks of ZCS-2D were shifted to higher binding energies with the loss of electrons. The movements of the S element for the ZCS samples are complicated and may be caused by many factors, such as the binding energy of C element and the synthetic condition (S resources, reaction solvents, and reaction temperature).
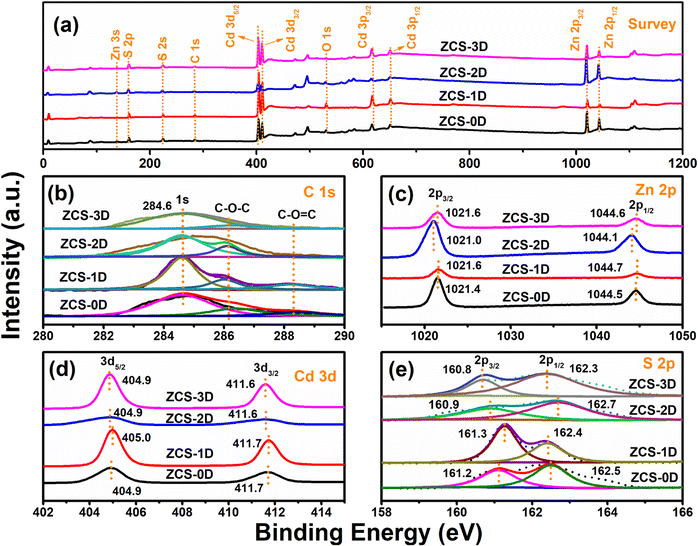 | ||
| Fig. 3 XPS spectra of ZCS samples with different shapes: survey (a), C 1s (b), Zn 2p (c), Cd 3d (d), and S 2p (e). | ||
3.2. Formation mechanism of ZCS catalysts with different morphologies
For ZCS-0D, when Cd(NO3)2·4H2O, Zn(Ac)2·2H2O, and Na2S·9H2O are added in the water, Zn2+, Cd2+, and S2− can be easily dissociated and they will stick together to form Zn0.5Cd0.5S nanoparticles. By using thioacetamide as the S resource, it will be hydrolyzed to form H2S in acidic solution. As the aqueous solution of Zn(Ac)2·2H2O is weakly acidic, the H2S amount is low. Cd2+ and Zn2+ will react with S2− from H2S slowly, and ZCS nanoparticles are first formed. With the temperature rising, S2− is largely released, and ZCS nanoparticles as the core will agglomerate to generate spherical structures. Thus, ZCS-3D will be formed.It is well known that DETA (C4H13N3) has good complexing ability with metal ions due to the lone pair of electrons on its amino nitrogen.34,35 In the ZCS-1D synthesis, DETA molecules not only play a key role in the complexation and assembly, they also act as structural guides in synthetic systems. Before heat treatment, DETA complexed with Cd2+ in solution to form [Cd(DETA)m]2+, which inhibited the presence of free Cd2+, while controlling the generation of CdS cores. When the precursor solution was heated, NH3, CO2, and H2S were produced by thiourea decomposition. With the temperature increasing, [Cd(DETA)m]2+ decomposes into Cd2+ ions and EDTA molecules. The resulting Cd2+ ion further reacts with H2S to form CdS. Under the action of DETA, the crystal nucleus of CdS begins to form and grow.36 As a linear molecule, DETA molecule adsorbed on to the CdS surface can act as a synthetic agent and structural guide, controlling the growth direction of CdS (Fig. 4a). Without the presence of DETA (only H2O as solvent), CdS-H2O had a nanosphere shape with a size of ca. 300 nm (Fig. 4b and c), which proves the role of DETA. Finally, with the addition of Zn(Ac)2·2H2O, ZCS was synthesized by the ion exchange of Zn2+ and Cd2+, and the nanorod morphology did not change.
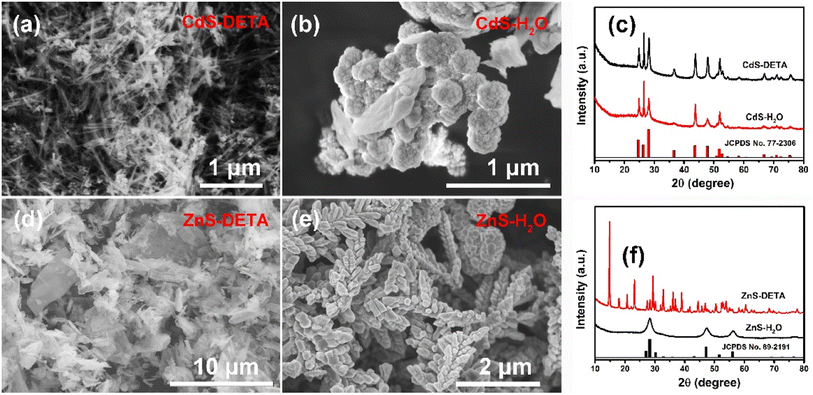 | ||
| Fig. 4 SEM images of CdS-DETA (a), CdS-H2O (b), ZnS-DETA (d), and ZnS-H2O (e), and XRD patterns of CdS (c) and ZnS (f) with different solvent syntheses. | ||
For ZCS-2D microsheets, not only DETA but thiourea also participated in the morphology regulation (Fig. 4d). DETA, also acting as a structure-directing molecule, was first incorporated into the ZnS inorganic framework,37,38 as its shape was different from ZnS-H2O, which was spike shape without the addition of DETA (Fig. 4e). Moreover, their XRD patterns were also different, as many peaks appeared in the ZnS-DETA sample. In the second step of the solvothermal process, with the decomposition of ZnS-DETA, Cd2+ partially replaced Zn2+ to form Zn0.5Cd0.5S solid solution via cation exchange in ethylene glycol.39,40
3.3. Photocatalytic performances of the ZCS catalysts with different morphologies
In the process of photocatalytic water splitting, the reactions can generally be mainly divided into two half-reactions: oxidation reaction and reduction reaction. In the oxidation reaction, h+ play important roles, for instance, the oxidation of furan and aromatic alcohols. While, e− mainly work in reduction reactions, like H2 evolution, CO2 conversion, and NH3 synthesis from N2. To inhibit the recombination of photogenerated e− and h+, some sacrificial agents of e− and h+ are often added. These can consume excessive e− or h+, promoting the rapid and efficient separation of PCCs. For H2 evolution, some sacrificial agents are commonly added, such as methanol,41 lactic acid,42–44 triethanolamine,45,46 glucose,47 or Na2S/Na2SO3.48 They can neutralize the photogenerated h+, which are positively charged and strongly oxidizing during the photoreaction process, thereby resulting to the known photocorrosion phenomenon. To enhance the PCCs utilization of several of the ZCS samples, some sacrificial agents were added into the reaction system, including formic acid, lactic acid, and Na2S/Na2SO3.Due to the high dissociation energy of H2O, it could hardly be oxidized to generate H+ by the h+ of the ZCS samples, and their photocatalytic activity were not too high (Fig. 5a). ZCS-2D possessed the highest activity, about 0.46 mmol g−1 after 4 h reaction. When formic acid was added, the highest activity did not change too much. The activity of ZCS-2D was much lower than that of ZCS-0D and ZCS-1D (0.49 mmol g−1, Fig. 5b). This may due to the poor conductivity of formic acid, which is not conducive to the transfer of PCCs. When lactic acid or Na2S/Na2SO3 was added into the H2O solvent (Fig. 5c and d), the photocatalytic activity was largely enhanced, by about 4–5 times. Among them, ZCS-2D displayed much higher activity than the other ZCS materials, 2.0 mmol g−1 for lactic acid and 1.76 mmol g−1 for Na2S/Na2SO3. Thus, the ZCS catalysts with different morphologies can be used to produce H2, but their activities were different due to the properties of the sacrificial agents.
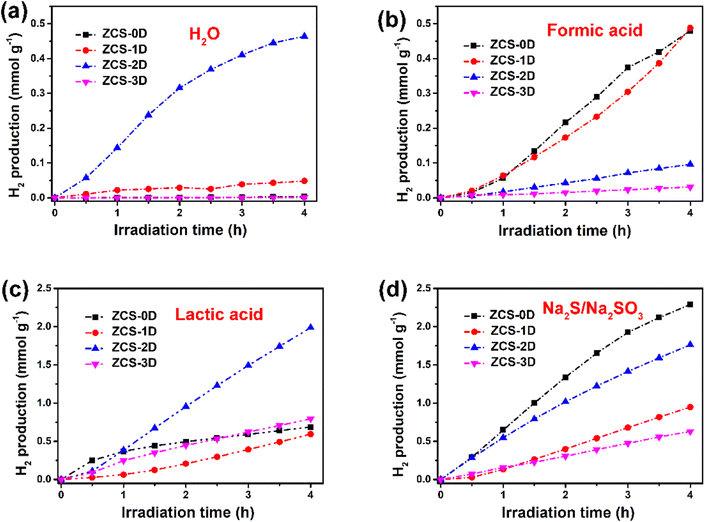 | ||
| Fig. 5 Photocatalytic H2 production of ZCS samples in different solvents: H2O (a), formic acid (b), lactic acid (c), and Na2S/Na2SO3 (d). | ||
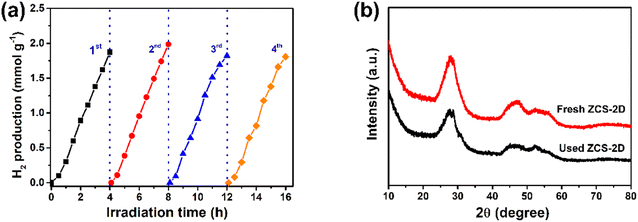
Compared with other ZCS samples, ZCS-2D displayed relatively good activity. This may due to its more exposed surface area, facilitating the contact of the reactants with the catalyst. To further highlight the photocatalytic activity of ZCS-2D, ZnS-DETA and CdS-DETA were prepared (Fig. S6†). The activity of ZCS-2D was largely enhanced, about 117 and 21 times higher than that of ZnS-DETA and CdS-DETA. Meanwhile, the stability of ZCS-2D in lactic acid solution was investigated, which showed nearly no change after 4 cycles of testing (Fig. 6a), indicating that the sacrificial agents indeed play important roles in reducing the photocorrosion phenomenon. Furthermore, the crystal structure of ZCS-2D was stable, as its XRD pattern was well maintained after one cycle reaction (Fig. 6b). In order to avoid environmental pollution caused by ZCS, the concentration of Cd and Zn elements after reaction were assessed by ICP-MS (Table S2†). The dissolution of the Cd element was much lower than that of the Zn element, and the ZCS-2D catalyst released the lowest concentration of Cd2+ (0.12 mg L−1).
3.4. Discussion about the activities of the ZCS catalysts with different morphologies
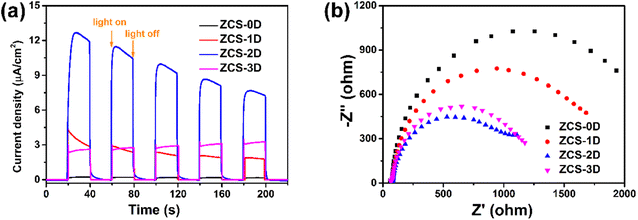
For photocatalytic H2 reaction, its generation rate will be affected by many factors, such as the crystalline phase, morphology, surface area, light absorption, and charge separation and transfer. Among these, charge separation and migration proved to be the most critical factors, as investigated by the photocurrent response (Fig. 7a) and electrochemical impedance spectroscopy (EIS) tests (Fig. 7b). Generally, the larger the response value of the photocurrent, the higher the separation efficiency of PCCs during the photocatalytic reaction. The photocurrent response of ZCS-2D was highest, compared with the other ZCS samples, meaning that the 2D sheet-structure indeed facilitated the separation of PCCs in the photocatalytic process. Meanwhile, the radius size of the semicircle can indicate the surface migration rate of the charge. The circular arc of the ZCS-2D impedance curve was smaller than for the other samples, indicating that the charge-transfer resistance was smaller. Thus, the small interfacial resistance of ZCS-2D could aid rapidly transferring the surface charge, thus promoting the effective separation of PCCs.In order to prove the above speculation, the time-resolved photoluminescence decay technique was used to further investigate the separation efficiency of PCCs (Fig. 8a). The calculated lifetime of the photogenerated electrons for the ZCS-2D sample was 0.81 ns, which was longer than that of ZCS-0D (0.42 ns), ZCS-1D (0.40 ns), and ZCS-3D (0.39 ns). Thus, ZCS-2D could more efficiently separate the PCCs than the other ZCS samples. Besides, the specific surface areas of the ZCS samples were investigated (Fig. 8b and Table S3†), and their order was as follows: ZCS-2D (130.74 m2 g−1) > ZCS-0D (78.14 m2 g−1) > ZCS-3D (50.23 m2 g−1) > ZCS-1D (45.91 m2 g−1). The specific surface areas of ZCS-2D and ZCS-0D were higher than those of ZCS-1D and ZCS-3D, which was very much consistent with the photocatalytic performance. Especially, the specific surface area significantly contributed to the enhanced photocatalytic activity of ZCS-0D, as ZCS-0D also displayed good activity in the solutions of formic acid (0.48 mmol g−1) and Na2S/Na2SO3 (2.29 mmol g−1). In summary, there are two main reasons for the best performance of ZCS-2D, and one is the bigger specific surface area, facilitating the adsorption of reactants, while the other one is the longer lifetime of the photogenerated electrons, thus increasing the utilization of PCCs.
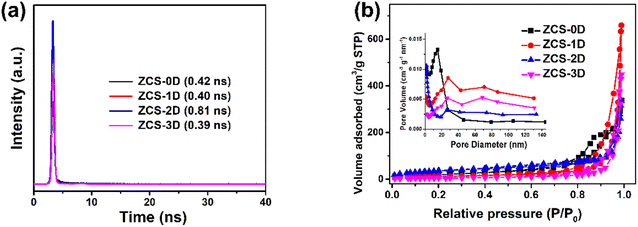 | ||
| Fig. 8 Time-resolved fluorescence decay spectra (a) and BET cures (b) of ZCS samples with different morphologies. | ||
The band structure of the photocatalyst plays a crucial role in photocatalytic H2 production because it determines the light-absorption range of the catalyst and the thermodynamic driving force of H2 evolution. From the UV-visible-diffuse reflection spectra, ZCS-1D and ZCS-3D displayed better light-absorption properties in the ultraviolet and visible-light range (Fig. 9a).20 To estimate the bandwidth (Eg) of the ZCS samples, the resulting absorption spectra were processed by the Tauc plot method. The bandwidth of a photocatalytic material can be calculated according to the following formula: (αhυ)2 = A(hυ − Eg), where α is the light-absorption coefficient, h is the Planck constant, and υ is the frequency of light. By drawing the (αhυ)2 − hυ curve, the Eg values can be obtained from their intercept between the tangent and x-axis (Fig. 9b). The Eg values of ZCS-0D, ZCS-1D, ZCS-2D, and ZCS-3D were about 2.59, 2.43, 2.74, and 2.40 eV, respectively. These indicate that all the ZCS materials could absorb visible light. Although ZCS-2D displayed the largest band gap, it had a defect band at 2.48 V away from the conduction band position. The electron paramagnetic resonance (EPR, Fig. 9c) also confirmed the existence of defect sites on the ZCS-2D surface, which is beneficial for the adsorption of reactants. A pair of signals located at g = 2.003 were detected for ZCS-2D, which may be due to S vacancies.49,50 The S defect sites provide more active sites, not only improving the adsorption and activation of reactant molecules, but reducing the activation energy of redox reactions.
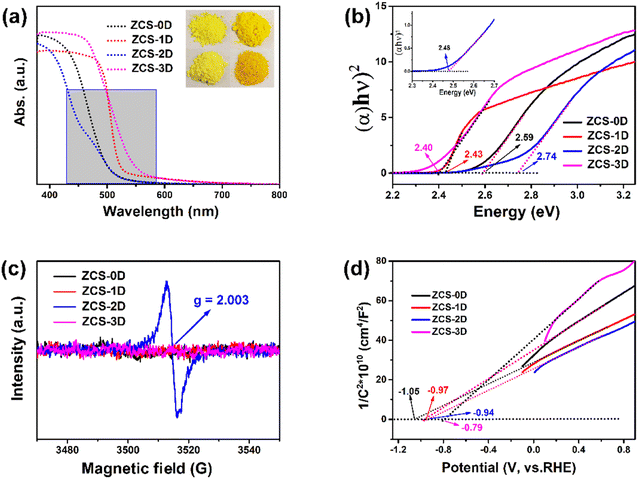 | ||
| Fig. 9 Light absorbance (a), Eg (b), EPR (c), and M–S spectra (d) of ZCS samples with different morphologies. | ||
The conduction band positions of the prepared ZCS samples were analyzed by M–S plots (Fig. 9d). These ZCS samples exhibited n-type semiconductor behavior, because their curves showed a positive slope in the linear regions. Generally, the conduction band edge potential (ECB) was about 0.1 V lower than its flat band gap, which could be estimated by the intercept of the X-axis tangent. As calculated from the M–S plots, the ECB values prepared for ZCS-0D, ZCS-1D, ZCS-2D, and ZCS-3D were about −1.15, −1.07, −1.04, and −0.89 V, respectively. These ECB positions are more negative than the reduction potential of H+ (−0.41 V vs. NHE, pH 7), thermodynamically ensuring that H2 production can proceed. Corresponding, their valence band (EVB) positions were at 1.44, 1.36, 1.7, and 1.51 V, respectively.
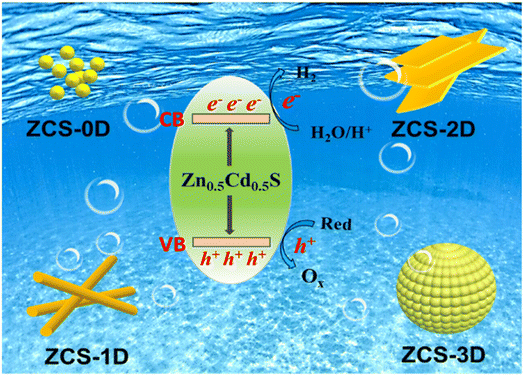
Based on the measured EVB, ECB, and Eg, the mechanism of H2 evolution on ZCS materials with different morphologies could be constructed (Fig. 10). Obviously, the morphology and synthetic method not only affected their EVB and ECB position, but also their specific surface area and light absorption. Although the oxidative capacity of the photoinduced h+ is important, it resulted in the photocorrosion of ZCS. With the addition of the sacrificial agents, excessive h+ were consumed and e− utilization was enhanced, which was beneficial for H2 production.
4. Conclusions
Zn0.5Cd0.5S catalysts with the shapes of nanoparticles, nanorods, microsheets, and microspheres were prepared through a hydrothermal/solvothermal reaction, and their photocatalytic H2-production performances in different solvents were assessed. The different morphologies of the Zn0.5Cd0.5S photocatalysts had different H2-production activities, with ZCS-2D and ZCS-0D showing the best performance. Moreover, ZCS-2D not only possessed a higher specific area, but also defect sites, which facilitated the adsorption of reactants and largely improved the photocatalytic activity. Therefore, it is of great significance to explore the synthesis methods of ZnxCd1−xS photocatalysts with different morphologies to promote their application in H2 production.Conflicts of interest
The authors declare that they have no competing financial interests.Acknowledgements
This work was supported by the National Natural Science Foundation of China (NSFC, grant No. 21607027, 52272297, and 51972134), open project program of Fujian Key Laboratory of Agro-products Quality & Safety (Grant No. APQSKF202102), Natural Science Foundation of Fujian Province (2021J01470), Natural Science Foundation of Anhui Province (2108085MB43), and University Natural Science Research Project of Anhui Province in China (2022AH050373, gxyq2022022, 2022AH010030, and GXXT-2020-077).References
- X. Li, J. Yu and M. Jaroniec, Chem. Soc. Rev., 2016, 45, 2603–2636 RSC.
- Z. K. Liang, B. Ouyang, T. Y. Wang, X. Liu, H. L. Huo, D. Liu, H. Feng, J. J. Ma, K. M. Deng, A. Li and E. R. Kan, Int. J. Hydrogen Energy, 2022, 47, 10868–10876 CrossRef CAS.
- J. Chen, Z. Shen, S. Lv, K. Shen, R. Wu, X.-f. Jiang, T. Fan, J. Chen and Y. Li, J. Mater. Chem. A, 2018, 6, 19631–19642 RSC.
- M. A. Sha, G. Mohanan, L. Elias, T. C. Bhagya and S. M. A. Shibli, Mater. Chem. Phys., 2023, 294, 127019 CrossRef CAS.
- X. Y. Dang, M. S. Xie, F. F. Dai, J. N. Guo, J. Liu and X. Q. Lu, J. Mater. Chem. A, 2021, 9, 14888–14896 RSC.
- Y. M. Wang, T. T. Zhang, T. T. Wei, F. Y. Li and L. Xu, New J. Chem., 2021, 45, 11261–11268 RSC.
- Q. Zhang, X. Wang, J. Zhang, L. Li, H. Gu and W. L. Dai, J. Colloid Interface Sci., 2021, 590, 632–640 CrossRef CAS PubMed.
- S. G. Khasevani, M. Taheri and M. R. Gholami, Mater. Chem. Phys., 2021, 261, 124218 CrossRef CAS.
- S. Walia, M. Kaur and S. K. Kansal, Mater. Chem. Phys., 2022, 289, 126493 CrossRef CAS.
- Y. Sun, X. Wang, Q. Fu and C. Pan, Appl. Surf. Sci., 2021, 564, 150379 CrossRef CAS.
- H. Z. Zhu, Y. Q. Yang, Y. Y. Kang, P. Niu, X. D. Kang, Z. Q. Yang, H. Q. Ye and G. Liu, J. Mater. Sci. Technol., 2022, 102, 1–7 CrossRef.
- K. L. Wu, X. Peng, Y. Ma, X. Q. Yang, J. Q. Sun, P. C. Wu, J. Hou, B. K. Li and Z. Y. Liu, Appl. Phys. A: Mater. Sci. Process., 2021, 127, 906 CrossRef CAS.
- N. Li, Y. X. Ding, J. J. Wu, Z. J. Zhao, X. T. Li, Y. Z. Zheng, M. L. Huang and X. Tao, ACS Appl. Mater. Interfaces, 2019, 11, 22297–22306 CrossRef CAS PubMed.
- J. Jiang, G. H. Wang, Y. C. Shao, J. Wang, S. Zhou and Y. R. Su, Chin. J. Catal., 2022, 43, 329–338 CrossRef CAS.
- C. Garcia-Mendoza, W. E. S. Rivera, M. A. Alvarez-Lemus, G. Jacome-Acatitla, D. M. F. Marquez and R. Lopez-Gonzalez, J. Chem. Technol. Biotechnol, 2022, 97, 2984–2993 CrossRef CAS.
- J. M. Huang, J. M. Chen, W. X. Liu, J. W. Zhang and J. Y. Chen, Chin. J. Catal., 2022, 43, 782–792 CrossRef CAS.
- X. Gao, J. Yang, D. Zeng, G. He, C. Dai, Y. Bao and Y. Wei, J. Alloys Compd., 2021, 871, 159460 CrossRef CAS.
- Y. Chen, S. Zhao, X. Wang, Q. Peng, R. Lin, Y. Wang, R. Shen, X. Cao, L. Zhang, G. Zhou, J. Li, A. Xia and Y. Li, J. Am. Chem. Soc., 2016, 138, 4286–4289 CrossRef CAS PubMed.
- Q. Li, H. Meng, P. Zhou, Y. Zheng, J. Wang, J. Yu and J. Gong, ACS Catal., 2013, 3, 882–889 CrossRef CAS.
- F. del Valle, A. Ishikawa, K. Domen, J. A. Villoria de la Mano, M. C. Sánchez-Sánchez, I. D. González, S. Herreras, N. Mota, M. E. Rivas and M. C. Álvarez Galván, Catal. Today, 2009, 143, 51–56 CrossRef CAS.
- K. Zhang, H. Xu, C. Yang, K. Guo, C. Ye, Z. Zhou, Y. Sun and C. Li, Mater. Sci. Semicond. Process., 2020, 107, 104802 CrossRef CAS.
- Y. Han, Z. Liang, H. Dang and X. Dong, J. Taiwan Inst. Chem. Eng., 2018, 87, 196–203 CrossRef CAS.
- L. Hu, J. Xu, S. Yang, Z. Tan, L. Wang and S. Zhao, New J. Chem., 2022, 46, 407–418 RSC.
- S. Shen, A. Ma, Z. Tang, Z. Han, M. Wang, Z. Wang, L. Zhi and J. Yang, ChemCatChem, 2015, 7, 609–615 CrossRef CAS.
- J. Song, R. Sun, Y. Chen, D. Sun and X. Li, Int. J. Hydrogen Energy, 2018, 43, 18220–18231 CrossRef CAS.
- P. F. Wang, S. H. Zhan, H. T. Wang, Y. G. Xia, Q. L. Hou, Q. X. Zhou, Y. Li and R. R. Kumar, Appl. Catal., B, 2018, 230, 210–219 CrossRef CAS.
- Z. Shao, Y. He, T. Zeng, Y. Yang, X. Pu, B. Ge and J. Dou, J. Alloys Compd., 2018, 769, 889–897 CrossRef CAS.
- R. Gao, B. Cheng, J. Fan, J. Yu and W. Ho, Chin. J. Catal., 2021, 42, 15–24 CrossRef CAS.
- K. Yu, H.-B. Huang, X.-Y. Zeng, J.-Y. Xu, X.-T. Yu, H.-X. Liu, H.-L. Cao, J. Lu and R. Cao, Chem. Commun., 2020, 56, 7765–7768 RSC.
- Q. Zhu, Z. Xu, Q. Yi, M. Nasir, M. Xing, B. Qiu and J. Zhang, Mater. Chem. Front., 2020, 4, 3234–3239 RSC.
- W. Xue, W. Chang, X. Hu, J. Fan and E. Liu, Chin. J. Catal., 2021, 42, 152–163 CrossRef CAS.
- Y. Yang, X. Zheng, J. Liu, Z. Qi, T. Su, C. Cai, X. Fu, S. Meng and S. Chen, Inorg. Chem. Front., 2022, 9, 1943–1955 RSC.
- Y. Yang, W. Ren, X. Zheng, S. Meng, C. Cai, X. Fu and S. Chen, ACS Appl. Mater. Interfaces, 2022, 14, 54649–54661 CrossRef CAS PubMed.
- Y. N. Zhou, Y. G. Wang, T. Wen, S. Y. Zhang, B. B. Chang, Y. Z. Guo and B. C. Yang, J. Colloid Interface Sci., 2016, 467, 97–104 CrossRef CAS PubMed.
- M. Zhang, Y. Lu, J. F. Chen, T. K. Zhang, Y. Y. Liu, Y. Yang, W. T. Yao and S. H. Yu, Langmuir, 2010, 26, 12882–12889 CrossRef CAS PubMed.
- Y. Li, Y. Hu, S. Peng, G. Lu and S. Li, J. Phys. Chem. C, 2009, 113, 9352–9358 CrossRef CAS.
- B. Su, L. J. Huang, Z. Xiong, Y. C. Yang, Y. D. Hou, Z. X. Ding and S. B. Wang, J. Mater. Chem. A, 2019, 7, 26877–26883 RSC.
- T. Ma, F. Zhou, T. W. Zhang, H. B. Yao, T. Y. Su, Z. L. Yu, Y. Li, L. L. Lu and S. H. Yu, Angew. Chem., Int. Ed., 2017, 56, 11836–11840 CrossRef CAS PubMed.
- W. Xue, W. Chang, X. Hu, J. Fan and E. Liu, Chin. J. Catal., 2021, 42, 152–163 CrossRef CAS.
- J. Wang, J. J. Li, L. Xiao, D. Kurbanjan, H. Nie and H. Du, J. Am. Ceram. Soc., 2022, 105, 1405–1416 CrossRef CAS.
- B. Ma, J. P. Zhao, Z. H. Ge, Y. T. Chen and Z. H. Yuan, Sci. China Mater., 2020, 63, 258–266 CrossRef CAS.
- S. N. Guo, Y. L. Min, J. C. Fan and Q. J. Xu, ACS Appl. Mater. Interfaces, 2016, 8, 2928–2934 CrossRef CAS PubMed.
- L. Ma, J. Xu, S. Zhao, L. Li and Y. Liu, Chemistry, 2021, 27, 15795–15805 CrossRef CAS PubMed.
- D. S. Dai, H. Xu, L. Ge, C. C. Han, Y. Q. Gao, S. S. Li and Y. Lu, Appl. Catal., B, 2017, 217, 429–436 CrossRef CAS.
- C. Li, X. Liu, Y. Yan, X. Song, Y. Yan, C. Liu, R. Xu and P. Huo, Chem. Eng. J., 2021, 410, 128316 CrossRef CAS.
- X. J. Sun, D. D. Yang, H. Dong, X. B. Meng, J. L. Sheng, X. Zhang, J. Z. Wei and F. M. Zhang, Sustainable Energy Fuels, 2018, 2, 1356–1361 RSC.
- C. Li, H. Wang, J. Ming, M. Liu and P. Fang, Int. J. Hydrogen Energy, 2017, 42, 16968–16978 CrossRef CAS.
- B. Gong, Y. Lu, P. Wu, Z. Huang, Y. Zhu, Z. Dang, N. Zhu, G. Lu and J. Huang, Appl. Surf. Sci., 2016, 365, 280–290 CrossRef CAS.
- E. Ha, S. Ruan, D. Li, Y. Zhu, Y. Chen, J. Qiu, Z. Chen, T. Xu, J. Su, L. Wang and J. Hu, Nano Res., 2021, 15, 996–1002 CrossRef.
- X. Zhang, Z. Zhao, W. Zhang, G. Zhang, D. Qu, X. Miao, S. Sun and Z. Sun, Small, 2016, 12, 793–801 CrossRef CAS PubMed.
Footnotes |
| † Electronic supplementary information (ESI) available. See DOI: https://doi.org/10.1039/d3va00042g |
| ‡ These authors contributed equally to this paper. |
| This journal is © The Royal Society of Chemistry 2023 |

