 Open Access Article
A simple microscopy approach quantifies biomineralized CO2 in Coccolithus braarudii – a calcifying marine phytoplankton†
Toby
Morton-Collings
a,
Minjun
Yang
 a,
Christopher
Batchelor-McAuley
a,
Samuel
Barton
b,
Rosalind E. M.
Rickaby
b,
Heather A.
Bouman
b and
Richard G.
Compton
a,
Christopher
Batchelor-McAuley
a,
Samuel
Barton
b,
Rosalind E. M.
Rickaby
b,
Heather A.
Bouman
b and
Richard G.
Compton
 *a
*a
aPhysical and Theoretical Chemistry Laboratory, Department of ChemistryUniversity of Oxford, South Parks Road, Oxford, UK. E-mail: Richard.Compton@chem.ox.ac.uk
bDepartment of Earth Sciences, University of Oxford, South Parks Road, Oxford, UK
First published on 8th March 2023
Abstract
Climate is partly controlled by atmospheric carbon dioxide levels. In turn atmospheric CO2 is substantially regulated by oceanic phytoplankton, specifically coccolithophores which biomineralize CO2 as CaCO3 in the form of tiny platelets which ultimately sink to the ocean floor. The scale of this biomineralization is massive; some 1015 g of CaCO3 are formed by phytoplankton per annum. This figure represents a tiny mass of CaCO3 per phytoplankton multiplied by a huge number of individual coccolithophores. For modelling the climate, it is essential to measure the biomineralized CaCO3 at single entity as well as bulk level. In this work we show that a simple light microscopy approach can, by monitoring the undersaturation driven dissolution of calcite in deionised (DI) water, quantify sub-nanograms of calcite mass of heterococcoliths secreted by marine phytoplankton. We show that the biogenic calcite found in coccoliths dissolves at a comparable mass-transport rate to that of inorganic particulate calcite in DI water. We further show that undersaturation driven dissolution is not suitable for quantifying coccolithophores due to competing osmotic pressure effects.
Environmental significanceCalcifying marine phytoplankton, coccolithophores, sequester dissolved CO2 in the form of CaCO3 in the open ocean at a rate that is directly comparable to the rate of CO2 released by humans. Their extent of CO2 sequestration, on both a single entity and bulk level, reflects any changes due to environmental stressors and changes in their local biogeochemistry and thus is an important indicator for climate change. Presently, there is no good way of routinely measuring the mass of biomineralized calcite on a single-entity level. We address this issue by utilising the undersaturation dissolution of biogenic CaCO3 to reveal their calcite mass on a single-entity level. |
Introduction
The surface ocean is supersaturated with respect to calcium carbonate (CaCO3).1 Coccolithophores, the dominant pelagic calcifiers, biomineralize calcium carbonate in the open surface water at an annual gigatonne scale (>1015 g per year) and encrust themselves with interlocking plates of calcite, generated intracellularly, called coccoliths.2,3 This biomineralized particulate inorganic carbon (PIC) plays a crucial role in the marine carbon cycle removing alkalinity from surface waters4 so that the ocean sequesters atmospheric CO2 by ballasting the export of organic carbon to the deep ocean where carbon can be stored for millennia.5,6 The amount of CO2 burial depends on the ratio of inorganic carbon (CaCO3) to organic carbon that sinks to the deep ocean.7 However, under the uncertainties associated with climate change, laboratory results show species-specific responses to changes in conditions such as CO2 partial pressure, temperature and pH.8–10 The fate and the extent of coccolithophore calcification, which began ∼209 million years ago,11 may be jeopardised by the rapid changes in the local biogeochemistry associated with the current climate crisis. The sustainability of the marine carbonate cycle and CO2 fixation is presently at risk. Therefore, simple and accessible methodologies measuring the extent of coccolithophore calcification at the single entity level in different laboratory conditions are crucial to understanding the cellular response to various stressors.Current methods in accurately quantifying the PIC mass of individual coccoliths without knowledge of the species, including for example the coccolith shape factor,12 are not without limitations and are summarised elsewhere.13 Briefly, these methods are esoteric involving bespoke microscopy setups combined with either electrogenerated acid to ‘titrate’ away the calcium carbonate13 or utilising the birefringent optical properties of calcite to infer its thickness.14–17 While birefringence is limited to individual coccolith PIC quantification, recent advances in the opto-electrochemical acid ‘titration’ approach allow the CaCO3 content of entire living coccolithophores to be inferred at a cellular level.18 Sophisticated 3-D reconstruction of coccolithophores is feasible using X-ray tomography but this requires high-energy synchrotron light sources and cannot be accessed for routine measurements.19
In this work, we developed a straightforward light microscope method, simple in comparison to alternatives14–19 as reviewed elsewhere and discussed below,13 to measure the PIC content of individual heterococcoliths and living coccolithophores, comprising the interlocking coccosphere of coccoliths using a conventional optical microscope. We utilise the sparing solubility of CaCO3 in aqueous solutions (solubility constant of 3.3 × 10⁻⁹ M2 at 298 K)1 together with the observation of the dissolution of biogenic calcite particles to infer their PIC masses. The work first studies the dissolution of coccoliths in de-ionised (DI) water before the focus turns to living coccospheres.
Experimental section
Chemicals
Deionised Water (MilliQ ultrapure, resistivity 18.2 MΩ cm−1 at 298 K) was used to make up all solutions. Sodium chloride and other chemicals were purchased from Scientific Laboratory Supplies, UK, and used without further purification.Cultures
Cultures of Coccolithus pelagicus subsp. Braarudii (RCC1198) were supplied by the Roscoff Culture Collection (RCC), France. The cultures were maintained on a K/2 enriched growth medium modified from the recipe for K medium by Keller et al. with f/2 vitamins.20 Aquil synthetic ocean water was used instead of natural seawater.21 The final molarity of each of the medium components in the K/2 recipe is summarized elsewhere.13,18 Stock cultures of RCC 1198 underwent regular sub-culturing into fresh growth medium under sterile conditions during the exponential growth phase. The culture was kept under a 14![[thin space (1/6-em)]](https://www.rsc.org/images/entities/char_2009.gif) :
:![[thin space (1/6-em)]](https://www.rsc.org/images/entities/char_2009.gif) 10 hours light–dark cycle with a light intensity of 20–40 μmol quanta m−2 s−1 at 17 °C in a PHCbi MLR-352-PE Incubator (PHC Europe B.V.). Note that the two-fold range in light intensity received by the culture medium arises depending on where the sample is positioned relative to the light source within the incubator and the variation in the turbidity of the medium throughout the growth curve.
10 hours light–dark cycle with a light intensity of 20–40 μmol quanta m−2 s−1 at 17 °C in a PHCbi MLR-352-PE Incubator (PHC Europe B.V.). Note that the two-fold range in light intensity received by the culture medium arises depending on where the sample is positioned relative to the light source within the incubator and the variation in the turbidity of the medium throughout the growth curve.
Optical microscopy
Two optical microscopes were used to observe the coccoliths and coccospheres in this work. The still image of the C. braarudii coccolith shown in Fig. 1b was taken using a 40× objective lens (numerical aperture 0.7–1.3, Carl Zeiss, UK) and a Hamamatsu ORCA-flash 4.0 C13440 CMOS camera (Hamamatsu, Japan) on an upright microscope (Zeiss AXIO Examiner, Carl Zeiss, UK).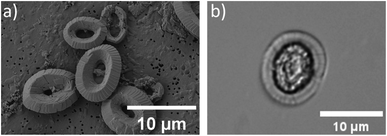 | ||
| Fig. 1 Images of C. braarudii coccoliths obtained via (a) scanning electron microscopy and (b) optical microscopy using a 40× objective lens under bright-field illumination. | ||
The biogenic calcite dissolution experiments were performed on openFrame.22 The openFrame microscope was supplied by Cairn Research Ltd, UK in 2020. A custom 3D printed ‘Petri dish’, an illustration of which is shown in Fig. 2a, was used as a supporting substrate for the biogenic CaCO3 samples. The 3D STL file of the custom ‘Petri dish’ can be found in the ESI Files† and downloaded online. Optical images were recorded using a 20× objective (Numerical Aperture = 0.5, Olympus, Japan) and a Hamamatsu ORCA-flash 4.0 C13440 CMOS camera (Hamamatsu, Japan) providing 16-bit, 4-megapixel images. The bright-field light source was provided by Aura Pro phase contrast illuminator (Cairn Research Ltd, UK). Fig. S7 in the ESI† shows the entire inverted microscope setup involving the openFrame, custom printed ‘Petri dish’, light source and the camera arrangement.
Scanning electron microscopy
The phytoplankton culture containing the coccoliths was filtered using a polycarbonate filter (0.01 μm), washed with deionized water, and subsequently dried at atmospheric pressure. Prior to the imaging, 10 nm of a gold thin-layer was coated over the sample using a rotary pumped coater (Q150RES, Quorum, UK). The Scanning Electron Microscopy (SEM) images were obtained using a Sigma 300 FEG-SEM from Zeiss with an accelerating voltage of 2.0 kV.Biogenic calcite dissolution: procedure & analysis
The 3D printed Petri dish was filled with aqueous solutions resulting in a solution depth of at least 1 cm. The C. braarudii culture sample, prewashed with CaCO3 saturated aqueous solution, was shaken before a 20 μL aliquot was dropcasted into the Petri dish (see Fig. 2 below). The pre-washing procedure minimises unwanted salt transferred from the culture medium into the aqueous solution. The biogenic calcite: coccoliths and coccospheres, were allowed to sediment onto the coverslip for 10–20 seconds before imaging. During this period, the ‘Petri dish’ was sealed with parafilm to limit evaporation induced convection over the timescale of the dissolution experiment. Optical acquisition of 10 seconds per frame then began until the biogenic calcite completely dissolved. The setting up took no more than 30–60 s from the immersion of the particles to the start of the recordings. A minor readjustment of optical focus was required during the video acquisition due to the long experimental timescale (1–2 hours). The images recorded were analysed with ImageJ freeware (Fiji distribution) to provide a measure of the particle projection area as a function of time. The 3D coccolith reconstruction method was described in previous work.13Results and discussion
In the following, the dissolution of detached C. braarudii coccoliths is first monitored in pure, deionised (DI) water. We aim to answer the following questions: (1) is it possible to infer the mass of individual coccoliths from a simple dissolution experiment? (2) Does biogenic calcite dissolve at the mass-transport limit as that seen with inorganic calcite?23,24 Then, the focus turns to study the auto-dissolution of living coccosphere in aqueous solutions.Dissolution of coccoliths in DI water: dissolution kinetics
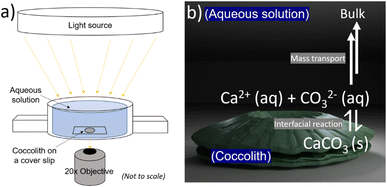
Fig. 1a and b show representative SEM and optical images of detached C. braarudii coccoliths. The dimensions of the coccoliths are of the micron scale with a coccolith length (major axis) measuring around 10 μm. As can be seen in the SEM image, the coccolith size found within a culture is not uniform resulting in a variation in the coccolith PIC mass from one coccolith to another.13 Therefore, a simple, non-esoteric and cheap approach allowing the PIC contents of individual biogenic calcite particulates to be obtained (coccolith and/or entire coccosphere) is desirable for routine monitoring.Fig. 2a is a schematic showing the experimental set-up involving a C. braarudii coccolith immersed in DI aqueous solution (with no added Ca2+, CO32− or other ions). Optical images of the coccolith were recorded under bright-field illumination as a function of time. At the coccolith–solution interface, illustrated in Fig. 2b, the following interfacial reaction takes place until equilibrium is established
| CaCO3(s) ⇌ Ca2+(aq) + CO2−3(aq) | (1) |
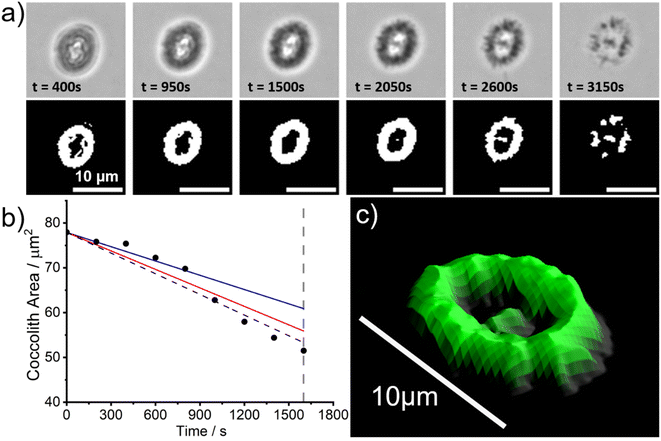
However, since the bulk solution is in overwhelmingly excess (∼20 mL) relative to the coccolith and the ions Ca2+(aq) and CO32−(aq) are absent, the biogenic calcite will dissolve to completion long before the aqueous solution is saturated with respect to CaCO3. Fig. 3a shows snapshots of a representative C. braarudii coccolith undergoing auto-dissolution in DI water. A timelapse video can be found in the online article (coccolith.avi). The top row of Fig. 3a shows raw images of the coccolith as a function of time following the initial immersion and the bottom row shows images after auto-thresholding. Interestingly, at t ≈ 3000 s the coccolith begins to disintegrate into many small units of calcite ‘blocks’25 which hints that the alternating crystalline unit of the coccolith may be held together by mechanical tension during nucleation and growth as opposed to some form of ‘natural glue’. Fig. 3b plots the projection area of the coccolith on the imaging plane as a function of time. Note that with the experimental setup used, the bright LED light source for bright-field illumination increases the temperature of the DI water bath by no more than 4 Kelvin from the initial temperature (293 ± 1 K) over the course of the experiment. The vertical dotted grey line indicates the timepoint at which the coccolith begins to fall apart and the projection area of the coccolith can no longer be accurately measured. A linear decrease of the projection area of the coccolith can be seen before the structural disintegration occurs and has a slope of −0.015 μm2 s−1. The solid lines overlaid in Fig. 3b are calculated for a hypothetical calcite cuboid when placed on a plate, with dimensions similar to the coccolith, dissolving in DI water at the mass-transport limit.26 The blue and red lines are calculated for 291 K and 298 K, respectively, using the temperature-sensitive calcite solubility constant and diffusion coefficients.23 Note that the calculation, detailed in ESI Section 1,† accounts for the calcite density of the coccolith by using the coccolith shape factor reported by Young et. al.12 The shape factor of C. pelagicus ranges from 0.04–0.07 and a recommended value of 0.06 was used herein which adds ∼±20% uncertainty to the above calculation. As can be seen, within the possible range of temperature fluctuations during the experiment, the accuracy of coccolith projection area measurement, and the approximation of the coccolith shape to that of a cuboid with equivalent dimensions, the experimentally obtained rate of dissolution of C. braarudii coccolith is in excellent agreement with that calculated for a similar sized hypothetical calcite cuboid. Therefore, we conclude that the dissolution rate of the coccolith in DI water occurs at the mass-transport limit and is indistinguishable from a cuboid of equivalently sized inorganic calcite. This result is suggestive that any organic or inorganic contaminants of coccolith calcite must be present at such trace levels that they have minimal impact on the calcite solubility, and is fully consistent with the reported reanalysis23 of the data reported by Hassenkam et al. obtained using atomic force microscopy.24
Dissolution of coccoliths in DI water: 3D volume reconstruction and PIC mass calculations
In the above, kinetic information of the coccolith auto-dissolution was obtained using a microscope. In this section, we aim to use kinetic data extracted via microscopy to infer the PIC mass of coccoliths on a single-entity basis. The analysis involves 3D reconstruction of the coccolith prior to dissolution using the time-stack of 2D optical images (Fig. 2a).13For the 3D coccolith reconstruction, we assume the rate of coccolith dissolution, or rate of shrinkage, as measured on the image plane (X, Y) is the same as that in the orthogonal direction (Z), corresponding to the coccolith height/thickness. First, the lateral coccolith shrinkage in its unilateral direction (m s−1) was obtained by finding the square root of its projection area ( ≈ length). The change in coccolith length as a function of time is obtained for each individual coccolith. The example shown in Fig. 3b has a shrinkage rate of 1.1 nm s−1. The unilateral rate of shrinkage, measured on a per coccolith basis, is then used in combination with the binary image of the coccolith (bottom row of Fig. 3a up until the time corresponded to complete dissolution). This reveals the heterogeneity of the coccolith in the X–Y direction as provided by the binary images and also the heterogeneity of the coccolith thickness (Z direction) at each of the X and Y coordinates. This allows the coccolith volume prior to the auto-dissolution to be reconstructed.13 A representative 3D image of the coccolith dissolved in DI water is shown in Fig. 3c, more of which can be found in the ESI in Fig. S2.† The volume of the coccolith shown in Fig. 3c is 92 ± 2 μm3 which equates to 250 ± 5 pg of calcite after upscaling with the density of calcite (ρCaCO3 = 2.71 g cm−3).
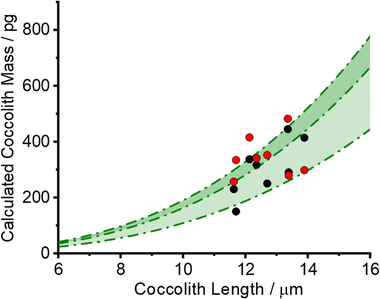
The black circles in Fig. 4 plot the PIC measurements of 8 individual C. braarudii coccoliths found using the 3D reconstruction method. The thickness of the reconstructed coccoliths were in the range of 1–2 μm, which is in excellent agreement with that measured via scanning electron microscopy (Fig. S1†). The green shade in Fig. 4 is the estimated coccolith PIC mass using a literature-reported shape factor (f) ranging from 0.04–0.07 for Coccolithus pelagicus; where the PIC mass was obtained by PIC mass = ρCaCO3fl3, and l is the coccolith length. The excellent agreement seen validates the coccolith PIC mass obtained via 3D reconstruction.
Confirmation of mass-transport control of coccolith auto-dissolution
We have established above that the auto-dissolution of coccolith in DI water occurs at the mass-transport limit. An alternative approach to validate this conclusion to that taken above is to take a hypothetical calcite cuboid with an equivalent dimension to the coccolith and calculated the maximum amount of CaCO3 that can diffuse away in the mass-transport limit over the experimental time seen to fully dissolve the coccolith. The steady-state mass-transport flux (JMT) to a cuboid on a plate has been reported26 | (2) |
 | (3) |
Eqn (3) was solved numerically using the measured projection area of the coccolith. The red circles overlaid in Fig. 4 are the CaCO3 mass calculated for hypothetical equivalent calcite cuboids if they were to dissolve at the mass-transport limited rate under the conditions as the coccoliths studied. Excellent agreement is seen with that obtained via 3D coccolith reconstruction (this work) and using the literature reported coccolith shape factor (Young et al.).12 This firmly confirms that the dissolution of coccolith in DI water occurs at the mass-transport limit. Next, we investigate the auto-dissolution of living C. braarudii coccolithophores.
Auto-dissolution of C. braarudii coccosphere
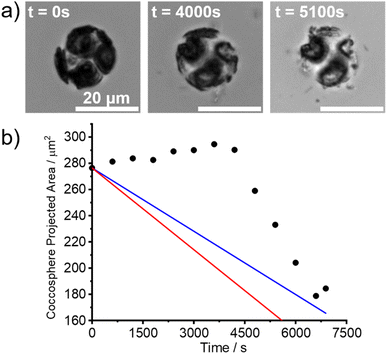
In the experiments reported in this section, living C. braarudii coccolithophores were immersed in aqueous solutions under similar conditions as the above-studied coccoliths. A SEM image of a C. braarudii coccolithophore is shown in Fig. S3.†Fig. 5a shows the images of a living C. braarudii coccolithophore undergoing auto-dissolution in DI water. ESI Videos† can be found online in the web version (Coccosphere_DIwater.avi). Fig. 5b plots the projection area of the coccosphere as a function of time after immersion in DI water. Interestingly, initially, the coccosphere was seen to increase in size until ca. t = 4000 s before particulate “shrapnel” appears from the coccosphere and diffuses outwards resulting in a rapid decrease in the coccosphere size. The increase in size is likely due to an increase in osmotic pressure resulting from the underlying biological cell changing from the artificial sea-water abruptly to a low-ionic strength aqueous solution (DI water). To validate this hypothesis, two coccolithophores were placed in a DI solution saturated with respect to CaCO3. A gradual increase in the coccosphere size, Fig. S4a,† can be seen 2 hours following immersion. After 18 hours of immersion, shown in Fig. S4b,† the projection area of two C. braarudii individuals was seen to increase by 33 and 45% which firmly evidences the expansion of coccolithophore size likely due to osmotic pressure. On a more ecologically relevant osmolarity range, small deviations of salinity of seawater have a negligible effect on the coccolithophore cell volume.27 However, in DI water and in the absence of Ca2+ and CO32+, unlike the detached coccoliths, the initial dissolution rate of the coccosphere before the appearance of shrapnel is unmeasurable due to the opposing size-changing effects, namely osmotic pressure and auto-dissolution of calcite.After an immersion time of ca. 4000 s in DI water, a rapid decrease in the coccosphere size was seen once fragments of coccosphere, assumed to be CaCO3, began to appear. The rate of decrease in its projection area occurred at a rate approximately twice as fast compared to the mass-transport limit of an equivalent hypothetical calcite sphere (ESI Section 1†). ESI Section 3† investigates the effect of ionic strength of the aqueous solution on the dissolution of living coccolithophores. As expected, with an increase in the ionic strength of the aqueous solution, the time required to completely dissolve the coccosphere decreased. This is because the solubility constant of calcite increases with ionic strength.1 A ESI Video† showing the dissolution of a representative coccolithophore in 0.7 M NaCl (aq) can be found in the online version of the manuscript (Coccosphere_0.7 M_NaCl.avi). Note that in the timelapse videos, the extent of the “shrapnel” spread is entirely consistent with that expected for Brownian motion of the particles as opposed to any ‘explosion’ which might be falsely inferred from the sped-up video. Interestingly, in 0.7 M NaCl (aq), at equivalent ionic strength to that of seawater, the size of the coccosphere remains constant for approximately 1000 s before a rapid decrease in coccosphere size was seen. This is likely due to the ionic strength of the interior of the cell/cytoplasm being similar to that of seawater so no drive for osmotic change. Moreover, Walker et al.28 reveals the presence of structured polysaccharide layers responsible for the rearrangement of the coccosphere which would otherwise not be present on individual detached coccoliths. In other words, C. braaudii coccosphere is not the sum of its constituent coccoliths but rather it is that plus a structured polysaccharide layer. Since the dissolution kinetics of living coccolithophores cannot be measured via the auto-dissolution approach, in either DI or high ionic strength solutions, we conclude that the dissolution of the coccolithophore is not the sum of its liths and inferring the PIC mass on living coccolithophores is beyond the limit of this technique.
It is noteworthy that, in our previous work, where electrochemically generated acid was used to infer the PIC mass of coccospheres; it requires only tens of seconds for the acid to dissolve the coccolithophore to completion.18 Due to the much shorter timescale of the acid titration reaction, calcite ‘shrapnel’ were not observed to diffuse out from the coccosphere.
Conclusions
In this work, the PIC mass of individual C. braarudii coccoliths was obtained by imaging their auto-dissolution in DI water. Excellent agreement with literature reported values was seen. The non-esoteric set-up and simple experimental procedures allow coccolith mass measurements to be easily and routinely performed at a single-entity level by the widest oceanographer community. Interestingly, the auto-dissolution of detached coccoliths in DI water occurs at the mass-transport limit which is indistinguishable from that of an equivalently sized inorganic calcite particulate. This likely suggests that the coccolith compositions in terms of trace metal impurities and occluded organics are insignificant to affect the rate of its undersaturated driven dissolution. Nevertheless in seawater the roles of the diversity of dissolved matter may become significant; it is thought for example that Mg2+ can inhibit calcite dissolution. Living coccolithophores, however, exhibit a different behaviour to a sum of its coccoliths likely due to the presence of structured polysaccharide layers responsible for the rearrangement of the coccosphere.Author contributions
Conceptualization: TMC, MY, CBM, RGC, experiment: TMC (lead), SB (culture), methodology: TMC, MY, CBM, software: MY, CBM, formal analysis: TMC, visualization: MY, CBM, supervision: RGC, writing—original draft: TMC, MY, writing—review & editing: CBM, SB, RGC, REMR, HAB.Conflicts of interest
There are no conflicts to declare.Acknowledgements
This work was carried out with the support of the Oxford Martin School Programme on Monitoring Ocean Ecosystems.References
- F. J. Millero, Chem. Rev., 2007, 107, 308–341 CrossRef CAS PubMed.
- J. D. Milliman, Global Biogeochem. Cycles, 1993, 7, 927–957 CrossRef CAS.
- K. M. Krumhardt, N. S. Lovenduski, M. C. Long, M. Levy, K. Lindsay, J. K. Moore and C. Nissen, J. Membr. Biol., 2019, 11, 1418–1437 Search PubMed.
- B. Rost and U. Riebesell, in Coccolithophores, Springer, 2004, pp. 99–125 Search PubMed.
- R. A. Armstrong, C. Lee, J. I. Hedges, S. Honjo and S. G. Wakeham, Deep Sea Res., Part II, 2001, 49, 219–236 CrossRef.
- C. Klaas and D. E. Archer, Global Biogeochem. Cycles, 2002, 16, 63 CrossRef.
- D. A. Hutchins, Nature, 2011, 476, 41–42 CrossRef CAS PubMed.
- B. D'Amario, C. Pérez, M. Grelaud, P. Pitta, E. Krasakopoulou and P. Ziveri, Sci. Rep., 2020, 10, 1–14 CrossRef PubMed.
- A. Oviedo, P. Ziveri and F. Gazeau, Estuarine, Coastal Shelf Sci., 2017, 186, 58–71 CrossRef CAS.
- G. Langer, M. Geisen, K. H. Baumann, J. Kläs, U. Riebesell, S. Thoms and J. R. Young, Geochem., Geophys., Geosyst., 2006, 7 Search PubMed.
- P. R. Bown, J. A. Lees and J. R. Young, in Coccolithophores, Springer, 2004, pp. 481–508 Search PubMed.
- J. R. Young and P. Ziveri, Deep Sea Res., Part II, 2000, 47, 1679–1700 CrossRef.
- M. Yang, C. Batchelor-McAuley, S. Barton, R. E. Rickaby, H. A. Bouman and R. G. Compton, Angew. Chem., 2021, 133, 21167–21174 CrossRef.
- M.-Á. Fuertes, J.-A. Flores and F. J. Sierro, Mar. Micropaleontol., 2014, 113, 44–55 CrossRef.
- L. Beaufort, N. Barbarin and Y. Gally, Nat. Protoc., 2014, 9, 633–642 CrossRef CAS PubMed.
- L. Beaufort, Micropaleontology, 2005, 51, 289–297 CrossRef.
- J. Bollmann, Biogeosciences, 2014, 11, 1899–1910 CrossRef.
- M. Yang, C. Batchelor-McAuley, S. Barton, R. E. Rickaby, H. A. Bouman and R. G. Compton, Environ. Sci.:. Adv., 2022, 1, 156–163 Search PubMed.
- T. Beuvier, I. Probert, L. Beaufort, B. Suchéras-Marx, Y. Chushkin, F. Zontone and A. Gibaud, Nat. Commun., 2019, 10, 1–8 CrossRef PubMed.
- M. D. Keller, R. C. Selvin, W. Claus and R. R. Guillard, J. Phycol., 1987, 23, 633–638 CrossRef.
- F. M. Morel, J. Rueter, D. M. Anderson and R. Guillard, J. Phycol., 1979, 15, 135–141 CrossRef CAS.
- OpenFrame: an open source approach to fluorescence microscopy, https://www.imperial.ac.uk/photonics/research/biophotonics/instruments–software/fluorescence-microscopy/openframe/.
- X. Fan, C. Batchelor-McAuley, M. Yang and R. G. Compton, ACS Meas. Sci. Au, 2022, 2(5), 422–429 CrossRef CAS PubMed.
- T. Hassenkam, A. Johnsson, K. Bechgaard and S. Stipp, Proc. Natl. Acad. Sci. U. S. A., 2011, 108, 8571–8576 CrossRef CAS PubMed.
- J. R. Young, S. A. Davis, P. R. Bown and S. Mann, J. Struct. Biol., 1999, 126, 195–215 CrossRef CAS PubMed.
- R. Wong, C. Batchelor-McAuley, M. Yang and R. G. Compton, J. Electroanal. Chem., 2021, 903, 115818 CrossRef CAS.
- C. S. Sikes and K. M. Wilbur, Limnol. Oceanogr., 1982, 27, 18–26 CrossRef CAS.
- C. E. Walker, A. R. Taylor, G. Langer, G. M. Durak, S. Heath, I. Probert, T. Tyrrell, C. Brownlee and G. L. Wheeler, New Phytol., 2018, 220, 147–162 CrossRef CAS PubMed.
Footnote |
| † Electronic supplementary information (ESI) available. See DOI: https://doi.org/10.1039/d2va00252c |
| This journal is © The Royal Society of Chemistry 2023 |

