
 Open Access Article
 This Open Access Article is licensed under a
 Creative Commons Attribution 3.0 Unported Licence
What do we know about the production and release of persistent organic pollutants in the global environment?†
Li
Li
 *a,
Chengkang
Chen
b,
Dingsheng
Li
a,
Knut
Breivik
cd,
Golnoush
Abbasi
c and
Yi-Fan
Li
ef
*a,
Chengkang
Chen
b,
Dingsheng
Li
a,
Knut
Breivik
cd,
Golnoush
Abbasi
c and
Yi-Fan
Li
ef
aSchool of Public Health, University of Nevada, Reno, 1664 N. Virginia Street, Reno, Nevada 89557-0274, USA. E-mail: lili@unr.edu; Tel: +1-775-682-7077
bCollege of Environmental Sciences and Engineering, Peking University, Beijing 100871, China
cNILU-Norwegian Institute for Air Research, P. O. Box 100, Kjeller NO-2027, Norway
dDepartment of Chemistry, University of Oslo, P. O. Box 1033, Oslo NO-0315, Norway
eInternational Joint Research Center for Persistent Toxic Substances (IJRC-PTS), State Key Laboratory of Urban Water Resource and Environment, School of Environment, Harbin Institute of Technology, Harbin 150090, China
fIJRC-PTS-NA, Toronto, Ontario M2N 6X9, Canada
First published on 26th October 2022
Abstract
Information on the global production and environmental releases of persistent organic pollutants (POPs) is of critical importance for regulating and eliminating these chemical substances of worldwide environmental and health concerns. Here, we conduct an extensive literature review to collect and curate quantitative information on the historical global production and multimedia environmental releases of 25 intentionally produced POPs. Our assembled data indicate that as of 2020, a cumulative total of 31![[thin space (1/6-em)]](https://www.rsc.org/images/entities/char_2009.gif) 306 kilotonnes (kt) of the 25 POPs had been synthesized and commercialized worldwide, resulting in cumulative releases of 20348 kt into the global environment. As of 2020, short-chain chlorinated paraffins were the most produced POP, with a historical global cumulative tonnage amounting to 8795 kt, whereas α-hexachlorocyclohexane (HCH) had the largest historical global cumulative environmental releases of 6567 kt among these 25 POPs. The 1970s witnessed the peak in the annual global production of the 25 investigated POPs. The United States and Europe used to be the hotspots of environmental releases of the 25 investigated POPs, notably in the 1960s and 1970s. By contrast, global environmental releases occurred primarily in China in the 2000s–2010s. Preliminary efforts are also made to integrate the production volume information with “hazard” attributes (persistence, bioaccumulation, toxicity, and long-range transport potential) in the evaluation of potential environmental impacts of the 25 POPs. The results show that dichlorodiphenyltrichloroethane (DDT) and polychlorinated biphenyls (PCBs) are potentially associated with higher environmental impacts than other POPs because they are among the top rankings in both the global cumulative production and hazard indicators. This work for the first time reveals the astonishing magnitudes of POP production and environmental releases in contemporary human history. It also underscores the importance of tonnage information in assessments of POPs, POP candidates, and other chemicals of emerging concern.
306 kilotonnes (kt) of the 25 POPs had been synthesized and commercialized worldwide, resulting in cumulative releases of 20348 kt into the global environment. As of 2020, short-chain chlorinated paraffins were the most produced POP, with a historical global cumulative tonnage amounting to 8795 kt, whereas α-hexachlorocyclohexane (HCH) had the largest historical global cumulative environmental releases of 6567 kt among these 25 POPs. The 1970s witnessed the peak in the annual global production of the 25 investigated POPs. The United States and Europe used to be the hotspots of environmental releases of the 25 investigated POPs, notably in the 1960s and 1970s. By contrast, global environmental releases occurred primarily in China in the 2000s–2010s. Preliminary efforts are also made to integrate the production volume information with “hazard” attributes (persistence, bioaccumulation, toxicity, and long-range transport potential) in the evaluation of potential environmental impacts of the 25 POPs. The results show that dichlorodiphenyltrichloroethane (DDT) and polychlorinated biphenyls (PCBs) are potentially associated with higher environmental impacts than other POPs because they are among the top rankings in both the global cumulative production and hazard indicators. This work for the first time reveals the astonishing magnitudes of POP production and environmental releases in contemporary human history. It also underscores the importance of tonnage information in assessments of POPs, POP candidates, and other chemicals of emerging concern.
Environmental significanceHumans have manufactured and commercialized tens of millions of tonnes of persistent organic pollutants (POPs) for various agricultural, industrial, and consumer applications. However, these substances have been revealed to be persistent, bioaccumulative, toxic, and ubiquitous in the global environment. This comprehensive review reveals the astonishing magnitude of global historical production and environmental releases of POPs. It also depicts the temporal and geographic distributions of the environmental releases of POPs. In addition, an analysis of the potential environmental impacts of these POPs pinpoints the critical role of such information on production and environmental releases in assessing POPs, POP candidates, and other chemicals of emerging concern. |
1. Introduction
Persistent organic pollutants (POPs) exert tremendous risks to ecosystems and humankind because of their resistance to biotic and abiotic degradation (persistent or “P”), enrichment in organisms along the food chain (bioaccumulative or “B”), adverse ecological and human health effects (toxic or “T”), and potential for long-range environmental transport to reach remote regions such as the Arctic (long-range transport potential or “LRTP”).1 While natural processes and unintentional formation can contribute to the occurrence of some of these substances, most of them are intentionally manufactured and commercialized for desired industrial, consumer, and agricultural functions (for a list of these intentionally produced POPs and their short names, see Table 1). To date, these substances have been subject to regional regulation by the 1998 Aarhus Protocol under the Geneva Convention on Long-Range Transboundary Air Pollution (CLRTAP), as well as broader international restrictions and elimination by the 2001 Stockholm Convention. Prior to international regulations, these notorious substances had already been produced, used, and released worldwide for more than half a century. Notably, the historical cumulative production of several POPs, such as PCBs,2 HCHs,3 and SCCPs,4 have amounted to millions of tonnes.| Name | Abbreviation or short name | Category | Listing year |
|---|---|---|---|
| Aldrin | Aldrin | Pesticide | 2001 |
| Chlordane | Chlordane | Pesticide | 2009 |
| Chlordecone | Chlordecone | Pesticide | 2001 |
| Commercial decabromodiphenyl ether | C-decaBDE | Industrial | 2017 |
| Commercial octabromodiphenyl ether | C-octaBDE | Industrial | 2009 |
| Commercial pentabromodiphenyl ether | C-pentaBDE | Industrial | 2009 |
| Dichlorodiphenyltrichloroethane | DDT | Pesticide | 2001 |
| Dicofol | Dicofol | Pesticide | 2019 |
| Dieldrin | Dieldrin | Pesticide | 2001 |
| Endrin | Endrin | Pesticide | 2001 |
| Heptachlor | Heptachlor | Pesticide | 2001 |
| Hexabromobiphenyl | HBB | Pesticide | 2009 |
| Hexabromocyclododecane | HBCDD | Industrial | 2013 |
| Hexachlorobenzene | HCB | Pesticide | 2001 |
| Mirex | Mirex | Pesticide | 2001 |
| Pentachlorophenol and its salts and esters | PCPs | Pesticide | 2015 |
| Perfluorooctane sulfonic acid, its salts and perfluorooctane sulfonyl fluoride | PFOS | Industrial | 2009 |
| Perfluorooctanoic acid, its salts and related compounds | PFOA | Industrial | 2019 |
| Polychlorinated biphenyls | PCBs | Industrial | 2001 |
| Short-chain chlorinated paraffins | SCCPs | Industrial | 2017 |
| Technical endosulfan and its related isomers |
Endosulfan | Pesticide | 2011 |
| Toxaphene | Toxaphene | Pesticide | 2001 |
| α-Hexachlorocyclohexane | α-HCH | Pesticide | 2009 |
| β-Hexachlorocyclohexane | β-HCH | Pesticide | 2009 |
| γ-Hexachlorocyclohexane | γ-HCH | Pesticide | 2009 |
Pioneering efforts have been devoted to inventorying the production, use, and environmental releases of POPs on global, regional, and national scales for different time periods.5–7 These inventories are essential for understanding the existing global burden of POPs and the planetary boundary for chemical pollution.8,9 They also serve as a quantitative basis for chemical management strategies. In addition, these inventories provide fundamental information for understanding the monitored temporal trends and spatial distribution of POP contamination, and for evaluating the effectiveness of international and regional regulatory measures.7,10–13 Furthermore, such information enables environmental modelers to simulate POP flows within the human socioeconomic system,14,15 the physical environment,16–20 and biota including humans,21–23 whereby a mechanistic, integrative understanding of the production-to-exposure continuum for these substances can be established.
Although inventories have become available individually for several POPs, what remains unclear is a holistic overview depicting the global long-term production and environmental releases of all intentionally produced POPs. Several questions remain unanswered: how much POPs have ever been synthesized and released into the global environment? What are the spatial and temporal distribution patterns of these global environmental releases? Which substance(s) have contributed most to the global production and environmental releases of POPs? Which substance(s) are likely to have posed the greatest impacts on the global environment? Therefore, if analogizing individual POPs to discrete “trees”, we are now at a time of urgent need for quantitative information about the entire “forest”, that is, the totality of POPs, to address the above questions adequately and meaningfully.
To this end, we assemble literature-reported estimates of the historical global production and multimedia environmental releases of 25 intentionally produced POPs subject to elimination and/or restriction (listed in annexes A and B) by the Stockholm Convention. Special attention is given to environmental releases occurring in three major producing and releasing regions, namely, the United States, Europe (including the Soviet Union before 1992), and mainland China. Out of our scope are (i) unintentionally formed POPs, such as polychlorinated dibenzo-p-dioxins, polychlorinated dibenzofurans, and hexachlorobutadiene, and (ii) the unintentionally formed portions of PCBs, polychlorinated naphthalenes, HCB, and pentachlorobenzene from various processes, including combustion. This review is furthermore focused on the “primary” releases of these POPs from anthropogenic sources and excludes “secondary” re-emission of POPs from environmental reservoirs such as soils, sediments, and glaciers.5
2. Method
2.1 Collection, evaluation, and curation of production and environmental release data
We conducted an extensive literature review to collect and curate statistical data, expert estimates, and model predictions of historical global production and environmental releases of 25 intentionally produced POPs. ESI Text S1† details the compilation and evaluation of the available data. The highest priority was given to data in peer-reviewed scientific articles that synthesize, evaluate, and reconcile long-term information sourced from various datasets with global coverage, such as inventories for organochlorine pesticides,3,24–31 PCBs,2,14 PBDEs,32 HBCDD,33 PFOS,34 PFOA,35 and SCCPs.4 This is because these inventories are considered to meet the gold standards for quality assurance and quality control in the chemical inventory development: they are transparent (with full documentation of methodologies, data, procedures, results, and associated uncertainties), complete (with comprehensive coverage of emission sources throughout the life cycle), consistent (that is, not a patchwork of national or regional estimates derived using different methodologies), accurate (with thorough evaluation or verification against environmental monitoring data), and with spatial and temporal resolutions. When data were not available from these studies, we took information from the International Programme on Chemical Safety's Environmental Health Criteria monograph series, the International Agency for Research on Cancer's Evaluation of Carcinogenic Risks to Humans monograph series, the chemical background documents prepared for the Convention for the Protection of the Marine Environment of the North-East Atlantic (the OSPAR Convention), and the chemical risk profile documents prepared for the Stockholm Convention's POPs Review Committee. Data presented in other peer-reviewed scientific articles, technical reports, books, and industrial studies were additionally used to complement the above data sources.Data on production and environmental releases collected in this work are on a basis of technical/commercial grades, given that the Stockholm Convention regulates technical/commercial products. However, since the Stockholm Convention lists three HCH isomers (α-, β-, and γ-HCHs) rather than technical/commercial products, we further broke down the collected data for technical HCH and technical lindane on an isomer basis. We excluded the production and releases of trace POPs as unreacted raw materials or unintentionally formed impurities in the production of other chemical substances, such as the DDT impurities in technical dicofol36 and HCB impurities in pesticides.37
We focused on the estimates of annual average production and annual average environmental releases of POPs for every decade from the 1930s to the 2010s. When estimates were available for multiple years in a decade, they were averaged into annual estimates representative of the typical level over the entire decade. However, when only a single data point was available for a decade or a certain year in a decade, it was assumed to represent the annual average over the entire decade. According to our analysis of POPs with available year-specific time-series data (e.g., PCBs,2 HBCDD,33 toxaphene,29 endosulfan,29 and DDT29), the interannual fluctuation in production or environmental releases within a decade has never exceeded a factor of 3. Since such 3× interannual fluctuation is less than the uncertainty (a factor of ∼10) inherent in the estimation of production or environmental releases (see Section 3.2 for detailed information), we believe that the representation of a decade using a single data point leads to an acceptable level of uncertainty in estimates.
A data point was directly taken if it was reported as a point estimate or a crisp value in the literature. When a data point was reported as a range or interval in the literature, we calculated the “central-tendency estimate”: we used the arithmetic mean of upper and lower bounds (or the 97.5th and 2.5th percentiles in the cases where the maximum and minimum were not reported) if they were at the same order of magnitude; otherwise, we used the geometric mean if the upper and lower bounds differed by an order of magnitude or more. Furthermore, when the upper and lower bounds (or the 97.5th and 2.5th percentiles) of an estimate of the global cumulative production or environmental release were available, we calculated their ratios, termed “uncertainty range factor (URF)”, to characterize the overall range of uncertainty associated with this estimate. A larger URF indicates a wider range where the most plausible value of an estimate is expected to fall.
Given data restrictions, we made the following general assumptions. First, we assumed the annually produced chemicals to entirely enter the use phase. In other words, the unused, unsold, or stockpiled portion was assumed to be minor compared to the amounts produced and used. Second, for pesticides, we assumed the produced tonnage to be equal to the quantity released into the multimedia ambient environment, including volatilization into air, residuals in surface compartments, and residuals in crop foliage. Note that this assumption differs from practices in several earlier studies,38–40 where environmental releases were restricted to volatilization to the atmosphere alone because (i) releases to such a “mobile” environmental medium were more relevant to modeling the global transport and fate of POPs, (ii) the efforts of estimating environmental releases were previously driven by the CLRTAP with a clear focus on atmospheric releases, and (iii) it was more difficult to estimate releases of POPs to media other than the atmosphere. For POPs embedded in industrial and consumer products, we considered environmental releases throughout industrial processes, the use phase, and waste disposal, which may take place within a timeframe over decades. In this work, we only compiled and reported estimates of environmental releases before 2020. Third, for early decades when information on production or environmental releases was unavailable, we conservatively assumed that the decade-average annual production or environmental releases were 10% of the maximum decade-average annual levels available from the literature. This assumption was made based on the available time-series data of PCBs2 and DDT.29
2.2 Evaluation of the hazard attributes of POPs
To compare the potential environmental impacts of the investigated POPs, we evaluated their B, T, P, and LRTP attributes that together characterize the “hazard” of chemicals. Specifically, we characterized B and T by retrieving fish bioconcentration data and human toxicity data, respectively, from publicly available databases or computational models. We characterized P and LRTP using a steady-state fate and transport model named POV and LRTP Screening Tool (“The Tool”)41 endorsed by the Organisation for Economic Co-operation and Development (OECD).We evaluated B using a fish bioconcentration factor (BCF; in L kg−1), defined as the ratio of the wet-weight-based chemical concentration in the fish body to the total chemical concentration in water with an assumption that the chemical is not part of the diet of the fish. A higher BCF represents a higher bioaccumulation potential. We gave the highest priority to high-quality experimentally measured data, such as those subject to systematic expert evaluations for use as the training set for computational models, as well as those documented in the U.S. Environmental Protection Agency's ECOTOXicology knowledgebase. When experimentally measured data were unavailable, we computed BCFs using an in silico model named OPEn-QSAR-App (OPERA)42 (see the footnote of Table 1). The OPERA's BCF module has been demonstrated to be statistically satisfactory for regulatory assessments, with a root-mean-square deviation (RMSE) of 0.53log10 units and a coefficient of determination (R2) of 0.85 for goodness-of-fit, a RMSE of 0.55log10 units and a R2 (also known as Q2) of 0.84 for robustness, and a RMSE of 0.64log10 units and a R2 = 0.83 for predictivity.43
The T was evaluated using a human toxicological threshold, which is either a reference dose (RfD) or a minimal risk level (MRL), given that they are conceptually and methodologically similar. This threshold, derived from the data of the most sensitive health effect endpoint, describes the minimum daily intake dose (in ng kg−1 d−1) leading to observable adverse human non-cancer systemic toxicity. By its definition, a lower human toxicological threshold indicates higher toxicity, and daily intake doses less than the human toxicological threshold are not likely to be associated with adverse health risks. We gathered RfD data from the U.S. Environmental Protection Agency's Integrated Risk Information System, provisional chronic RfD data from the U.S. Provisional Peer-Reviewed Toxicity Value (PPRTV) database, and MRL data from the U.S. Agency for Toxic Substances and Disease Registry (ATSDR). Preference was given to the RfD, and then PPRTVs, if a specific toxicity value was available from more than one source, following the hierarchy of human health toxicity values recommended by the U.S. Environmental Protection Agency for risk assessments.44 The lowest RfD or an equivalent value was selected regardless of specific health effect endpoints. When a chemical was absent from the above sources, we calculated the RfD using an in silico model named Conditional Toxicity Value (CTV) predictor45 if the structural information is available, or otherwise, based on the literature-reported no-observed-adverse-effect-level (NOAEL) information in compliance with the methodologies and practices for the derivation of RfD using conservative uncertainty factors.46 The CTV predictor model has been demonstrated to be statistically acceptable for regulatory assessments, with a RMSE of 0.77log10 units and a Q2 of 0.41 for robustness, and a RMSE of 0.96log10 units for predictivity.45
The Tool evaluates P using a POP's average residence time in the global multimedia environment (29% land and 71% ocean water), referred to as the global overall persistence (POV in days). The POV combines a chemical's reaction half-lives in individual environmental compartments (air, land soil, and ocean water, as considered by The Tool41) and the steady-state mass distribution among these environmental compartments. The Tool calculates three sets of POV values assuming POPs to be released entirely into air, land soil, and ocean water, respectively, and it selects the maximum as the final estimate.41
LRTP was evaluated using a new LRTP metric named ϕ3, which estimates the fraction of a POP that accumulates in the soil and water compartments of the “remote” region as a consequence of dispersion, and transfers via air and water.47 A high ϕ3 indicates a strong LRTP. The ϕ3 metric was implemented in The Tool's code. Following the existing approach in The Tool, ϕ3 was calculated for the three default emission scenarios (100% to air, 100% to soil, and 100% to water, respectively), and the maximum was selected as the final estimate.
The Tool requires molar mass, air–water and octanol–water partition ratios (logKAW and logKOW), and reaction half-lives in air, soil, and water as model input.41 These data were collected following the recommended best practice by Li et al.48 Specifically, we collected the thermodynamically consistent experimental values of partition ratios from the literature;48 experimental values from single measurements were used only if the thermodynamically consistent experimental values were unavailable. For the dissociable PCPs, PFOS, and PFOA, we convert the partition ratios of their neutral forms into the corresponding distribution ratios at a pH of 8.1, i.e., the global mean seawater pH, to account for the partitioning of both neutral and charged species.48 For POPs other than PFOS and PFOA, we modeled the microbial biodegradation half-lives49 and extrapolated the modeled half-lives to those in soil and water using recommended empirical ratios.50 For PFOS and PFOA, which are not subject to biodegradation, we used the half-lives recommended by ref. 51 for perfluoroalkyl carboxylates. We also used an in silico model to compute the rate constant for an atmospheric reaction with the hydroxyl radical and converted it to the half-life in air. For details about the data processing and values used for modeling, please see ESI Table S1.† Numeric results of B, T, P, and LRTP of the 25 investigated POPs are tabulated in ESI Table S2.†
3. Results and discussion
3.1 Historical global production of POPs
Fig. 1 displays the estimated annual global production of the 25 investigated POPs between the 1930s and 2010s. Overall, a total of 31306 kilotonnes (kt) of the 25 investigated POPs have been synthesized and commercialized worldwide in history. For comparison, this number is five times the weight of the Great Pyramid of Giza (5750 kt), ∼600 times the weight of the Titanic (50 kt), and ∼3000 times the weight of the Eiffel Tower (10 kt). Notably, the global cumulative production was greater than 1000 kt for eight POPs and greater than 100 kt for 9 other POPs.
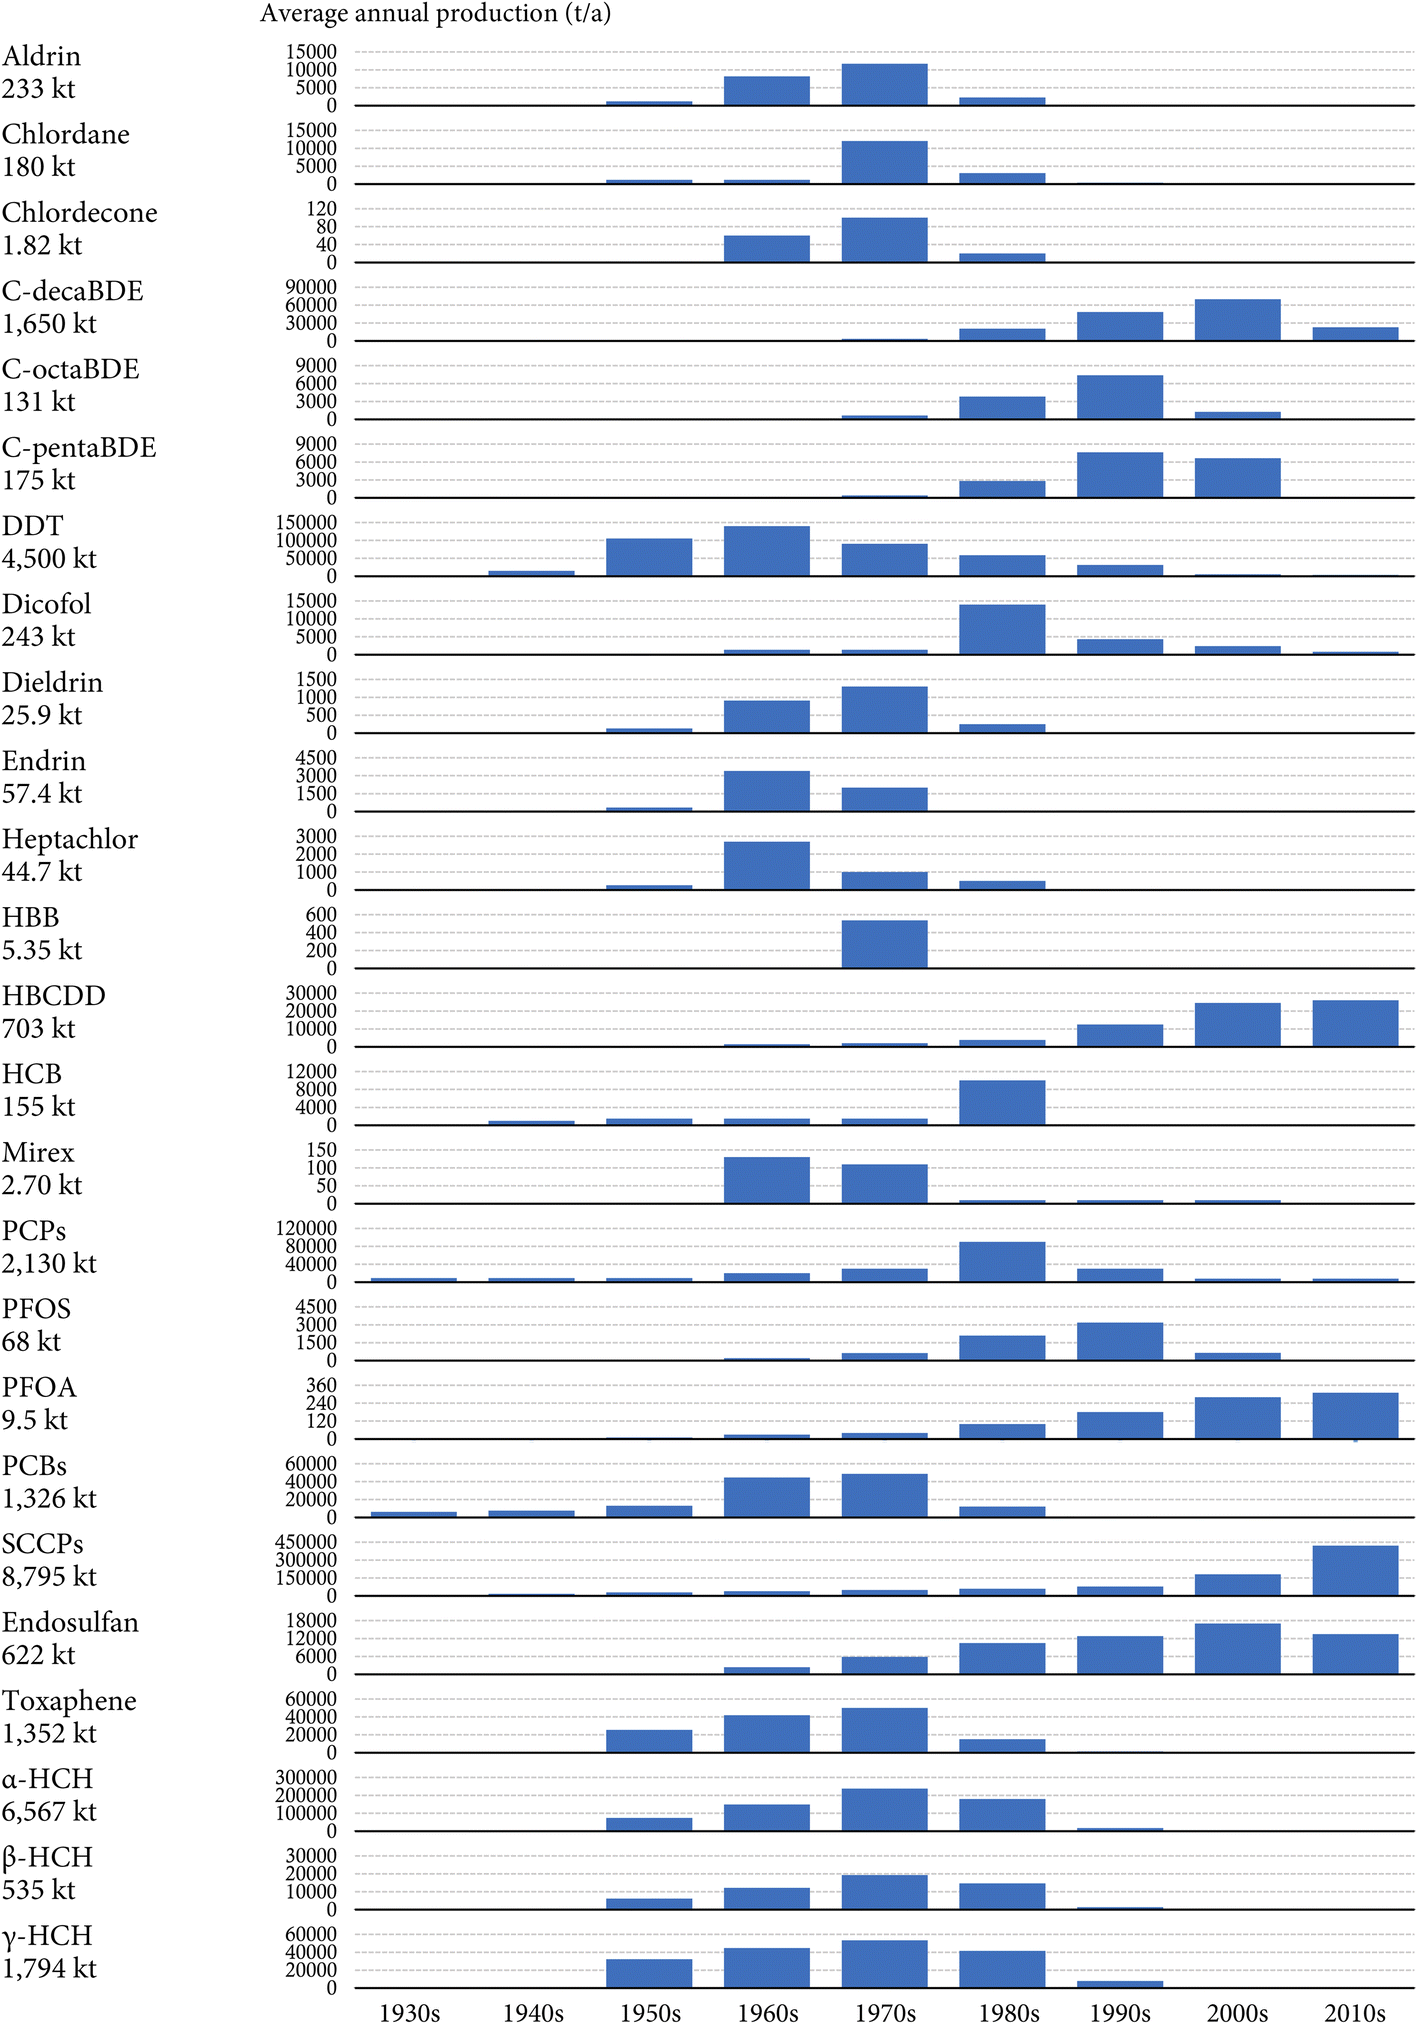 | ||
| Fig. 1 Average annual global productions of the 25 intentionally produced persistent organic pollutants from the 1930s to the 2010s. Numbers under the chemical names on the left indicate the central-tendency estimate of the global cumulative production in kilotonnes (kt). | ||
The global cumulative productions of individual POPs vary by four orders of magnitude. Historically, SCCPs are the most produced POP, with the global cumulative production amounting to 8795 kt (the central-tendency estimate, the same hereafter), followed by α-HCH (6567 kt), DDT (4500 kt), and PCPs (2130 kt) (Fig. 1). In particular, the global cumulative productions of α-, β-, and γ-HCH sum to 8896 kt. Although these three isomers are listed as separate POPs under the Stockholm Convention, α- and β-HCHs appear mainly as isomeric byproducts in technical HCH and technical lindane products, where γ-HCH is the desired insecticidal isomer.30 From a temporal perspective, while the production of HCHs and PCPs ceased decades ago, the production and new use of SCCPs are ongoing in several countries such as China because the Stockholm Convention did not include SCCPs until 2017.4 The Stockholm Convention also allows the production of DDT for the purposes of disease vector control.52 Therefore, the global cumulative productions of SCCPs and DDT are expected to further increase. Several POPs have been produced in relatively limited amounts, including HBB (5.35 kt), mirex (2.70 kt), and chlordecone (1.82 kt) (Fig. 1). The intentional production of these chemicals ceased decades ago.
The production of PCPs, PCBs, and SCCPs started in the 1930s, whereas PBDEs were not commercialized worldwide until the 1970s (Fig. 1). Fig. 1 also shows that the 1970s witnessed the simultaneous production of all POPs, with an average annual global volume amounting to 627 kt. This number declined to 496 kt in the 2010s, accounting for 1.7% of the annual global output of 30000 kt of manufactured chemicals (that is, synthetic chemicals for industrial, consumer, and agricultural uses, excluding bulk chemicals, fertilizers, petrochemicals, fuels, and materials) based on a conservative estimate for the year 2010.53 Most POPs were most heavily produced in the 1970s or 1980s. Exceptions include POPs more recently listed by the Stockholm Convention, such as c-pentaBDE, c-octaBDE, c-decaBDE, PFOS, and endosulfan, whose annual global production peaked in the 1990s or the early 2000s, as well as HBCDD, SCCPs, and PFOA, whose annual global production kept increasing until the 2010s (Fig. 1).
Before the 1980s, the bulk of the produced POPs was pesticides, primarily DDT, HCHs (the sum of α-, β-, and γ-HCHs), and PCPs, contributing to more than half of the total global tonnage each year (Fig. 1). Our data show that DDT constituted 35% and 27% of the annual global production of POPs in the 1950s and 1960s, respectively, and HCHs made up 40% and 50% of the annual global production of POPs in the 1960s and 1970s. However, the global production of these pesticides started to decline in the 1980s in response to increasing concerns about negative impacts on environmental and human health. Correspondingly, industrial chemicals, mostly SCCPs and c-decaBDE, have dominated the annual global production of POPs since the 1990s (Fig. 1). Notably, our collected data show that SCCPs accounted for 30%, 57%, and 85% of the annual global production of POPs in the 1990s, 2000s, and 2010s, respectively.
Such a transition in the dominant functional category from pesticides to industrial chemicals adds complexity to the environmental and health concerns over POPs. Unlike pesticides, industrial chemicals can be released into the environment throughout the manufacturing, use, lifespan, and disposal of neat chemicals, formulations, and waste.15 In addition, many industrial chemicals are used substantially in various indoor settings, where the environmental releases are largely “passive”, i.e., through slow, diffusive volatilization processes from materials of products embedding these chemicals. Moreover, humans can accumulate these chemicals not only through diet, i.e., due to the contamination of livestock, seafood, and plants in agricultural or natural ecosystems that are spatially distant from the general population (“far-field” pathways), but also through direct indoor exposure pathways such as inhalation, dermal absorption, and mouthing-mediated ingestion from occupational and residential environments (“near-field” pathways).54,55 The near-field pathways may even be more relevant than far-field pathways in certain cases.55,56 Exposure through near-field pathways is also strongly associated with the health of certain vulnerable subpopulations such as children.57 These unique features of industrial chemicals call for a different set of chemical management strategies under international and regional chemical regulation frameworks such as the Stockholm Convention.
3.2 Historical environmental releases of POPs
Fig. 2 displays the estimated annual global environmental releases of the 25 investigated POPs between the 1930s and 2020s. A cumulative total of 20348 kt of the 25 investigated POPs has historically been released into the global environment by 2020, accounting for 65% of the historical cumulative production. The cumulative global environmental releases are dominated by pesticides (∼90%), especially HCHs (8896 kt), DDT (4500 kt), and PCPs (2130 kt). The dominance of pesticides is primarily because they are produced for applications in agricultural or ambient environments.
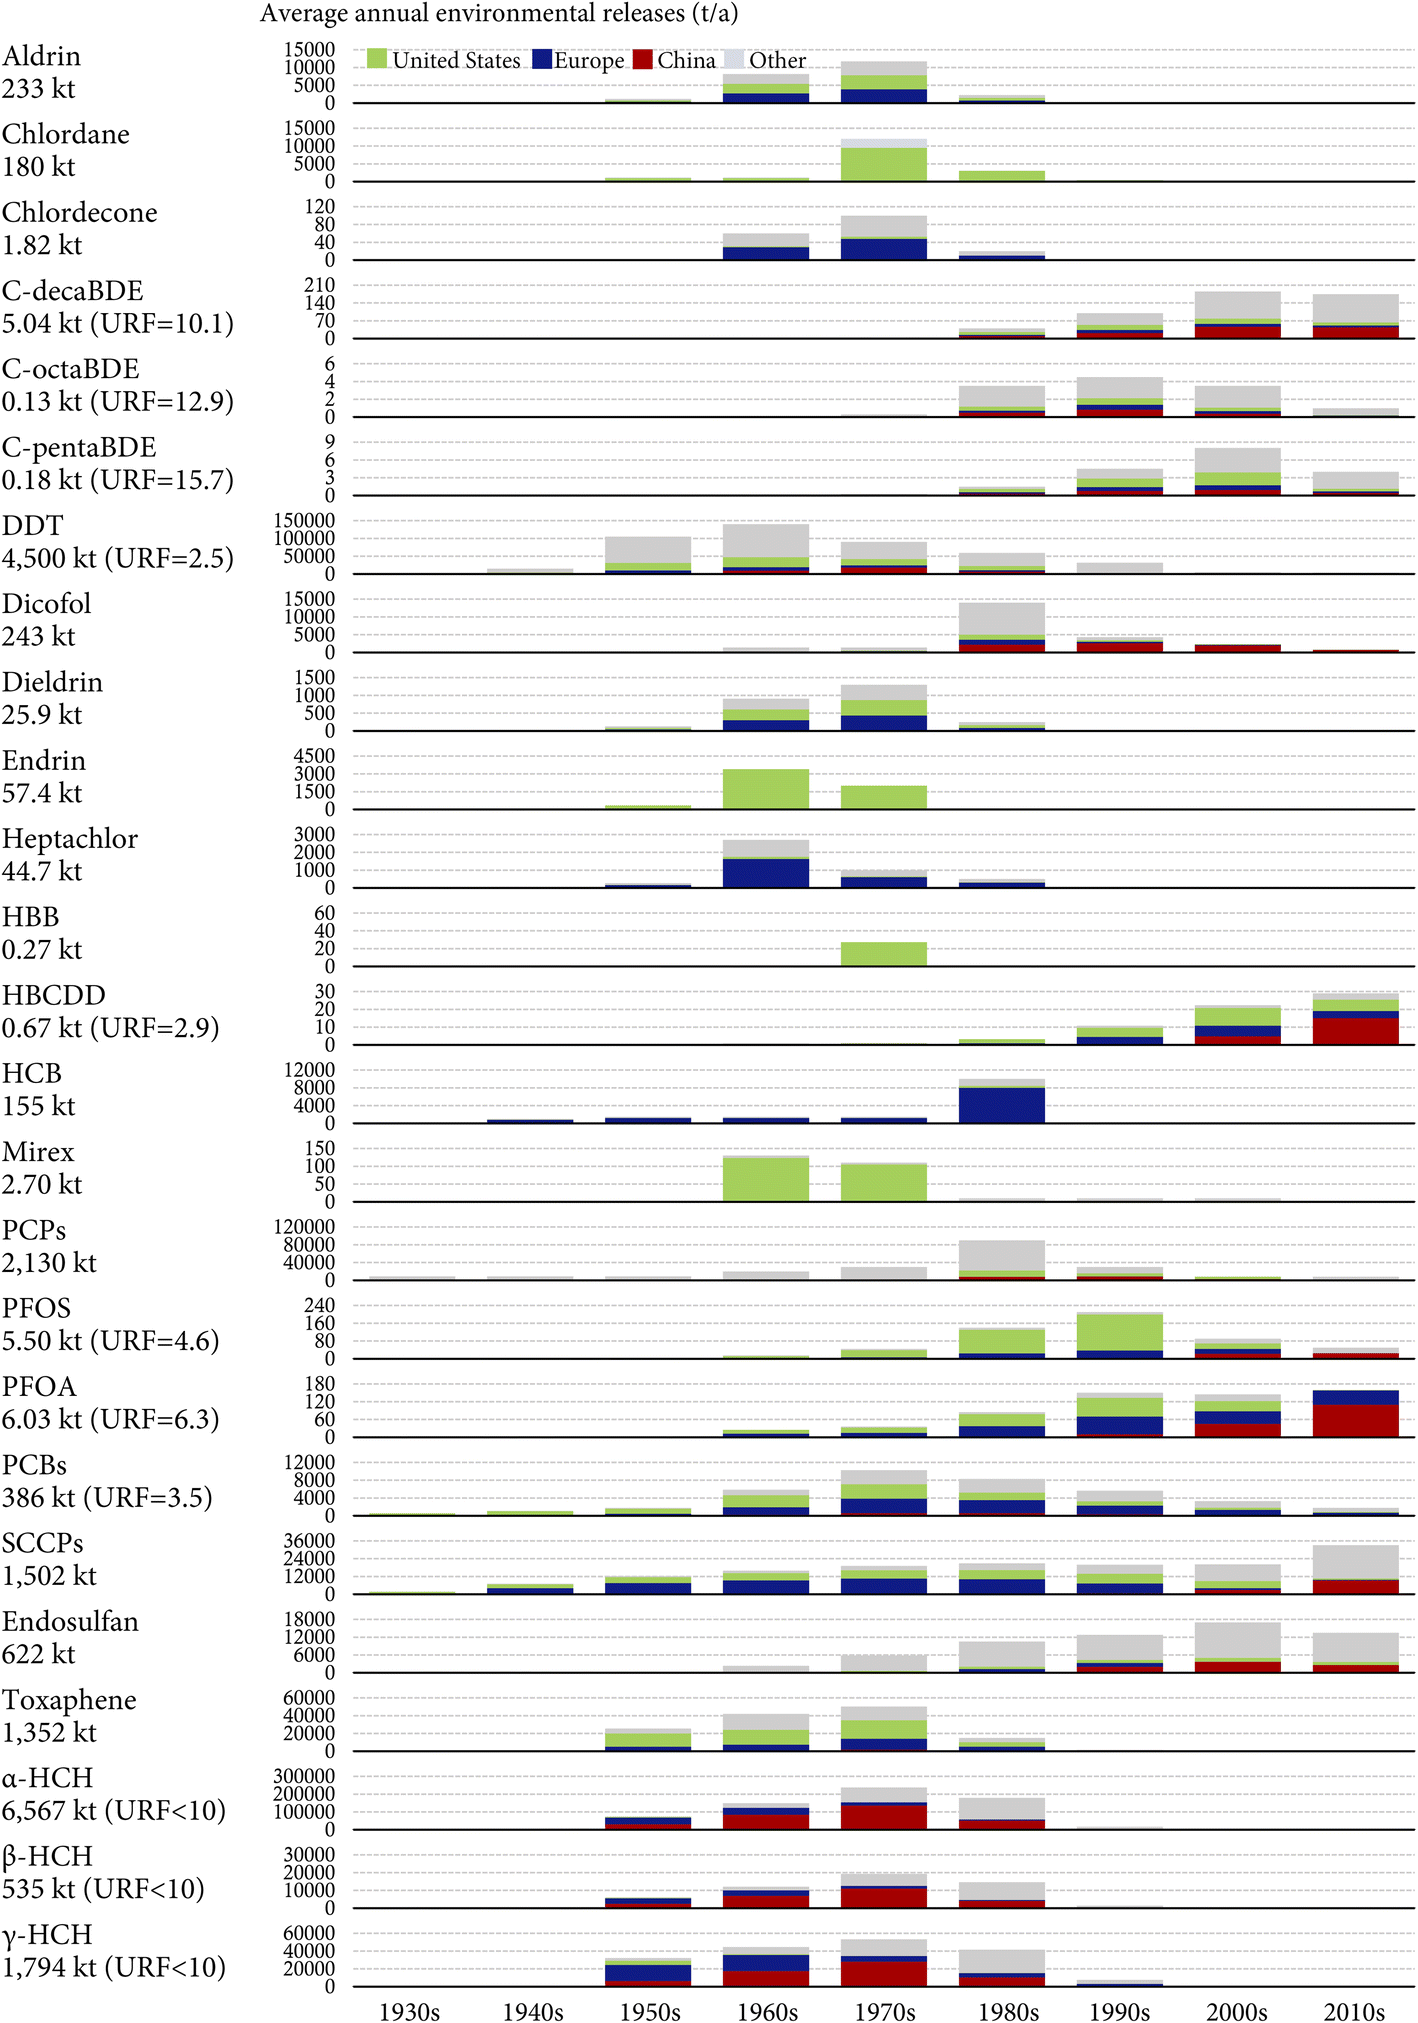 | ||
| Fig. 2 Average annual global environmental releases of the 25 intentionally produced persistent organic pollutants in the United States, Europe (including the Soviet Union), mainland China, and other regions from the 1930s to the 2010s. Numbers under the chemical names on the left indicate the central-tendency estimate of the global cumulative environmental releases during this period (outside the parentheses) and the uncertainty range factors (inside the parentheses). | ||
By contrast, industrial chemicals accounted for merely 9.4% of the cumulative global environmental releases of the 25 investigated POPs. By 2020, 63% (6.03 out of 9.50 kt) of the historically produced PFOA, 29% (386 out of 1326 kt) of the historically produced PCBs, and 17% (1502 out of 8795 kt) of the historically produced SCCPs have been released into the environment (Fig. 2). Even less than 1% of the cumulative global productions of PBDEs and HBCDD have been released into the environment by 2020 (Fig. 2).
Fig. 3 contrasts the temporal trends of global production and environmental releases of DDT (an example of pesticides) and c-decaBDE (an example of industrial chemicals). Several important conclusions can be drawn from the comparison. First, environmental releases of pesticides cease when the production and use of pesticides stop (Fig. 3a); yet, environmental releases of industrial chemicals last for decades after the termination of production and new use (Fig. 3b). This is because industrial chemicals can reside for years or decades in the “stock” of the long-lived in-use products or “stocks” of waste, which lowers contemporary environmental releases and postpones environmental releases to the future. For instance, central-tendency estimates indicate that after 2020, another 2.32 kt of PFOA will be released into the global environment by 2030,35 and another 25 kt of PCBs,14 1.4 kt of c-decaBDE,32 and 0.4 kt of HBCDD33 will be released into the global environment by 2100 if current chemical and waste management measures continue in the future. The storage of industrial chemicals in in-use and waste stocks may also lower the cumulative environmental releases because chemicals may undergo reactive and thermal losses during the use phase and waste disposal.
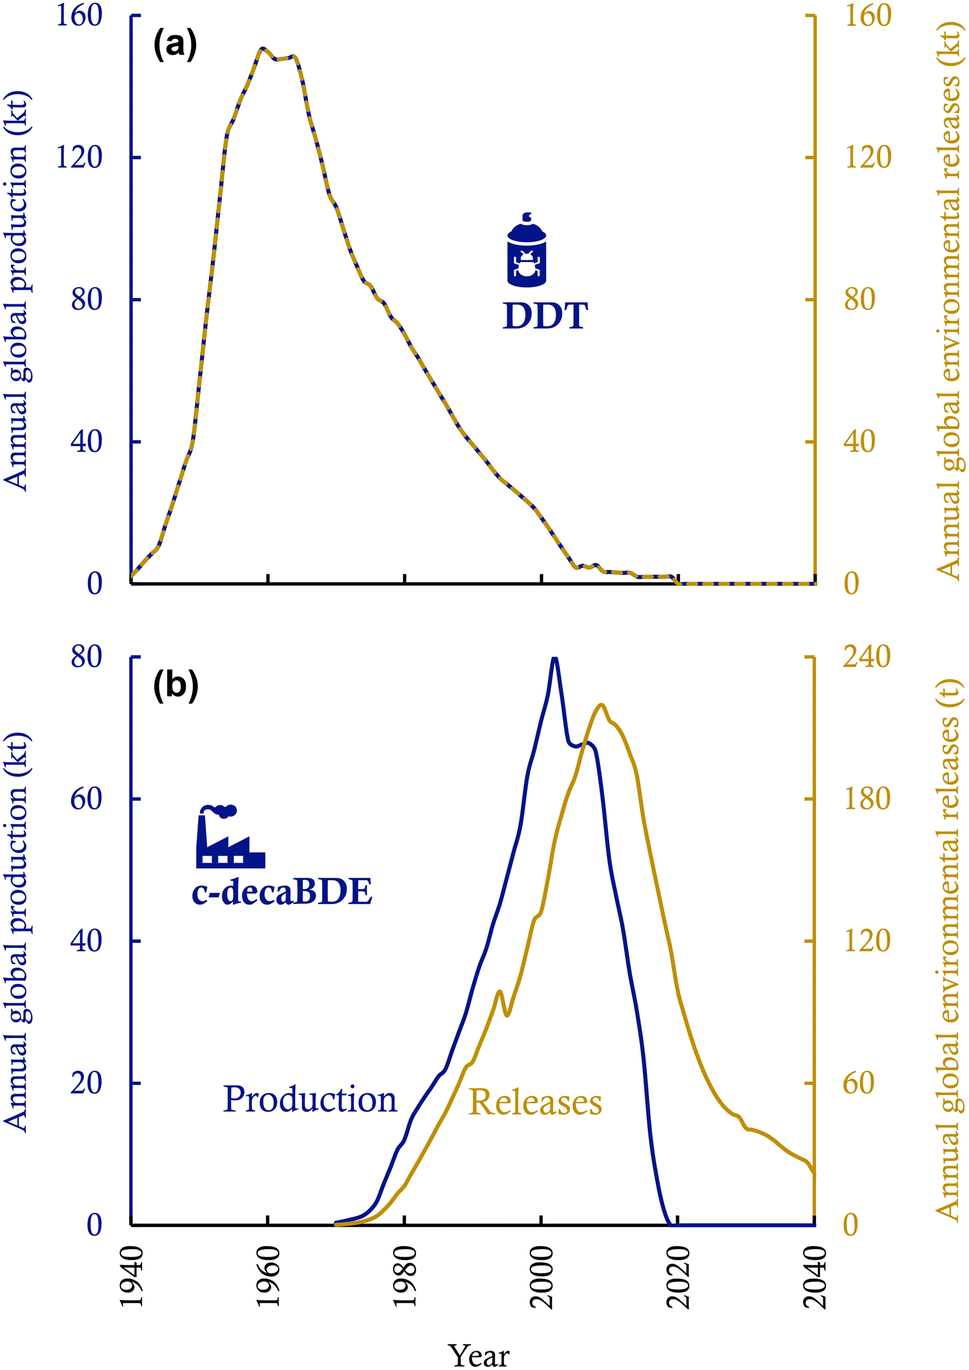 | ||
| Fig. 3 Temporal trends of global production and environmental releases of DDT (a pesticide; panel (a)) and c-decaBDE (an industrial chemical; panel (b)). See ESI Text S1† for the compilation of the time-series data. | ||
Second, for industrial chemicals, the peak year of environmental releases often lags the peak year of production (Fig. 3b). The lag is notable if chemicals are used in long-lived in-use products (such as construction materials with lifetimes of decades33,58) and if the in-use and waste stocks contributed significantly to the cumulative environmental releases.59 In particular, one may expect two separate peaks in the temporal profile of environmental releases, one occurring during the production and new use and the other during the period of waste disposal, if the lifespan of products is considerably long and if a substantial fraction of the chemicals is released from waste disposal processes.59 Such a double-peak temporal pattern can be the case, for instance, for the long-term environmental releases of HBCDD in China if no environmentally sound management measures are in place in the coming decades.60 Furthermore, because of substantial releases from waste stocks, the temporal pattern of environmental releases may even differ between geographic regions: developed regions achieve a rapid decline in environmental releases of POPs through exporting POP-containing waste to less developed regions, which hence causes persistent environmental and health concerns in the importing regions.61 In addition, primitive management or mismanagement of waste, such as the open burning of waste electrical and electronic equipment, in less developed regions results in much higher environmental releases of POPs than if the waste were handled in an environmentally sound manner in developing regions.14
Fig. 2 also shows that pesticides dominated the annual global environmental releases of the 25 investigated POPs for most of history, with important contributions of DDT (31–40%) in the 1940s through the 1960s, α-HCH (33–43%) in the 1960s through the 1980s, PCP (19% and 23%) in the 1980s and 1990s, and endosulfan (30% and 22%) in the 2000s and 2010s. SCCPs have been the most released POPs in the 2000s and 2010s, contributing to 35% and 54% of the annual global environmental releases of the 25 investigated POPs, respectively.
All estimates presented above are based on point estimates of the central tendency values. We must acknowledge that these estimates are associated with considerable uncertainty because the production and release information is “often difficult to obtain reliably and rigorously”.7 Multiple factors may be responsible for the overall uncertainty in the environmental release estimate, including but not limited to (i) uncertainties in the surveyed or estimated production data, (ii) the use of generic, inaccurate, or erroneous emission factors, pesticide use density, distribution ratios between multiple end-use applications, and/or product lifespans due to the inadequacy of region-, product-, and time-specific data, and (iii) natural variability, heterogeneity, and diversity in input data.5,14
To show the range of uncertainty, Fig. 2 also presents the URFs, defined as the ratio between the upper and lower bounds of the estimated global cumulative environmental releases, for several POPs with data available in the literature. In general, the release estimates are associated with an uncertainty range within a factor of 10 (Fig. 2). Since the data were gathered mostly from data sources with high transparency, completeness, consistency, accuracy, and spatial and temporal resolutions, such an order of magnitude uncertainty could be at the most conservative end of the scale. The uncertainty range is more noticeable for PBDEs (Fig. 2), mostly because of the remarkable uncertainty and variability in emission factors, especially those characterizing the passive volatilization process.32 The finding of such a 10-fold uncertainty range is important for understanding the uncertainty in environmental fate and exposure modeling: since the linearity of most fate and exposure models ensures the uncertainty in release estimates to propagate directly and proportionately to the model outputs, one would expect the modeled concentrations and exposure levels to suffer from a similar uncertainty range as well. Therefore, it is meaningful to use the agreement between model predictions and field measurements of an order of magnitude, as a rule of thumb for evaluating the fidelity of models.62 Cut-offs more stringent than a factor of 10 may not be realistic, given that models add extra uncertainty to the inherent uncertainty in release estimates. Nevertheless, uncertainty information is missing for more than half of the POPs investigated here. Also, the URFs of different POPs are not directly comparable because they may be calculated with the consideration of totally different factors.
3.3 Geographic distribution of environmental releases of POPs
Fig. 2 shows the shares of the U.S., Europe, and mainland China in the global environmental releases of the 25 POPs. Overall, these three major releasing regions contributed to 52% of the global cumulative environmental releases from the 1930s to the 2010s (China 24%, Europe 15%, and the U.S. 13%). It is still likely that this contribution is uncertain given that our assembled region-specific data may be incomplete or non-exhaustive.The U.S. and Europe used to be the hotspots of environmental releases of most POPs before the 2000s, as evidenced by the prevalent green and navy colors in Fig. 2. Notably, the U.S. was the sole producer of several POPs, including chlordecone,63 endrin,64 and HBB.65 The only exception is that, in the 1960s–1970s, mainland China produced and used more technical HCH products (despite not using technical lindane) than the U.S. and Europe did,27 resulting in much higher environmental releases of HCHs (Fig. 2). Mainland China became a more important releasing region than the U.S. and Europe in the 2000s–2010s (Fig. 2), notably for POPs newly listed by the Stockholm Convention such as HBCDD, PFOS, PFOA, SCCPs, c-decaBDE, and dicofol. This is partly because these chemicals had been banned or phased out in the U.S. and Europe due to their earlier awareness of the environmental and health impacts. It is also a result of the rapid expansion of China's chemical industry due to a continuous shift of the chemical industry from developed to developing economies.66,67 For example, despite the rather short history of HBCDD production in China (since 2000), it has already produced one-third of the global cumulative amounts as of 2020.33,60
Among these three regions, the U.S. has the highest cumulative environmental releases of 12 POPs (aldrin, chlordane, c-pentaBDE, DDT, dieldrin, endrin, HBB, HBCDD, mirex, PCPs, PFOS, and toxaphene), whereas Europe has the highest cumulative environmental releases of 8 POPs (aldrin, chlordecone, dieldrin, heptachlor, HCB, PFOA, PCBs, and SCCPs) (Fig. 2). Here, environmental releases of aldrin and dieldrin are assumed to be equal in the U.S and Europe due to a lack of geographically specific data. These two regions together contributed to 28% of the global cumulative environmental releases as of the end of the 2010s (Fig. 2). Although mainland China has the highest cumulative environmental releases of only seven POPs (endosulfan, c-decaBDE, c-octaBDE, dicofol, α-HCH, β-HCH, and γ-HCH), it alone contributed the most (∼24%) to the global cumulative environmental releases by the end of the 2010s, owing to the environmental releases of α-HCH far exceeding those of other POPs (Fig. 2). While environmental releases of POPs in a region contribute to the total global burden of POPs, regional residents and wildlife close to the source regions often suffer the most from their adverse health impacts.
Although we lump together environmental releases from other regions as gray bars in Fig. 2 due to data limitations, this does not mean that environmental releases from regions other than China, Europe, and the U.S. are to be ignored. In fact, the more important role of other regions is evidenced by the higher gray bars compared to colored bars in Fig. 2 for several POPs, including DDT, PCP, endosulfan, and HCHs. For instance, endosulfan was most extensively used in India, with cumulative totals of 113 kt during 1958–2002 (ref. 29) and ∼150 kt since 2002,68 triple the use and releases in China (a historical cumulative total of 83 kt). Moreover, regions other than Europe and the U.S. may see increased importance in the environmental release of several industrial chemicals, such as PBDEs and SCCPs. During the past few decades, these regions have seen increasing penetration of industrial chemicals in daily life as a result of socioeconomic development and more modernized lifestyles. Considerable amounts of these industrial chemicals or associated consumer products have been exported from China, Europe, and the U.S. to meet the ever-growing domestic demands in these regions.69 On the other hand, these regions, in particular the Global South, serve as “pollution havens” receiving transboundary trade in neat chemicals, products, and waste due to the geographic displacement of production lines and waste disposal activities caused by increasingly stringent environmental regulations in industrialized regions. An example is that the levels of PCBs, PBDEs, and SCCPs in air and sediment in western African countries remained increasing or leveled off during the past few decades,70,71 attributed to emissions from dumping, recycling, and open burning of imported POP-containing waste products. Emissions embodied in the global trade of chemicals, products, and waste empowers industrialized countries to shift the POP contamination issue to less industrialized countries, and such an ecologically unequal exchange poses a negative moral impact on environmental justice at a global level.72
3.4 Linking production and environmental releases with potential environmental impacts
Our assembled data demonstrate orders of magnitude variations in the production and environmental releases of the 25 intentionally produced POPs worldwide. One would then wonder about the most “problematic” or “worrisome” POPs in terms of their potential impacts on the global environment.Existing assessment frameworks rank, classify, and prioritize POPs or POP candidates based on their intensive attributes (i.e., properties independent of the quantity of a chemical) that contribute to their “hazard”, such as P, B, T, and LRTP.73 Following this hazard-based assessment paradigm, we compare the P (overall persistence), B (fish bioconcentration factor), T (human toxicological threshold), and LRTP (ϕ3) among these 25 investigated POPs (Fig. 4). Fig. 4 indicates that the calculated overall persistence (POV) varies by a factor of 300, from the least persistent γ-HCH (POV of ∼1 year) to the most persistent POPs (PFOS and PFOA with a POV of ∼300 years). These POV values mean that only 0.005% of the released γ-HCH is predicted to remain in the global environment 10 years after the stop of environmental releases, whereas this number is up to 97% for PFOS and PFOA. Fig. 4 also indicates that several POPs, such as c-pentaBDE (BCF of 9.77 × 10⁵ L kg−1), c-octaBDE (BCF of 6.45 × 10⁵ L kg−1), and c-decaBDE (BCF of 2.51 × 10⁵ L kg−1), exhibit strong potential for bioaccumulation in fish. By contrast, PFOS and PFOA have more limited potential for bioaccumulation, with a BCF falling within the ranges of 1–10 and 10–100 L kg−1, consistent with findings in earlier publications.74,75 In addition, the human toxicity of these POPs varies by four orders of magnitude, from the least systemically toxic HBCDD (RfD = 20000 ng kg−1 d−1) to the most systemically toxic PFOS (MRL = 2 ng kg−1 d−1) (Fig. 4). In other words, the daily intake rate of HBCDD needs to be 10000 times the daily intake rate of PFOS to result in the occurrence of observable adverse systemic health impacts on the general human population. Furthermore, Fig. 4 indicates that the POPs differ in LRTP by 4 orders of magnitude, from γ-HCH with a ϕ3 of 8.6 × 10⁻⁶ to PFOS and PFOA with an estimated ϕ3 of 4.60 × 10⁻².
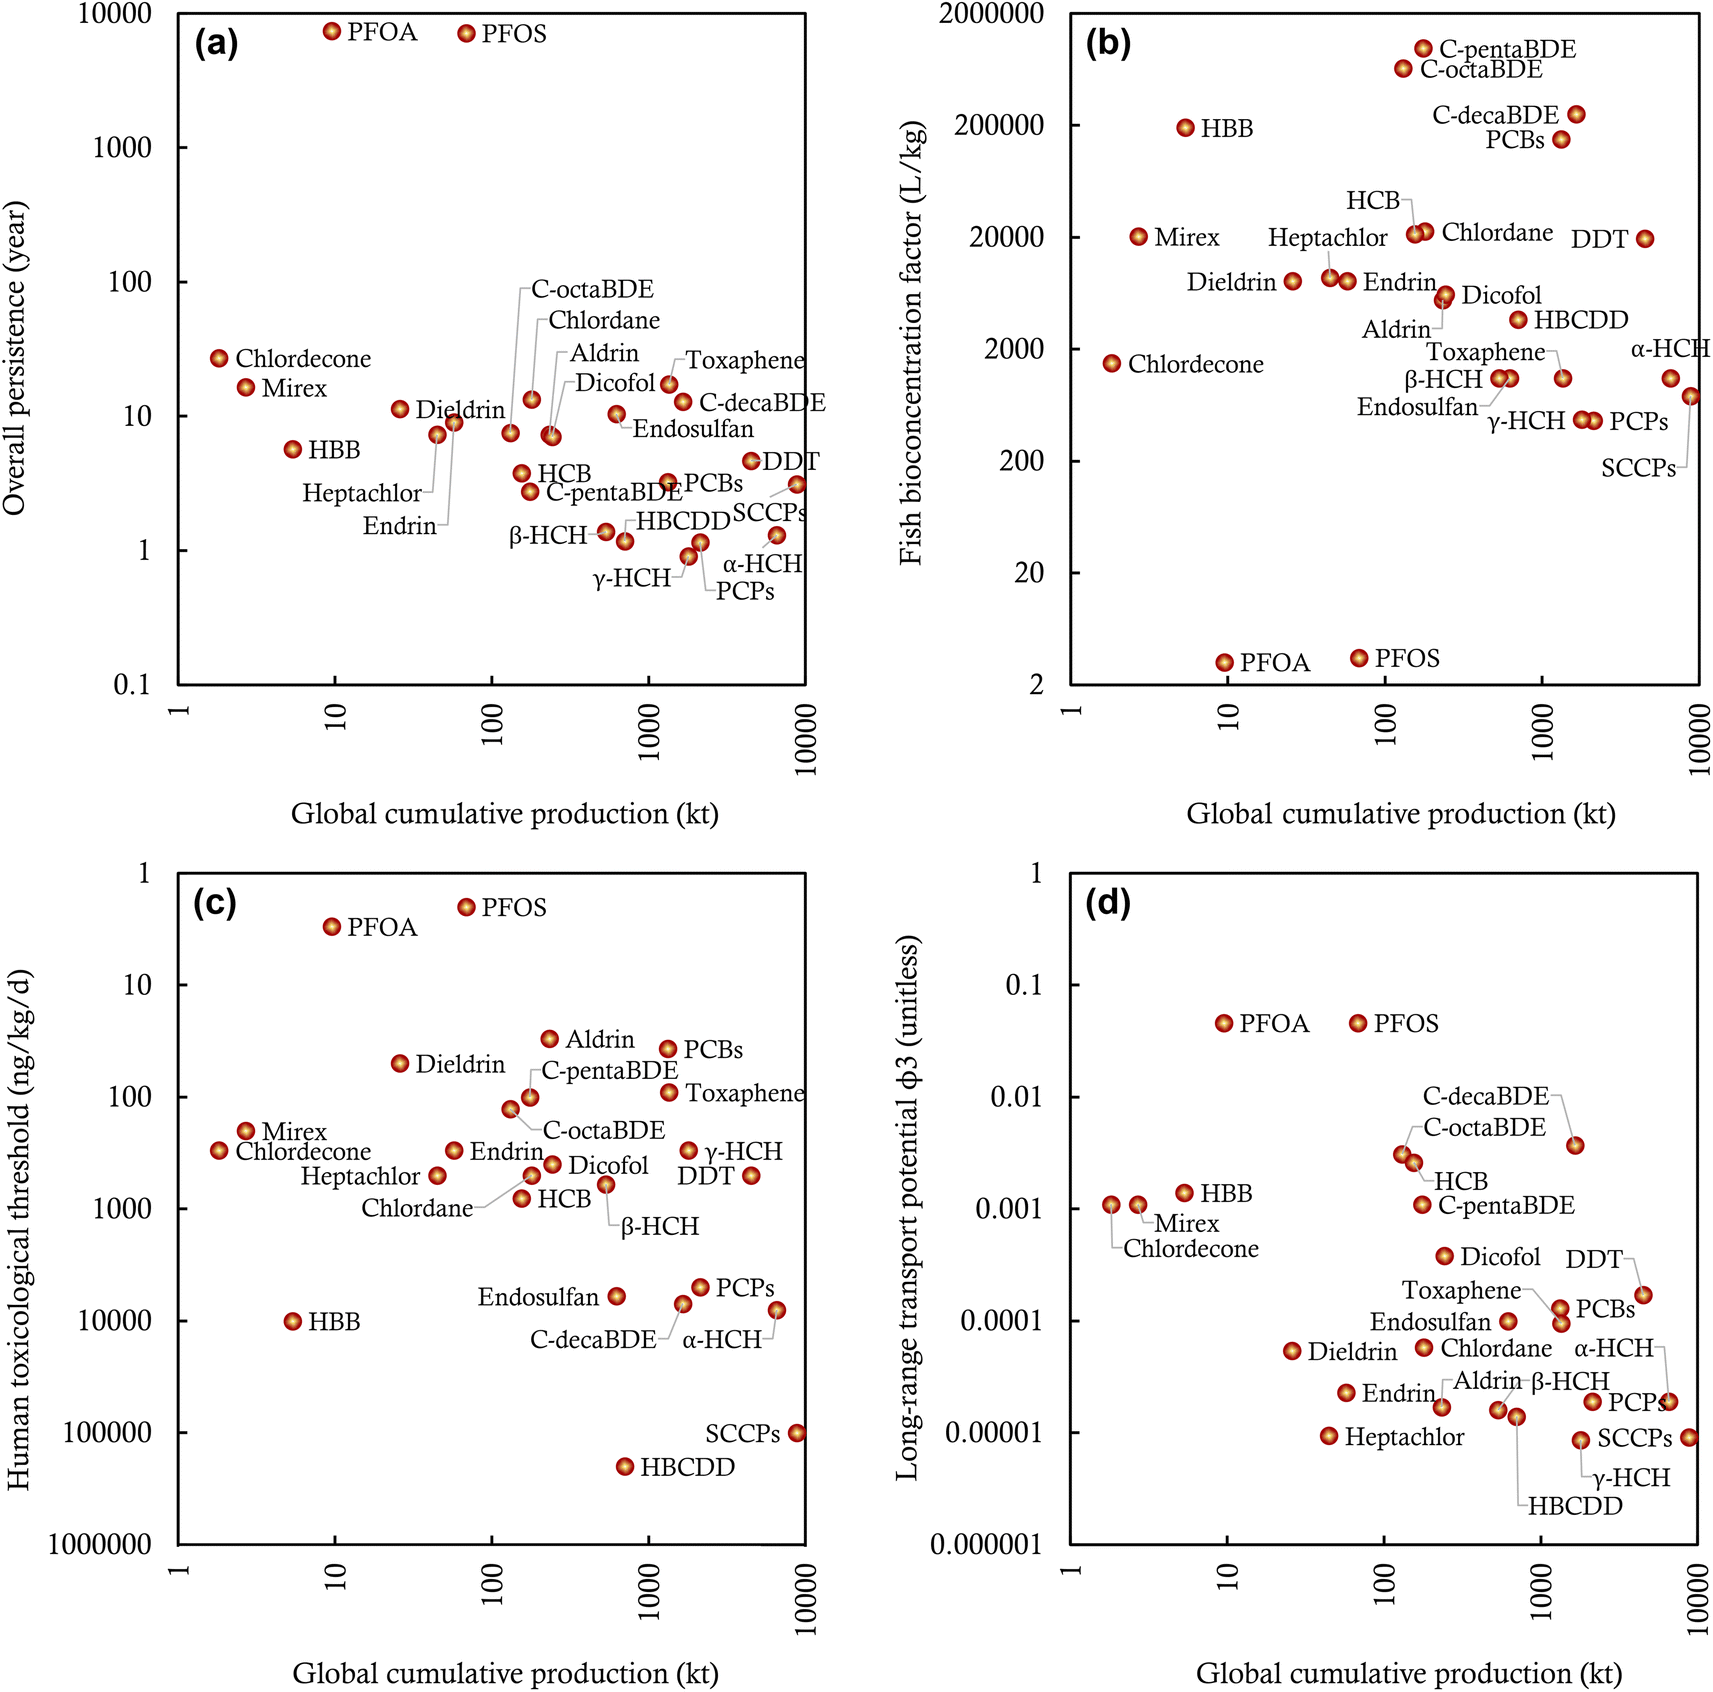 | ||
| Fig. 4 Persistence (panel (a)), bioaccumulation (panel (b)), toxicity (panel (c)), and long-range transport potential (panel (d)) of the 25 investigated POPs and their global cumulative production by the end of the 2010s. A POP closer to the coordinate system's origin has a lower potential environmental impact than those located further away. | ||
However, these hazard attributes alone do not necessarily indicate the risks or impacts of POPs because environmental impacts integrate both hazard and exposure.76,77 For instance, the most toxic chemical may not be of greatest concern if ecological or human exposure remains low. In chemical management, the production volume has long been used to approximate the potential for exposure (this is the basis for regulating “high production volume” chemicals).78 In this sense, our assembled global production information can be used in combination with the hazard attributes to assess the relative environmental impacts of these 25 POPs. Fig. 4 plots the P, B, T, and LRTP of 25 POPs against their global cumulative productions. Such visualization helps prioritize POPs with high potential environmental impacts given that a POP located closer to the origin of the coordinate system is of less environmental concern than those located further away. As Fig. 4 shows, DDT and PCBs are potentially associated with higher environmental impacts than other POPs because they are among the top rankings by both the global cumulative production and hazard attributes. Compared to DDT, mirex, as one of the least produced POPs, may have lower potential environmental impacts, despite its higher P, B, T, and LRTP attributes. Interestingly, although SCCPs are the most produced POP, their potential environmental impacts may be lower than the third most-produced DDT because of their limited P, B, T, and LRTP attributes. Fig. 4 also indicates that c-decaBDE deserves attention for its potential environmental impacts because of high P, B, LRTP, and the global cumulative production; however, it has a limited T, ranked 21st among the 25 investigated POPs. Similarly, PFOS and PFOA have high P, T, and LRTP, but relatively low B and global cumulative production.
The comparisons above underscore the important role of production volume in determining the potential environmental impacts of POPs. One can also use the information on environmental releases for such assessments if desired. Should the information on production or environmental releases be excluded from consideration, the traditional hazard-based assessment paradigm would overestimate or underestimate the potential environmental impacts of certain chemicals and, therefore, introduce false positives or false negatives of POPs. However, the information on production or environmental releases has yet to be included in the assessments of POP candidates nominated for regulation under the Stockholm Convention; hazard attributes are still the predominant criteria for the inclusion of chemicals in the POP list. Therefore, our visualized approach of comparing quantitative production (or environmental releases) information with hazard attributes serves as a potentially relevant step for lower-tiered impact-based assessments for POP candidates and other chemicals of emerging concern. In this sense, our assembled information on production and environmental releases also complements the existing hazard-based assessment of POPs by providing relevant and valuable data.
Nevertheless, there is a great need for methodological approaches for higher-tiered, more realistic assessments of the overall environmental impacts of POPs and POP candidates, given several major limitations associated with our preliminary lower-tiered assessments. First, production volumes and environmental releases do not necessarily mimic the potential of human and ecological exposures, due to the ignorance of complex, intertwined processes involved in the releases, fate and transport, exposure, and toxicokinetics of POPs.79,80 Second, since the global cumulative production is used for the comparisons, the temporal trend and geographic distribution of POP contamination were excluded from the assessment. Also, our results manifest that the potential environmental impacts of different POPs depend closely on specific evaluation contexts (P, B, T, or LRTP), and the rankings for different hazard attributes can be substantially divergent. As such, a holistic indicator is desired to integrate these discrete facets to determine a POP's overall environmental impacts.76 For these reasons, our above results are merely illustrative and should not be overinterpreted.
4. Perspectives
Overall, our work for the first time reveals the magnitude of global historical production and environmental releases of POPs. The assembled information on the production and environmental releases of POPs, in combination with hazard attributes, informs the relative impacts of these POPs on the global environment. We, therefore, recommend considering quantitative information on production and environmental releases, rather than the hazard-based criteria alone, in future assessments of POPs, POP candidates, and other chemicals of emerging concern to enhance the relevance of exposure, impact, and environmental risk. Such a new assessment paradigm relies on high-quality data on chemical production, trade, use, waste management, and environmental releases, which thus necessitates (i) more comprehensive collection and curation of first-hand national and regional statistical data under the Stockholm Convention and other multilateral environmental agreements (e.g., the Basel Convention, Rotterdam Convention, and the CLRTAP), and (ii) global high-level synthesis, comparison, and evaluation of the national and regional statistical data to ensure their transparency, completeness, consistency, and accuracy. These two tasks are often iterative rather than sequential: the global high-level synthesis helps identify data gaps in production and environmental releases, as well as national or regional data that are remarkably inconsistent with others and, hence, more likely to be questionable; on the other hand, the global high-level synthesis cannot be possible without collaboration among various multilateral environmental agreements in data collection, monitoring, reporting, and exchange. In addition, these two tasks warrant standard, harmonized information requirements among stakeholders under multilateral environmental agreements, as well as transparent, accessible information about chemicals in the global supply chains, notably country- or region-specific information about chemical contents in traded products, waste, and recycled materials.Conflicts of interest
There are no conflicts to declare.Acknowledgements
L. L. acknowledges financial support from the University of Nevada Reno Startup fund; K. B. acknowledges financial support from the Research Council of Norway (#287114 and #311503); G. A. acknowledges financial support from the Research Council of Norway (#303182).References
- United Nations Environment Programme, Stockholm Convention on Persistent Organic Pollutants (Text and Annexes), 2001, available at: https://chm.pops.int Search PubMed.
- K. Breivik, A. Sweetman, J. M. Pacyna and K. C. Jones, Towards a global historical emission inventory for selected PCB congeners — A mass balance approach: 3. An update, Sci. Total Environ., 2007, 377, 296–307 CrossRef CAS PubMed.
- Y.-F. Li, Global technical hexachlorocyclohexane usage and its contamination consequences in the environment: From 1948 to 1997, Sci. Total Environ., 1999, 232, 121–158 CrossRef CAS.
- C. Chen, A. Chen, F. Zhan, F. Wania, S. Zhang, L. Li and J. Liu, Global historical production, use, in-use stocks, and emissions of short-, medium-, and long-chain chlorinated paraffins, Environ. Sci. Technol., 2022, 56, 7895–7904 CrossRef CAS PubMed.
- K. Breivik, R. Alcock, Y.-F. Li, R. E. Bailey, H. Fiedler and J. M. Pacyna, Primary sources of selected POPs: Regional and global scale emission inventories, Environ. Pollut., 2004, 128, 3–16 CrossRef CAS PubMed.
- R. Lohmann, K. Breivik, J. Dachs and D. Muir, Global fate of POPs: Current and future research directions, Environ. Pollut., 2007, 150, 150–165 CrossRef CAS PubMed.
- K. C. Jones, Persistent organic pollutants (POPs) and related chemicals in the global environment: Some personal reflections, Environ. Sci. Technol., 2021, 55, 9400–9412 CrossRef CAS PubMed.
- L. M. Persson, M. Breitholtz, I. T. Cousins, C. A. de Wit, M. MacLeod and M. S. McLachlan, Confronting unknown planetary boundary threats from chemical pollution, Environ. Sci. Technol., 2013, 47, 12619–12622 CrossRef CAS PubMed.
- M. MacLeod, M. Breitholtz, I. T. Cousins, C. A. d. Wit, L. M. Persson, C. Rudén and M. S. McLachlan, Identifying chemicals that are planetary boundary threats, Environ. Sci. Technol., 2014, 48, 11057–11063 CrossRef CAS PubMed.
- J. K. Schuster, R. Gioia, K. Breivik, E. Steinnes, M. Scheringer and K. C. Jones, Trends in European background air reflect reductions in primary emissions of PCBs and PBDEs, Environ. Sci. Technol., 2010, 44, 6760–6766 CrossRef CAS.
- R. W. Macdonald, L. A. Barrie, T. F. Bidleman, M. L. Diamond, D. J. Gregor, R. G. Semkin, W. M. J. Strachan, Y.-F. Li, F. Wania, M. Alaee, L. B. Alexeeva, S. M. Backus, R. Bailey, J. M. Bewers, C. Gobeil, C. J. Halsall, T. Harner, J. T. Hoff, L. M. M. Jantunen, W. L. Lockhart, D. Mackay, D. C. G. Muir, J. Pudykiewicz, K. J. Reimer, J. N. Smith, G. A. Stern, W. H. Schroeder, R. Wagemann and M. B. Yunker, Contaminants in the Canadian Arctic: 5 years of progress in understanding sources, occurrence and pathways, Sci. Total Environ., 2000, 254, 93–234 CrossRef CAS PubMed.
- H. Hung, A. A. Katsoyiannis, E. Brorström-Lundén, K. Olafsdottir, W. Aas, K. Breivik, P. Bohlin-Nizzetto, A. Sigurdsson, H. Hakola, R. Bossi, H. Skov, E. Sverko, E. Barresi, P. Fellin and S. Wilson, Temporal trends of Persistent Organic Pollutants (POPs) in Arctic air: 20 years of monitoring under the Arctic Monitoring and Assessment Programme (AMAP), Environ. Pollut., 2016, 217, 52–61 CrossRef CAS PubMed.
- H. Wöhrnschimmel, M. Scheringer, C. Bogdal, H. Hung, A. Salamova, M. Venier, A. Katsoyiannis, R. A. Hites, K. Hungerbuhler and H. Fiedler, Ten years after entry into force of the Stockholm Convention: What do air monitoring data tell about its effectiveness?, Environ. Pollut., 2016, 217, 149–158 CrossRef PubMed.
- L. Li and F. Wania, Tracking chemicals in products around the world: introduction of a dynamic substance flow analysis model and application to PCBs, Environ. Int., 2016, 94, 674–686 CrossRef CAS PubMed.
- L. Li, in Modeling the Fate of Chemicals in Products, Springer Nature, Singapore, 2020 Search PubMed.
- F. Wania and D. Mackay, Global chemical fate of α-hexachlorocyclohexane. 2. Use of a global distribution model for mass balancing, source apportionment, and trend prediction, Environ. Toxicol. Chem., 1999, 18, 1400–1407 CrossRef CAS.
- F. Wania and D. Mackay, The evolution of mass balance models of persistent organic pollutant fate in the environment, Environ. Pollut., 1999, 100, 223–240 CrossRef CAS.
- A. Beyer, D. Mackay, M. Matthies, F. Wania and E. Webster, Assessing long-range transport potential of persistent organic pollutants, Environ. Sci. Technol., 2000, 34, 699–703 CrossRef CAS.
- M. Scheringer, F. Wegmann, K. Fenner and K. Hungerbühler, Investigation of the cold condensation of persistent organic pollutants with a global multimedia fate model, Environ. Sci. Technol., 2000, 34, 1842–1850 CrossRef CAS.
- M. MacLeod, M. Scheringer, T. E. McKone and K. Hungerbuhler, The state of multimedia mass-balance modeling in environmental science and decision-making, Environ. Sci. Technol., 2010, 44, 8360–8364 CrossRef CAS.
- G. Czub and M. S. McLachlan, A food chain model to predict the levels of lipophilic organic contaminants in humans, Environ. Toxicol. Chem., 2004, 23, 2356–2366 CrossRef CAS PubMed.
- T. H. Nøst, K. Breivik, O.-M. Fuskevåg, E. Nieboer, J. Ø. Odland and T. M. Sandanger, Persistent organic pollutants in Norwegian men from 1979 to 2007: intraindividual changes, age–period–cohort effects, and model predictions, Environ. Health Perspect., 2013, 121, 1292–1298 CrossRef PubMed.
- L. Li, C. Hoang, J. A. Arnot and F. Wania, Clarifying temporal trend variability in human biomonitoring of polybrominated diphenyl ethers through mechanistic modeling, Environ. Sci. Technol., 2020, 54, 166–175 CrossRef CAS PubMed.
- Y.-F. Li, A. McMillan and M. T. Scholtz, Global HCH usage with 1° × 1° longitude/latitude resolution, Environ. Sci. Technol., 1996, 30, 3525–3533 CrossRef.
- E. C. Voldner and Y.-F. Li, Global usage of selected persistent organochlorines, Sci. Total Environ., 1995, 160–161, 201–210 CrossRef.
- H. Jia, Y.-F. Li, D. Wang, D. Cai, M. Yang, J. Ma and J. Hu, Endosulfan in China 1—Gridded usage inventories, Environ. Sci. Pollut. Res., 2009, 16, 295–301 CrossRef CAS PubMed.
- Y.-F. Li, D. J. Cai, Z. J. Shan and Z. L. Zhu, Gridded usage inventories of technical hexachlorocyclohexane and lindane for China with 1/6° latitude by 1/4° longitude resolution, Arch. Environ. Contam. Toxicol., 2001, 41, 261–266 CrossRef CAS PubMed.
- Y.-F. Li, Toxaphene in the United States: 1. Usage gridding, J. Geophys. Res.: Atmos., 2001, 106, 17919–17927 CrossRef CAS.
- Y.-F. Li and R. W. Macdonald, Sources and pathways of selected organochlorine pesticides to the Arctic and the effect of pathway divergence on HCH trends in biota: A review, Sci. Total Environ., 2005, 342, 87–106 CrossRef CAS.
- K. Breivik, J. M. Pacyna and J. Münch, Use of α-, β- and γ-hexachlorocyclohexane in Europe, 1970–1996, Sci. Total Environ., 1999, 239, 151–163 CrossRef CAS PubMed.
- L. Li, J. Liu and J. Hu, Global inventory, long-range transport and environmental distribution of dicofol, Environ. Sci. Technol., 2015, 49, 212–222 CrossRef CAS.
- G. Abbasi, L. Li and K. Breivik, Global historical stocks and emissions of PBDEs, Environ. Sci. Technol., 2019, 53, 6330–6340 CrossRef CAS.
- L. Li and F. Wania, Elucidating the variability in the hexabromocyclododecane diastereomer profile in the global environment, Environ. Sci. Technol., 2018, 52, 10532–10542 CrossRef CAS PubMed.
- Z. Wang, J. M. Boucher, M. Scheringer, I. T. Cousins and K. Hungerbühler, Toward a comprehensive global emission inventory of C4–C10 perfluoroalkanesulfonic acids (PFSAs) and related precursors: Focus on the life cycle of C8-based products and ongoing industrial transition, Environ. Sci. Technol., 2017, 51, 4482–4493 CrossRef CAS PubMed.
- Z. Wang, I. T. Cousins, M. Scheringer, R. C. Buck and K. Hungerbühler, Global emission inventories for C4–C14 perfluoroalkyl carboxylic acid (PFCA) homologues from 1951 to 2030, Part I: production and emissions from quantifiable sources, Environ. Int., 2014, 70, 62–75 CrossRef CAS.
- X. Qiu, T. Zhu, B. Yao, J. Hu and S. Hu, Contribution of dicofol to the current DDT pollution in China, Environ. Sci. Technol., 2005, 39, 4385–4390 CrossRef CAS.
- R. E. Bailey, Global hexachlorobenzene emissions, Chemosphere, 2001, 43, 167–182 CrossRef CAS PubMed.
- Y.-F. Li, M. T. Scholtz and B. J. Van Heyst, Global gridded emission inventories of β-hexachlorocyclohexane, Environ. Sci. Technol., 2003, 37, 3493–3498 CrossRef CAS.
- Y. F. Li, M. T. Scholtz and B. J. van Heyst, Global gridded emission inventories of α-hexachlorocyclohexane, J. Geophys. Res.: Atmos., 2000, 105, 6621–6632 CrossRef CAS.
- Y. Li, S. Venkatesh and D. Li, Modeling global emissions and residues of pesticides, Environ. Model. Assess., 2005, 9, 237–243 CrossRef.
- F. Wegmann, L. Cavin, M. MacLeod, M. Scheringer and K. Hungerbühler, The OECD software tool for screening chemicals for persistence and long-range transport potential, Environ. Model. Softw., 2009, 24, 228–237 CrossRef.
- K. Mansouri, C. M. Grulke, R. S. Judson and A. J. Williams, OPERA models for predicting physicochemical properties and environmental fate endpoints, J. Cheminf., 2018, 10, 10 Search PubMed.
- K. Mansouri, OPERA-model for bioconcentration factor (Q17-24a-0023), Joint Research Centre, Brussels, 2019 Search PubMed.
- US Environmental Protection Agency, Human Health Toxicity Values in Superfund Risk Assessments (OSWER Directive 9285.7-53), Washington, DC, 2003 Search PubMed.
- J. A. Wignall, E. Muratov, A. Sedykh, K. Z. Guyton, A. Tropsha, I. Rusyn and W. A. Chiu, Conditional Toxicity Value (CTV) predictor: An in silico approach for generating quantitative risk estimates for chemicals, Environ. Health Perspect., 2018, 126, 057008 CrossRef PubMed.
- U.S. Environmental Protection Agency, Reference Dose (RfD): Description and Use in Health Risk Assessments, U.S. Environmental Protection Agency, Washington, D.C, 2014 Search PubMed.
- K. Breivik, M. McLachlan and F. Wania, The emissions fractions approach to assessing the long-range transport potential of organic chemicals, Environ. Sci. Technol., 2022, 56, 11983–11990 CrossRef CAS PubMed.
- L. Li, Z. Zhang, Y. Men, S. Baskaran, A. Sangion, S. Wang, J. A. Arnot and F. Wania, Retrieval, selection, and evaluation of chemical property data for assessments of chemical emissions, fate, hazard, exposure, and risks, ACS Environ. Au, 2022, 2(5), 376–395 CrossRef CAS.
- J. A. Arnot, T. Gouin and D. Mackay, Practical Methods for Estimating Environmental Biodegradation Rates. Report for Environment Canada (CEMN2005003), Canadian Environmental Modelling Network, Trent University, Peterborough, ON, 2005 Search PubMed.
- K. Fenner, M. Scheringer, M. MacLeod, M. Matthies, T. McKone, M. Stroebe, A. Beyer, M. Bonnell, A. C. Le Gall and J. Klasmeier, Comparing estimates of persistence and long-range transport potential among multimedia models, Environ. Sci. Technol., 2005, 39, 1932–1942 CrossRef CAS PubMed.
- L. Li, J. Liu, J. Hu and F. Wania, Degradation of fluorotelomer-based polymers contributes to the global occurrence of fluorotelomer alcohol and perfluoroalkyl carboxylates: A combined dynamic substance flow and environmental fate modeling analysis, Environ. Sci. Technol., 2017, 51, 4461–4470 CrossRef CAS PubMed.
- H. van den Berg, G. Manuweera and F. Konradsen, Global trends in the production and use of DDT for control of malaria and other vector-borne diseases, Malar. J., 2017, 16, 401 CrossRef.
- J. Cribb, Surviving the 21st century: Humanity's ten great challenges and how we can overcome them, Springer International Publishing, Cham, 2017, pp. 103–122 Search PubMed.
- P. Fantke, A. S. Ernstoff, L. Huang, S. A. Csiszar and O. Jolliet, Coupled near-field and far-field exposure assessment framework for chemicals in consumer products, Environ. Int., 2016, 94, 508–518 CrossRef CAS PubMed.
- L. Li, J. A. Arnot and F. Wania, Revisiting the contributions of far- and near-field routes to aggregate human exposure to polychlorinated biphenyls (PCBs), Environ. Sci. Technol., 2018, 52, 6974–6984 CrossRef CAS PubMed.
- Z. Zhang, S. Wang and L. Li, The role of chemical properties in human exposure to environmental chemicals, Environ. Sci.: Processes Impacts, 2021, 23, 1839–1862 RSC.
- K. S. Betts, Unwelcome guest: PBDEs in indoor dust, Environ. Health Perspect., 2008, 116, A202–A208 Search PubMed.
- H. Bergsdal, H. Brattebø and D. B. Müller, Dynamic material flow analysis for PCBs in the Norwegian building stock, Build. Res. Inf., 2014, 42, 359–370 CrossRef.
- L. Li and F. Wania, Occurrence of single- and double-peaked emission profiles of synthetic chemicals, Environ. Sci. Technol., 2018, 52, 4684–4693 CrossRef CAS.
- L. Li, R. Weber, J. Liu and J. Hu, Long-term emissions of hexabromocyclododecane as a chemical of concern in products in China, Environ. Int., 2016, 91, 291–300 CrossRef CAS PubMed.
- K. Breivik, R. Gioia, P. Chakraborty, G. Zhang and K. C. Jones, Are reductions in industrial organic contaminants emissions in rich countries achieved partly by export of toxic wastes?, Environ. Sci. Technol., 2011, 45, 9154–9160 CrossRef CAS PubMed.
- M. MacLeod, W. J. Riley and T. E. Mckone, Assessing the influence of climate variability on atmospheric concentrations of polychlorinated biphenyls using a global-scale mass balance model (BETR-Global), Environ. Sci. Technol., 2005, 39, 6749–6756 CrossRef CAS PubMed.
- World Health Organization, Environmental Health Criteria 43: Chlordecone, Report 9241541830, International Programme on Chemical Safety, World Health Organization, Canadian Centre for Occupational Health and Safety, 1984 Search PubMed.
- World Health Organization, Environmental Health Criteria 130: Endrin, United Nations Environment Programme, International Labor Organisation, World Health Organization, Geneva, 1992 Search PubMed.
- Persistent Organic Pollutants Review Committee, Risk Profile on Hexabromobiphenyl (UNEP/POPS/POPRC.2/17/Add.3), Stockholm Convention on Persistent Organic Pollutants, Persistent Organic Pollutants Review Committee, Geneva, 2006 Search PubMed.
- United Nations Environment Programme, Global Chemicals Outlook I: Towards Sound Management of Chemicals, United Nations Environment Programme, Geneva, 2013 Search PubMed.
- United Nations Environment Programme, Global Chemicals Outlook II: From Legacies to Innovative Solutions, United Nations Environment Programme, Geneva, 2019 Search PubMed.
- Persistent Organic Pollutants Review Committee, Risk Management Evaluation on Endosulfan (UNEP/POPS/POPRC.6/13/Add.1), Stockholm Convention on Persistent Organic Pollutants, Persistent Organic Pollutants Review Committee, Geneva, 2010 Search PubMed.
- K. Shen, L. Li, J. Liu, C. Chen and J. Liu, Stocks, flows and emissions of DBDPE in China and its international distribution through products and waste, Environ. Pollut., 2019, 250, 79–86 CrossRef CAS PubMed.
- K. B. White, J. Kalina, M. Scheringer, P. Přibylová, P. Kukučka, J. Kohoutek, R. Prokeš and J. Klánová, Temporal trends of persistent organic pollutants across Africa after a decade of MONET passive air sampling, Environ. Sci. Technol., 2021, 55, 9413–9424 CrossRef CAS PubMed.
- M. Nipen, R. D. Vogt, P. Bohlin-Nizzetto, K. Borgå, E. B. Mwakalapa, A. R. Borgen, M. Schlabach, G. Christensen, A. J. Mmochi and K. Breivik, Increasing trends of legacy and emerging organic contaminants in a dated sediment core from East-Africa, Front. Environ. Sci, 2022, 9, 805544 CrossRef.
- K. Tong, L. Li, K. Breivik and F. Wania, Ecological unequal exchange: Quantifying emissions of toxic chemicals embodied in the global trade of chemicals, products, and waste, Environ. Res. Lett., 2022, 17, 044054 CrossRef.
- D. Mackay, L. S. McCarty and M. MacLeod, On the validity of classifying chemicals for persistence, bioaccumulation, toxicity, and potential for long-range transport, Environ. Toxicol. Chem., 2001, 20, 1491–1498 CrossRef CAS.
- J. M. Conder, R. A. Hoke, W. d. Wolf, M. H. Russell and R. C. Buck, Are PFCAs bioaccumulative? A critical review and comparison with regulatory criteria and persistent lipophilic compounds, Environ. Sci. Technol., 2008, 42, 995–1003 CrossRef CAS PubMed.
- C. A. Ng and K. Hungerbühler, Bioaccumulation of perfluorinated alkyl acids: observations and models, Environ. Sci. Technol., 2014, 48, 4637–4648 CrossRef CAS.
- J. A. Arnot and D. Mackay, Policies for chemical hazard and risk priority setting: Can persistence, bioaccumulation, toxicity, and quantity information be combined, Environ. Sci. Technol., 2008, 42, 4648–4654 CrossRef CAS.
- J. A. Arnot, T. N. Brown, F. Wania, K. Breivik and M. S. McLachlan, Prioritizing chemicals and data requirements for screening-level exposure and risk assessment, Environ. Health Perspect., 2012, 120, 1565–1570 CrossRef.
- OECD, Decision-Recommendation of the Council on the Co-operative Investigation and Risk Reduction of Existing Chemicals [C(90)163/FINAL], 1990 Search PubMed.
- L. Li, A. Sangion, F. Wania, J. M. Armitage, L. Toose, L. Hughes and J. A. Arnot, Development and evaluation of a holistic and mechanistic modeling framework for chemical emissions, fate, exposure, and risk, Environ. Health Perspect., 2021, 129, 127006 CrossRef PubMed.
- M. A. Bonnell, A. Zidek, A. Griffiths and D. Gutzman, Fate and exposure modeling in regulatory chemical evaluation: new directions from retrospection, Environ. Sci.: Processes Impacts, 2018, 20, 20–31 RSC.
Footnote |
| † Electronic supplementary information (ESI) available. See DOI: https://doi.org/10.1039/d2va00145d |
| This journal is © The Royal Society of Chemistry 2023 |