 Open Access Article
Creative Commons Attribution 3.0 Unported Licence
Non-concentration quenching and energy transfer enhanced green emission in Ca8SrGd(PO4)7:Eu2+,Tb3+ for near-UV white LEDs with a high color rendering index†
Shaoyu
Wang
ab,
Zeyu
Lyu
*b,
Zheng
Lu
ab,
Lixuan
Wang
ab,
Jianhui
Wang
ab,
Dashuai
Sun
b,
Taixing
Tan
b,
Sida
Shen
b and
Hongpeng
You
 *abc
*abc
aSchool of Rare Earths, University of Science and Technology of China, Hefei 230026, P. R. China
bGanjiang Innovation Academy, Chinese Academy of Sciences, Ganzhou 341000, P. R. China. E-mail: zylyu@gia.cas.cn
cState Key Laboratory of Rare Earth Resource Utilization, Changchun Institute of Applied Chemistry, Chinese Academy of Sciences, Changchun 130022, P. R. China. E-mail: hpyou@ciac.ac.cn
First published on 27th June 2023
Abstract
Compared with the well-studied energy transfer from Ce3+ to Tb3+, the energy transfer from Eu2+ to Tb3+ has the advantage of high doping concentration of Tb3+, because Eu2+ and Tb3+ tend to occupy different lattice sites. Herein, the energy transfer from Eu2+ to Tb3+ is achieved in the Ca8SrGd(PO4)7 host for an efficient Tb3+ doped green phosphor. The decrease in the lifetime of Eu2+ emission with the increasing Tb3+ concentration reveals the energy transfer from the Eu2+ to Tb3+ ions. Notably, the Tb3+ emission of Ca8SrGd(PO4)7:Eu2+,Tb3+ has the strongest intensity at the unity doping ratio of Tb3+, indicating a non-concentration quenching effect. The absorption efficiency in the near-ultraviolet region was increased from 6% to 75% after Eu2+ was doped into Ca8SrTb(PO4)7, and the emission was enhanced by approximately six times. Consequently, a high quantum efficiency (internal: 63% and external: 51%) was achieved in Ca8SrTb(PO4)7:Eu2+. Finally, a near-ultraviolet chip excited white LED was fabricated by applying the as-prepared Ca8SrTb(PO4)7:Eu2+ as the green phosphor, with a high color rendering index of 93, and a low correlated color temperature of 3728 K. These results indicate that the presented phosphor has potential in lighting applications, providing a new perspective for developing efficient Tb3+ activated phosphors through energy transfer and high doping concentration.
1. Introduction
In recent years, white light emitting diodes (WLEDs) have attracted enormous attention due to low energy consumption, high efficiency, fast response and environmental friendliness.1–5 The most common way to fabricate WLEDs is to integrate a blue LED chip with multiple phosphors (for example, green and red phosphors).6–9 However, the fabricated WLEDs usually have a lower color rendering index (Ra) and can emit blue light that may have a harmful effect on human health. To meet the requirements of human-centric lighting, an alternative method has been proposed. This method involves combining near-ultraviolet chips with blue, green and red phosphors.10,11 However, the design of the corresponding phosphors is more complicated than simply considering their luminescence efficiency. Attention must also be given to factors such as phosphor degradation and Stokes shift, which could potentially cause a color shift or reabsorption. Among the three phosphors, the green phosphor is of critical importance since the human eye is most sensitive to green light. Therefore, it is desirable to explore green phosphors that can be excited using near-ultraviolet light.12–14Some green phosphors containing Ce3+ and Eu2+ ions, such as La3Br(SiS4)2:Ce3+ and BaSi7N10:Eu2+, have limitations due to their structural instability and harsh synthesis conditions.15,16 On the other hand, Tb3+ acts as a typical activator for green emission, resulting from its typical 5D4–7F5 transition (∼545 nm). With the protected 4f electrons, Tb3+-doped phosphors normally possess high stability in both chemical and physical aspects.17–21 However, their absorption efficiency is low due to the 4f–4f forbidden transition, which significantly restricts the practical application of Tb3+-doped phosphors. In order to broaden the excitation spectrum of Tb3+, selecting an appropriate sensitizer to facilitate energy transfer is a feasible solution. The energy transfer between Ce3+ and Tb3+ has been extensively investigated for this purpose, such as Ca2YZr2(AlO4)3:Ce3+,Tb3+, NaBaScSi2O7:Ce3+,Tb3+, CaYAlO4:Ce3+,Tb3+, SrMgY3(SiO4)3F:Ce3+,Tb3+, and Ca3Lu2Si6O18:Ce3+,Tb3+.22–26 As for the emission, a practical approach to achieve high brightness is to use a suitable host that allows for higher Tb3+ doping without concentration quenching. However, Ce3+ and Tb3+ tend to occupy the same crystal site due to their similar valence states and ionic radii, which leads to limited Tb3+ doping concentration. In this regard, Eu2+, which exhibits similar efficient emission to that of Ce3+ and tends to occupy different crystal sites, may be a more suitable sensitizer for brighter Tb3+-doped phosphors. Nonetheless, there is a lack of efficient Eu2+-sensitized Tb3+-doped phosphors for near-ultraviolet LED applications. The ideal phosphors should meet the following requirements: (i) Eu2+ should be effectively excited by near-ultraviolet light and transfer the energy to Tb3+, (ii) the doping concentration of Tb3+ should be as high as possible to achieve high brightness, and (iii) the Stokes shift should be large enough to diminish potential re-absorption of the emission from the blue phosphor.
In this study, we doped Eu2+ and Tb3+ into a phosphate matrix, Ca8SrGd(PO4)7. According to the valence and ionic radius, Eu2+ occupies the sites of Sr2+, while Tb3+ occupies the sites of Gd3+. Remarkably, we achieved an efficient Tb3+-doped phosphor that benefited from the energy transfer and non-concentration quenching effect. After doping Eu2+ into Ca8SrTb(PO4)7, the absorption efficiency increased from 6% to 75%, resulting in emission enhancement of approximately six times. Consequently, we achieved high internal quantum efficiency (63%) and external quantum efficiency (51%) in Ca8SrTb(PO4)7:Eu2+. Finally, a near-ultraviolet chip excited white LED was fabricated by applying the as-prepared Ca8SrTb(PO4)7:Eu2+ as the green phosphor. The lighting device possessed a high color rendering index (CRI), and a low correlated colour temperature (CCT).
2. Experimental section
2.1. Materials and synthesis
A series of Ca8SrGd(PO4)7: Eu2+,Tb3+ phosphors were synthesized by a traditional high temperature solid state reaction, using CaCO3 (99.99%), SrCO3 (99.99%), Gd2O3 (99.99%), NH4H2PO4 (99.99%), Eu2O3 (99.99%), and Tb4O7 (99.99%) as raw materials. The raw materials were well mixed together and ground in an agate mortar for 20 minutes. The resulting mixture was then placed in an alumina crucible and heated at 900 °C for 3 hours, followed by further sintering at 1300 °C for 4 hours under a reducing atmosphere.2.2. Materials characterization
The phase purity of the sample was analyzed using a powder X-ray diffractometer (Bruker AXS D8 Advance), under the conditions of 40 kV and 40 mA, Cu Kα (λ = 0.15405 nm), 0.02° per step, 0.07s per step from 10° to 80°. The General Structural Analysis System (GSAS) program was used for XRD Rietveld refinement. The morphologies and energy spectrum (EDS) of the samples were obtained using a JSM-IT800 high-resolution field emission scanning electron microscope (SEM). Photoluminescence spectra (PL) and excitation spectra (PLE) were recorded using a Hitachi F-7100 fluorescence spectrophotometer with a 150 W Xenon lamp. The decay curves, quantum yield (QY) and time-resolved photoluminescence (TRPL) spectra were obtained using an Edinburgh instrument FLS-1000 spectrometer with the Edinburgh instrument integrating sphere. The lifetimes are fitted by a second-order exponential equation. The temperature-dependent PL spectra of phosphors were obtained using an EX-1000 thermal quenching analysis system. Blue fluorescent BaMgAl10O17:Eu2+, red phosphor (Ca,Sr)AlSiN3:Eu2+, green phosphor Ca8SrTb(PO4)7![[thin space (1/6-em)]](https://www.rsc.org/images/entities/char_2009.gif) :
:![[thin space (1/6-em)]](https://www.rsc.org/images/entities/char_2009.gif) 0.1Eu2+ and a UV-LED chip (365 nm) are used to manufacture WLED devices. Starspec SSP6612 (forward bias current: 20 mA, and forward voltage: 3.36 V) was used to evaluate the luminescence characteristics of w-LED devices.
0.1Eu2+ and a UV-LED chip (365 nm) are used to manufacture WLED devices. Starspec SSP6612 (forward bias current: 20 mA, and forward voltage: 3.36 V) was used to evaluate the luminescence characteristics of w-LED devices.
3. Results and discussion
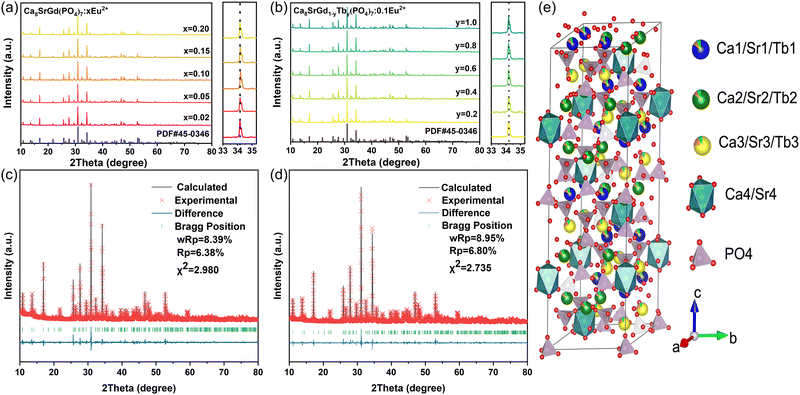
Fig. 1a and b show the XRD patterns of Ca8SrGd(PO4)7:xEu2+(x = 0.02, 0.05, 0.10, 0.15, and 0.20) phosphors and Ca8SrGd(PO4)7![[thin space (1/6-em)]](https://www.rsc.org/images/entities/char_2009.gif) :
:![[thin space (1/6-em)]](https://www.rsc.org/images/entities/char_2009.gif) 0.1Eu2+, yTb3+ (y = 0.2, 0.4, 0.6, 0.8, and 1.0) phosphors, respectively. The diffraction patterns of all the as-prepared phosphors match well with the XRD pattern of Ca9Nd(PO4)7, indicating the phase-purity of the samples. In Fig. 1(a) and (b), the XRD peaks almost remained unchanged in the 33–35.3° range, The radii of the host cations and doping ions should be almost the same, and it is reasonable to assume that Eu2+ replaces Sr2+, and Tb3+ replaces Gd3+. The calculated ionic radii difference percentage (Dr) is listed in Tables S1 and S2 (ESI†); the small Dr value further substantiates the substituted tendency of Eu2+ and Tb3+. In order to further confirm the phase and crystal structure, the XRD patterns of Ca8SrGd(PO4)7 and Ca8SrTb(PO4)7:0.1Eu2+ were refined by the Rietveld method. As shown in Fig. 1c and d, the refined results of Ca8SrGd(PO4)7 (Rp = 6.38%, Rwp = 8.39%) and Ca8SrTb(PO4)7:0.1Eu2+ (Rp = 6.80%, Rwp = 8.95%) clarified the reliability and phase-purity. On the basis of XRD analysis, the crystal structure of the title phosphor is depicted in Fig. 1e, which has a space group of R3c and cell parameters of a = b = 10.48453 Å, c = 37.554 Å, Z = 6, and V = 3575.07 Å3 (Table S3, ESI†). These parameters are consistent with previous reports on similar hosts.12 Ca8SrGd(PO4)7 has four Ca sites with the coordination numbers of 8, 7, 8, and 6 for the Ca1, Ca2, Ca3, and Ca4 sites, respectively. According to the crystal structure of Ca9Nd(PO4)7, Tb3+ occupies the Ca1, Ca2, and Ca3 sites. In view of similar ionic radii and charge balance of Ca2+ (CN = 8, r = 1.12 Å; CN = 7, r = 1.06 Å; CN = 6, r = 1.00 Å) and Sr2+ (CN = 8, r = 1.26 Å; CN = 7, r = 1.21 Å; CN = 6, r = 1.18 Å), it is reasonable to assume that Sr2+ will randomly occupy all four Ca2+ positions.27 With the increasing Eu2+ concentration, the cell parameters of Ca8SrGd(PO4)7:xEu2+ almost remained unchanged; the variations of a, c and v were within 0.034, 0.042 and 0.099%, respectively (Fig. S1, ESI†). This observation suggests that the Eu2+ ions tend to replace Sr2+ ions due to their nearly identical ionic radii.
0.1Eu2+, yTb3+ (y = 0.2, 0.4, 0.6, 0.8, and 1.0) phosphors, respectively. The diffraction patterns of all the as-prepared phosphors match well with the XRD pattern of Ca9Nd(PO4)7, indicating the phase-purity of the samples. In Fig. 1(a) and (b), the XRD peaks almost remained unchanged in the 33–35.3° range, The radii of the host cations and doping ions should be almost the same, and it is reasonable to assume that Eu2+ replaces Sr2+, and Tb3+ replaces Gd3+. The calculated ionic radii difference percentage (Dr) is listed in Tables S1 and S2 (ESI†); the small Dr value further substantiates the substituted tendency of Eu2+ and Tb3+. In order to further confirm the phase and crystal structure, the XRD patterns of Ca8SrGd(PO4)7 and Ca8SrTb(PO4)7:0.1Eu2+ were refined by the Rietveld method. As shown in Fig. 1c and d, the refined results of Ca8SrGd(PO4)7 (Rp = 6.38%, Rwp = 8.39%) and Ca8SrTb(PO4)7:0.1Eu2+ (Rp = 6.80%, Rwp = 8.95%) clarified the reliability and phase-purity. On the basis of XRD analysis, the crystal structure of the title phosphor is depicted in Fig. 1e, which has a space group of R3c and cell parameters of a = b = 10.48453 Å, c = 37.554 Å, Z = 6, and V = 3575.07 Å3 (Table S3, ESI†). These parameters are consistent with previous reports on similar hosts.12 Ca8SrGd(PO4)7 has four Ca sites with the coordination numbers of 8, 7, 8, and 6 for the Ca1, Ca2, Ca3, and Ca4 sites, respectively. According to the crystal structure of Ca9Nd(PO4)7, Tb3+ occupies the Ca1, Ca2, and Ca3 sites. In view of similar ionic radii and charge balance of Ca2+ (CN = 8, r = 1.12 Å; CN = 7, r = 1.06 Å; CN = 6, r = 1.00 Å) and Sr2+ (CN = 8, r = 1.26 Å; CN = 7, r = 1.21 Å; CN = 6, r = 1.18 Å), it is reasonable to assume that Sr2+ will randomly occupy all four Ca2+ positions.27 With the increasing Eu2+ concentration, the cell parameters of Ca8SrGd(PO4)7:xEu2+ almost remained unchanged; the variations of a, c and v were within 0.034, 0.042 and 0.099%, respectively (Fig. S1, ESI†). This observation suggests that the Eu2+ ions tend to replace Sr2+ ions due to their nearly identical ionic radii.
Fig. 2a displays scanning electron microscopy (SEM) images of the title phosphor, revealing stacked particles with sizes ranging from 2 to 6 μm. The smooth surfaces of the particles indicate their high crystallinity. The corresponding EDS spectra of Ca8SrTb(PO4)7:0.1Eu2+ phosphors are disclosed in Fig. 2b and c. According to the mass ratio, the atomic ratio was calculated to be Ca![[thin space (1/6-em)]](https://www.rsc.org/images/entities/char_2009.gif) :
:![[thin space (1/6-em)]](https://www.rsc.org/images/entities/char_2009.gif) Sr
Sr![[thin space (1/6-em)]](https://www.rsc.org/images/entities/char_2009.gif) :
:![[thin space (1/6-em)]](https://www.rsc.org/images/entities/char_2009.gif) P
P![[thin space (1/6-em)]](https://www.rsc.org/images/entities/char_2009.gif) :
:![[thin space (1/6-em)]](https://www.rsc.org/images/entities/char_2009.gif) Tb
Tb![[thin space (1/6-em)]](https://www.rsc.org/images/entities/char_2009.gif) :
:![[thin space (1/6-em)]](https://www.rsc.org/images/entities/char_2009.gif) Eu = 8
Eu = 8![[thin space (1/6-em)]](https://www.rsc.org/images/entities/char_2009.gif) :
:![[thin space (1/6-em)]](https://www.rsc.org/images/entities/char_2009.gif) 0.96
0.96![[thin space (1/6-em)]](https://www.rsc.org/images/entities/char_2009.gif) :
:![[thin space (1/6-em)]](https://www.rsc.org/images/entities/char_2009.gif) 7.04
7.04![[thin space (1/6-em)]](https://www.rsc.org/images/entities/char_2009.gif) :
:![[thin space (1/6-em)]](https://www.rsc.org/images/entities/char_2009.gif) 0.99
0.99![[thin space (1/6-em)]](https://www.rsc.org/images/entities/char_2009.gif) :
:![[thin space (1/6-em)]](https://www.rsc.org/images/entities/char_2009.gif) 0.07, which matches well with the chemical formula Ca8SrTb(PO4)7
0.07, which matches well with the chemical formula Ca8SrTb(PO4)7![[thin space (1/6-em)]](https://www.rsc.org/images/entities/char_2009.gif) :
:![[thin space (1/6-em)]](https://www.rsc.org/images/entities/char_2009.gif) 0.1Eu2+. Also, all the elements distributed uniformly in the particle.
0.1Eu2+. Also, all the elements distributed uniformly in the particle.
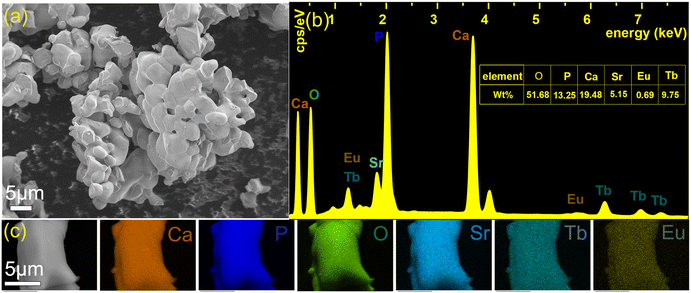 | ||
| Fig. 2 SEM image of Ca8SrTb(PO4)7:0.1Eu2+ (a), EDS spectra and mass ratio of elements of Ca8SrTb(PO4)7:0.1Eu2+ (b), and elemental mappings of Ca8SrTb(PO4)7:0.1Eu2+ phosphors (c). | ||
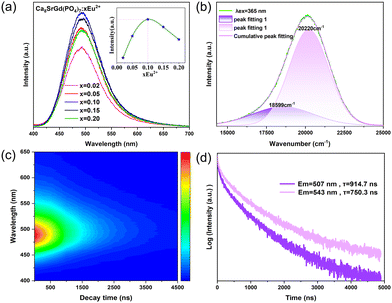
To determine the optimal doping concentration of Eu2+ in Ca8SrGd(PO4)7, the concentration dependent PL spectra were obtained. As shown in Fig. 3a, the emission profiles and position did not change, and the emission intensity reached its maximum at x = 0.10, indicating that the Eu2+ incorporation did not significantly alter the crystal environment. The emission of Eu2+ is sensitive to its surrounding crystal environment because of the exposed 5d excited orbital. Therefore, on the basis of Van Uitert's report, the Eu2+ occupation can be confirmed theoretically:12,28
 | (1) |
![[thin space (1/6-em)]](https://www.rsc.org/images/entities/char_2009.gif) 000 cm−1 for Eu2+) represent the doped and free Eu2+ 5d energy level positions, respectively; V means the valence of the Eu2+ ion (V = 2); n is the coordination number of doped Eu2+; Ea stands for the electron affinity of the atoms forming anions (Ea = 2.19 eV for the (PO4)3-); and r is the radius of substituted ions by Eu2+. The E values of the Eu2+ in the Sr2+ sites with different coordination numbers, SrO8, SrO7, and SrO6, are determined to be 21
000 cm−1 for Eu2+) represent the doped and free Eu2+ 5d energy level positions, respectively; V means the valence of the Eu2+ ion (V = 2); n is the coordination number of doped Eu2+; Ea stands for the electron affinity of the atoms forming anions (Ea = 2.19 eV for the (PO4)3-); and r is the radius of substituted ions by Eu2+. The E values of the Eu2+ in the Sr2+ sites with different coordination numbers, SrO8, SrO7, and SrO6, are determined to be 21![[thin space (1/6-em)]](https://www.rsc.org/images/entities/char_2009.gif) 264 (470 nm), 19
264 (470 nm), 19![[thin space (1/6-em)]](https://www.rsc.org/images/entities/char_2009.gif) 904 (502 nm), and 18
904 (502 nm), and 18![[thin space (1/6-em)]](https://www.rsc.org/images/entities/char_2009.gif) 613 cm−1 (537 nm), respectively (Table S4, ESI†). As shown in Fig. 3b, the asymmetric PL spectrum of Ca8SrGd(PO4)7:0.1Eu2+ contains two emission peaks by Gaussian fitting, which are located at 495 and 537 nm. Therefore, it is reasonable to assume that the emission peaking at 495 nm belongs to the Eu2+ in Sr2 (CN = 7), and the one at 537 nm belongs to Eu2+ in Sr4 (CN = 6). As shown in the time-resolved photoluminescence (TRPL) in Fig. 3c, the emission profiles of Eu2+ varied at different time intervals. The emissions at longer wavelength decayed faster than those at shorter wavelength. As a matter of fact, the emission at 507 nm possessed a lifetime of approximately 915 ns, while the one at 543 nm had a lifetime of approximately 750 ns (Fig. 3d). The inconsistent lifetimes of the emissions at different wavelengths further confirm the existence of two luminescence centers.
613 cm−1 (537 nm), respectively (Table S4, ESI†). As shown in Fig. 3b, the asymmetric PL spectrum of Ca8SrGd(PO4)7:0.1Eu2+ contains two emission peaks by Gaussian fitting, which are located at 495 and 537 nm. Therefore, it is reasonable to assume that the emission peaking at 495 nm belongs to the Eu2+ in Sr2 (CN = 7), and the one at 537 nm belongs to Eu2+ in Sr4 (CN = 6). As shown in the time-resolved photoluminescence (TRPL) in Fig. 3c, the emission profiles of Eu2+ varied at different time intervals. The emissions at longer wavelength decayed faster than those at shorter wavelength. As a matter of fact, the emission at 507 nm possessed a lifetime of approximately 915 ns, while the one at 543 nm had a lifetime of approximately 750 ns (Fig. 3d). The inconsistent lifetimes of the emissions at different wavelengths further confirm the existence of two luminescence centers.
The occurrence of energy transfer from Eu2+ to Tb3+ requires an overlap between the Eu2+ emission and the Tb3+ excitation. The comparison among the PLE-PL spectra of Ca8SrGd(PO4)7:0.1Eu2+, Ca8SrTb(PO4)7 and Ca8SrTb(PO4)7:0.1Eu2+ is depicted in Fig. 4. For Ca8SrGd(PO4)7:0.1Eu2+, its PLE spectrum monitored at 490 nm consists of a wide band from 250 to 430 nm, which matches well with that in the spectra of commercial near-ultraviolet LED chips. At 365 nm excitation, the emission covers 450–650 nm, corresponding to the transition from the 4f65d excited state to the 4f7 ground state. For Ca8SrTb(PO4)7, its PLE spectrum monitored at 545 nm consists of a strong band at approximately 233 nm with a shoulder at approximately 264 nm, which are attributed to the spin allowed 4f8–4f75d1 (ΔS = 0) and spin forbidden 4f8–4f75d1 (ΔS = 1) transitions, respectively.29 In addition, there are several weak transitions from 278 to 500 nm, which can be attributed to transitions from 7F6 to 5F5,4, 5H7–4, 5D1,0, 5L10–7, 5G6–2 and 5D2–4. Since the emission of Ca8SrGd(PO4)7:0.1Eu2+ overlaps with the excitation of Ca8SrTb(PO4)7, effective energy transfer can be designed. Consequently, the PLE spectrum of Ca8SrTb(PO4)7:0.1Eu2+, monitored at 545 nm, shows a wide and strong excitation in the range of 200–500 nm. The PLE spectrum is composed of the excitation bands of Tb3+ and Eu2+ in the Ca8SrGd(PO4)7 host. At excitation of 365 nm, four emission peaks at 492, 545, 594, and 624 nm in the PL spectra of Ca8SrTb(PO4)7:0.1Eu2+ originate from the 5D4–7FJ (J = 6, 5, 4 and 3) transitions of the Tb 3+ ions.29–33 The full width at half maximum (FWHM) of the emission peaking at 545 nm is only 9 nm. The smaller FWHM is capable of presenting purer colour and larger colour gamut in the display applications. Importantly, the probabilities of f–d transition are intrinsically higher than that of f–f transition. Consequently, the absorption efficiency at 350 nm increased from 6% to 75% after Eu2+ was doped in the Ca8SrTb(PO4)7 (Fig. S2, ESI†). Benefiting from the energy transfer from Eu2+ to Tb3+, the green emission of Tb3+ can be more effectively excited with the near-ultraviolet chip, making the Tb3+-doped phosphors a potential candidate for white LEDs.
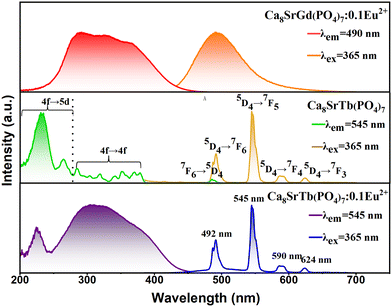 | ||
| Fig. 4 PL and PLE spectra of Ca8SrGd(PO4)7:0.1Eu2+, Ca8SrTb(PO4)7:0.1Eu2+ and Ca8SrTb(PO4)7 phosphors. | ||
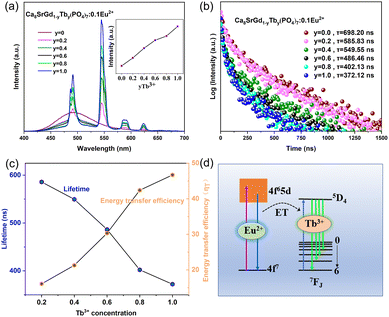
The energy transfer from Eu2+ to Tb3+ was further investigated by modulating the doping concentration. First, the doping concentration of Tb3+ was optimized. Strikingly, the emission of Tb3+ in Ca8SrGd(PO4)7:0.10Eu2+,yTb3+ kept increasing with the increasing Tb3+ concentration (Fig. 5a), exhibiting a non-concentration quenching effect. The fact that the optimal doping ratio of Tb3+ was unity substantiated the advantage of sensitizing Tb3+ with Eu2+, due to the different doping site selectivities of these two ions. There are three main reasons for the non-concentration quenching effect of Tb3+ ions. One is that Tb3+ ions have a partially filled 4f electron shell, which is well-shielded from the surrounding environment by the 5s and 5p electron shells. This shielding reduces the interaction between Tb3+ ions and other ions or defects in the crystal lattice, thereby decreasing the probability of nonradiative processes that lead to concentration quenching. Another is that the larger energy gap between the ground state and excited state reduces the probability of energy transfer processes and the electron–phonon effect is significantly smaller. Lastly, and more importantly, even though there is only one Tb3+ ion in Ca8SrTb(PO4)7, the Tb3+ ions can randomly occupy the three Ca2+/Sr2+ sites in the crystal structure, and the Ca2+/Tb3+ ratio is 8, resulting in a larger distance between Tb3+ ions. This reduces the energy transfer between Tb3+ ions that leads to concentration quenching. The change in the lifetime of Eu2+ emission upon Tb3+ concentration was determined to study the energy transfer efficiency.34–38 As disclosed in Fig. 5b, the lifetime decreases monotonously with the increasing Tb3+ concentration. Then, the energy transfer efficiency was calculated according to the lifetime, which is the highest (46.70%) as y = 1.39,40Fig. 5d depicts the energy transfer diagram, where the emission of the Tb3+ ions is sensitized by the allowed transition between the 4f and 4f5d configuration of the Eu2+ ions.
The critical distance between the Eu and Tb ions can be calculated using the following formula:41
 | (5) |
On the basis of the Dexter's multipole interaction energy transfer formula and Reisfeld approximation, the following relationship is established to investigate the energy transfer mechanism:41,42
 | (6) |
The influence of the concentration of the Eu2+ ion was investigated. As disclosed in Fig. 6a, the Tb3+-emission in Ca8SrTb(PO4)7 greatly enhanced after doping with Eu2+. The intensity of the Tb3+-emission increases with the increasing Eu2+ concentration until z = 0.1, and then decreases. The change tendency is consistent with the concentration-dependent PL spectra of Ca8SrGd(PO4)7:xEu2+ shown in Fig. 6a. Notably, the emission intensity of Ca8SrTb (PO4)7:0.1Eu2+ was 5.7 times stronger than that of Ca8SrTb(PO4)7. Moreover, the quantum efficiency of Ca8SrTb(PO4)7:0.1Eu2+ was determined, where the internal quantum efficiency (IQE) and external quantum efficiency (EQE) at 320 nm excitation are 63% and 51%, respectively (Fig. 6b). The quantum efficiencies of some green phosphors were compared and are summarized in Table S5 (ESI†). The quantum efficiency of Ca8SrTb(PO4)7:0.1 Eu2+ was comparable with that of the reported green phosphors, and the fine QY indicates its potential application as a green phosphor in WLEDs.43–45
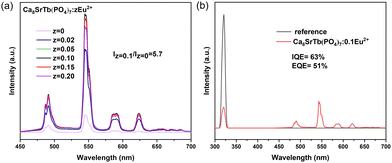 | ||
| Fig. 6 (a) PL spectra of phosphor Ca8SrTb(PO4)7:zEu2+ (z = 0, 0.02, 0.05, 0.10, 0.15, and 0.20) at 365 nm excitation. (b) IQE and EQE of phosphor Ca8SrTb(PO4)7:0.1Eu2+ at 320 nm excitation. | ||
Fig. 7a shows the temperature-dependent PL spectra in the range of 303 to 483 K. The emission profile has not changed, while the emission intensity decreases with the increase of temperature (Fig. 7b). The emission intensity at 423 K is 28% of that at 303 K. The activation energy (ΔE) of Ca8SrTb(PO4)7:0.1Eu2+ for thermal quenching can be determined using the following expression:46,47
 | (7) |
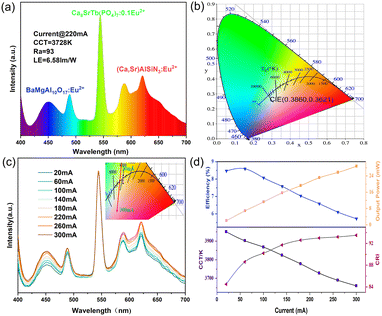
Finally, a white LED was fabricated with the commercial blue phosphor (BaMgAl10O17:Eu2+), red phosphor ((Ca,Sr)AlSiN3:Eu2+) and the as-prepared green phosphor (Ca8SrTb(PO4)7:0.1Eu2+). Fig. 8a shows the emission spectrum under 220 mA current drive, exhibiting the characteristic green emission of the Tb3+ ions. The CCT of the white LED device is 3728 K, and the CRI is 93, which shows the potential for application in white LED lighting. The CIE coordinates are (0.3860, 0.3621) (Fig. 8b). In addition, the emission driven by different currents (20 mA–300 mA) was also measured, as shown in Fig. 8c, which exhibited a small shift of color. Also, the changes in CCT, CRI, efficiency, and output power under different current drives were measured (Fig. 8d and Table S6, ESI†). In the range of 20 mA–300 mA, all the CRI were greater than 85, and all the CCT were lower than 4000 K, indicating the fine quality of the as-fabricated WLED.
Conclusions
In summary, a novel green phosphor Ca8SrTb(PO4)7:Eu2+ for white LED was successfully prepared by a traditional high temperature solid phase method. The crystal structure and morphology were analyzed by XRD and SEM, respectively. On the basis of the overlap between the PL spectrum of Ca8SrGd(PO4)7:Eu2+ and the PL spectrum of Ca8SrTb(PO4)7, the energy transfer from Eu2+ to Tb3+ was achieved with the highest energy transfer efficiency of 46.7%. Through the achieved energy transfer, a wide and strong excitation band of the Tb3+ emission in the range of 200–430 nm was obtained, which matched well with that of the near-ultraviolet LED chip. Moreover the absorption efficiency in the near-ultraviolet region increased from 6% to 75% after doping Eu2+ ions into Ca8SrTb(PO4)7. The Tb3+ emission did not exhibit concentration quenching in Ca8SrGd(PO4)7:Eu2+, leading to a green phosphor with high quantum efficiencies (IQE = 63% and EQE = 51%). Finally, We used the as-prepared phosphor, BaMgAl10O17:Eu2+, (Ca,Sr)AlSiN3:Eu2+, and a near-UV chip (365nm) to produce a white LED with a low CCT of 3728 K and a high CRI of 93. Our work not only produced a green phosphor with fine luminescent properties, but also provided an approach for developing Tb3+ activated phosphors with high brightness through energy transfer and non-concentration quenching.Author contributions
Shaoyu Wang: data curation, investigation, and writing – original draft preparation. Zeyu Lyu: data curation and writing – review & editing. Zheng Lu: investigation. Lixuan Wang: data curation. Jianhui Wang: data curation. Dashuai Sun: investigation. Taixing Tan: investigation. Sida Shen: investigation. Hongpeng You: project administration, writing – review & editing, and funding acquisition.Conflicts of interest
The authors declare no conflicts of interest.Acknowledgements
This work is financially supported by the National Key Research and Development Program (Grant No. 2022YFC2905201), the National Natural Science Foundation of China (Grant No. 52072363), and the Research Projects of Ganjiang Innovation Academy, Chinese Academy of Sciences (E255C001).References
- X. Huang, J. Liang, S. Rtimi, B. Devakumar and Z. Zhang, Chem. Eng. J., 2021, 405, 126950 CrossRef CAS.
- L. Wu, S. Sun, Y. Bai, Z. Xia, L. Wu, H. Chen, L. Zheng, H. Yi, T. Sun, Y. Kong, Y. Zhang and J. Xu, Adv. Opt. Mater., 2021, 9, 2100870 CrossRef CAS.
- P. Dang, G. Li, X. Yun, Q. Zhang, D. Liu, H. Lian, M. Shang and J. Lin, Light: Sci. Appl., 2021, 10, 29 CrossRef CAS PubMed.
- A. J. van Bunningen, A. D. Sontakke, R. van der Vliet, V. G. Spit and A. Meijerink, Adv. Opt. Mater., 2023, 11, 2202794 CrossRef CAS.
- H. Daicho, T. Iwasaki, K. Enomoto, Y. Sasaki, Y. Maeno, Y. Shinomiya, S. Aoyagi, E. Nishibori, M. Sakata, H. Sawa, S. Matsuishi and H. Hosono, Nat. Commun., 2012, 3, 1132 CrossRef.
- M. Shang, S. Liang, N. Qu, H. Lian and J. Lin, Chem. Mater., 2017, 29, 1813–1829 CrossRef CAS.
- W. R. Liu, C. H. Huang, C. W. Yeh, J. C. Tsai, Y. C. Chiu, Y. T. Yeh and R. S. Liu, Inorg. Chem., 2012, 51, 9636–9641 CrossRef CAS PubMed.
- J. Qiao, Z. Zhang, J. Zhao and Z. Xia, Inorg. Chem., 2019, 58, 5006–5012 CrossRef CAS PubMed.
- P. Pust, V. Weiler, C. Hecht, A. Tucks, A. S. Wochnik, A. K. Henss, D. Wiechert, C. Scheu, P. J. Schmidt and W. Schnick, Nat. Mater., 2014, 13, 891–896 CrossRef CAS PubMed.
- R. Gautier, X. Li, Z. Xia and F. Massuyeau, J. Am. Chem. Soc., 2017, 139, 1436–1439 CrossRef CAS.
- C. Wang, Z. Wang, P. Li, J. Cheng, Z. Li, M. Tian, Y. Sun and Z. Yang, J. Mater. Chem. C, 2017, 5, 10839–10846 RSC.
- R. Mi, Y. Liu, L. Mei, X. Min, M. Fang, X. Wu, Z. Huang and C. Chen, Chem. Eng. J., 2023, 457, 141377 CrossRef CAS.
- S. Hariyani, X. Xing, M. Amachraa, J. Bao, S. P. Ong and J. Brgoch, Adv. Opt. Mater., 2023, 11, 2202689 CrossRef CAS.
- S. Kumar, J. Jagielski, N. Kallikounis, Y. H. Kim, C. Wolf, F. Jenny, T. Tian, C. J. Hofer, Y. C. Chiu, W. J. Stark, T. W. Lee and C. J. Shih, Nano Lett., 2017, 17, 5277–5284 CrossRef CAS.
- S. P. Lee, S. D. Liu, T. S. Chan and T. M. Chen, ACS Appl. Mater. Interfaces, 2016, 8, 9218–9223 CrossRef CAS.
- J. Qin, H. Zhang, B. Lei, H. Dong, Y. Liu, J. Meng, M. Zheng and Y. Xiao, J. Lumin., 2014, 152, 230–233 CrossRef CAS.
- Y. Li, Y. Zhou, X. Li, H. Wu, L. Zhao and W. Wang, Spectrochim. Acta, Part A, 2021, 252, 119548 CrossRef CAS.
- S. Zhang, B. Qiu, Z. Li, Y. Lv, X. Chen, H. Lian, Y. Hu and Y. Li, Chem. Eng. J., 2021, 426, 130734 CrossRef CAS.
- J. J. Joos, D. Van der Heggen, L. Martin, L. Amidani, P. F. Smet, Z. Barandiaran and L. Seijo, Nat. Commun., 2020, 11, 3647 CrossRef CAS PubMed.
- L. Sun, B. Devakumar, J. Liang, S. Wang, Q. Sun and X. Huang, J. Mater. Chem. C, 2019, 7, 10471–10480 RSC.
- R. C. Knighton, L. K. Soro, L. Frances-Soriano, A. Rodriguez-Rodriguez, G. Pilet, M. Lenertz, C. Platas-Iglesias, N. Hildebrandt and L. J. Charbonniere, Angew. Chem., Int. Ed., 2022, 61, e202113114 CrossRef CAS.
- G. Li, Y. Wang, W. Zeng, W. Chen, S. Han, H. Guo and Y. Li, J. Mater. Chem. C, 2016, 4, 3304–3312 RSC.
- L. Zhou, J. Hong, X. Li, J. Shi, P. A. Tanner, K. L. Wong and M. Wu, Adv. Opt. Mater., 2020, 8, 2000523 CrossRef CAS.
- Q. Ni, J. Huo, J. Liu, H. Yan, Q. Zhu, J. Li, C. Long and Q. Wang, Inorg. Chem. Front., 2022, 9, 6584–6595 RSC.
- Z. Lu, D. Sun, Z. Lyu, S. Shen, L. Wang, J. Wang, H. Zhao and H. You, J. Am. Ceram. Soc., 2022, 106, 1182–1193 CrossRef.
- Y. Xiao, Z. Hao, L. Zhang, X. Zhang, G.-H. Pan, H. Wu, H. Wu, Y. Luo and J. Zhang, J. Mater. Chem. C, 2018, 6, 5984–5991 RSC.
- P. Dang, G. Li, S. Liang, H. Lian and J. Lin, J. Mater. Chem. C, 2019, 7, 5975–5987 RSC.
- X. Ding, G. Zhu, W. Geng, M. Mikami and Y. Wang, J. Mater. Chem. C, 2015, 3, 6676–6685 RSC.
- L. Jiang, R. Pang, D. Li, W. Sun, Y. Jia, H. Li, J. Fu, C. Li and S. Zhang, Dalton Trans., 2015, 44, 17241–17250 RSC.
- D. Zhao, Y. Xue, R. Zhang, B. Liu, Y. Fan, S. Dai, S. Zhang and Z. Ma, Inorg. Chem. Front., 2020, 7, 667–677 RSC.
- X. Wu, R. Shi, J. Zhang, D. Wen, Z. Qiu, X. Zhang, W. Zhou, L. Yu and S. Lian, Chem. Eng. J., 2022, 429, 132225 CrossRef CAS.
- F. Meng, Z. Dehouche, T. G. Ireland and G. R. Fern, Prog. Photovoltaics, 2019, 27, 640–651 CAS.
- W. Zhao, S. Gao, S. An, B. Fan and S. Li, Chin. Sci. Bull., 2012, 57, 4513–4516 CrossRef CAS.
- N. Wang, T. Li, L. Han, Y. Wang, Z. Ci, Y. Wang and H. Jiao, J. Mater. Sci., 2019, 54, 6434–6450 CrossRef CAS.
- C. Zhong, Y. Xu, X. Wu, S. Yin, X. Zhang, L. Zhou and H. You, J. Mater. Chem. C, 2023, 11, 3375–3385 RSC.
- J. Yang, P. He, Y. Xie, Q. Chen, Q. Dong, W. Nie, F. Yang, W. Wang, F. Du, J. Peng and X. Ye, J. Alloys Compd., 2022, 903, 163815 CrossRef CAS.
- S. Miao, Y. Liang, D. Chen, S. Yan, J. Liu, W. Wang and J. Bi, J. Mater. Chem. C, 2022, 10, 14211–14219 RSC.
- S. Wu, P. Xiong, Q. Liu, Y. Xiao, Y. Sun, E. Song and Y. Chen, Adv. Opt. Mater., 2022, 10, 2201718 CrossRef CAS.
- Y. Zhang, S. Miao, Y. Liang, C. Liang, D. Chen, X. Shan, K. Sun and X. J. Wang, Light: Sci. Appl., 2022, 11, 136 CrossRef CAS.
- I. Carrasco, F. Piccinelli and M. Bettinelli, J. Phys. Chem. C, 2017, 121, 16943–16950 CrossRef CAS.
- T. Zhang, X. Jiang, R. Chen, B. Liu, W. Yang, C. Li, H. Lin, H. Liu, C. Li, F. Zeng and Z. Su, Inorg. Chem. Front., 2022, 9, 6418–6424 RSC.
- J. Zhang, X. Zhang, J. Zhang, W. Ma, X. Ji, S. Liao, Z. Qiu, W. Zhou, L. Yu and S. Lian, J. Mater. Chem. C, 2017, 5, 12069–12076 RSC.
- R. Cao, D. Peng, H. Xu, S. Jiang, Z. Luo, H. Ao and P. Liu, J. Lumin., 2016, 178, 388–391 CrossRef CAS.
- J. Zhong, D. Chen, Y. Yuan, L. Chen, H. Yu and Z. Ji, Chem. Eng. J., 2017, 309, 795–801 CrossRef CAS.
- J. Li, X. Zhou, J. Ding, X. Zhou and Y. Wang, J. Mater. Chem. C, 2019, 7, 2257–2266 RSC.
- Z. Liao, H. Xu, W. Zhao, H. Yang, J. Zhong, H. Zhang, Z. Nie and Z.-K. Zhou, Chem. Eng. J., 2020, 395, 125060 CrossRef CAS.
- X. Qin, X. Liu, W. Huang, M. Bettinelli and X. Liu, Chem. Rev., 2017, 117, 4488–4527 CrossRef CAS PubMed.
Footnote |
| † Electronic supplementary information (ESI) available. See DOI: https://doi.org/10.1039/d3tc01717f |
| This journal is © The Royal Society of Chemistry 2023 |

