 Open Access Article
Glassy and liquid Sb2S3: insight into the structure and dynamics of a promising functional material†
Mohammad
Kassem
a,
Chris J.
Benmore
b,
Andrey
Tverjanovich
 c,
Takeshi
Usuki
d,
Maxim
Khomenko
e,
Daniele
Fontanari
a,
Anton
Sokolov
 a,
Koji
Ohara
 f,
Maria
Bokova
 a,
Shinji
Kohara
 g and
Eugene
Bychkov
 *a
*a
aLaboratoire de Physico-Chimie de l’Atmosphère, Université du Littoral Côte d’Opale, 59140 Dunkerque, France. E-mail: bychkov@univ-littoral.fr
bX-ray Science Division, Advanced Photon Source, Argonne National Laboratory, Argonne, Illinois 60439, USA
cInstitute of Chemistry, St. Petersburg State University, 198504 St. Petersburg, Russia
dFaculty of Science, Yamagata University, Yamagata 990-8560, Japan
eILIT RAS-Branch of the FSRC “Crystallography and Photonics” RAS, 140700 Shatura, Moscow Region, Russia
fResearch and Utilization Division, Japan Synchrotron Radiation Research Institute, 1-1-1 Kouto, Sayo, Hyogo 679-5198, Japan
gQuantum Beam Field, Research Center for Advanced Measurement and Characterization, National Institute for Materials Science, 1-2-1 Sengen, Tsukuba, Ibaraki 305-0047, Japan
First published on 21st March 2023
Abstract
Antimony sesquisulfide Sb2S3 has become an outstanding advanced functional material in a variety of rapidly growing application fields: smart integrated photonics from the visible to telecom window, cost-efficient photovoltaics, energy storage and transformation. Rational design and tailoring of the required components need a deep insight into the atomic structure and dynamics of liquid and amorphous Sb2S3, but detailed information is missing in contrast to crystalline counterparts. Using high-energy X-ray diffraction and Raman spectroscopy over an extended temperature range, supported by first-principles simulations as well as by electrical and thermal studies, we show that the high optical and electric contrast between the SET (crystalline) and RESET (amorphous) logic states is related to the different short and intermediate range order in orthorhombic and vitreous Sb2S3. It includes strong asymmetry of the Sb–S nearest neighbor distances and a different coordination of antimony sites in the crystal vs. a distorted trigonal environment of defect octahedral SbS3 entities in glassy Sb2S3. A fast crystallization rate at elevated temperatures in liquid antimony sesquisulfide is related to the enhanced fragility, approaching that of telluride phase-change materials, and to a large fraction of ABAB squares (A: Sb; B: S), combined with a remarkable slowdown of the diffusion processes in the vicinity of the glass transition temperature, ensuring good retention of the amorphous state. Further improvements may be achieved using anionic (Se) or cationic (Bi) substitution that decreases the temperature of a semiconductor–metal transition and allows bandgap engineering, important for both photonics and photovoltaics.
1. Introduction
Antimony sesquisulfide Sb2S3 appears to be an emerging and promising advanced functional material for a variety of rapidly growing application fields:(1) Wide gap phase-change materials (PCM) for both electrically and light tunable visible photonics or ultralow loss photonics at telecommunication wavelengths. Sb2S3 can be used for smart reprogrammable photonic systems with a nanosecond switching time, holographic and nonvolatile ultrathin displays of extremely high resolution, integrated photonic circuits, switchable metasurfaces and varifocal metalenses, nanophotonic and on-chip devices, dielectric nanoantennas, etc.1–6
(2) High-performance composite anodes for sodium and lithium batteries. Antimony sesquisulfide nanorods, nanoparticles and powders, sometimes combined with other sulfides and encapsulated into a doped carbon matrix or activated carbon, provide superior rate capability, excellent cyclic stability and capacity retention, as well as fast-charging capacity and highly decreased interfacial resistance.7–10
(3) Alternative absorber materials for thin-film solar cells. Antimony sulfide thin films belong to emerging earth-abundant low-cost photovoltaic materials having a reasonable optical bandgap, tremendous low-light harvesting, and excellent moisture and air stability.11,12
(4) Thermoelectric materials. The high thermoelectric power of Sb2S3 seems to be promising for thermoelectric applications.13 However, nanostructured or amorphous antimony sesquisulfide is mostly used as a dopant decreasing the thermal conductivity and increasing the Seebeck coefficient of composite thermoelectrics (lead chalcogenides, (Bi,Sb)2Te3, etc.) yielding a significantly enhanced figure of merit zT.14,15
Rational design and tailoring of optimized functional materials based on Sb2S3 need a deep insight into the atomic structure and dynamics of antimony sesquisulfide. The crystal structure of Sb2S3 has been extensively studied both under ambient conditions16–18 and under high pressure.19–26 Nevertheless, the atomic structure of vitreous and liquid antimony sesquisulfide is largely unknown except for classical X-ray diffraction studies of glassy Sb2S3 reported forty years ago and suffering from a limited accessible Q-range and insufficient r-space resolution.27–29 In the case of PCM applications,30–32 special attention should be paid to the origin of a high optical and electric contrast between the SET (crystalline) and RESET (amorphous) logic states since antimony sesquisulfide differs considerably from the benchmark telluride PCM (GeTe-Sb2Te3, GST, or doped Sb2Te) in both chemical bonding and local antimony environments. The metavalent bonding33 seems to be missing in Sb2S3; and the four-fold coordinated antimony sites, present in GST and a-Sb2Te3,34,35 were not observed in vitreous Sb2S3,27–29 even though there is a controversy in amorphous tellurides related to the antimony local order.36,37
Using high-energy X-ray diffraction and Raman spectroscopy supported by first-principles simulations, we will unravel a detailed structural organization of bulk glassy and liquid Sb2S3 over an extended temperature range, 298 ≤ T ≤ 1143 K. Thermal properties and electrical conductivity measurements will also be provided showing a remarkable contrast in electronic properties between amorphous, crystalline and liquid states. Finally, the diffusion coefficients and viscosity of liquid Sb2S3 will be computed and compared with known experimental data, which reveal a significant fragility of molten antimony sesquisulfide in comparison with canonical dielectric As2S3. All these results will explain the promising PCM performance of Sb2S3 and an overall trend in functional properties going down the periodic table.
2. Experimental and methods
2.1 Glassy and nanocrystalline Sb2S3 preparation
A two-step synthesis was applied for glassy Sb2S3. First, a crystalline sample was prepared from high-purity antimony (99.999%, Cerac) and sulfur (99.999%, Alfa Aesar) in an evacuated and sealed silica tube. Then, a small quantity of c-Sb2S3 was placed in a thin-walled silica capillary, evacuated to 10−4 mbar and sealed. The capillary was slowly heated in a furnace to 1050 K and kept at this temperature for one hour with subsequent cooling to 900 K. After an additional equilibration step for at least 30 minutes, the sample was splat-quenched under an argon atmosphere onto a fused silica plate cooled down to ≈80 K. Nanocrystalline nc-Sb2S3 was obtained by fast cooling in a silica capillary but without splat-quenching, that is, the estimated cooling rate was ≲1000 K s−1.2.2 Thermal and electrical measurements
A TA instruments Q200 thermal analyzer was used for differential scanning calorimetry (DSC). The synthesized samples of 3–5 mg were encapsulated in a sealed aluminum pan and heated at a rate of 10 K min−1 under a dry nitrogen atmosphere to determine the glass transition Tg and crystallization temperatures. The ac and dc conductivity measurements were done over the 330 ≤ T ≤ 450 K temperature range. A Hewlett Packard 4339B high resistance meter with applied voltage of 100 volts was used for the dc experiments. The ac conductivity over the 100 Hz to 15 MHz frequency range was measured using a Hewlett Packard 4194A impedance meter.2.3 Raman spectroscopy measurements
A LabRam HR microRaman spectrometer (Jobin Yvon Horiba Group) was used for the measurements at room temperature. Raman scattering was excited by a 785 nm solid-state laser and recorded in the 50–850 cm−1 spectral range. The laser power was 0.75 mW. Two to three spectra were registered for each sample at different positions to verify the sample homogeneity and the absence of photoinduced phenomena. Raman spectra over the temperature range 293 ≤ T ≤ 873 K were measured using a Senterra Raman spectrometer (Bruker) equipped with a microscope and a Linkam TS1000 hot stage. The spectra were excited by a 785 nm laser diode with a power of 1 mW and recorded in the 75–1500 cm−1 spectral range (reliable data above 100 cm−1). Glassy Sb2S3 was placed in a silica tube (2 mm ID/3 mm OD, length 25 mm) and sealed under vacuum.2.4 High-energy X-ray diffraction
The 6-ID-D beamline at the Advanced Photon Source (Argonne National Laboratory, Chicago) was used for high-energy X-ray diffraction measurements under ambient conditions and as a function of temperature. The photon energy was 99.9593 keV, and the wavelength was 0.124035 Å. A two-dimensional (2D) setup was used for data collection with a Varex area detector, 2880 × 2880 pixels, and a pixel size of 150 × 150 μm2. The sample-to-detector distance was 287.7 mm for a room-temperature setup, and 334.9 mm for furnace measurements over the 673 ≤ T ≤ 1143 K temperature range on cooling. Cerium dioxide was used as a calibrant. The exposure time was 0.2 s × 1500 frames, using one dark-field image file followed by five light files. Glass samples were fixed on a Kapton tape for the room temperature measurements. A Sb2S3 sample in evacuated silica tube (2 mm ID/3 mm OD) was used for the furnace experiments. The 2D diffraction patterns were reduced using the Fit2D software.38 The measured background intensity (either the Kapton tape or the empty silica at various temperatures) was subtracted, and corrections were made for the different detector geometries and efficiencies, sample self-attenuation, and Compton scattering using standard procedures,39 providing the X-ray structure factor SX(Q).| SX(Q) = wSbSb(Q)SSbSb(Q) + wSbS(Q)SSbS(Q) + wSS(Q)SSS(Q), | (1) |
Canonical As2S3 glass and liquid were also additionally measured at the BL04B2 beamline of the SPring-8 facility (Hyogo Prefecture, Japan) using a dedicated two-axis diffractometer equipped with four CdTe detectors at low angles and three Ge diodes at high diffraction angles.40 The temperature measurements were carried out from 300 to 1223 K in a furnace. The 7-detector setup and incident X-ray energy of 112.6386 keV allows the diffraction pattern to be collected up to Q = 30 Å−1 with a high signal-to-noise ratio and sufficient energy resolution to discriminate both fluorescence from the sample and higher harmonic reflections from the monochromator crystal. The empty silica tube at different temperatures was also measured and used for background intensity subtraction. Further data analysis included absorption, Compton scattering, and polarization corrections using standard procedures41 giving the total X-ray structure factor of SX(Q).42,43
2.5 First-principles simulations
The DFT calculations of vibrational spectra were carried out using Gaussian 16 software.44 The structural optimization and harmonic vibrational frequency calculations were performed for size-limited clusters: SbSb3H3, SbS3H3, Sb2S4H2 (chair and boat conformations), Sb2S5H4, Sb2S6H4, Sb3S6H3, Sb6S12H6, Sb12S18H2, and Sb12S16. The Becke three-parameter hybrid exchange functional45 and the Lee–Yang–Parr correlation functional (B3LYP)46 were used for these simulations. The small-core relativistic pseudopotential basis set (cc-pVTZ-PP)47 and the effective core potentials48 were applied for cluster geometry optimization and Raman intensity calculations. Most of the structures were optimized using the tight convergence option ensuring adequate convergence and reliability of computed wavenumbers. An extra quadratically convergent self-consistent field procedure49 was used for difficult convergence cases. Further details of the DFT simulations are reported elsewhere.50–52Modeling of the diffraction data was carried out using Born–Oppenheimer molecular dynamics implemented within the CP2K package.53 The generalized gradient approximation (GGA) and the PBE0 hybrid54,55 exchange–correlation functional combining the exact Hartree–Fock and DFT approaches were used, providing better agreement with experiment.56–59 The Grimme dispersion corrections D3BJ60 were also employed, improving first-principles molecular dynamics (FPMD) results for chalcogenide systems.61,62 The applied FPMD technique was similar to previous reports.34,63 The initial atomic configurations for vitreous Sb2S3 were created and optimized using the RMC_POT++ code64 against the experimental SX(Q). The size of the cubic simulation box, containing 200 atoms (80 Sb and 120 S), was chosen to match the experimental density. Further optimization was carried out using DFT, applying the molecularly optimized correlation consistent polarized triple-zeta valence basis set along with the norm-conserving relativistic Goedecker–Teter–Hutter-type pseudopotentials.65 FPMD simulations were performed using a canonical NVT ensemble with a Nosé–Hoover66,67 thermostat. The simulation boxes were heated from 300 K to 900 K using 100 K steps for 20–25 ps each. At 900 K (above melting), the systems were equilibrated for 70 ps and cooled down to 300 K using the same temperature steps but with a longer simulation time (25–45 ps). Final equilibration and data collection at 300 K were performed for 59 ps. Additional simulations were carried out between 850 and 1150 K (step 100 K for 40–50 ps each) consistent with the experimental data. The connectivity and ring statistics were analyzed using the R. I. N. G. S. package68 and a modified connectivity program.69 The pyMolDyn code70 applying the Dirichlet–Voronoi tessellation was used for the calculation of microscopic voids and cavities.
3. Results and discussion
3.1 Glass-forming, thermal and electric properties
Glassy antimony sesquisulfide was reported to be a difficult material to vitrify.27 Nevertheless, the applied splat-quenching technique56 in thin-walled silica capillaries allows fully vitreous small droplets of g-Sb2S3 to be obtained. Typical DSC traces for glassy Sb2S3 and canonical g-As2S3 are shown in Fig. 1. The two end-members are consistent with the reported thermal properties for (Sb2S3)x(As2S3)1−x pseudo-binaries, x ≤ 0.9:71–73 the glass transition temperature Tg monotonically increases with x from 472 K (x = 0) to 492 K (x = 1), the exothermic crystallization feature emerges above x = 0.5, grows and shifts toward lower T, emphasizing the increasing crystallization ability.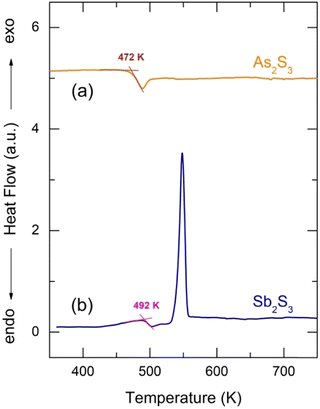 | ||
| Fig. 1 DSC traces of glassy (a) As2S3 and (b) Sb2S3. The derived glass transition temperatures are also indicated. | ||
The conductivity temperature dependences σ(T) for glassy and crystalline (this work), and molten74 Sb2S3 are shown in Fig. 2 using an Arrhenius plot:
σ(T) = σ0![[thin space (1/6-em)]](https://www.rsc.org/images/entities/char_2009.gif) exp(−Ea/kBT), exp(−Ea/kBT), | (2) |
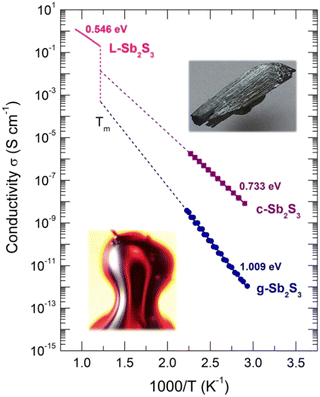 | ||
| Fig. 2 Conductivity σ(T) of glassy (g), crystalline (c) samples (this work), and liquid L-Sb2S3.74 The inserts show g-Sb2S3 and c-Sb2S3. | ||
3.2 Nanocrystalline Sb2S3
An insufficiently rapid quenching rate or wrong starting temperature for splat-cooling yields a nanocrystalline alloy, which is slightly different from the stable orthorhombic polymorph, space group Pnma.16 The observed Bragg peaks mostly correspond to orthorhombic antimony sesquisulfide, but we should note slight deviations of the peak positions and their different amplitudes compared to the reference compound (Fig. 3(a)). Besides, a non-negligible amorphous fraction is also present and possibly some traces of monoclinic high-T Sb2S3 polymorph, which is metastable at room temperature.18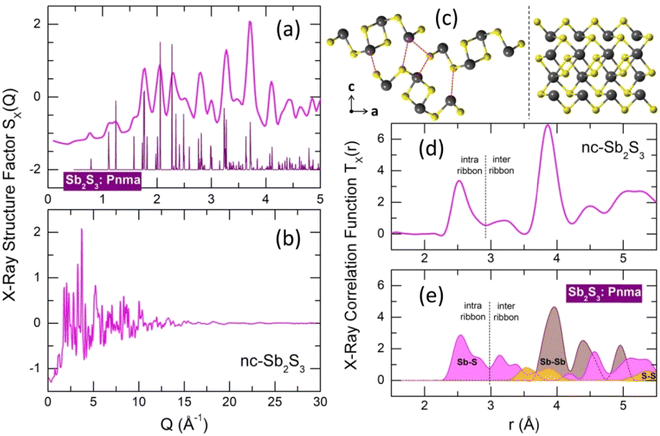 | ||
| Fig. 3 Nanocrystalline (nc) and orthorhombic Sb2S3. (a) Bragg peaks of the nanocrystalline sample in comparison with the orthorhombic polymorph,16 space group Pnma; (b) X-ray structure factor SX(Q) over the entire Q-range; (c) (Sb4S6)∞ ribbons in orthorhombic Sb2S3: left, atomic arrangements using projection on the (a,c) plane, right, a single ribbon oriented parallel to the b axis; (d) X-ray total correlation function TX(r) of nc-Sb2S3; (e) Sb–S (magenta), Sb–Sb (light brown) and S–S (yellow) Tij(r) partials for orthorhombic Sb2S3. The dashed red lines in (c), left panel, show the shortest inter-ribbon Sb–S distances (3.167–3.642 Å). The black dashed lines in (d and e) separate intra- (2.455–2.854 Å) and inter-ribbon Sb–S nearest contacts. | ||
The X-ray total correlation function TX(r) of nanocrystalline Sb2S3, Fig. 3(d), obtained by the usual Fourier transform of the structure factor SX(Q), Fig. 3(b),
 | (3) |
where M(Q) is a modification function and ρ0 is the experimental number density, confirms characteristic differences between nanocrystalline and orthorhombic antimony sesquisulfides. The latter is formed by infinite quasi one-dimensional (1D) (Sb4S6)∞ ribbons oriented parallel to the b axis, Fig. 3(c). The inner Sb(II) atoms have 5 sulfur neighbors forming a distorted square pyramid with Sb(II) species located 0.17 Å below the basal plan of the pyramid. The outer Sb(I) counterparts reside at the apex of trigonal SbS3 units connected by two-fold sulfur at the ribbon periphery and three-fold sulfur toward Sb(II) and the ribbon interior. The average intra-ribbon antimony coordination appears to be 〈NintraSb–S〉 = 4 while their sulfur neighbors have 〈NintraS–Sb〉 = 2.67. The Sb(II)–S nearest neighbor (NN) distances reveal a strong Peierls distortion, r5FSb(II)–S = 2.70 ± 0.16 Å, while the intra-ribbon contacts for trigonal Sb(I) are uniform, r3FSb(I)–S = 2.53 ± 0.01 Å. The 1D-(Sb4S6)∞ entities are held together by rather strong inter-ribbon forces forming puckered sheets within the (a,c) plane. The shortest Sb–S inter-ribbon distances, 3.167 ≤ rinterSb–S ≤ 3.642 Å, are smaller than the sum of the van der Waals radii, rvdWS = 1.8 Å and rvdWSb = 2.2 Å,80 but larger than the Sb–S intra-ribbon NN contacts, 2.455 ≤ rintraSb–S ≤ 2.854 Å. The intra- and inter-ribbon separations are well distinguished using the TSbS(r) partials for both orthorhombic and nanocrystalline Sb2S3, Fig. 3(d and e). The main difference between the two forms resides in the inter-ribbon connectivity. On average, each antimony in orthorhombic Sb2S3 has three short Sb–S inter-ribbon contacts, 〈NinterSb–S〉 = 3, while the connectivity in nc-Sb2S3 is reduced, 〈NinterSb–S〉 ≈ 1.5. In other words, the 1D-(Sb4S6)∞ ribbons are becoming more isolated in the nanocrystalline lattice.
3.3 Raman spectroscopy and DFT modeling
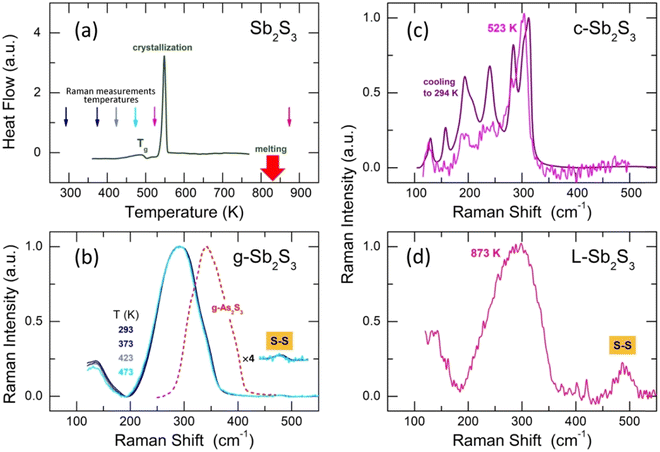
Typical Raman spectra of glassy Sb2S3 as a function of temperature are shown in Fig. 4(b). The temperatures between 293 ≤ T ≤ 423 K correspond to the solid glass, Fig. 4(a). Above Tg = 492 K, the supercooled liquid rapidly crystallizes at 523 K, Fig. 4(c), just in the vicinity of the DSC crystallization onset. Cooling down the crystallized sample, one obtains a typical spectrum of orthorhombic Sb2S3, characterized by multiple Raman-active modes Γ = 10Ag + 5B1g+ 10B2g + 5B3g, expected for the Pnma polymorph.81 Usually, about ten modes are clearly distinguishable.20,21,26The Raman spectrum of L-Sb2S3 at 873 K appears to be reminiscent of its glassy counterpart, Fig. 4(d), except for a strong S–S stretching at 490 cm−1. Assuming a dissociation reaction 2Sb−S ⇄ Sb–Sb + S–S, we also should expect a broad Sb–Sb stretching at ≈145 cm−1 as in amorphous antimony,82,83 also confirmed by DFT modeling (Fig. S2, ESI†). A low-frequency vibration feature below 180 cm−1 may contain both Sb–S bending and Sb–Sb stretching. We should however note that the appearance of intense S–S stretching in liquid Sb2S3 can be a transient phenomenon. Previously, both sulfur and antimony were detected on heating or laser-induced processing of amorphous Sb2S3 thin films, partly as intermediate species.84–87 A limited accessible temperature range for our in situ Raman measurements does not enable further experiments at higher T. Nevertheless, temperature-dependent dynamics on melting was observed over a limited T-range, Fig. S3 (ESI†).
Basically, a broad asymmetric unresolved feature centered at  in glassy Sb2S3 is similar to that in g-As2S3
 but shifted to lower frequencies, Fig. 4(b), roughly scaling with the molecular mass ratio,
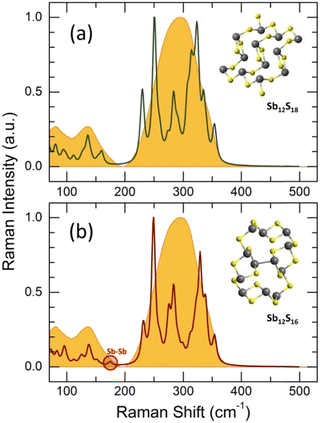
  . Amorphous a-Sb2S3 thin films and antimony-containing bulk sulfide glasses reveal similar vibrational features.2,88–92 Assuming trigonal antimony local coordination27 and the above resemblance in Raman spectra, various DFT simulations have been carried out. Isolated pyramidal units SbS3H3, corner- CS-Sb2S5H4 and edge-sharing ES-Sb2S4H2 dimers of different conformation, and small rings, Sb3S6H3 or Sb6S12H6, systematically reveal overestimated Sb–S stretching frequencies, centered at 320 ≤ 〈νSb–Smax〉 350 ≤ cm−1, Fig. S4 (ESI†). Reasonable results yield complicated clusters Sb12S18H2 and Sb12S16, originating from the modified ribbons in orthorhombic Sb2S3 but with exclusively trigonal antimony coordination, Fig. 5. Both symmetric and asymmetric stretching frequencies, as well as low-frequency bending and deformation modes below 190 cm−1 are well reproduced by these clusters. As expected, the Sb–Sb stretching in Sb12S16 is overlapping with the Sb–S bending and deformation making it impossible to distinguish these vibrations experimentally. In contrast, the S–S stretching at 490 cm−1 is clearly visible in Raman scattering, Fig. 4(b and d), and confirmed by DFT simulations, Fig. S4 (ESI†), cluster Sb2S6H4. The geometry of DFT-optimized size-limited clusters is consistent with crystalline references and glassy Sb2S3, Fig. S5 and S6 (ESI†), specifically that of Sb12S18H2 and Sb12S16.
Raman spectroscopy measurements show that the glass structure hardly evolves at T ≲ Tg; a negligible red shift of the Sb–S stretching envelope can only be observed, Fig. 4(b). The rapid crystallization above Tg seems to be related to the presence of modified structural motifs originating from the (Sb4S6)∞ entities, although the Sb(II) species lose their 5-fold coordination in the glass. Further insight into the atomic glass structure yields high-energy X-ray diffraction supported by first-principles molecular dynamics (FPMD).
3.4 High-energy X-ray diffraction over the extended temperature range
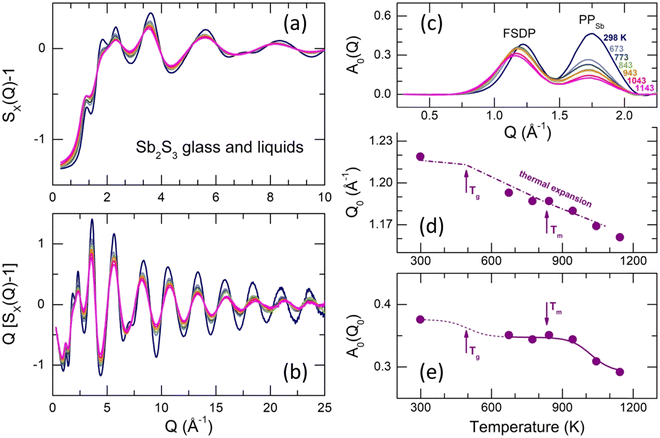
Typical X-ray structure factors SX(Q) for g-Sb2S3, supercooled (673–773 K) and normal (T ≥ 843 K) liquids are shown in Fig. 6(a and b). The SX(Q)s exhibit well-defined oscillations up to 30 Å−1, ensuring high-resolution in the r-space. The oscillations amplitude decreases with increasing temperature but more significant changes are observed at low Q ≲ 5 Å−1.Except for the distinct first sharp diffraction peak (FSDP) at Q0 = 1.22 Å−1, which is typical for a large majority of chalcogenide glasses (see, for example, Fig. S7 (ESI†) for glassy and liquid As2S3), vitreous Sb2S3 reveals an additional low-Q feature at QSb = 1.75 Å−1, specific for antimony, which emerges and increases in glassy (Sb2S3)x(As2S3)1−x pseudo-binaries with increasing x.71 Later, we will see that the 1.75 Å−1 feature corresponds to the principle peak PPSb in the Sb–Sb partial structure factor SSbSb(Q), diverging from that in the SSS(Q) partial at QS = 2.24 Å−1 because of a large difference in atomic size of antimony and sulfur, whose covalent radii are rSb = 1.45 Å and rS = 1.03 Å.93,94 The FSDP and PPSb are more visible after removing the background underneath the low-Q features using the subtraction procedure,95,96Fig. 6(c).
The FSDP amplitude A0(Q0) slightly decreases in intensity with increasing T and shifts to lower Q, Fig. 6(c). In contrast, changes in the PPSb amplitude are more significant (especially between the solid glass and liquids) and similar to other peaks and distant oscillations, Fig. 6(a and b). In addition, these temperature changes are characteristic for chalcogenide glasses and liquids, while the FSDP behaves differently. In particular, the FSDP position Q0(T) for Sb2S3 follows the thermal expansion, Q0(T) ∝ ρ(T)1/3,97 where ρ(T) is the macroscopic number density.
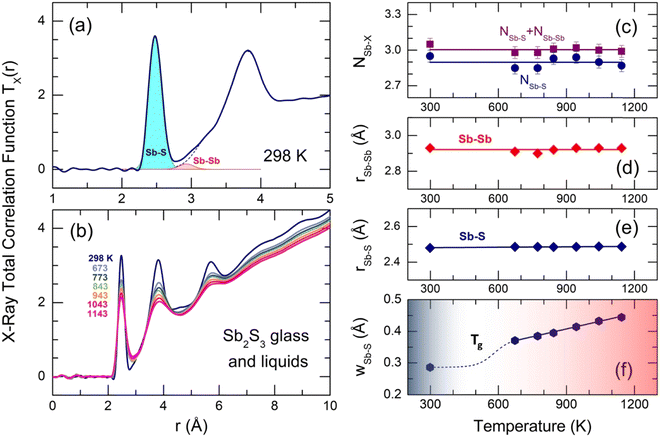
The X-ray total correlation functions TX(r) for glassy and liquid Sb2S3, obtained by the usual Fourier transform of SX(Q), are shown in Fig. 7. The first peak at 2.484 ± 0.004 Å corresponds to Sb–S nearest neighbors followed by a strongly asymmetric second neighbor (2nd N) peak at 3.83 ± 0.02 Å with additional unresolved correlations between 2.8 and 3.4 Å. The third distinct feature at 5.7 Å seems to be related to a center-center distance between the Sb–S entities. All peaks become less intense and broader with increasing temperature, also leading to a stronger overlapping between NN and second neighbor correlations. More distant broad peaks at 7.3 and 9 Å appear to be hardly visible in L-Sb2S3. Gaussian fitting of the NN and 2nd N correlations is inappropriate because of the peak asymmetry. Typical fitting with asymmetric functions is shown in Fig. 7(a) and yields reasonable results. The average antimony coordination NSb–X, where X = S and/or Sb, was found to be trigonal and consisting of two contributions, NSb–X = NSb–S + NSb–Sb = 2.90(5) + 0.10(5) (Fig. 7(c), and see also Table 1). The Sb–S and Sb–Sb NN distances slightly increase with temperature; both interatomic separations, rSb–S = 2.484 ± 0.004 Å and rSb–Sb = 2.92 ± 0.02 Å, are consistent with crystalline and amorphous references for trigonal antimony sulfides and elemental Sb.16–18,93,98 Typical broadening of the Sb–S NN feature as a function of temperature is shown in Fig. 7(f). Both supercooled and normal liquids Sb2S3 exhibit a monotonic increase of wSb–S(T).
| Temperature (K) | S–S | Sb–S | Sb–Sb | |||
|---|---|---|---|---|---|---|
| r S–S (Å) | N S–S | r Sb–S (Å) | NSb–S | r Sb–Sb (Å) | NSb–Sb | |
| High-energy X-ray diffraction | ||||||
| 298 | — | — | 2.480(6) | 2.95(4) | 2.93(2) | 0.10(5) |
| 673 | — | — | 2.486(6) | 2.85(4) | 2.91(2) | 0.13(5) |
| 773 | — | — | 2.486(6) | 2.85(4) | 2.90(2) | 0.13(5) |
| 843 | — | — | 2.485(6) | 2.93(4) | 2.92(2) | 0.08(5) |
| 943 | — | — | 2.486(6) | 2.94(4) | 2.93(2) | 0.08(5) |
| 1043 | — | — | 2.488(6) | 2.90(4) | 2.93(2) | 0.10(5) |
| 1143 | — | — | 2.487(6) | 2.87(4) | 2.93(2) | 0.12(5) |
| First-principles molecular dynamics | ||||||
| 300 | 2.07 | 0.07 | 2.471 | 2.93 | 2.90 | 0.10 |
| 700 | 2.07 | 0.08 | 2.474 | 2.88 | 2.90 | 0.12 |
| 800 | 2.07 | 0.08 | 2.478 | 2.89 | 2.90 | 0.12 |
| 850 | 2.07 | 0.08 | 2.478 | 2.92 | 2.91 | 0.12 |
| 950 | 2.07 | 0.08 | 2.482 | 2.91 | 2.91 | 0.13 |
| 1050 | 2.08 | 0.08 | 2.480 | 2.95 | 2.90 | 0.13 |
| 1150 | 2.07 | 0.08 | 2.478 | 2.94 | 2.90 | 0.13 |
3.5 First-principles molecular dynamics modeling of glassy and liquid Sb2S3
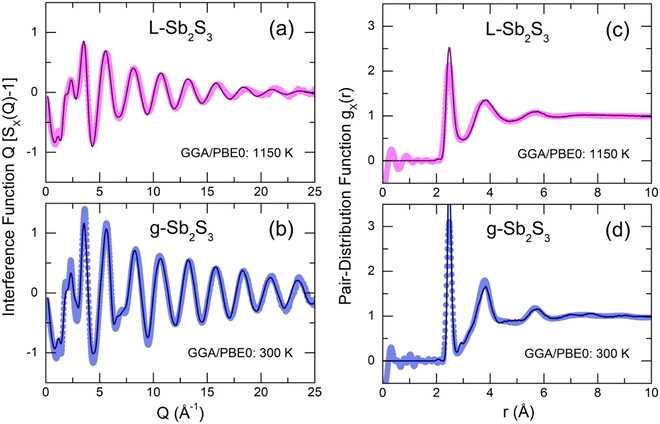
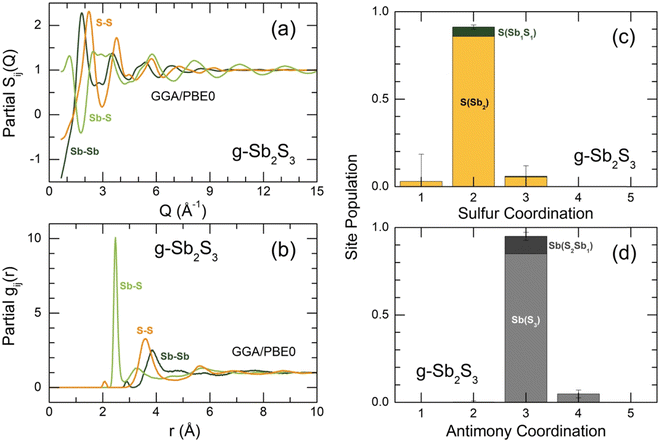
The derived FPMD interference functions Q[SX(Q) − 1] and pair-distribution functions gX(r) for the two extremes in experimental series at 300 and 1150 K are shown in Fig. 8. As reported earlier,56–59 the FPMD with hybrid functional PBE0 yields good agreement with experimental data for chalcogenide systems. The FPMD replicas in Q-space reproduce well both the positions and amplitudes of oscillations for Q[SX(Q) − 1], Fig. 8(a,b). As a result, the derived interatomic distances in r-space are also consistent with the diffraction results, Fig. 8(c,d). In contrast, FPMD modeling with the standard functional PBE suffers from over- or underestimated correlations in Q- and r-space as shown in Fig. S8 (ESI†).The partial structure factors Sij(Q) and pair-distribution functions gij(r) are revealed in Fig. 9(a and b). We note divergent positions of PPSb and PPS for the SSbSb(Q) and SSS(Q) partials, as well as a negative amplitude of SSbS(Q) in this range, explaining the appearance of an additional low-Q feature at QSb = 1.75 Å−1 in the X-ray structure factor discussed above, Fig. 6(a–c). Astonishingly, the FSDP origin appears to be related to Sb–S correlations instead of the expected Sb–Sb counterparts. We note, however, that in glassy As2S3, the FSDP origin changes from As–As (major contribution) and As–S (minor component) at ambient pressure to mostly As–S correlations above 4 GPa, Fig. S9 (ESI†).
The partial pair-distributions gij(r) are consistent with experimental findings. The Sb–S NN peak at 2.477 ± 0.004 Å exhibits an asymmetric shape, increasing with temperature, Fig. S10 (ESI†). The fitting with asymmetric functions yields very similar results to the experimental data, 〈NSb–S〉 = 2.91 ± 0.03, and the antimony local trigonal coordination is completed by the Sb–Sb nearest neighbors at 2.903 ± 0.002 Å, 〈NSb–Sb〉 = 0.12 ± 0.01, Table 1. The Sb–S second neighbors are located rather close to the Sb–S NN correlations and overlap significantly with increasing temperature despite the shift of r2ndSb–S to higher distances from 3.36 Å (300 K) to 3.51 Å (1150 K), mostly because of a strong broadening of the NN and 2nd N correlations, Fig. S10 (ESI†).
The gSS(r) partial also shows S–S homopolar bonds at 2.07 Å, Fig. 9(b), 〈NS–S〉 = 0.08 ± 0.01, Table 1. The Raman spectroscopy confirms this result, Fig. 4(b). Nevertheless, their concentration is too low to be observed by high-energy X-ray diffraction. In particular, Fig. 8(c and d) reveals that the S–S FPMD diffraction features are less intense compared to the experimental noise of gX(r).
Sulfur and antimony coordination distributions are plotted in Fig. 9(c and d). As expected, the overwhelming majority of the two species have a two-fold (91%) and trigonal (95%) local coordination, respectively. With increasing temperature, the population of two-fold sulfur and three-fold antimony decreases, while the fractions of under- and over-coordinated species grow, Fig. S11 (ESI†). The number of sulfur or antimony local configurations with homopolar bonds, that is, S(Sb1S1) instead of S(Sb2) or Sb(S2Sb1) vs. Sb(S3) remains low at all temperatures.
The bond angle distributions B(θ) for S–Sb–S and Sb–S–Sb triplets in glassy Sb2S3 are plotted in Fig. 10 in comparison with two crystalline counterparts: orthorhombic and monoclinic Sb2S3. The geometry of SbS3 trigonal pyramids is different from that in canonical g-As2S3; the maximum of a broad asymmetric distribution BSSbS(θ) is located at 87° opposite to 98° in arsenic sesquisulfide,99 ensuring a more compact local structure of g-Sb2S3. Roughly speaking, SbS3 pyramids can be considered as distorted defect octahedral entities, whose three missing Sb–S bonds became excessively long, and the corresponding sulfur species were transformed into the second neighbors. The above-mentioned fitting of TSbS(r) partials, Fig. S10 (ESI†), is consistent with this hypothesis, revealing three 2nd N correlations at ≈3.4 Å. The remnants of octahedral geometry are also evidenced by a weak contribution at θ ≈ 160°. The BSSbS(θ) distributions in orthorhombic and monoclinic polymorphs are rather similar to that in the glass, especially in the high-temperature C2/c form, including a low-intensity component at 168 ± 4° of four-fold coordinated Sb(5)/Sb(6) species.18 The 5-fold coordinated Sb(II) atoms in orthorhombic Sb2S3 yield an intense contribution at θ ≈ 171°.16
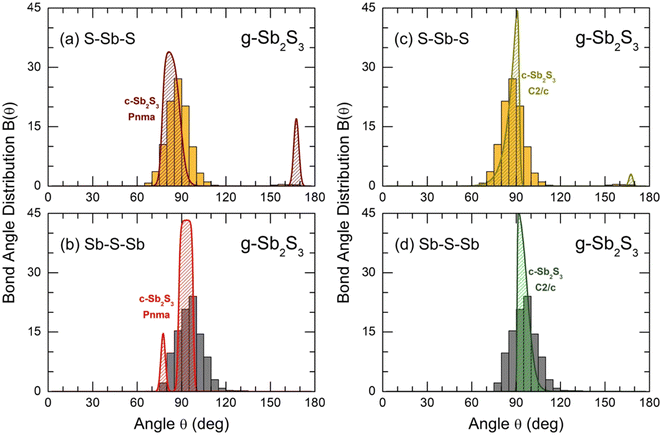 | ||
| Fig. 10 Bond angle distributions B(θ) for glassy Sb2S3: (a) S–Sb–S and (b) Sb–S–Sb angles in comparison with orthorhombic Sb2S3, space group Pnma;16 and (c) S–Sb–S and (d) Sb–S–Sb in comparison with monoclinic Sb2S3, space group C2/c.18 | ||
The connectivity of trigonal pyramids, reflected by BSbSSb(θ) peaked at 97°, also appeared to be in favor of a more compact structure of glassy Sb2S3 compared to canonical g-As2S3. The BAsSAs(θ) distribution in the latter has a maximum at 105°.99 Crystalline Sb2S3 counterparts exhibit similar connectivities to glassy antimony sesquisulfide, slightly less evident for the orthorhombic polymorph.
As expected, the supercooled and normal Sb2S3 liquids are characterized by even more distorted Sb–S polyhedra and polyhedral connectivities. Both BSSbS(θ) and BSbSSb(θ) distributions become broader and less symmetric with increasing temperature, Fig. S12 (ESI†).
The connectivity analysis shows that 96% of Sb and S are forming a single connected fragment. The homopolar bonds in the glass network are mostly related to few Sb–Sb and S–S dimers. Typical structural fragments in g-Sb2S3 are shown in Fig. 11(a). We note a certain similarity in the intermediate range order and ring statistics with orthorhombic and monoclinic polymorphs, Fig. 11, expected from the bond angle distributions. The orthorhombic crystal has ABAB squares (A: Sb; B: S) and six-membered rings Sb3S3; the monoclinic form, in addition to 6-fold entities, exhibits also big Sb11S11 rings, Fig. 11(g). Glassy and liquid Sb2S3 reveal a large variety of even- and odd-membered rings SbpSq, 3 ≤ p + q ≤ 30, related to chemical and topological disorder. Nevertheless, the most populated entities have size p + q = 4 and 6. The big rings, showing a broad distribution peaked at p + q = 22, become progressively unstable with increasing temperature. Their derived population Rc(p + q)68 appears to be comparable with temporal fluctuations, reflected by the Rc(p + q) uncertainty. At the highest temperature (1150 K), the population of ABAB squares exceeds any other Rc(p + q), at least by a factor of 4, Fig. 11(b).
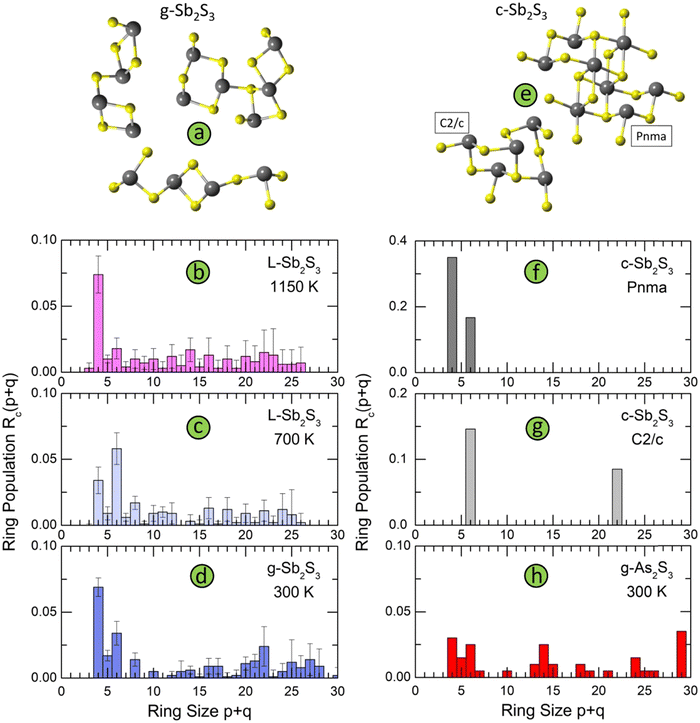 | ||
| Fig. 11 Structural motifs and ring statistics; (a) typical fragments in g-Sb2S3; ring statistics in glassy, and liquid Sb2S3 as a function of temperature: (b) 1150 K (normal liquid), (c) 700 K (supercooled liquid), and (d) 300 K (solid glass); (e) structural motifs in monoclinic Sb2S3, space group C2/c,18 and orthorhombic Sb2S3, space group Pnma;16 ring statistics in (f) orthorhombic Sb2S3, (g) monoclinic Sb2S3, and (h) glassy As2S3. | ||
The ring statistics in g-As2S3 is rather similar to that in glassy antimony sesquisulfide. As it was reported previously,99 the 12-membered rings As6S6, the only rings in monoclinic orpiment100 and triclinic anorpiment101 As2S3 are absent in glassy arsenic sulfide, Fig. 11(h).
More dense packing of glassy antimony sesquisulfide, evidenced by bond angle distributions BSSbS(θ) and BSbSSb(θ), suggests less microscopic voids and cavities in the glass network compared to g-As2S3. The Dirichlet–Voronoi tessellation70 allows the cavity fraction Vc, normalized to the volume of the FPMD simulation box, 0 ≤ Vc ≤ 1, to be computed. The results are given in Fig. 12 for the two sesquisulfides. As expected, the Vc in g-Sb2S3 is by a factor of two smaller than that of its arsenic counterpart, 21 ± 1% vs. 44 ± 4%, respectively. The average size distribution of microscopic voids is rather similar in the two cases, 0.5 ≤ rc ≤ 4 Å, where rc is the cavity radius, Fig. 12(a,b), although the average 〈rc〉 is slightly smaller in glassy As2S3.
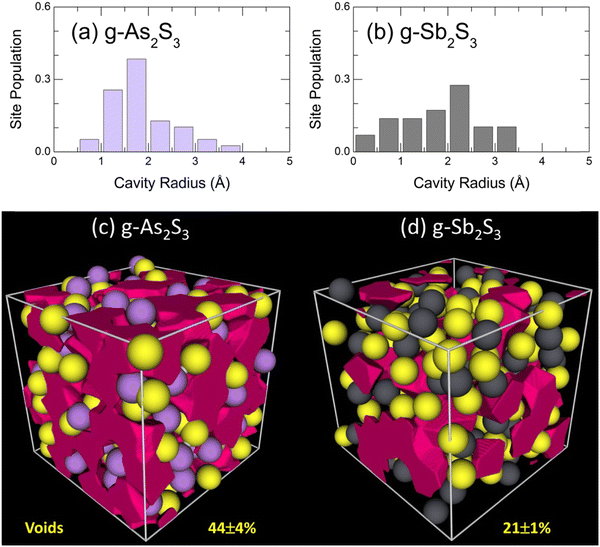 | ||
| Fig. 12 Void statistics: characteristic cavity radii in glassy (a) As2S3 and (b) Sb2S3; microscopic voids in (c) g-As2S3 and (d) g-Sb2S3. | ||
The partial pair-distribution functions gAsS(r) and gSbS(r) for g-As2S3/g-Sb2S3 yield additional evidence for a more compact or densified network in vitreous sulfides with increasing atomic number. Plotted on the normalized r/r0 scale, where r0 is the As–S or Sb–S NN distance, the gSbS(r) shows a remarkable shift of the Sb–S second neighbors to shorter distances, approaching the NN shell, Fig. S13(a) in the ESI.† A similar more compact network compared to g-As2S3 under ambient conditions can be reproduced for glassy As2S3 under high pressure, e.g. in a diamond anvil cell at 6.3 GPa, Fig. S13(b), ESI.†
In summary, glassy and liquid antimony sesquisulfide has distinctly different structural features compared to orthorhombic Sb2S3. First, the antimony short range order in the crystal has a bimodal site distribution: 5-fold coordinated Sb(II) species with a strong Peierls distortion and regular trigonal Sb(I) entities. The Sb–S bonding asymmetry is absent in glassy and liquid polymorphs, characterized by a distorted antimony trigonal environment and shorter average 〈rNNSb–S〉 distances, 2.64 ± 0.15 Å (c-Sb2S3, Pnma) vs. 2.48 ± 0.01 Å (g- and L-Sb2S3). This difference is clearly seen by 121Sb-Mössbauer spectroscopy,102,103 which is very sensitive to the local antimony environment.
Second, the intermediate range order in orthorhombic and glassy Sb2S3 is also different. The crystal structure is composed of infinite 1D-(Sb4S6)∞ ribbons with rather strong inter-ribbon interactions, while the glass network has a 2D layered structure, roughly reminiscent of that in canonical As2S3 but with remarkable differences. We should note comparable glass transition temperatures for the two vitreous alloys, Fig. 1, similar shape of the Raman spectra, Fig. 4, identical pnictide and sulfur local coordination and resembling ring statistics. However, the topology of antimony defect octahedral sites SbS3, evidenced by bond angle distributions, is closer to crystalline Sb2S3 forms than to vitreous As2S3.
3.6 Electronic structure and atomic dynamics in glassy and liquid Sb2S3
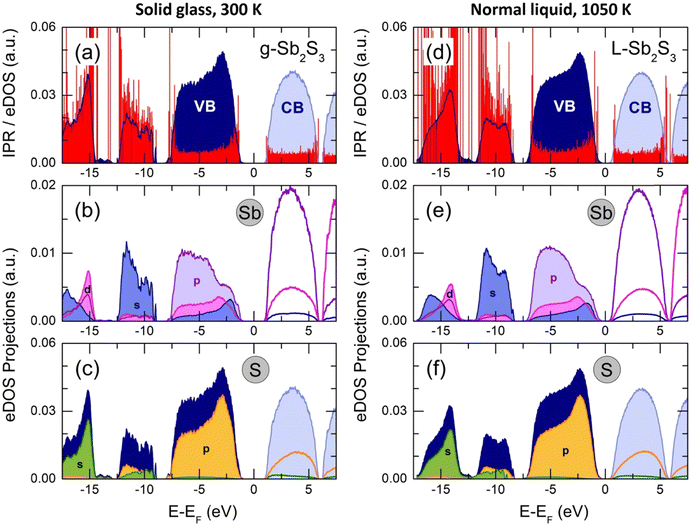
The total electronic density of states (eDOS), calculated from the Kohn–Sham eigenvalue spectra, is shown in Fig. 13. The valence band (VB) consists of three sub-bands between the Fermi energy EF and −20 eV, as in a large majority of crystalline and glassy chalcogenides.35,58,75,104–106 The upper asymmetric part, mostly involving sulfur and antimony p-electron populations, shows a predominant contribution at −2.8 eV (g-Sb2S3 at 300 K) or −2.3 eV (L-Sb2S3 at 1050 K), related to S 3p lone pairs. The bonding states at lower energies consist of Sb 5p, 5d and 5s together with S 3p orbitals. The middle sub-band centered at −10.7 eV (g-Sb2S3) or −10.0 eV (L-Sb2S3) has predominantly the s-character as well as the low-energy part at approximately −15 eV. The bandgap for glassy (Eg = 2.28 eV) and liquid (Eg = 1.06 eV) antimony sesquisulfide are consistent with the reported optical data1,76–79 and electrical measurements (Fig. 2).The derived eDOS is in good agreement with experimental data107 and previously reported simulation results.22,106,108–110 We should however note that simulations with the standard functionals yield a strongly underestimated bandgap (roughly by a factor of 2) in addition to insufficient agreement with the nearest and second neighbor correlations (see also Fig. S8, ESI†).
The inverse participation ratio (IPR),35,111Fig. 13(a and d), characterizes the degree of localization of a single-particle Kohn–Sham eigenfunction ψ(r)
 | (4) |
A small IPR value (∝N−1, where N is the number of atoms in the simulation box) corresponds to an extended (delocalized) wave function, while a large IPR (limIPR → 1) indicates a strong localization around a specific covalent bond. Similar to previously reported results35,58,111 and theoretical predictions,75 the electron states in glassy and liquid Sb2S3 are mostly localized at the band tails (that is, the top of the valence and the bottom of the conduction bands) and in lower-lying bonding states. The remaining electron states in the vicinity of the bandgap are delocalized.
Benchmark telluride PCMs are characterized by low viscosity and high fragility of the melt112–116 ensuring fast atomic mobility at elevated temperature, which enables rapid crystallization within the nanosecond range, and a good retention of the amorphous phase in the vicinity of Tg and at lower T. The simulated dynamics in Sb2S3 reveals fast diffusion at high temperatures and a sudden decrease of diffusivity approaching the glass transition.
Typical Sb and S mean square displacements 〈r2(t)〉 are shown in Fig. 14(a and b)
 | (5) |
| 〈r2(t)〉 ∝ (kBT/mi)t2, | (6) |
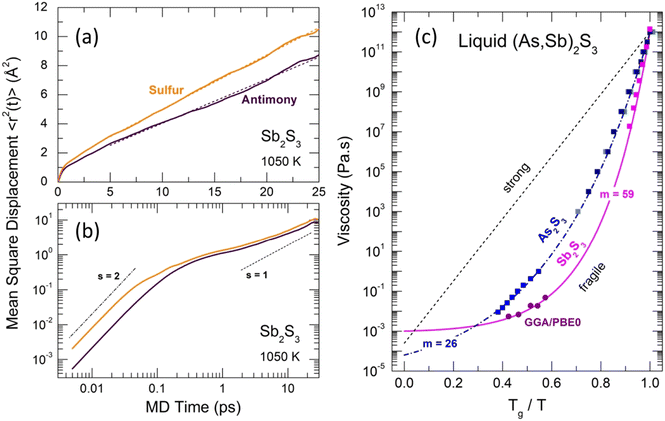 | ||
| Fig. 14 Mean-square displacements 〈r2(t)〉 and viscosity of Sb2S3. Antimony (dark purple) and sulfur (yellow) 〈r2(t)〉 on (a) linear and (b) log–log scales. The dashed lines in (a) represent least-square fits of the 〈r2(t)〉 data. The ballistic (s = 2) and diffusion (s = 1) regimes in (b) are shown by the dash-dotted and dashed lines, respectively. (c) Angell plot for the temperature dependence of viscosity η(T) for As2S3 (blue) and Sb2S3 (magenta). The experimental viscosity data118–123 are shown by the solid squares of different shades of blue for As2S3, and by the magenta squares for Sb2S3. The FPMD viscosity calculated using the Stokes–Einstein relation, eqn (9), is shown by the purple circles (this work). The dashed-dotted and solid lines represent the MYEGA124 viscosity, eqn (10), for the two sesquisulfides. The derived fragility indices m are also shown. See the text for further details. | ||
Above 5 ps, a diffusive motion is visible
| 〈r2(t)〉 ∝ Dit, | (7) |
 | (8) |
The Stokes–Einstein relationship was used to calculate the FPMD viscosity
 | (9) |
 , where Vm(T) is the melt molar volume and NA is the Avogadro constant.
The derived viscosity is shown using an Angell plot, log![[thin space (1/6-em)]](https://www.rsc.org/images/entities/char_2009.gif) η vs. Tg/T, Fig. 14(c), together with experimental viscosity data of different research groups for canonical As2S3 and Sb2S3.118–123 The antimony sesquisulfide viscosity was obtained by extrapolation of the (GeS2)x(Sb2S3)1−x data, 0.1 ≤ x ≤ 0.9.123 At low x ≤ 0.5, the log
η vs. Tg/T, Fig. 14(c), together with experimental viscosity data of different research groups for canonical As2S3 and Sb2S3.118–123 The antimony sesquisulfide viscosity was obtained by extrapolation of the (GeS2)x(Sb2S3)1−x data, 0.1 ≤ x ≤ 0.9.123 At low x ≤ 0.5, the log![[thin space (1/6-em)]](https://www.rsc.org/images/entities/char_2009.gif) η(T,x) composition dependence is changing smoothly, enabling a reliable extrapolation of log
η(T,x) composition dependence is changing smoothly, enabling a reliable extrapolation of log![[thin space (1/6-em)]](https://www.rsc.org/images/entities/char_2009.gif) η(T,x) to x = 0.
η(T,x) to x = 0.
Both viscosities, η(As2S3) and η(Sb2S3), follow the Mauro–Yue–Ellison–Gupta–Allan (MYEGA) relationship124 but with different fragilities
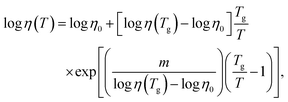 | (10) |
![[thin space (1/6-em)]](https://www.rsc.org/images/entities/char_2009.gif) η/∂(Tg/T)]T=Tg, η0 and η(Tg) = 1012 Pa s are the viscosity values at T = ∞ and Tg, respectively. The m(As2S3) = 26 is typical for canonical chalcogenide glasses with a network structure.113–116,125,126 Antimony sesquisulfide exhibits a higher fragility, m (Sb2S3) = 59, approaching that of telluride PCMs.113–116 We should also note good agreement between the experimental η(T) and calculated ηFPMD(T) viscosity.
η/∂(Tg/T)]T=Tg, η0 and η(Tg) = 1012 Pa s are the viscosity values at T = ∞ and Tg, respectively. The m(As2S3) = 26 is typical for canonical chalcogenide glasses with a network structure.113–116,125,126 Antimony sesquisulfide exhibits a higher fragility, m (Sb2S3) = 59, approaching that of telluride PCMs.113–116 We should also note good agreement between the experimental η(T) and calculated ηFPMD(T) viscosity.
We do not expect for Sb2S3 either a fragile-to-strong transition112–115 or mesoscopic immiscibility accompanied by a viscosity anomaly116,127 since both the experimental conductivity (Fig. 2) and FPMD simulations (Fig. 13) reveal a semiconducting behavior over the studied temperature range.
Nevertheless, we estimate that a semiconductor–metal (SC–M) transition is taking place between 1250 and 1550 K in comparison with TSC–M = 1600 ± 150 K for L-As2S3114,128 (Fig. S15 and related details in the ESI†). We also note a lower SC-M transition temperature, 900 K ≲ TSC–M ≲ 1100 K, for liquid antimony selenides.114,129 In addition, anionic (Se) or cationic (Bi) substitution can be used for bandgap engineering, since Eg (Sb2Se3) = 1.0–1.3 eV12,130 and Eg (Bi2S3) = 1.2–1.4 eV,131,132 remaining within the wider gap materials compared to tellurides, Eg (Sb2Te3) = 0.5 eV.133 Isomorphic mixed crystalline Sb2(S,Se)3 thin films were already studied for solar photovoltaics and exhibit the highest power conversion efficiency between Sb2X3-based tandem solar cells.134,135 The anionic substitution is expected to be equally beneficial in smart reprogrammable photonics for both SET and RESET logic states by tuning the bandgap within telecommunication wavelengths and improving the optical contrast, switching rate and energy efficiency. The cationic (Bi) doping is also started to be used in photovoltaics and seems to yield promising results.136
4. Concluding remarks
Summarizing the above observations, we can emphasize favorable features in the atomic structure and dynamics of vitreous and liquid Sb2S3 as a promising next-generation PCM for integrated smart photonics from the visible to telecom window. A high optical and electric contrast between the SET and RESET logic states in antimony sesquisulfide is based on a different short and intermediate range order in orthorhombic and amorphous Sb2S3. The orthorhombic polymorph is composed of quasi 1D-(Sb4S6)∞ ribbons with a strong asymmetry of the Sb–S nearest neighbor distances for three-fold and 5-fold antimony species (2.46 ≤ rNNSb–S ≤ 2.85 Å) and significant inter-ribbon interactions. Glassy Sb2S3 reveals a 2D-disordered network built from defect octahedral entities SbS3 (rNNSb–S = 2.48 ± 0.01 Å), whose three missing Sb–S bonds became excessively long, and the respective sulfur atoms were transformed into the second neighbors at ≈3.4 Å. A more compact network structure of g-Sb2S3 compared to canonical As2S3, evidenced by the bond angle distributions, shorter Sb–S second neighbor distances and a lower population of microscopic voids and cavities, appears to be a good compromise between the stability of the amorphous state and the ability of fast crystallization. An additional positive feature is related to the intermediate range structure of liquid Sb2S3, predominantly composed of ABAB squares, which are speeding up the crystallization phenomena. Another favorable aspect for the rapid SET-RESET transition is an enhanced fragility of liquid Sb2S3. The fragility index m = 59 is approaching those of the benchmark telluride PCMs and enables fast crystallization processes at elevated temperatures and simultaneously a remarkable slowdown in the vicinity of Tg, ensuring good retention of the amorphous phase. Furthermore, anionic (Se) and/or cationic (Bi) substitution may be used to decrease the temperature of a SC-M transition, thus improving the dynamics of the SET-RESET change, and allowing bandgap engineering equally important for photonics and photovoltaics.Conflicts of interest
There are no conflicts to declare.Acknowledgements
This work was supported by the Région Hauts de France and the Ministère de l’Enseignement Supérieur et de la Recherche (CPER Climibio), as well as by the European Fund for Regional Economic Development. Work at the Advanced Photon Source, Argonne National Laboratory, was supported in part by the Office of Basic Energy Sciences, US Department of Energy, under Contract No. DE-AC02-06CH1135. The experiments at SPring-8 were approved by the Japan Synchrotron Radiation Research Institute (proposal No. 2017B1771 and 2022B1471) and supported by the Centre for Advanced Science and Technology (Japan) as well as by JSPS KAKENHI, Japan (Grant Number 20H02430). MKh work at ILIT RAS was supported by state assignment FSRC “Crystallography and Photonics”, Russian Academy of Sciences. This work was granted access to the HPC resources of IDRIS (France) under the allocation 2022-A0130910639 made by Grand Equipement National de Calcul Intensif (GENCI) and to use the CALCULCO computing platform, supported by Service COmmun du Système d’Information de l’Université du Littoral Côte d’Opale (SCoSI/ULCO). The FPMD simulations were also carried out using the equipment of the shared research facilities of HPC computing resources at Lomonosov Moscow State University.References
- W. Dong, H. Liu, J. K. Behera, L. Lu, R. J. H. Ng, K. V. Sreekanth, X. Zhou, J. K. W. Yang and R. E. Simpson, Wide bandgap phase change material tuned visible photonics, Adv. Funct. Mater., 2018, 1806181 Search PubMed.
- M. Delaney, I. Zeimpekis, D. Lawson, D. W. Hewak and O. L. Muskens, A new family of ultralow loss reversible phase-change materials for photonic integrated circuits: Sb2S3 and Sb2Se3, Adv. Funct. Mater., 2020, 2002447 CrossRef CAS.
- H. Liu, W. Dong, H. Wang, L. Lu, Q. Ruan, Y. S. Tan, R. E. Simpson and J. K. W. Yang, Rewritable color nanoprints in antimony trisulfide films, Sci. Adv., 2020, 6, eabb7171 CrossRef CAS PubMed.
- S. Qin, N. Xu, H. Huang, K. Jie, H. Liu, J. Guo, H. Meng, F. Wang, X. Yang and Z. Wei, Near-infrared thermally modulated varifocal metalens based on the phase change material Sb2S3, Opt. Express, 2021, 29, 7925–7934 CrossRef PubMed.
- L. Lu, Z. Dong, F. Tijiptoharsono, R. J. H. Ng, H. Wang, S. D. Rezaei, Y. Wang, H. S. Leong, P. C. Lim, J. K. W. Yang and R. E. Simpson, Reversible tuning of Mie resonances in the visible spectrum, ACS Nano, 2021, 15, 19722–19732 CrossRef CAS PubMed.
- W. Jia, R. Menon and B. Sensale-Rodriguez, Visible and near-infrared programmable multi-level diffractive lenses with phase change material Sb2S3, Opt. Express, 2022, 30, 6808–6817 CrossRef CAS PubMed.
- L. Cao, X. Gao, B. Zhang, X. Ou, J. Zhang and W.-B. Luo, Bimetallic sulfide Sb2S3@FeS2 hollow nanorods as high-performance anode materials for sodium-ion batteries, ACS Nano, 2020, 14, 3610–3620 CrossRef CAS PubMed.
- S. Wang, Y. Cheng, H. Xue, W. Liu, Z. Yi, L. Chang and L. Wang, Multifunctional sulfur-mediated strategy enabling fast-charging Sb2S3 micro-package anode for lithium-ion storage, J. Mater. Chem. A, 2021, 9, 7838–7847 RSC.
- R. Chen, X. Lu, Q. He, M. Yao, T. Yao, A. Gao, S. Ding, Y. Cheng and H. Wang, Sb2S3 nanorod hierarchies enabling homogeneous sodium deposition for dendrite-free sodium-metal batteries, ACS Appl. Energy Mater., 2022, 5, 10952–10960 CrossRef CAS.
- Y. Du, F. Liu, L. Jiang, M. Jia and Z. Zhang, Ultra-fine Sb2S3 particles encapsulated in activated-carbon: a high-performance anode for Li-ion batteries, J. Alloys Compd., 2022, 907, 164469 CrossRef CAS.
- W. Lian, C. Jiang, Y. Yin, R. Tang, G. Li, L. Zhang, B. Che and T. Chen, Revealing composition and structure dependent deep-level defect in antimony trisulfide photovoltaics, Nat. Commun., 2021, 12, 3260 CrossRef CAS PubMed.
- S. Barthwal, R. Kumar and S. Pathak, Present status and future perspective of antimony chalcogenide (Sb2X3) photovoltaics, ACS Appl. Energy Mater., 2022, 5, 6545–6585 CrossRef CAS.
- B. Roy, B. R. Chakraborty, R. Bhattacharya and A. K. Dutta, Electrical and magnetic properties of antimony sulphide (Sb2S3) crystals and the mechanism of carrier transport in it, Solid State Commun., 1978, 25, 937–940 CrossRef CAS.
- C. Chang, Y. Xiao, X. Zhang, Y. Pei, F. Li, S. Ma, B. Yuan, Y. Liu, S. Gong and L.-D. Zhao, High performance thermoelectrics from earth-abundant materials: enhanced figure of merit in PbS through nanostructuring grain size, J. Alloys Compd., 2016, 664, 411–416 CrossRef CAS.
- D. Bao, Q. Sun, L. Huang, J. Chen, J. Tang, D. Zhou, M. Hong, L. Yang and Z.-G. Chen, Thermoelectric performance of p-type (Bi,Sb)2Te3 incorporating amorphous Sb2S3 nanospheres, Chem. Eng. J., 2022, 430, 132738 CrossRef CAS.
- P. Bayliss and W. Nowacki, Refinement of the crystal structure of stibnite, Sb2S3, Z. Kristallogr., 1972, 135, 308–315 CrossRef CAS.
- D. O. McKee and J. T. McMullan, Comment on the structure of antimony trisulfide, Z. Kristallogr., 1975, 142, 447–449 Search PubMed.
- J. S. Swinnea, A. J. Tenorio and H. Steinfink, Sb10S15, a Pb-free analogue of fülöppite, Pb3Sb8S15, Am. Mineral., 1985, 70, 1056–1058 CAS.
- L. F. Lundegaard, R. Miletich, T. Balic-Zunic and E. Makovicky, Equation of state and crystal structure of Sb2S3 between 0 and 10 GPa, Phys. Chem. Minerals, 2003, 30, 463–468 CrossRef CAS.
- J. Ibáñez, J. A. Sans, C. Popescu, J. López-Vidrier, J. J. Elvira-Betanzos, V. P. Cuenca-Gotor, O. Gomis, F. J. Manjón, P. Rodríguez-Hernández and A. Muñoz, Structural, vibrational, and electronic study of Sb2S3 at high pressure, J. Phys. Chem. C, 2016, 120, 10547–10558 CrossRef.
- I. Efthimiopoulos, C. Buchan and Y. Wang, Structural properties of Sb2S3 under pressure: evidence of an electronic topological transition, Sci. Rep., 2016, 6, 24246 CrossRef CAS PubMed.
- L. Dai, K. Liu, H. Li, L. Wu, H. Hu, Y. Zhuang, L. Yang, C. Pu and P. Liu, Pressure-induced irreversible metallization accompanying the phase transitions in Sb2S3, Phys. Rev. B, 2018, 97, 024103 CrossRef.
- Y. Wang, Y. Ma, G. Liu, J. Wang, Y. Li, Q. Li, J. Zhang, Y. Ma and G. Zou, Experimental observation of the high pressure induced substitutional solid solution and phase transformation in Sb2S3, Sci. Rep., 2018, 8, 14795 CrossRef PubMed.
- Z. Cui, K. Bu, Y. Zhuang, M.-E. Donnelly, D. Zhang, P. Dalladay-Simpson, R. T. Howie, J. Zhang, X. Lü and Q. Hu, Phase transition mechanism and bandgap engineering of Sb2S3 at gigapascal pressures, Commun. Chem., 2021, 4, 125 CrossRef CAS PubMed.
- M. M. E. Ali, P. Kong, Y. Ni, H. Wang and Y. Chen, High pressure induced decomposition of antimony trisulfide, Mater. Today Commun., 2021, 29, 102828 CrossRef CAS.
- C. Hu, Y. Xu, Y. Gong, D. Yang, X. Li and Y. Li, Pressure-induced phase transitions, amorphization and alloying in Sb2S3, Phys. Chem. Chem. Phys., 2022, 24, 10053–10061 RSC.
- L. Červinka and A. Hrubý, Structure of amorphous and glassy Sb2S3 and its connection with the structure of As2X3 arsenic – chalcogenide glasses, J. Non-Cryst. Solids, 1982, 48, 231–264 CrossRef.
- G. Dalba, P. Fornasini and G. Giunta, Short range order of amorphous Sb2S3 thin films: an X-ray diffraction study, Solid State Commun., 1987, 62, 773–776 CrossRef CAS.
- G. Dalba, P. Fornasini, G. Giunta and E. Burattini, XRD and EXAFS study of the local structure in some non-crystalline Sb-S compounds, J. Non-Cryst. Solids, 1989, 107, 261–270 CrossRef CAS.
- M. Wuttig and N. Yamada, Phase-change materials for rewriteable data storage, Nat. Mater., 2007, 6, 824–832 CrossRef CAS PubMed.
- S. Raoux, W. Wełnic and D. Ielmini, Phase change materials and their application to nonvolatile memories, Chem. Rev., 2010, 110, 240–267 CrossRef CAS PubMed.
- W. Zhang, R. Mazzarello, M. Wuttig and E. Ma, Designing crystallization in phase-change materials for universal memory and neuro-inspired computing, Nat. Rev. Mater., 2019, 4, 150–168 CrossRef CAS.
- B. J. Kooi and M. Wuttig, Chalcogenides by design: Functionality through metavalent bonding and confinement, Adv. Mater., 2020, 32, 1908302 CrossRef CAS PubMed.
- J. Akola, R. O. Jones, S. Kohara, S. Kimura, K. Kobayashi, M. Takata, T. Matsunaga, R. Kojima and N. Yamada, Experimentally constrained density-functional calculations of the amorphous structure of the prototypical phase-change material Ge2Sb2Te5, Phys. Rev. B: Condens. Matter Mater. Phys., 2009, 80, 020201 CrossRef.
- S. Caravati, M. Bernasconi and M. Parrinello, First-principles study of liquid and amorphous Sb2Te3, Phys. Rev. B: Condens. Matter Mater. Phys., 2010, 81, 014201 CrossRef.
- A. V. Kolobov and J. Tominaga, Chalcogenides: Metastability and Phase Change Phenomena, Springer, Berlin, 2012, pp. 183–208 Search PubMed.
- S. Ahmed, X. Wang, H. Li, Y. Zhou, Y. Chen, L. Sun, W. Zhang and R. Mazzarello, Change in structure of amorphous Sb–Te phase-change materials as a function of stoichiometry, Phys. Status Solidi RRL, 2021, 2100064 CrossRef CAS.
- A. P. Hammersley, S. O. Svensson, M. Hanfland, A. N. Fitch and D. Häusermann, Two-dimensional detector software: from real detector to idealised image or two-theta scan, High Pressure Res., 1996, 14, 235–248 CrossRef.
- L. B. Skinner, C. J. Benmore and J. B. Parise, Area detector corrections for high quality synchrotron X-ray structure factor measurements, Nucl. Instrum. Methods Phys. Res., 2012, 662, 61–70 CrossRef CAS.
- K. Ohara, Y. Onodera, S. Kohara, C. Koyama, A. Masuno, A. Mizuno, J. T. Okada, S. Tahara, Y. Watanabe, H. Oda, Y. Nakata, H. Tamaru, T. Ishikawa and O. Sakata, Accurate synchrotron hard X-ray diffraction measurements on high-temperature liquid oxides, Intern. J. Microgravity Sci. Appl., 2020, 37, 370202 Search PubMed.
- S. Kohara, M. Itou, K. Suzuya, Y. Inamura, Y. Sakurai, Y. Ohishi and M. Takata, Structural studies of disordered materials using high-energy X-ray diffraction from ambient to extreme conditions, J. Phys.: Condens. Matter, 2007, 19, 506101 CrossRef.
- T. Usuki, M. Bokova, M. Kassem, K. Ohara, A. C. Hannon and E. Bychkov, Dimeric molecular structure of molten gallium trichloride and a hidden evolution toward a possible liquid–liquid transition, J. Phys. Chem. B, 2019, 123, 10260–10266 CrossRef CAS PubMed.
- A. Tverjanovich, M. Khomenko, S. Bereznev, D. Fontanari, A. Sokolov, T. Usuki, K. Ohara, D. Le Coq, P. Masselin and E. Bychkov, Glassy GaS: transparent and unusually rigid thin films for visible to mid-IR memory applications, Phys. Chem. Chem. Phys., 2020, 22, 25560–25573 RSC.
- M. J. Frisch, G. W. Trucks, H. B. Schlegel, G. E. Scuseria, M. A. Robb, J. R. Cheeseman, G. Scalmani, V. Barone, G. A. Petersson, H. Nakatsuji, X. Li, M. Caricato, A. V. Marenich, J. Bloino, B. G. Janesko, R. Gomperts, B. Mennucci, H. P. Hratchian, J. V. Ortiz, A. F. Izmaylov, J. L. Sonnenberg, D. Williams-Young, F. Ding, F. Lipparini, F. Egidi, J. Goings, B. Peng, A. Petrone, T. Henderson, D. Ranasinghe, V. G. Zakrzewski, J. Gao, N. Rega, G. Zheng, W. Liang, M. Hada, M. Ehara, K. Toyota, R. Fukuda, J. Hasegawa, M. Ishida, T. Nakajima, Y. Honda, O. Kitao, H. Nakai, T. Vreven, K. Throssell, J. A. Montgomery, Jr., J. E. Peralta, F. Ogliaro, M. J. Bearpark, J. J. Heyd, E. N. Brothers, K. N. Kudin, V. N. Staroverov, T. A. Keith, R. Kobayashi, J. Normand, K. Raghavachari, A. P. Rendell, J. C. Burant, S. S. Iyengar, J. Tomasi, M. Cossi, J. M. Millam, M. Klene, C. Adamo, R. Cammi, J. W. Ochterski, R. L. Martin, K. Morokuma, O. Farkas, J. B. Foresman and D. J. Fox, Gaussian 16, revision C.01, Gaussian, Inc., Wallingford, CT, 2016 Search PubMed.
- A. D. Becke, Density-functional thermochemistry. III. The role of exact exchange, J. Chem. Phys., 1993, 98, 5648–5653 CrossRef CAS.
- C. Lee, W. Yang and R. G. Parr, Development of the Colle-Salvetti correlation-energy formula into a functional of the electron density, Phys. Rev. B: Condens. Matter Mater. Phys., 1988, 37, 785–789 CrossRef CAS PubMed.
- D. Feller, The role of databases in support of computational chemistry calculations, J. Comput. Chem., 1996, 17, 1571–1586 CrossRef CAS.
- K. A. Peterson, D. Figgen, E. Goll, H. Stoll and M. Dolg, Systematically convergent basis sets with relativistic pseudopotentials. II. Small-core pseudopotentials and correlation consistent basis sets for the post-d group 16-18 elements, J. Chem. Phys., 2003, 119, 11113–11123 CrossRef CAS.
- G. B. Bacskay, A quadratically convergent Hartree-Fock (QCSCF) method. Application to closed shell systems, Chem. Phys., 1981, 61, 385–404 CrossRef CAS.
- P. Masselin, D. Le Coq, A. Cuisset and E. Bychkov, Spatially resolved Raman analysis of laser induced refractive index variation in chalcogenide glass, Opt. Mater. Express, 2012, 2, 1768–1775 CrossRef CAS.
- A. Tverjanovich, A. Cuisset, D. Fontanari and E. Bychkov, Structure of Se-Te glasses by Raman spectroscopy and DFT modelling, J. Am. Ceram. Soc., 2018, 101, 5188–5197 CrossRef CAS.
- M. Kassem, M. Bokova, A. S. Tverjanovich, D. Fontanari, D. Le Coq, A. Sokolov, P. Masselin, S. Kohara, T. Usuki, A. C. Hannon, C. J. Benmore and E. Bychkov, Bent HgI2 molecules in the melt and sulfide glasses: implications for nonlinear optics, Chem. Mater., 2019, 31, 4103–4112 CrossRef CAS.
- T. D. Kühne, M. Iannuzzi, M. Del Ben, V. V. Rybkin, P. Seewald, F. Stein, T. Laino, R. Z. Khaliullin, O. Schütt, F. Schiffmann, D. Golze, J. Wilhelm, S. Chulkov, M. H. Bani-Hashemian, V. Weber, U. Borštnik, M. Taillefumier, A. S. Jakobovits, A. Lazzaro, H. Pabst, T. Müller, R. Schade, M. Guidon, S. Andermatt, N. Holmberg, G. K. Schenter, A. Hehn, A. Bussy, F. Belleflamme, G. Tabacchi, A. Glöβ, M. Lass, I. Bethune, C. J. Mundy, C. Plessl, M. Watkins, J. VandeVondele, M. Krack and J. Hutter, CP2K: An electronic structure and molecular dynamics software package – Quickstep: Efficient and accurate electronic structure calculations, J. Chem. Phys., 2020, 152, 194103 CrossRef PubMed.
- J. P. Perdew, M. Ernzerhof and K. Burke, Rationale for mixing exact exchange with density functional approximations, J. Chem. Phys., 1996, 105, 9982–9985 CrossRef CAS.
- C. Adamo and V. Barone, Toward reliable density functional methods without adjustable parameters: the PBE0 model, J. Chem. Phys., 1999, 110, 6158–6170 CrossRef CAS.
- A. Tverjanovich, M. Khomenko, C. J. Benmore, M. Bokova, A. Sokolov, D. Fontanari, M. Kassem, T. Usuki and E. Bychkov, Bulk glassy GeTe2: a missing member of the tetrahedral GeX2 family and a precursor for the next generation of phase-change materials, Chem. Mater., 2021, 33, 1031–1045 CrossRef CAS.
- M. Bokova, A. Tverjanovich, C. J. Benmore, D. Fontanari, A. Sokolov, M. Khomenko, M. Kassem, I. Ozheredov and E. Bychkov, Unraveling the atomic structure of bulk binary Ga−Te glasses with surprising nanotectonic features for phase-change memory applications, ACS Appl. Mater. Interfaces, 2021, 13, 37363–37379 CrossRef CAS PubMed.
- A. Tverjanovich, M. Khomenko, C. J. Benmore, S. Bereznev, A. Sokolov, D. Fontanari, A. Kiselev, A. Lotin and E. Bychkov, Atypical phase-change alloy Ga2Te3: atomic structure, incipient nanotectonic nuclei, and multilevel writing, J. Mater. Chem. C, 2021, 9, 17019–17032 RSC.
- M. Kassem, T. Bounazef, A. Sokolov, M. Bokova, D. Fontanari, A. C. Hannon, I. Alekseev and E. Bychkov, Deciphering fast ion transport in glasses: a case study of sodium and silver vitreous sulfides, Inorg. Chem., 2022, 61, 12870–12885 CrossRef CAS PubMed.
- S. Grimme, S. Ehrlich and L. Goerigk, Effect of the damping function in dispersion corrected density functional theory, J. Comput. Chem., 2011, 32, 1456–1465 CrossRef CAS PubMed.
- M. Micoulaut, Communication: van der Waals corrections for an improved structural description of telluride based materials, J. Chem. Phys., 2013, 138, 061103 CrossRef CAS PubMed.
- A. Bouzid, C. Massobrio, M. Boero, G. Ori, K. Sykina and E. Furet, Role of the van der Waals interactions and impact of the exchange-correlation functional in determining the structure of glassy GeTe4, Phys. Rev. B: Condens. Matter Mater. Phys., 2015, 92, 134208 CrossRef.
- T. Matsunaga, J. Akola, S. Kohara, T. Honma, K. Kobayashi, E. Ikenaga, R. O. Jones, N. Yamada, M. Takata and R. Kojima, From local structure to nanosecond recrystallization dynamics in AgInSbTe phase-change materials, Nat. Mater., 2011, 10, 129–134 CrossRef CAS PubMed.
- O. Gereben and L. Pusztai, RMC_POT, a computer code for Reverse Monte Carlo modeling the structure of disordered systems containing molecules of arbitrary complexity, J. Comput. Chem., 2012, 33, 2285–2291 CrossRef CAS PubMed.
- C. Hartwigsen, S. Goedecker and J. Hutter, Relativistic separable dual-space Gaussian pseudopotentials from H to Rn, Phys. Rev. B: Condens. Matter Mater. Phys., 1998, 58, 3641–3662 CrossRef CAS.
- S. Nosé, A molecular dynamics method for simulations in the canonical ensemble, Mol. Phys., 1984, 52, 255–268 CrossRef.
- W. G. Hoover, Canonical dynamics: equilibrium phase-space distributions, Phys. Rev. A, 1985, 31, 1695–1697 CrossRef PubMed.
- S. Le Roux and P. Jund, Ring statistics analysis of topological networks: new approach and application to amorphous GeS2 and SiO2 systems, Comput. Mater. Sci., 2010, 49, 70–83 CrossRef CAS.
- S. Kohara, H. Ohno, M. Tabaka, T. Usuki, H. Morita, K. Suzuya, J. Akola and L. Pusztai, Lead silicate glasses: binary network-former glasses with large amounts of free volume, Phys. Rev. B: Condens. Matter Mater. Phys., 2010, 82, 134209 CrossRef.
- I. Heimbach, F. Rhiem, F. Beule, D. Knodt, J. Heinen and R. O. Jones, pyMolDyn: identification, structure, and properties of cavities/vacancies in condensed matter and molecules, J. Comput. Chem., 2017, 38, 389–394 CrossRef CAS PubMed.
- Y. Kawamoto and S. Tsuchihashi, The properties and structure of glasses in the system As2S3-Sb2S3, Yogyo-Kyokai-Shi, 1969, 77, 12–19 CrossRef.
- K. N’Dri, J. Sei, D. Houphouet-Boigny, G. Kra and J.-C. Jumas, Estimation of glass-forming ability and glass stability of Sb2S3-As2S3-Sb2Te3 glasses by thermal properties, J. Appl. Sci., 2007, 7, 3167–3176 CrossRef.
- K. N’Dri, D. Houphouet-Boigny, J.-C. Jumas and J. Olivier-Fourcade, Electronegativity difference, atomic size parameter and widths of supercooled liquid regions of Sb2S3-As2S3-Sb2Te3 glasses, J. Non-Cryst. Solids, 2011, 357, 145–149 CrossRef.
- G. J. Janz, F. W. Dampier, G. R. Lakshminarayanan, P. K. Lorenz and R. P. T. Tomkins, Molten Salts: Volume 1, Electrical Conductance, Density, and Viscosity Data, National Standard Reference Data Series; NBS 15, Washington D.C., 1968, p. 98 Search PubMed.
- N. F. Mott and E. A. Davis, Electronic Processes in Non-Crystalline Materials, 2nd edn, Clarendon Press, Oxford, 1979, pp. 28−37, 194–197, 491–497 Search PubMed.
- L. Guo, B. Zhang, S. Li, Q. Zhang, M. Buettner, L. Li, X. Qian and F. Yan, Scalable and efficient Sb2S3 thin-film solar cells fabricated by close space sublimation, APL Mater., 2019, 7, 041105 CrossRef.
- J. Chen, J. Qi, R. Liu, X. Zhu, Z. Wan, Q. Zhao, S. Tao, C. Dong, G. Y. Ashebir, W. Chen, R. Peng, F. Zhang, S. Yang, X. Tian and M. Wang, Preferentially oriented large antimony trisulfide single-crystalline cuboids grown on polycrystalline titania film for solar cells, Commun. Chem., 2019, 2, 121 CrossRef.
- C. Guo, J. Chen, G. Li, X. Liang, W. Lai, L. Yang, Y. Mai and Z. Li, Enhanced electrical conductivity of Sb2S3 thin film via C60 modification and improvement in solar cell efficiency, Global Challenges, 2019, 1800108 CrossRef PubMed.
- V. Lojpur, M. Joschko, C. Graf, N. Radmilović, M. Novaković and I. Validžić, Structural, morphological, optical, and electronic properties of amorphous non-Doped and I and Sn doped Sb2S3 nanoparticles, Mater. Sci. Semicond. Processing, 2022, 137, 106196 CrossRef CAS.
- S. S. Batsanov, van der Waals radii of elements, Inorg. Mater., 2001, 37, 871–885 CrossRef CAS.
- Y. Liu, K. T. E. Chua, T. C. Sum and C. K. Gan, First-principles study of the lattice dynamics of Sb2S3, Phys. Chem. Chem. Phys., 2014, 16, 345–350 RSC.
- J. S. Lannin, Raman scattering properties of amorphous As and Sb, Phys. Rev. B: Solid State, 1977, 15, 3863–3871 CrossRef CAS.
- Z. Cheng, T. Milne, P. Salter, J. C. Kim, S. Humphrey, M. Booth and H. Bhaskaran, Antimony thin films demonstrate programmable optical nonlinearity, Sci. Adv., 2021, 7, eabd7097 CrossRef CAS PubMed.
- F. Perales, G. Lifante and F. Agulló-Rueda, and C. de las Heras, Optical and structural properties in the amorphous to polycrystalline transition in Sb2S3 thin films, J. Phys. D: Appl. Phys., 2007, 40, 2440–2444 CrossRef CAS.
- P. Makreski, G. Petruševski, S. Ugarković and G. Jovanovskic, Laser-induced transformation of stibnite (Sb2S3) and other structurally related salts, Vib. Spectrosc., 2013, 68, 177–182 CrossRef CAS.
- P. Parize, T. Cossuet, O. Chaix-Pluchery, H. Roussel, E. Appert and V. Consonni, In situ analysis of the crystallization process of Sb2S3 thin films by Raman scattering and X-ray diffraction, Mater. Design, 2017, 121, 1–10 CrossRef.
- J. Wang, Y. Qiao, T. Wang, H. Yu, Y. Feng and L. Li, Two-dimensional (2D) amorphous antimony (III) trisulfide nanosheets: synthesis, photoelectronic property and their transformation to crystalline 1D micro/nanorods, Inorg. Chem. Comm., 2018, 92, 110–114 CrossRef CAS.
- I. Watanabe, S. Noguchi and T. Shimizu, Study on local structure in amorphous Sb-S films by Raman scattering, J. Non-Cryst. Solids, 1983, 58, 35–40 CrossRef CAS.
- Y. Gutiérrez, A. Fernández-Pérez, S. A. Rosales, C. Cobianu, M. Gheorghe, M. Modreanu, J. M. Saiz, F. Moreno and M. Losurdo, Polarimetry analysis and optical contrast of Sb2S3 phase change material, Opt. Mater. Express, 2022, 12, 1531–1541 CrossRef.
- J. Holubová, M. Liška, M. Chromčíková, E. Černošková and Z. Černošek, Structure of As2S3–Sb2S3 glasses by combined Raman spectroscopy and a thermodynamic modelling approach, Phys. Chem. Glasses, 2012, 53, 31–36 Search PubMed.
- I. Pethes, V. Nazabal, J. Arib, I. Kaban, J. Darpentigny, E. Welter, O. Gutowski, B. Bureau, Y. Messaddeq and P. Jóvári, Atomic level structure of Ge-Sb-S glasses: chemical short range order and long Sb-S bonds, J. Alloys Compd., 2019, 774, 1009–1016 CrossRef CAS.
- S. Guan, S. Sun, D. Chen, J. Zhang, S. Kang, T. Xu and C. Lin, Formation and physical and structural properties of Sb2S3-PbI2 chalcogenide glasses, J. Non-Cryst. Solids, 2021, 570, 120993 CrossRef CAS.
- H. Krebs and R. Steffen, Neubestimmung der Nahordnung im glasigen Selen, im explosiven Antimon und im β- und γ-Arsen, Z. Anorg. Allg. Chem., 1964, 327, 224–237 CrossRef CAS.
- R. Winter, W.-C. Pilgrim, P. A. Egelstaff, P. Chieux, S. Anlauf and F. Hensel, Neutron scattering study on amorphous sulphur, Europhys. Lett., 1990, 11, 225–228 CrossRef CAS.
- E. Bychkov, C. J. Benmore and D. L. Price, Compositional changes of the first sharp diffraction peak in binary selenide glasses, Phys. Rev. B: Condens. Matter Mater. Phys., 2005, 72, 172107 CrossRef.
- A. Bytchkov, G. J. Cuello, S. Kohara, C. J. Benmore, D. L. Price and E. Bychkov, Unraveling the atomic structure of Ge-rich sulfide glasses, Phys. Chem. Chem. Phys., 2013, 15, 8487–8494 RSC.
- S. C. Moss and D. L. Price, Random packing of structural units and the first sharp diffraction peak in glasses, in Physics of Disordered Materials, ed. D. Adler, H. Fritzsche and S. Ovshinsky, Plenum, New York, 1985, pp. 77–95 Search PubMed.
- C. S. Barrett, P. Cucka and K. Haffner, The crystal structure of antimony at 4.2, 78 and 298° K, Acta Cryst., 1963, 16, 451–453 CrossRef CAS.
- S. I. Simdyankin, S. R. Elliott, Z. Hajnal, T. A. Niehaus and T. Frauenheim, Simulation of physical properties of the chalcogenide glass As2S3 using a density-functional-based tight-binding method, Phys. Rev. B: Condens. Matter Mater. Phys., 2004, 69, 144202 CrossRef.
- D. J. E. Mullen and W. Nowacki, Refinement of the crystal structures of realgar, AsS and orpiment, As2S3, Z. Kristallogr., 1972, 136, 48–65 CrossRef CAS.
- A. R. Kampf, R. T. Downs, R. M. Housley, R. A. Jenkins and J. Hyrsl, Anorpiment, As2S3, the triclinic dimorph of orpiment, Mineralog. Mag., 2011, 75, 2857–2867 CrossRef CAS.
- E. Bychkov and G. Wortmann, 121Sb-Mössbauer study of insulating and ion-conducting antimony chalcogenide-based glasses, J. Non-Cryst. Solids, 1993, 159, 162–172 CrossRef CAS.
- M. A. El Idrissi Raghni, P. E. Lippens, J. Olivier-Fourcade and J. C. Jumas, Local structure of glasses in the As2S3-Sb2S3 system, J. Non-Cryst. Solids, 1995, 192–193, 191–194 CrossRef.
- F. Shimojo, K. Hoshino and Y. Zempo, Structural and electronic properties of liquid arsenic sulfide at high temperatures: ab initio molecular-dynamics simulations, J. Phys. Soc. Japan, 2005, 74, 621–625 CrossRef CAS.
- J. Akola, P. Jóvári, I. Kaban, I. Voleská, J. Kolář, T. Wágner and R. O. Jones, Structure, electronic, and vibrational properties of amorphous AsS2 and AgAsS2: experimentally constrained density functional study, Phys. Rev. B: Condens. Matter Mater. Phys., 2014, 89, 064202 CrossRef.
- X. Wang, Z. Li, S. R. Kavanagh, A. M. Ganose and A. Walsh, Lone pair driven anisotropy in antimony chalcogenide semiconductors, Phys. Chem. Chem. Phys., 2022, 24, 7195–7202 RSC.
- J. Grigas, E. Talik and V. Lazauskas, X-ray photoelectron spectroscopy of Sb2S3 crystals, Phase Transitions, 2002, 75, 323–337 CrossRef CAS.
- T. Ben Nasr, H. Maghraoui-Meherzi, H. Ben Abdallah and R. Bennaceur, Electronic structure and optical properties of Sb2S3 crystal, Physica B, 2011, 406, 287–292 CrossRef CAS.
- M. Xu, R. Gu, C. Qiao, H. Tong, X. Cheng, C.-Z. Wang, K.-M. Ho, S. Wang, X. Miao and M. Xu, Unraveling the structural and bonding nature of antimony sesquichalcogenide glass for electronic and photonic applications, J. Mater. Chem. C, 2021, 9, 8057–8065 RSC.
- Y. Gutiérrez, A. P. Ovvyan, G. Santos, D. Juan, S. A. Rosales, J. Junquera, P. García-Fernández, S. Dicorato, M. M. Giangregorio, E. Dilonardo, P. Palumbo, M. Modreanu, J. Resl, O. Ishchenko, G. Garry, T. Jonuzi, M. Georghe, C. Cobianu, K. Hingerl, C. Cobet, F. Moreno, W. H. P. Pernice and M. Losurdo, Interlaboratory study on Sb2S3 interplay between structure, dielectric function, and amorphous-to-crystalline phase change for photonics, iScience, 2022, 25, 104377 CrossRef PubMed.
- J. Kalikka, J. Akola, R. O. Jones, S. Kohara and T. Usuki, Amorphous Ge15Te85: density functional, high-energy X-ray and neutron diffraction study, J. Phys.: Condens. Matter, 2012, 24, 015802 CrossRef CAS PubMed.
- J. Orava, D. W. Hewak and A. L. Greer, Fragile-to-strong crossover in supercooled liquid Ag-In-Sb-Te studied by ultrafast calorimetry, Adv. Funct. Mater., 2015, 25, 4851–4858 CrossRef CAS.
- S. Wei, P. Lucas and C. A. Angell, Phase change alloy viscosities down to using Adam-Gibbs-equation fittings to excess entropy data: a fragile-to-strong transition, J. Appl. Phys., 2015, 118, 034903 CrossRef.
- S. Wei, P. Lucas and C. A. Angell, Phase-change materials: the view from the liquid phase and the metallicity parameter, MRC Bull., 2019, 44, 691–698 CrossRef.
- J. Pries, H. Weber, J. Benke-Jacob, I. Kaban, S. Wei, M. Wuttig and P. Lucas, Fragile-to-strong transition in phase-change material Ge3Sb6Te5, Adv. Func. Mater., 2022, 2202714 CrossRef CAS.
- W. Zhu, O. Gulbiten, B. Aitken and S. Sen, Viscosity, enthalpy relaxation and liquid-liquid transition of the eutectic liquid Ge15Te85, J. Non-Cryst. Solids, 2021, 554, 120601 CrossRef CAS.
- R. Huang, I. Chavez, K. M. Taute, B. Lukić, S. Jeney, M. G. Raizen and E.-L. Florin, Direct observation of the full transition from ballistic to diffusive Brownian motion in a liquid, Nat. Phys., 2011, 7, 576–580 Search PubMed.
- A. P. Chernov, S. A. Dembovsky and V. M. Makhova, Viscosity and structure of glasses in the As2X3–AsI3 system, Izv. Akad. Nauk SSSR, Neorg. Mater., 1970, 6, 823–825 CAS.
- N. E. Shchukina, G. M. Orlova and G. A. Chalabyan, The viscosity and elastic properties of glasses in the arsenic–sulfur–thallium system, Fiz. Khim. Stekla, 1979, 5, 223–228 CAS.
- S. V. Nemilov, The viscosity and elastic properties of melts and glasses in the As–S system and their valence-bond structure, Fiz. Khim. Stekla, 1979, 5, 398–409 CAS.
- G. Chaussemy, J. Fornazero and J.-M. Mackowski, Relationship between viscosity and structure in molten materials, J. Non-Cryst. Solids, 1983, 58, 219–234 CrossRef CAS.
- A. S. Tverjanovich, Temperature dependence of the viscosity of chalcogenide glass-forming melts, Glass Phys. Chem., 2003, 29, 532–536 CrossRef CAS.
- J. Shánělová, P. Koštál and J. Málek, Viscosity of supercooled melts, J. Non-Cryst. Solids, 2006, 352, 3952–3955 CrossRef.
- J. C. Mauro, Y. Yue, A. J. Ellison, P. K. Gupta and D. C. Allan, Viscosity of glass-forming liquids, Proc. Natl. Acad. Sci. U. S. A., 2009, 106, 19780–19784 CrossRef CAS PubMed.
- P. Koštál, J. Shánělová and J. Málek, Viscosity of chalcogenide glass-formers, Int. Mater. Rev., 2019, 65, 63–101 CrossRef.
- B. Yuan, B. G. Aitken and S. Sen, Viscoelastic behavior and fragility of Se-deficient chalcogenide liquids in As-P-Se system, J. Non-Cryst. Solids X, 2022, 16, 100128 CAS.
- M. Kassem, C. J. Benmore, T. Usuki, K. Ohara, A. Tverjanovich, M. Bokova, V. V. Brazhkin and E. Bychkov, Transient mesoscopic immiscibility, viscosity anomaly and high internal pressure at the semiconductor−metal transition in liquid Ga2Te3, J. Phys. Chem. Lett., 2022, 13, 10843–10850 CrossRef CAS PubMed.
- S. Hosokawa, Y. Sakaguchi, H. Hiasa and K. Tamura, Optical absorption spectra of liquid As2S3 and As2Se3 over a wide temperature range, J. Phys.: Condens. Matter, 1991, 3, 6673–6677 CrossRef CAS.
- V. A. Alekseev, A. A. Andreev and M. V. Sadovskiï, Semiconductor-metal transition in liquid semiconductors, Sov. Phys. Usp., 1980, 23, 551–575 CrossRef.
- X. Liang, Y. Feng, W. Dang, H. Huang, X. Wang, Y. Guo, K. Shen, R. E. I. Schropp, Z. Li and Y. Mai, High-efficiency flexible Sb2Se3 solar cells by back interface and absorber bulk deep-level trap engineering, ACS Energy Lett., 2023, 8, 213–221 CrossRef CAS.
- W. M. Linhart, S. J. Zelewski, P. Scharoch, F. Dybała and R. Kudrawiec, Nesting-like band gap in bismuth sulfide Bi2S3, J. Mater. Chem. C, 2021, 9, 13733–13738 RSC.
- M. Lan, Y. Wang, X. Dong, F. Yang, N. Zheng, Y. Wang, H. Ma and X. Zhang, Controllable fabrication of sulfur-vacancy-rich Bi2S3 nanorods with efficient near-infrared light photocatalytic for nitrogen fixation, Appl. Surf. Sci., 2022, 591, 153205 CrossRef CAS.
- J.-W. Park, S. H. Baek, T. D. Kang, H. Lee, Y.-S. Kang, T.-Y. Lee, D.-S. Suh, K. J. Kim, C. K. Kim, Y. H. Khang, J. L. F. Da Silva and S.-H. Wei, Optical properties of (GeTe, Sb2Te3) pseudobinary thin films studied with spectroscopic ellipsometry, Appl. Phys. Lett., 2008, 93, 021914 CrossRef.
- Y. Zhao, S. Wang, C. Jiang, C. Li, P. Xiao, R. Tang, J. Gong, G. Chen, T. Chen, J. Li and X. Xiao, Regulating energy band alignment via alkaline metal fluoride assisted solution post-treatment enabling Sb2(S,Se)3 solar cells with 10.7% efficiency, Adv. Energy Mater., 2022, 12, 2103015 CrossRef CAS.
- S. Barthwal, R. Kumar and S. Pathak, Present status and future perspective of antimony chalcogenide (Sb2X3) Photovoltaics, ACS Appl. Energy Mater., 2022, 5, 6545–6585 CrossRef CAS.
- Y. Mao, L. Huang, W.-G. Zeng, F.-Y. Wu, L.-Q. Yao, L.-M. Lin, J.-M. Zhang, J.-M. Li and G.-L. Chen, Bi doping of Sb2S3 light-harvesting films: toward suitable energy level alignment and broad absorption for solar cells, Chem. Eng. J., 2022, 446, 137400 CrossRef CAS.
Footnote |
| † Electronic supplementary information (ESI) available: Raw diffraction patterns of Sb2S3, Raman spectrum of amorphous antimony, evolution of Raman spectra for Sb2S3 as a function of temperature, DFT Raman spectra of size-limited clusters, S–Sb–S bond angle distributions for DFT-optimized clusters, distributions of Sb–S interatomic distances in DFT-optimized clusters, diffraction data for glassy and liquid As2S3, comparison of FPMD modeling with standard PBE and hybrid PBE0 functionals, FPMD modeling of glassy As2S3 under high-pressure, fitting Sb–S partials with asymmetric functions, coordination distributions of sulfur and antimony, bond angle distributions in glassy and liquid Sb2S3, FPMD partial pair-distribution functions in g-Sb2S3 and g-As2S3, derived Sb and S diffusion coefficients plotted on the Arrhenius scale, and FPMD estimation of the semiconductor–metal (SC–M) transition temperature TSC–M for liquid Sb2S3. See DOI: https://doi.org/10.1039/d3tc00081h |
| This journal is © The Royal Society of Chemistry 2023 |

