Observation of helical self-assembly in cyclic triphosphazene-based columnar liquid crystals bearing chiral mesogenic units†
Shruti
Rani
 a,
Vidhika
Punjani
 a,
Santosh Prasad
Gupta
b,
Madhu Babu
Kanakala
c,
C. V.
Yelamaggad
 *c and
Santanu Kumar
Pal
 *a
*a
aDepartment of Chemical Sciences, Indian Institute of Science Education and Research (IISER) Mohali, Punjab 140306, India. E-mail: skpal@iisermohali.ac.in; yelamaggad@gmail.com; santanupal.20@gmail.com
bDepartment of Physics, Patna University, Patna, 800005, India
cCentre for Nano and Soft Matter Sciences, Bengaluru, 560013, India
First published on 14th November 2022
Abstract
Nowadays, intensive research has focused on the design and synthesis of function-integrated smart materials resulting from the spontaneous self-assembly of appropriately chosen functional molecules. Working in this direction, we have synthesized a new series of non-conventional, chiral columnar liquid crystals (Col LCs), where the cyclotriphosphazene core is surrounded by cholesterol-based Schiff base dimeric units. Cholesterol, which is covalently bound to the two-ring Schiff base core via a flexible spacer of varying length and parity, has been premeditatedly incorporated to induce handedness in the Col fluid macrostructure. These investigations, using a number of complementary techniques, clearly reveal the influence of the length of the spacer, rather than the parity, on the symmetries of 2D lattices resulting from the intrinsic Col assemblies of the synthesized compounds. The different Col assemblies were further confirmed through detailed electron density mapping and small-angle/wide-angle X-ray scattering (SAXS/WAXS) studies. As conceived, bulky cholesterol, which can induce molecular chirality, directs the molecular assemblies in a helical manner in individual columns. The handedness (helicity) of the Col LCs has been confirmed via temperature-dependent chiroptical measurements where the intensity of the peak in the circular dichroism (CD) spectra increases with a decrease in temperature, implying that the core–core correlation within the columns and, thus, the proximity of the chromophores varies with the temperature. Notably, upon exposure to hydrochloric acid (HCl) these novel materials exhibit fluorescence “turn-on” characteristics in their solid (as synthesized) state that can be visualized instantly by the naked eye where the color change occurs with a low detection limit of 5.6 μM.
Introduction
Phosphazenes are a fascinating class of organophosphorus materials.1–6 They have received significant attention in the past due to their ease of functionalization and high thermal stability. The phosphazene molecule can be a ring (e.g., cyclotriphosphazene, cyclotetraphosphazene) (Fig. 1) or a linear chain (polyphosphazene) that consists of a backbone of phosphorus and nitrogen atoms, with halide atoms connected to the phosphorus centers.7 | ||
| Fig. 1 Molecular structures of the six- and eight-membered cyclic phosphazenes that are frequently employed as building blocks for the construction of various functional materials. | ||
In recent years, cyclophosphazenes (CPs) have been incorporated as a functional core in dendrimers to accomplish novel materials capable of exhibiting a range of physical and chemical properties.8–17 It has been shown that the structure of CP dendrimers can be diversified by increasing the number of substituents/end-groups.8 The unique structure of CP dendrimers enables the formation of internal cavities closer to the core, and also leads to the generation of spherical structures.8 In fact, various exciting applications of CP-based dendrimers have been proposed in the field of medicinal chemistry,9,10 catalysis,11 and materials science.12–14 Additionally, these CP derivatives, which occur in the form of ligands/thermally stable macromolecules, have found applications in the field of liquid crystals (LCs), low-temperature elastomers, solid-state fuel cells, and electro-optical polymers,7,15 including flame retardants.15–17 Most of these applications are related to the nature of the side arms connected to the central core. Among all the investigations mentioned above, their incorporation in the design of soft materials, especially LCs, is noteworthy. For instance, the phosphazene backbone has been extensively explored for realizing liquid crystal-based smart materials.18–29 Calamitic phases have been attained via rod-like mesogens incorporating the CP unit as a central core in the molecular architecture;18–29 and the occurrence of calamitic mesophases has been explained using a model where the side arms are arranged perpendicular to the central moiety.30
On the other hand, the self-organization of disc-like mesogens (discotics) into a Col self-assembly has attracted growing interest in materials science.31,32 These materials have received immense attention due to their unique features, such as the self-healing of organizational defects and one-dimensional (1D) charge migration, resulting in a wide range of exciting applications. For example, they can be employed as an active medium in photovoltaic devices, thin-film transistors, organic light-emitting diodes and so on.33,34 Furthermore, the induction of molecular chirality enables discotic LCs to self-organize into highly ordered macroscopic structures characterized by their handedness, i.e., their chirality. The mesogens in such a helicoidal arrangement, which have either a macromolecular or supramolecular order, are of great interest in the design of responsive materials, chirality sensors, and chiroptical devices.34 As expected, the CP core has been employed to realize Col LCs.
The first occurrence of the columnar hexagonal (Colh) phase in a CP-based dendrimer was reported in 2005.35 The microphase segregation of the rigid and flexible parts of the structure along with the space-filling requirements enabled their organization into the Col LC structure.35 Since then, many researchers have been working towards realizing Col phases in phosphazene-based systems. However, only a few reports have described Col mesomorphism in discotic LCs (DLCs) derived from the CP core.36,37 However, to our knowledge, chiral Col LC phases derived from the CP core have not been reported hitherto. Herein, we report the first examples of CP-based non-conventional LCs self-assembling into helicoidal columns. In particular, we describe the molecular design, synthesis, and characterization of a new series of hexa-substituted CP-based chiral columnar LCs.
With the prime objective of accomplishing chiral LC phase(s) persisting over an extended thermal width, we incorporated cholesterol-based dimeric Schiff bases in the molecular architecture; the mesogenic Schiff base units have been inserted purposely as they possess various properties including chemical sensing.15,53 To understand the structure–property correlation, the length and parity of the spacer of the cholesterol-based dimeric units have been varied. The general molecular structure of the Col LCs synthesized is shown in Fig. 2; for convenience, this series of mesogens will be hereafter referred to as the P-n series, where n signifies the number of methylene units in the spacer. As described in succeeding sections, our detailed investigations clearly reveal the influence of the spacer's length on the packing of the columns on a 2D lattice. For example, mesogens P-6, P-7, and P-11 show the columnar centered rectangular (Colr) phase, whereas the LCs P-8 and P-10 exhibit the Col oblique (Colob) phase. By contrast, compound P-5 displays the Col hexagonal (Colh) phase, which is particularly fascinating in terms of its structure.
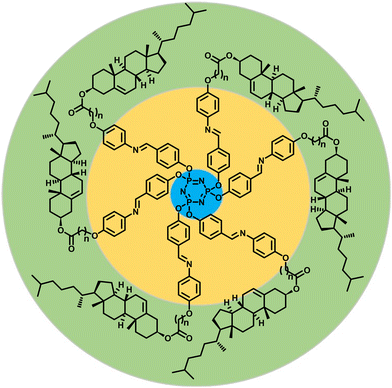 | ||
| Fig. 2 Schematic representation of the general molecular structure of a series of chiral Col LCs synthesized and investigated in this study (P-n, n = 5, 6, 7, 8, 10 and 11; see ESI† for the synthetic scheme and detailed procedures and characterization data). | ||
The structural assignment of the newly synthesized Col LCs and their key precursors was performed systematically using standard characterization techniques. The phase transitional behaviour of all the target materials was ascertained using polarising optical microscopy (POM), differential scanning calorimetry (DSC), and small-angle/wide-angle X-ray scattering (SAXS/WAXS) measurements. Temperature-dependent circular dichroism (CD) measurements were used to prove the helicity of all the mesophases. The intrinsic fluorescence behaviour of all the compounds was demonstrated to be useful in sensing HCl vapours, and probably originates from the Schiff-base units of the LC materials.38–45
Result and discussion
Synthesis, structural characterization and thermal stability
As shown in Scheme 1, the target mesogenic materials were synthesized by treating compound 1 with cholesteryl ω-(4-aminophenoxy) alkanoates (4a–f). The detailed synthetic steps employed are described in Scheme S1 of the ESI.† The 1H and 13C NMR spectra, and the microanalytical data are, respectively, presented in Fig. S1–S15 and Table S1 (ESI†).The thermal stability of all the synthesized materials was determined using thermogravimetric analysis (TGA) (Fig. S16, ESI† and Table 1); apparently, all the compounds are stable up to 300–350 °C.
| Compound | Phase transitiona (°C) | T 5% (°C) |
|---|---|---|
| a Temperatures of phase transitions (peak, in °C) were obtained from DSC analysis. Abbreviations: Colh = columnar hexagonal; Colr = columnar centered rectangular; Colob = columnar oblique; Iso = isotropic liquid. b Decomposition temperature corresponding to a weight loss of 5% as measured via TGA. | ||
| P-5 | Heating: Cr 160.8 Colh 303.5 Iso | 330.0 |
| Cooling: Iso 286.9 Colh 142.8 Cr | ||
| P-6 | Heating: Cr 108.0 Colr 231.0 Iso | 346.0 |
| Cooling: Iso 222.0 Colr 84.9 Cr | ||
| P-7 | Heating: Cr 144.0 Colr 265.0 Iso | 325.3 |
| Cooling: Iso 258.8 Colr 129.0 Cr | ||
| P-8 | Heating: Cr 121.2 Cr1 163.7 Colob 210.0 Iso | 351.0 |
| Cooling: Iso 203.2 Colob 95.6 Cr | ||
| P-10 | Heating: Cr 147.6 Cr1 154.5 Colob 214.7 Iso | 306.3 |
| Cooling: Iso 211.3 Colob 133.2 Cr1 117.7 Cr | ||
| P-11 | Heating: Cr 123.6 Cr1 154.0 Colr 220.1 Iso | 342.0 |
| Cooling: Iso 216.7 Colr 152.5 Cr1 85.9 Cr | ||
Mesomorphic behaviour
Table 1 portrays the phase transition temperatures and decomposition temperatures. The transition temperatures were found to be consistent with the POM data. For all samples, three consecutive heating–cooling cycles were performed to record the DSC thermograph. Here, Fig. S17 (ESI†) illustrates the DSC traces recorded during the second heating–cooling cycles. All members of the series showed thermodynamically stable Col mesomorphism. The fluidity of the LC phases was evidenced by the shearing test of the samples during both heating and cooling cycles. All mesogens, as expected, showed elevated clearing temperatures that varied between 210 and 310 °C, according to the spacer length; precisely, the isotropization temperature decreases with increasing spacer length. Notably, as can be seen in Table 1, the length of the central spacer greatly influences the structure (symmetry) of the Col phase.The first member of the series, P-5, displayed an enantiotropic columnar mesophase. It showed the typical broken fan-shaped pattern along with homeotropic domains under crossed polarisers32 (Fig. 3a).
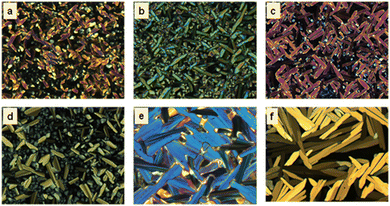 | ||
| Fig. 3 POM microphotographs of the optical texture of Col phases formed by (a) P-5 at 280 °C, (b) P-6 at 230 °C, (c) P-7 at 225 °C, (d) P-8 at 190.7 °C, (e) P-10 at 150.9 °C and (f) P-11 at 214.9 °C. | ||
In the DSC trace obtained during heating, the endothermic peak at ∼160.8 °C was attributed to the crystal to Col phase transition, and the peak at ∼303.5 °C corresponded to the columnar to isotropic transition. On cooling, the exothermic peaks that appeared at ∼286.9 °C and 142.8 °C are due to the transition from the isotropic liquid to the Col phase and the mesophase to crystallization, respectively (Fig. S17a, ESI†). During cooling, the enthalpy change of the liquid to mesophase transition was quite low compared with the heating cycle because of the supercooling effect.
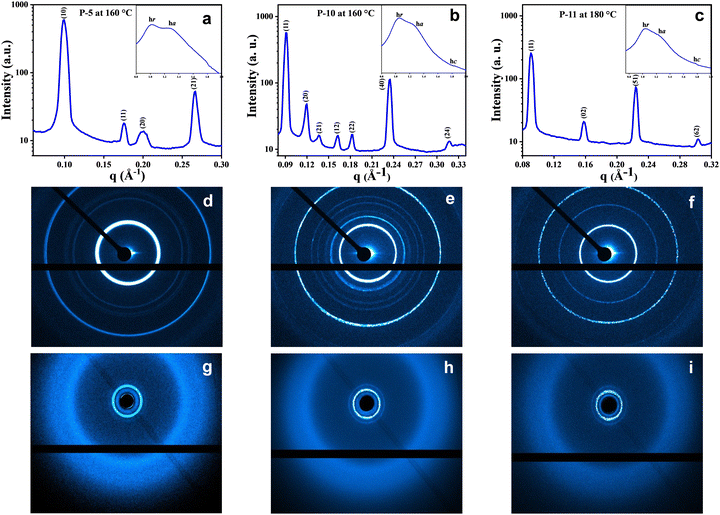
This LC phase was assigned to be a hexagonal columnar phase based on X-ray diffraction (XRD) measurements. The XRD patterns recorded at various chosen temperatures for the mesophase possessed the characteristic features of the Colh phase, in agreement with POM observations. In the small-angle region, the occurrence of multiple peaks with d-spacings in the ratio  corresponded to the strong reflection from the (10) plane and three weak reflections from the (11), (20), and (21) planes, respectively, of the hexagonal structure. Besides, two broad peaks in the wide-angle region were seen: hr, with a spacing of 6.3 Å appeared due to cholesterol–cholesterol correlation, and ha, with a spacing of 5.1 Å was attributed to the fluid alkyl chain–chain correlation. The calculated value of the lattice parameter is equal to a = 72.7 Å (Fig. 4a and Table S2, ESI†). The structure remained columnar hexagonal in the mesophase temperature regime. The 2D diffractograms of compound P-5 (Fig. 4d and g) in the SAXS, as well as in the WAXS region, also suggested the formation of the Colh mesophase.
The next two homologues (P-6 and P-7) showed the enantiotropic columnar centered rectangular (Colr) phase over a wide temperature range. The heating DSC trace of P-6 displayed one peak at ∼108 °C corresponding to the crystal to Colr transition, and a second peak for the Colr to isotropic transition at 231 °C. Upon cooling, the mesophase appeared at 222 °C and remained stable up to 84.9 °C (Fig. S17b, ESI†). The growth of pseudo-focal-conic textures seen using POM supported the arrangement of discs in a columnar fashion32 (Fig. 3b). The other compound, P-7, also showed the two-phase transition both in the heating and cooling cycles (Fig. S17c, ESI†). The mesophase assignment was done purely based on XRD analysis, and the pattern could be indexed to a 2D centred rectangular lattice.
The XRD pattern of compound P-6 at 190 °C is shown in Fig. S18a (Table S3) (ESI†). It exhibited four narrow peaks in the small-angle region at d-spacings of 66.1 Å, 48.1 Å, 24.2 Å, and 22.9 Å. These peaks corresponded to diffraction from the (11), (20), (40), and (04) planes, respectively, of the centred rectangular lattice. The lattice parameters were found to be a = 96.1 Å, and b = 91.1 Å. In the wide-angle region there were three peaks, hr, ha, and hc. The hc peak of d-spacing 3.57 Å reflected the disc–disc correlation and confirmed the columnar structure of the mesophase. Compound P-7 also exhibited a 2D columnar centred rectangular phase over the entire mesophase temperature range (Fig. 3c, Fig. S18b and Table S4, ESI†). The 2D diffractograms of compound P-6 (Fig. S18d and g, ESI†) and P-7 (Fig. S18e and h, ESI†) in the SAXS as well as the WAXS region also suggested the formation of the Colr mesophase.
As shown in Table 1, the mesogens P-8 and P-10 also stabilize thermodynamically stable Col phase over a wide temperature range. The heating DSC profiles revealed three phase transitions in both materials (Fig. S17d and e, ESI†). They showed crystal-to-crystal, crystal-to-columnar, and columnar-to-liquid phase transitions. The corresponding cooling cycle traces possessed signatures due to the transition from the isotropic liquid state to the Col phase and the transformation from the Col state to crystallization. The POM photomicrographs of compounds P-8 (Fig. 3d) and P-10 (Fig. 3e) were comprised of homeotropic domains as well as long fan-shaped patterns. These textures are characteristic of the columnar mesophase.32 As shown in Fig. S18c (Table S5) (ESI†), the XRD pattern of compound P-8 recorded at 160 °C suggested the occurrence of the Colob phase; it consisted of narrow peaks in the small-angle region and two broad peaks, hr and ha, in the wide-angle regime. The lattice parameters were found to be a = 105.2 Å, b = 73.7 Å and α = 69.3°. Likewise, the XRD profile of the mesogen P-10 showed evidence for the existence of the Colob phase (Fig. 4b and Table S6, ESI†). The 2D diffractograms of mesogens P-8 (Fig. S18f and i, ESI†) and P-10 (Fig. 4e and h) in the SAXS, as well as the WAXS region, also suggested the formation of the Colob mesophase.
The last member of the series, P-11, also exhibited columnar mesomorphism over a wide thermal range. It showed three phase transitions in the heating and cooling cycle, as evidenced by the DSC traces (Fig. S17f, ESI†) and the POM (Fig. 3f) study. The XRD profile obtained in the mesophase at 180 °C exhibited four sharp peaks in the small-angle region that correspond to reflections from the (11), (02), (51), and (62) planes, respectively of the Colr phase. Only these kinds of reflection are present because the corresponding lattice for this phase is centered rectangular, which allows only reflections having h + k = even, where h and k are the Miller indices. Moreover, there are three peaks, hr, ha, and hc, in the wide-angle regime, and they appeared for the same reason as explained before. The calculated values of the lattice parameters are a = 148.2 Å and b = 79.9 Å (Fig. 4c and Table S7, ESI†). The 2D patterns (Fig. 4f and i) in the SAXS as well as the WAXS region also suggested the formation of the Colr mesophase.
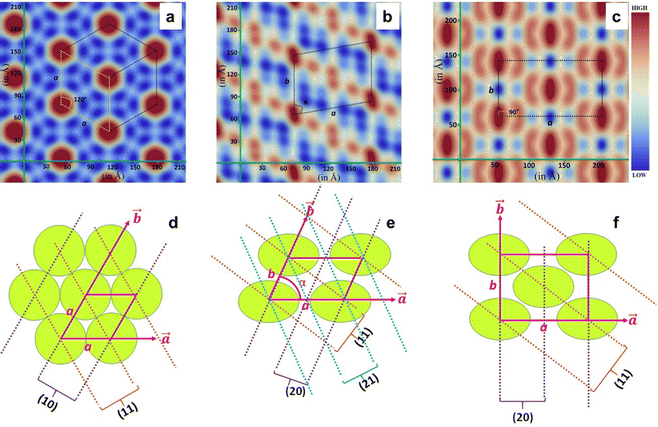
To figure out the arrangement of these mesogens on the various 2D lattices, the electron density maps46 were constructed using the information derived from the peak, index, and intensity data of the XRD pattern, and the 2D projection model (Fig. 5d–f) of all the columnar arrangements was also displayed. The electron density maps for compounds P-5, P-10 and P-11 are shown in Fig. 5a–c, respectively. From these electron density maps, it is clear that the individual mesogenic molecule appears, more or less, as a circular disc in the columnar hexagonal phase. The 2D projection models (Fig. 5d–f) explain the reflecting planes of Colh, Colob and Colr, respectively, along with the unit cells of the different phases, as represented by the 2D region outlined in pink.
The shape seems to change to elliptical when the columnar centred rectangular phase is formed. Furthermore, the shape of the molecules in the columnar oblique phase is dumbbell type (Fig. 5b and Fig. S19, ESI†).
Chiroptical measurements
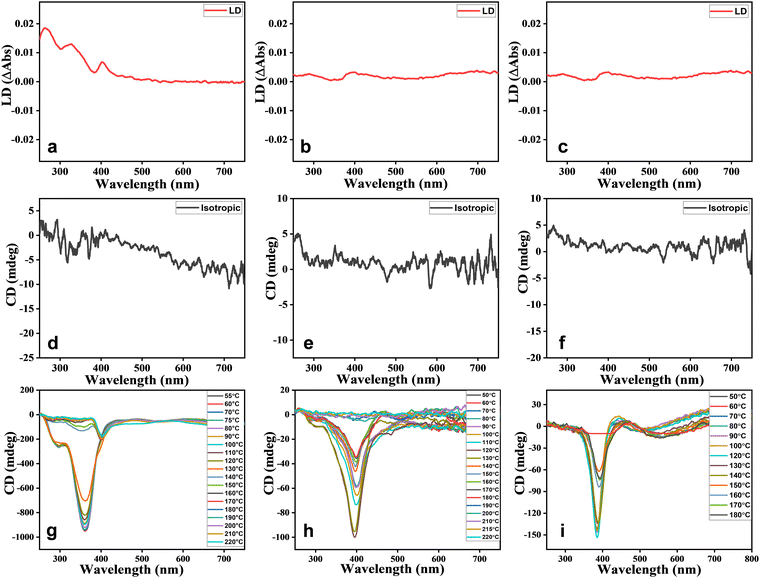
The newly synthesised chiral mesogens bearing accessible chromophores were probed for their chiroptical properties in their mesomorphic (columnar) and isotropic liquid states using circular dichroism (CD) spectroscopy, which essentially reveals the differential absorption of left and right circularly polarised waves by the light-absorbing groups (chromophores) surrounded by the chiral medium. This absorption spectroscopic study was carried out mainly to determine whether or not the peripherally located bulky chiral (cholesterol) segments that account for the molecular chirality enabled the molecular organization in the Col phase in a helical manner, where the constituent, intrinsically dissymmetric (chiral) mesogens within the columns follow a helical array. An organization of mesogens yielding a helical superstructure displays an exciton-split effect that is related to a through-space interaction among two or more chromophores exhibiting the allowed π–π* absorption bands.47 The CD spectrum of the anisotropic medium is generally accompanied by artefacts such as linear birefringence (LB) and linear dichroism (LD). However, the presence of small anisotropic (mesophase) domains in abundance are known to rescind such artefacts.48 Four mesogens, viz., P-5, P-6, P-10, and P-11, were chosen for the chiroptical investigation. The isotropic liquid thin films of the aforesaid samples (except for P-5) were subjected to CD spectral measurement. As can be seen in Fig. 6d–f, the CD response of the isotropic liquid state remains totally absent, implying that the chromophores are not affected by the chirality stemming from the stereogenic centres of the peripheral cholesterol segments.The rapid cooling of the samples from their isotropic phase to the LC phase generally helps in realising small domains,49 and Fig. 6g–i portray the chiroptical spectra registered in the Col phase of compounds P-6, P-10, and P-11, respectively. The CD spectrum recorded in the Col phase as a function of temperature, from well below the isotropization temperature of the material P-5, is shown in Fig. S22b (ESI†). Similarly, the other three mesogens showed CD signals over the entire temperature width of the Col phase, meaning that the macroscopic structure, the fluid anisotropic medium, is optically active. The spectra recorded did not show any signatures due to LD activity (Fig. 6a–c), as contemplated. The LD spectra were recorded for the Col phase appearing just below the isotropization temperature.
The CD spectrum recorded as a function of temperature in the Col phase of mesogen P-5 possessed a strong band with a negative maximum at ∼390 nm, a wavelength that is closer to the electronic absorption maximum (∼350 nm) of the solution spectra of the sample. The intensity (magnitude) of the CD peak increases progressively with a decrease in temperature (Fig. S22b and Table S8, ESI†), implying the core–core correlation within the columns and, thus, that the proximity of the chromophores varies with the temperature. However, the CD curve position (and the sign) remained unaffected, demonstrating that the mesophase absorbs either left or right circularly polarised light in preference to scattering where the wavelength of the band changes as a function of temperature.50 The CD profiles of compound P-6 recorded in the higher temperature range (140–220 °C) revealed a relatively weak circular dichroism in the 310–430 nm spectral region. The spectrum was characterised by two negative peaks with maxima at 350 and 400 nm. Interestingly, in the corresponding low-temperature CD spectra (55–130 °C) recorded, these two peaks appeared at 297 and 360 nm with a significant increase in the band intensities (Fig. 6g and Table S9, ESI†). Such a blue shift in the absorption maximum of the circular dichroism along with the enhanced band intensity suggests a considerable variation in the face-to-face parallel organisation of the chromophores surrounded by the chiral environment. Fig. 6h illustrates the results of the temperature-dependent CD measurements carried out in the Col phase for oligomer P-10. The spectrum comprised a well-defined (strong) negative band centred at 395 nm, the magnitude of which decreases continually with the increase in the temperature (Fig. 6h); besides, a marginal blue shift occurs in the peak position when the temperature of the sample is decreased (Table S10, ESI†). On the other hand, the spectrum recorded as a function of temperature in the Col phase of material P-11 showed the bisignate CD curve with a 1st positive Cotton effect at the longer wavelength (∼440 nm) and a negative 2nd Cotton effect at the shorter wavelength (∼385 nm) with the crossover point closer to the chromophore absorption maximum (Fig. 6i). The CD curve shifts towards a shorter wavelength upon decreasing the temperature, which is also seen in the other three compounds measured (Fig. 6i and Table S11, ESI†). The appearance of the bisignate CD signal essentially implies chiral excitonic coupling that originates due to the aggregation of chromophores with their transition dipoles organized in a helical manner.51
Thus, the CD measurements as a function of the temperature of the Col phase belonging to the four compounds reveal intense curves in the CD spectra, demonstrating significant chiral correlations in the molecular organization within the columns. In other words, the intrinsic CD activity of the mesophase provided evidence of the occurrence of a helix within the columns resulting from the closer packing of the mesogens adopting a helical arrangement, and this arrangement remains in the crystallization stage as well. The schematic representation of the helicoidal columns in Colh, Colr and Colob are demonstrated in Fig. 7.
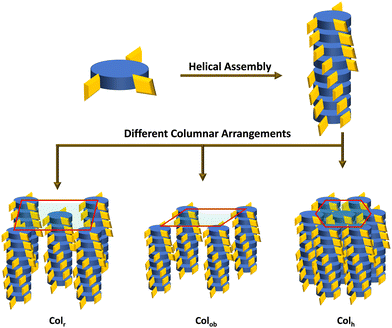 | ||
| Fig. 7 Schematic representation of helicoidal columns arranged in different columnar organization modes. | ||
Sensing properties
The design and development of novel sensors that are capable of showing a change in colour, as recognizable by the naked eye, is highly desirable. Over the years, it has been well demonstrated that the imine (–CH![[double bond, length as m-dash]](https://www.rsc.org/images/entities/char_e001.gif) N–) bond of the Schiff-base (electron-rich) core can be easily protonated and hence can be used to sense proton donors such as acids.52 The π-conjugated electrons and the pair of electrons on the nitrogen atom are responsible for this behaviour of the imine group. Thus, these Schiff base mesogens that feature six imine bonds should be able to sense traces of acid, especially HCl vapour.52 Working in this direction, we first investigated the photophysical behaviour of the newly synthesized mesogens using UV-vis and fluorescence spectroscopy (Fig. S20 and S21, ESI†).
N–) bond of the Schiff-base (electron-rich) core can be easily protonated and hence can be used to sense proton donors such as acids.52 The π-conjugated electrons and the pair of electrons on the nitrogen atom are responsible for this behaviour of the imine group. Thus, these Schiff base mesogens that feature six imine bonds should be able to sense traces of acid, especially HCl vapour.52 Working in this direction, we first investigated the photophysical behaviour of the newly synthesized mesogens using UV-vis and fluorescence spectroscopy (Fig. S20 and S21, ESI†).
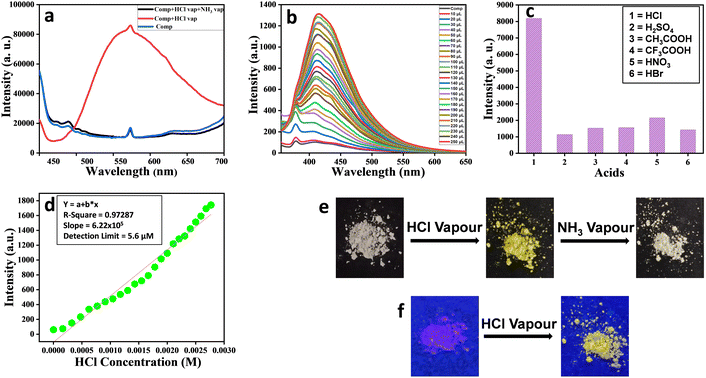
As an illustrative case, fluorescence experiments were carried out to examine the ability of mesogen P-11 in sensing the presence of HCl. Precisely, the measurements were performed in solution as well as in the solid-state of the chosen mesogen. As depicted in Fig. 8a, the solid compound P-11 upon exposure to acid vapour showed a broad fluorescence emission band (red-trace), unlike the pristine (un-exposed) solid sample (blue-trace) or this sample upon exposure to ammonia vapour for neutralization or recovery (black-trace). Fig. 8b illustrates the emission profiles recorded, at the excitation wavelength of 338 nm, for the pristine sample in THF (10−5 M) solution (black-trace) and its interactions with 10−2 M HCl solution (in acetonitrile) of varying concentrations. Apparently, the magnitude of the fluorescence emission intensity increases progressively with the increase in the concentration of acid. Such a turn-on fluorescence enhancement is likely to be attributed to protonation of the imine nitrogen, which changes the molecular planarity.52 The sensing behaviour of P-11 was also probed using other acids. However, this material showed high selectivity towards HCl (Fig. 8c), and the detection limit for HCl was found to be 5.6 μM (Fig. 8d). The colour of compound P-11 in the solid-state changed from off-white to bright yellow under normal light (Fig. 8e); it also showed fluorescence turn-on phenomenon when it was placed in a HCl atmosphere under a UV lamp (Fig. 8f), which enables the naked eye detection of HCl gas. The other homologues of the series (P-5, P-6, P-7, P-8, and P-10) displayed similar behaviour towards HCl vapour, as shown in Fig. S23 to S27 (ESI†), respectively.
Conclusions
The first examples of chiral Col LCs derived from the cyclic triphosphazene core, which is peripherally substituted with cholesterol-based Schiff-base dimeric segments, have been synthesized and characterized systematically. The length and parity of the spacer of the dimeric units that covalently bind cholesterol and the two-ring Schiff base core have been varied to examine the structure–property correlations. As clearly revealed by XRD measurements coupled with electron density mapping, the length of the spacer critically dictates the 2D periodic order characteristic of the Col LC phases that is formed via the spontaneous self-assembly of triphosphazene mesogens. The effect of the parity seems not to have been reflected. The mesogens, depending upon the length of the spacer, yield mesophases such as Colh, Colr, and Colob phases. Temperature-dependent chiroptical studies revealed the helical self-assembly in columnar arrangements. Notably, these Col LCs, being Schiff bases, show sensing characteristics due to their facile protonation. In particular, the sensing of HCl in the solid state and in solution has been demonstrated via fluorescence emission measurements. Notably, the fluorescence “turn-on” phenomenon was observed, and the detection limit for HCl was found to be 5.6 μM.Author contributions
SR and SKP conceptualised the project. SR performed all the experiments and analysed the data. VP helped in the SAXS/WAXS experiments and SPG analysed the SAXS/WAXS data. CVY and MBK performed and analysed the chiro-optical measurements. All authors contributed to the manuscript preparation and approved to the final version. SKP and CVY did the overall project administration, reviewed, edited, and finalized the manuscript. All authors have given approval to the final version of the manuscript.Conflicts of interest
There are no conflicts to declare.Acknowledgements
SR and VP thank CSIR for the fellowship with file nos. (09/947(0091)/2017-EMR-I) and (09/947(0253)/2020-EMR-I), respectively. SKP acknowledges project file no. CRG/2019/000901/OC from the DST-SERB project. We are grateful for the NMR, SAXS/WAXS, FESEM, TEM, and all other departmental facilities at IISER Mohali. SR thanks Yogendra Nailwal for many helpful discussions.Notes and references
- H. R. Allcock, Phosphorus-Nitrogen Compounds, Academic Press; New York, 1972 Search PubMed.
- H. R. Allcock, Chem. Rev., 1972, 72, 315–356 CrossRef CAS.
- C. W. Allen, Chem. Rev., 1991, 91, 119–135 CrossRef CAS.
- A. Uslu and S. Yeşilot, Coord. Chem. Rev., 2015, 291, 28–67 CrossRef CAS.
- S. Yeşilot and A. Uslu, Polym. Rev., 2017, 57, 213–247 CrossRef.
- D. J. Bowers, B. D. Wright, V. Scionti, A. Schultz, M. J. Panzner, E. B. Twum, L. L. Li, B. C. Katzenmeyer, B. S. Thome, P. L. Rinaldi, C. Wesdemiotis, W. J. Youngs and C. A. Tessier, Inorg. Chem., 2014, 53, 8874–8886 CrossRef CAS PubMed.
- A. Uslu and S. Yeşilot, Dalton Trans., 2021, 50, 2324–2341 RSC.
- (a) A. Karpus, S. Mignani, M. Zablocka and J. P. Majoral, J. Org. Chem., 2022, 87, 3433–3441 CrossRef PubMed; (b) J. Jiménez, A. Laguna, E. Gascón, J. A. Sanz, J. L. Serrano, J. Barberá and L. Oriol, Chem. – Eur. J., 2012, 18, 16801–16814 CrossRef PubMed.
- R. Schneider, C. Köllner, I. Weber and A. Togni, Chem. Commun., 1999, 2415–2416 RSC.
- A. M. Caminade, C. O. Turrin and J. P. Majoral, New J. Chem., 2010, 34, 1512–1524 RSC.
- K. Milowska, T. Gabryelak, M. Bryszewska, A. M. Caminade and J. P. Majoral, Int. J. Biol. Macromol., 2012, 50, 1138–1143 CrossRef CAS PubMed.
- C. Marmillon, F. Gauffre, T. G. Krzywicki, C. Loup, A. M. Caminade, J. P. Majoral, J. P. Vors and E. Rump, Angew. Chem., 2001, 113, 2696–2699 CrossRef.
- A. M. Caminade and J. P. Majoral, Acc. Chem. Res., 2004, 37, 341–348 CrossRef CAS PubMed.
- K. Ciepluch, N. Katir, A. E. Kadib, M. Weber, A. M. Caminade, M. Bousmina, J. P. Majoral and M. Bryszewska, J. Lumin., 2012, 132, 1553–1563 CrossRef CAS.
- S. N. K. Usri, Z. Jamain and M. Z. H. Makmud, Polymers, 2021, 13, 2916 CrossRef CAS PubMed.
- B. Zhao, W. J. Liang, J. S. Wang, F. Li and Y. Q. Liu, Polym. Degrad. Stab., 2016, 133, 162–173 CrossRef CAS.
- G. F. Levchik, Y. V. Grigoriev, A. I. Balabanovich, S. V. Levchik and M. Klatt, Polym. Int., 2000, 49, 1095–1100 CrossRef CAS.
- K. Moriya, T. Suzuki, Y. Kawanishi, T. Masuda, H. Mizusaki, S. Nakagawa, H. Ikematsu, K. Mizuno, S. Yano and M. Kajiwara, Appl. Organomet. Chem., 1998, 12, 771–779 CrossRef CAS.
- K. Moriya, S. Yano and M. Kajiwara, Chem. Lett., 1990, 1039–1042 CrossRef CAS.
- K. Moriya, H. Mizusaki, M. Kato, Y. Yano and M. Kajiwara, Liq. Cryst., 1995, 18, 795–800 CrossRef CAS.
- A. M. Levelut and K. Moriya, Liq. Cryst., 1996, 20, 119–124 CrossRef CAS.
- K. Moriya, T. Suzuki, H. Mizusaki, S. Yano and M. Kajiwara, Chem. Lett., 1997, 1001–1002 CrossRef CAS.
- K. Moriya, H. Mizusaki, M. Kato, T. Suzuki, S. Yano, M. Kajiwara and K. Tashiro, Chem. Mater., 1997, 9, 255–263 CrossRef CAS.
- K. Moriya, T. Suzuki, Y. Yano and M. Kajiwara, Liq. Cryst., 1995, 19, 711–713 CrossRef CAS.
- K. Moriya, S. Nakagawa, S. Yano and M. Kajiwara, Liq. Cryst., 1995, 18, 919–921 CrossRef CAS.
- K. Moriya, Y. Kawanishi, S. Yano and M. Kajiwara, Chem. Commun., 2000, 1111–1112 RSC.
- K. Moriya, H. Ikematsu, S. Nakagawa, S. Yano and K. Negita, J. Appl. Phys., 2001, 40, 340–342 CrossRef.
- K. Moriya, T. Yamane, T. Suzuki, T. Masuda, H. Mizusaki, S. Yano and M. Kajiwara, Relat. Elem., 2002, 177, 1427–1432 CrossRef CAS.
- K. Moriya, T. Masuda, T. Suzuki, S. Yano and M. Kajiwara, Mol. Cryst. Liq. Cryst., 2006, 318, 267–277 CrossRef.
- J. Jimenez, L. Callizo, J. L. Serrano, J. Barbera and L. Oriol, Inorg. Chem., 2017, 56, 7907–7921 CrossRef CAS PubMed.
- J. De, S. P. Gupta, I. Bala, S. Kumar and S. K. Pal, Langmuir, 2017, 33, 13849–13860 CrossRef CAS PubMed.
- I. Bala, N. Singh, R. A. K. Yadav, J. De, S. P. Gupta, D. P. Singh, D. K. Dubey, J.-H. Jou, R. Douali and S. K. Pal, J. Mater. Chem. C, 2020, 8, 12485 RSC.
- I. Bala, J. De, S. P. Gupta, H. Singh, U. K. Pandey and S. K. Pal, Chem. Commun., 2020, 56, 5629 RSC.
- (a) J. De, I. Bala, S. P. Gupta, U. K. Pandey and S. K. Pal, J. Am. Chem. Soc., 2019, 141, 18799–18805 CrossRef CAS PubMed; (b) T. Metzroth, A. Hoffmann, R. Martín-Rapún, M. M. Smulders, K. Pieterse, A. R. A. Palmans, J. A. J. M. Vekemans, E. W. Meijer, H. W. Spiess and J. Gauss, Chem. Sci., 2011, 2, 69–76 RSC.
- (a) J. Barberà, M. Bardají, J. Jiménez, A. Laguna, M. P. Martínez, L. Oriol, J. L. Serrano and I. Zaragozano, J. Am. Chem. Soc., 2005, 127, 8994–9002 CrossRef PubMed; (b) J. Barberà, J. Jiménez, A. Laguna, L. Oriol, S. Pérez and J. L. Serrano, Chem. Mater., 2006, 18, 5437–5445 CrossRef.
- J. Jimnez, A. Laguna, A. M. Molter, J. L. Serrano, J. Barber and L. Oriol, Chem. – Eur. J., 2011, 17, 1029–1039 CrossRef PubMed.
- C. A. Hincapié, R. M. Sebastián, J. Barberá, J. L. Serrano, T. Sierra, J. P. Majoral and A. M. Caminade, Chem. – Eur. J., 2015, 20, 17047–17058 CrossRef PubMed.
- L. Li, J. Sun, L. L. Zhang, R. Yao and C. G. Yan, J. Mol. Struct., 2015, 1081, 355–361 CrossRef CAS.
- Ö. Özdemir, J. Mol. Struct., 2016, 1125, 260–271 CrossRef.
- V. Reena, S. Suganya and S. Velmathi, J. Flourine Chem., 2013, 153, 89–95 CrossRef CAS.
- Y. Z. Xiea, G. G. Shana, Z. Y. Zhoua and Z. M. Sua, Sens. Actuators, B, 2013, 177, 41–49 CrossRef.
- X. C. Li, C. Y. Wang, Y. Wan, W. Y. Lai, L. Zhao, M. F. Yin and W. Huang, Chem. Commun., 2016, 52, 2748–2751 RSC.
- X. Li, T. Shao, Q. Shi and M. Hu, RSC Adv., 2013, 3, 22877–22881 RSC.
- N. Xu, R. L. Wang, D. P. Li, Z. Y. Zhou, T. Zhang, Y. Z. Xie and Z. M. Su, New J. Chem., 2018, 42, 13367–13374 RSC.
- F. Z. Cui, J. J. Xie, S. Y. Jiang, S. X. Gan, D. L. Ma, R. R. Liang, G. F. Jiang and X. Zhao, Chem. Commun., 2019, 55, 4550–4553 RSC.
- S. P. Gupta, M. Gupta and S. K. Pal, ChemistrySelect, 2017, 21, 6070–6077 CrossRef.
- (a) J. L. Serrano and T. Sierra, Chem. – Eur. J., 2000, 6, 759–766 CrossRef CAS PubMed; (b) L. Álvarez, J. Barberá, L. Puig, P. Romero, J. L. Serrano and T. Sierra, J. Mater. Chem., 2006, 16, 3768–3773 RSC; (c) C. V. Yelamaggad, A. S. Achalkumar, D. S. S. Rao and S. K. Prasad, J. Mater. Chem., 2007, 17, 4521–4529 RSC.
- (a) G. Gottarelli, S. Lena, S. Masiero, S. Pieraccini and G. P. Spada, Chirality, 2008, 20, 471–485 CrossRef CAS PubMed; (b) T. Otani, F. Araoka, K. Ishikawa and H. Takezoe, J. Am. Chem. Soc., 2009, 131, 12368–12372 CrossRef CAS PubMed; (c) L. Cseh, X. Mang, X. Zeng, F. Liu, G. H. Mehl, G. Ungar and G. Siligardi, J. Am. Chem. Soc., 2015, 137, 12736–12739 CrossRef CAS PubMed; (d) H. Yu, C. Welch, W. Qu, C. J. Schubert, F. Liu, G. Siligardi and G. H. Mehl, Mater. Horiz., 2020, 7, 3021–3027 RSC.
- S. T. Trzaska, H. F. Hsu and T. M. Swager, J. Am. Chem. Soc., 1999, 121, 4518–4519 CrossRef CAS.
- M. S. Spector, S. K. Prasad, B. T. Weslowski, R. D. Kamien, J. V. Selinger, B. R. Ratna and R. Shashidhar, Phys. Rev. E: Stat. Phys., Plasmas, Fluids, Relat. Interdiscip. Top., 2000, 61, 3977–3983 CrossRef CAS PubMed.
- (a) G. Albano, G. Pescitelli and L. D. Bari, Chem. Rev., 2020, 120, 10145–10243 CrossRef CAS PubMed; (b) G. Pescitelli, S. Gabriel, Y. Wang, J. Fleischhauer, R. W. Woody and N. Berova, J. Am. Chem. Soc., 2003, 125, 7613–7628 CrossRef CAS PubMed; (c) F. J. M. Hoeben, M. Wolffs, J. Zhang, S. D. Feyter, P. Leclere, A. P. H. J. Schenning and E. W. Meijer, J. Am. Chem. Soc., 2007, 129, 9819–9828 CrossRef CAS PubMed; (d) N. Harada and K. Nakanishi, Circular dichroic spectroscopy: exciton coupling in organic stereochemistry, University Science Books, Mill Valley, CA, 1983.
- Y. Nailwal, A. D. D. Wonanke, M. A. Addicoat and S. K. Pal, Macromolecules, 2021, 54, 6595–6604 CrossRef CAS.
Footnote |
| † Electronic supplementary information (ESI) available: Chemical and physical characterization of all the compounds. See DOI: https://doi.org/10.1039/d2tc03847a |
| This journal is © The Royal Society of Chemistry 2023 |


