
 Open Access Article
 This Open Access Article is licensed under a
 Creative Commons Attribution 3.0 Unported Licence
Functionalization of graphenic surfaces by oxygen plasma toward enhanced wettability and cell adhesion: experiments corroborated by molecular modelling†
M.
Golda-Cepa
 a,
D.
Kumar
a,
M.
Bialoruski
a,
S.
Lasota
b,
Z.
Madeja
b,
W.
Piskorz
*a and
A.
Kotarba
*a
a,
D.
Kumar
a,
M.
Bialoruski
a,
S.
Lasota
b,
Z.
Madeja
b,
W.
Piskorz
*a and
A.
Kotarba
*a
aJagiellonian University, Faculty of Chemistry, Gronostajowa 2, 30-387 Kraków, Poland. E-mail: wpiskorz@chemia.uj.edu.pl; kotarba@chemia.uj.edu.pl
bJagiellonian University, Faculty of Biochemistry, Biophysics and Biotechnology, Department of Cell Biology, Gronostajowa 7, 30-387, Kraków, Poland
First published on 3rd May 2023
Abstract
Graphenic materials attract huge attention because of their outstanding properties, and have a wide range of applications as, i.e., components of biomaterials. Due to their hydrophobic nature, however, the surfaces need to be functionalized to improve wettability and biocompatibility. In this study, we investigate the functionalization of graphenic surfaces by oxygen plasma treatment, introducing surface functional groups in a controlled way. The AFM images and LDI-MS results clearly show that the graphenic surface exposed to plasma is decorated with –OH groups, whereas the surface topography remains intact. The measured water contact angle decreases significantly after oxygen plasma treatment from 99° to ca. 5°, making the surface hydrophilic. It is also reflected in the surface free energy values which increase from 48.18 mJ m−2 to 74.53 mJ m−2 when the number of surface oxygen groups reaches 4 –OH/84 Å2. The DFT (VASP) molecular models of unmodified and oxygen-functionalized graphenic surfaces were constructed and used for molecular interpretation of water-graphenic surface interactions. The computational models were validated by comparison of the theoretically determined water contact angle (based on the Young–Dupré equation) to the experimentally determined values. Additionally, the VASPsol (implicit water environment) results were calibrated against the explicit water models that can be used in further research. Finally, the biological role of functional groups on the graphenic surface was examined in terms of cell adhesion with the use of mouse fibroblast cell line (NIH/3T3). The obtained results illustrate the correlation between surface oxygen groups, wettability, and biocompatibility providing the guidelines for the molecular level-driven design of carbon materials for various applications.
1. Introduction
Graphenic materials are intensively explored due to their unique physiochemical properties such as a high surface-to-volume ratio, exceptional electrical and thermal conductivity, an affinity for heteroatom insertion, superior tensile strength, high electron transport capability, and biocompatibility.1–4 Due to the unique combination of properties, graphene itself and graphene-based materials have demonstrated their potential in the fields of biomedical applications as components of composite biomaterials.5–8 The high specific surface area and the ability of functionalization allow the graphenic materials to be suitable for adjusting cell–substance interactions and controlling drug loading efficiency due to multiple attachment sites. The materials can be then surface-functionalized with biomolecules or bioactive substances. As a result, a broad gamut of biomedical applications emerges, such as the delivery of drugs,9,10 genes, and proteins, as well as photothermal therapy,11 building biosensors,12 bioimaging,13 antimicrobial agents,14 and scaffolds for tissue engineering and cell cultures,15,16 to mention the most important.The biomaterial surface is the one that first comes in contact with the biological moieties. Therefore, the biocompatibility of the material is primarily influenced by the surface properties, like the wettability, surface charge, redox processes, surface energy, topography, and chemical nature of the functional groups.17 The wettability of a material surface, i.e., the hydrophobicity or hydrophilicity, is often used as a primary descriptor of surface biocompatibility. The practical concept of wettability results from the fact that it can be easily determined by employing the water contact angle of the material which is a straightforward and facile method.
The hydrophobic nature of graphene surfaces and thus poor dispersion in polar solvents are due to chemical inertness and lack of polar functional groups.18,19 To resolve these issues the surface properties of graphene require functionalization to fulfil the desired needs. The most common modification of the graphene surface is performed by the introduction of various polar groups and by forming dipoles which dramatically change the water–surface interface.20–22 Indeed, it has been observed in several works that the presence of surface functional groups such as hydroxyls can influence the interactions with biological moieties, i.e., cell adhesion, transmembrane transport, and bacteria colonization.23
Compared to traditional wet chemical oxidation methods that require harsh chemicals like strong acids, plasma is considered to be a facile option for tuning the surface properties of carbon materials by keeping their bulk properties intact.21,24 The plasma treatment is considered to be advantageous, as it is an environmentally friendly technique, takes a short time for functionalization, and can be precisely controlled by adjusting working parameters (type of feed gas, pressure, power of the generator, and exposure time). The plasma modification proved to be useful for the functionalization of various polymeric biomaterials such as polyethylenes,25 polycaprolactone,26 poly(p-xylylenes),27 and polyurethanes28 to mention the most often investigated in terms of biomedical applications.
Although the wettability concept and its correlation with biocompatibility are broadly accepted and applied for the experimental evaluation of biomaterials surfaces, the presented results are rather phenomenological, linking observable (contact angle) and outcome (biocompatibility). While the microscale observations are well documented, the understanding at the molecular level of water interactions with functionalized graphenic surfaces toward better biocompatibility is still lacking.
Nowadays, computational methods are available and brought to the center of the stage in surface chemistry. As a result, the interactions at the water-graphene interfaces can be theoretically addressed at the atomic scale. Simulations can be validated by experiments as the water contact angle can be used as a suitable parameter for the verification of the molecular model. The modeling of liquid water, however, requires the employment of a great number of configurations of molecules constituting the amorphous phase, hence the solid ice (the most common polymorph ice-1 h) model was used instead.29 In such a structure, the positions of hydrogens are ordered and selected in a way to cancel out the dipole moment. Such an approach seems legitimate since the surface energy of liquid water is very close to that of ice.
In this study, the changes in experimentally determined values of water contact angle and surface free energy induced by plasma functionalization were thoroughly investigated. The formation of surface functional groups was confirmed by LDI-MS, whereas the AFM observations revealed that the native graphenic surface topography was preserved. The computational models of unmodified and oxygen-modified graphenic surfaces (insertion of oxygen-functional groups) were constructed and their interactions with water (ice) were used for the determination of water contact angles. The DFT calculated values of water contact angles agreed with those experimentally measured, confirming the validity of the applied approach. Finally, the effect of surface oxygen functional groups was discussed in terms of their effect on cell adhesion, supporting the correlation between wettability and biocompatibility of graphenic materials.
2. Methodology
2.1. Samples preparation and modification
The conductive graphenic sheets with 25 μm thickness, 2 g cm−3 (Graphene Laboratories, Inc.) were used in the study. The samples were cut into 1 × 1 cm coupons and cleaned in isopropanol. The surfaces of graphenic samples were treated with the use of low-pressure oxygen plasma (Femto system, Diener Electronic GmbH) with the set of parameters listed in Table 1. The samples were placed in the chamber assuring a homogenous distribution of reactive oxygen species. The maximum time of exposure was 300 s to assure the surface modification before the material degradation. The basic bulk (Raman) and surface (XPS, SEM) characterization of the investigated materials can be found in Fig. S1 in the ESI† as well as in our previously published paper.24| Generator power/W | Exposure time/s |
|---|---|
| 6 | |
| 25 | 30 |
| 50 | 60 |
| 75 | 120 |
| 100 | 180 |
| 300 |
2.2. Atomic force microscopy
The surface topography imaging of the graphenic surfaces before and after plasma modifications was performed with the use of NanoWizard® 4XP (Brucker) and SCANASYST-AIR (Bruker) probes were applied. The images were collected with the resolution of 256 × 256 px and analysed with the use of JPK Data Processing software, version 7.0.153.2.3. Water contact angle measurements and surface free energy
The change in wettability (hydrophobic to hydrophilic) and surface free energy (SFE) after modification by oxygen plasma treatment of graphenic surfaces was measured using the instrument, Surftens Universal goniometer (OEG GmbH, Frankfurt (Oder), Germany; the range of measured contact angles 1–180° ± 0.1°). Static contact angles were calculated and analysed using image processing software (Surftens 4.3) in the automatic mode. The final value of contact angle was obtained for 2.5 μL ± 0.1 μL of water drops with at least 10 measurements for each sample. Lastly, the Owens–Wendt method30 was used to calculate the SFE, which takes into account specific (polar) interactions between the liquid and the solid surface. The polar components for SFE calculations were determined based on the water contact angle whereas the dispersive component was based on diiodomethane contact angle measurements.2.4. Laser desorption/ionization time of flight mass spectrometry (LDI-TOF-MS)
The nature of surface functional groups of unmodified and oxygen plasma-modified graphenic surfaces was determined using a laser desorption/ionization time-of-flight mass spectrometer (LDI-TOF-MS). The ultrafleXtremeTM instrument (Bruker Daltonics, Germany) equipped with a modified Nd:YAG laser (smartbeam II TM) was used, operating at a wavelength of 355 nm and a frequency of 1 kHz. The spectra were recorded in the scan range of 100–3500 m/z ratio in a positive ion mode using a reflector. The acceleration voltage was 25 kV, the reflector voltage was 26.46 kV, and the laser power was 100%. The spectrum obtained for each sample is an accumulation of 4000 laser shots.2.5. Cell culture tests
Cell culture tests of the unmodified and oxygen plasma-modified graphene paper were performed using the mouse fibroblast NIH/3T3 cell line (ATCC CRL-1658) grown in DMEM high glucose (Sigma-Aldrich) supplemented with 10% FBS (Gibco). The cells were seeded at a density of 5 × 10³ per well of a 24-well plate (Falcon) containing UV-illuminated graphene paper pressed with a sterile glass ring. Seeding on modified paper occurred within 2 hours of the plasma functionalization. After 24 h of culture, cells were fixed with 3.7% formaldehyde in PBS followed by permeabilization with 0.1% Triton X-100 in PBS and washing with PBS (all Sigma-Aldrich). The cells were stained with Alexa Fluor™ 568 phalloidin (for actin cytoskeleton) and Hoechst 33258 nucleic acid stain (both Invitrogen).31 Thoroughly washed with water, the samples were mounted in specimens between microscopic slides and coverslips with a fluorescence mounting medium (Dako Omnis).The stained cells images were captured using a Leica DMi8 fluorescence microscope equipped with an N PLAN L 20×/0.35 DRY objective, a monochromatic DFC7000GT CCD camera (all Leica, Wetzlar), and a pE-4000 LED illuminator (CoolLED) as a source of light. Quad-S filter cubes combined with filter wheels set at the DAPI and TRITC channels were used for blue and red fluorescence, respectively. Acquisition settings (i.e., pixel binning, electronic gain, and exposure time) were standardized for every captured image. Leica Application Suite X was used for both microscope control and further adjustment of the dynamic range of representative images. Raw images for quantitative analysis were exported and subsequently processed using Fiji ImageJ 1.53c software.32 Actin cytoskeleton images were median filtered and thresholded automatically. Combined with cell nuclei images, a further manual overview was conducted, where only individual and nondividing cells were selected. Finally, their area, length (major axis of the fitted ellipse), and circularity were assessed. The circularity of the cell was calculated by software according to the formula  , where the cell image becomes a perfect circle, while the parameter approaches a value of 1.0. For both compared conditions, parameters of at least 100 cells were examined. The nonparametric Mann–Whitney U test was chosen to reveal the statistically significant data. The analyses revealed that the quantified parameters are statistically highly significant differences (p < 0.0001) for the cell area, cell circularity, and cell length.
2.6. Computational details and methodology
In general, explicit modelling of liquid solvents comes with high computational cost mostly due to their amorphous nature but also due to the need to consider lengthy phase equalization time or comparatively run many concurrent simulations – each with a different, stochastic set of initial species positions and momenta. Additionally, for modelling an amorphous (in this case, liquid) phase, unit cell dimensions must be very large. It is because of these reasons that the level of theory in computations is limited mostly to the classical force field Newtonian dynamics (MD) or Van Oss–Chaudhury–Good (VCG) theory.33 MD approach, however, comes with a drawback of the necessity of the development of a custom set of force field parameters for a particular system. Furthermore, employing Born-Oppenheimer molecular dynamics with first principles quantum-chemical interaction potential may turn out to be costly for a system with more than a few dozen atoms with dynamics running for at least thousands of femtoseconds. Deployment of DFT-based methods projects the benefit of requiring fewer input parameters and provides higher flexibility combined with better accuracy of calculated values; nonetheless, proper construction of models and planning the methodology for difficult data analysis and interpretation make the application of such an approach less favorable. Hence, its popularity is rather low. A feasible alternative is to use an approach based on the Young–Dupré equation which can be further reformulated to obtain the relationship between the water contact angle and two energies.34 The first is adhesion energy – USL at the water-substrate interface, and the second is cohesion energy ULV/2 at the water/water interface. The aforementioned energy values can be obtained from the quantum-chemical, e.g., DFT calculations. The Young-Dupré equation then takes the form of:| cos(WCA) = (USL – ULV/2)/ULV/2. |
In order to circumvent the problem of unit cell size, crystalline ice can be used in place of liquid water. This solution significantly simplifies calculations, but also it is possible since the surface energy of ice (75.6 mN m−1) is very close to that of liquid water (72.8 mN m−1). One additional benefit of such an approach is the very good commensurability of graphene and ice lattices, which permits building a relatively small model using high accuracy DFT or vdV-DFT levels of theory. In this article, such a model of graphene/ice interface was deployed.
Our chosen approach, however, has two unfortunate inconveniences. The first is related to chemical moieties decorating the graphene surface and their influence on model energy calculation convergence. Embedded groups of ORR intermediates (e.g., OOH*, O*, OH*) introduce the dipole moment component perpendicular to the graphene surface which is to be compensated in the model with PBC in the normal direction. The existence of the dipole moment, even with the artificial compensation by the quantum-chemical code, slows down the convergence of the electronic structure. It also requires the testing of the convergence of the properties with an increase in the model height. Such a procedure unfortunately entails an increase in computational cost for every conducted simulation. Another way, albeit unconventional, is to deploy the mirrored “counterweight” groups on the top of our unit cell to compensate for the dipole moment. The second issue in the case of the crystalline ice/graphene model concerns the introduction of surface defects or surface functional groups. The termination of the ice slab (i.e., the particular position of water molecules) can be, however, ambiguous, and therefore, a pool of conceivable structures needs to be calculated to provide sufficient unbiased representation. Also, the issue of non-commensurability of the substrate and ice slab may emerge.
In this article, we used the procedure comprehensively described in the work of J.Y. Lu et al.,34 adapted to get the work of adhesion and the interfacial tension using the solid/liquid periodic slab model, was used for calculating the water contact angle from the first principles at the DTF+D level of theory. Models shown in Fig. 1 represent an ice slab series (from left A, B, C) for simulations required to be run as a set to determine the water contact angle via the postulated approach.
 | ||
| Fig. 1 The simplified sketch of the ice/graphene bilayer computational models used for the determination of the cohesion (A and C) and adhesion (B and C) energies. The insert shows the details of the interface geometry. Functional groups are colored differently for clarity (oxygen – magenta, hydrogen – cyan). For the same purpose, the ice slab thickness was also decreased. | ||
Moreover, the pivotal issue of our study is the effective impact of surface decoration and coverage with functional groups on the water contact angle and the comparison thereof for different ways of plasma treatment. Hence, it does seem interesting to study the possibility of using a computationally cost-effective, implicit water model to simulate a series of different moieties decorating graphene instead of the much more demanding model, both computationally and conceptually, of explicit water/ice layer (see Fig. S2, ESI†).35
The DFT calculations were carried out with the use of the VASP36–39code, with the plane wave energy cut-off equal to 450 eV, the GGA-PBE40+D41,42 correlation–exchange functional, the IBZ sampling with k points 3 × 3 × 1 density, the SCF convergence criterion: 10−6 eV between two successive steps, and the geometry optimization criterion of the gradient norm: 10−5 eV Å−1 were set. The Gaussian smearing of the occupation function with a width of 0.05 eV was used as a convergence accelerator. The A and B unit cell lengths of the slab were determined by the minimization of the total energy, while the C length was set to provide enough space for the ice cluster and to suppress the unphysical interactions with the “ceiling” (translationally symmetric image in the normal direction) of the slab. The convergence of the energies with the height of the slab was checked by performing the calculations with models of 40 Å to 100 Å length in the C direction (height).
Deriving the WCA formula from the Young–Dupré equation, we begin with: Eadh = Ylv(1 + cos(WCA)),43,44 which in a different form, would be (as stated above) the same as cos(WCA) = 2(Ysl − Ylv/2)/Ylv, where:
• Eadh is the energy of adhesion of liquid;
• Ysl represents the surface energy on the phase boundary between solid and liquid phases. It is synonymous with adhesion energy.
• Ylv represents the surface energy on the phase boundary between liquid and gas (vacuum) phases. It is synonymous with cohesion energy.
Simplifying the above formula gives us: cos(WCA) = 1 − (2Ysl/Ylv).
The values of Ylv for liquid water and ice can be taken from the literature34,43, which are equal to 72.8 mN m−1 and 75.6 mN m−1, respectively.
The cohesion and adhesion energies can be determined by calculating the differences in the total energies obtained from the described series of models. To obtain the cohesion energy, the difference between the values for models C and A (Fig. 1) (as they represent the two borderline cases of splitting of the ice layer) should be calculated. However, to obtain the adhesion energy, the difference between the values for models C and B should be calculated as they represent the separation of the ice layer from graphene.
To circumvent the above-mentioned problems, we verify the applicability of the hybrid approach. To investigate the impact of surface defects on the adhesion of the ice slab, we deploy the DFTsol method (“implicit solvent”) which approximates the electrostatic and dispersion interactions of the atomic model and the solvent (liquid phase) as an interaction of the self-consistent polarizable continuum with the atomic structure of the solid. This method is known for its accurate reproduction of stabilization energy of the dipolar molecules (e.g., water or hydroxyls) within an implicit environment.45 For some cases, however, in particular for the ORR intermediates (e.g., OOH*, O*, OH*), a certain underestimation of the solvation energy was reported by Zhang et al. In their DFT electrochemical calculations35 this is, however, a systematic error and can be accounted for. A similar correction was also expected in our study; hence, the correlation between the adhesion energies – one obtained with the use of the ice slab and the other obtained using the DFTsol method – has been studied. Within such methodology, the adhesion energy as the difference EDFTsol – EDFT was taken. Using the implicit solvent approach also led to a decrease in the size of the unit cell in the normal direction to as low as 20 Å.
To account for the implicit solvent (water) effect, the VASPsol46–48 extension to the VASP code was used. The calculated Ediff = EDFTsol − EDFT values for the bilayered graphene surface decorated with –OH or –COOH functional groups are summarised below (Fig. 2).
 | ||
| Fig. 2 Correlation between the adhesion energy (Eadh) derived from the explicit water model and the implicit solvent model (Ediff). The values (100 Å, 40 Å, and 20 Å) denote the height of the unit cell in the VASPsol calculations. It is noteworthy that the Ediff values obtained for a given functionalization for all unit cell heights are equal within the accuracy of ca. 0.01 eV. | ||
3. Results and discussion
To investigate whether the plasma modification induces any changes in graphenic surface topography, the AFM characterization was performed and compared with the reference unmodified material. The corresponding images of 5 μm × 5 μm are presented in Fig. 3. The AFM observations revealed that all the graphenic samples exhibit similar surface topography. To quantify the surface irregularity, the averaged root mean square (![[R with combining macron]](https://www.rsc.org/images/entities/i_char_0052_0304.gif) RMS) roughness was determined for the basal plane area (1 μm × 1 μm), and the values, along with their standard deviation, are equal to 30.2 ± 5.4 nm, 33.4 ± 4.8 nm, and 36.4 ± 4.9 nm, for unmodified, modified 6 s, and 300 s graphenic samples, respectively. The obtained RMS values are almost the same within the experimental errors and a slightly increasing trend in surface roughness can be noticed. These observations are in line with the Raman, XPS and SEM results presented in the ESI† Fig S1a–c. While the functionalization by oxygen plasma is reflected in an increase in the surface oxygen content, the SEM graphenic surface morphology remains unchanged. Nevertheless, the prolonged exposure to plasma (5 min) may lead to minor structural destruction as revealed by the appearance in Raman spectra of a small D band at 1350 cm−1 corresponding to a disordered carbon structure. Thus, upon higher exposure time to plasma only, the graphenic surface can be etched as discussed elsewhere in terms of DFT molecular modelling24 and experimentally observed for several carbon materials like graphite, graphene, and CNTs when oxygen plasma was applied for their functionalization.49–51
RMS) roughness was determined for the basal plane area (1 μm × 1 μm), and the values, along with their standard deviation, are equal to 30.2 ± 5.4 nm, 33.4 ± 4.8 nm, and 36.4 ± 4.9 nm, for unmodified, modified 6 s, and 300 s graphenic samples, respectively. The obtained RMS values are almost the same within the experimental errors and a slightly increasing trend in surface roughness can be noticed. These observations are in line with the Raman, XPS and SEM results presented in the ESI† Fig S1a–c. While the functionalization by oxygen plasma is reflected in an increase in the surface oxygen content, the SEM graphenic surface morphology remains unchanged. Nevertheless, the prolonged exposure to plasma (5 min) may lead to minor structural destruction as revealed by the appearance in Raman spectra of a small D band at 1350 cm−1 corresponding to a disordered carbon structure. Thus, upon higher exposure time to plasma only, the graphenic surface can be etched as discussed elsewhere in terms of DFT molecular modelling24 and experimentally observed for several carbon materials like graphite, graphene, and CNTs when oxygen plasma was applied for their functionalization.49–51
 | ||
| Fig. 3 Representative AFM images of the unmodified and oxygen-plasma modified graphenic surfaces together with the averaged RMS values were determined for the basal plane 1 μm2 area, illustrating surface structure stability upon exposure to plasma under the applied conditions. | ||
In Fig. 4 the LDI-MS spectra for untreated and oxygen plasma treated (6 s, 300 s) graphenic surfaces are presented. The spectra are in the m/z range of 100–1600 and illustrate a big change in surface composition upon plasma modification. Not only do the characteristic peaks change but also the whole spectrum shifts towards lower m/z values. This observation is directly related to an increase in the work function of the graphenic surface with oxygen surface concentration which results in a dramatic change in the ionization efficiency of the desorbing fragments.24 In Fig. 4 (grey panel), the possible clusters detected in LDI-MS spectra are shown for the unmodified (C54+, C70+, C87+) and functionalized (C26OH+, C28O+, C32COOH+) graphenic surface. Since relatively weak van der Waals bonding is present between the graphenic planes, in comparison to strong covalent C–C bonds, the observed clusters are flat and represent the fragments of the graphenic plane. The basic interpretation of the spectra and identification of the detected carbon and carbon–oxygen clusters are collated in Table S1 (see the ESI†). The analysis of the spectra reveals the insertion of oxygen into the carbon matrix. The characteristic m/z maxima prove the formation of surface –OH, –COOH, –CO groups with the dominant presence of hydroxyls. The oxygen functionalities are detected together with larger clusters of six-fold aromatic rings, as shown in Fig. 4. Such chemical modification is in line with the previously reported functionalization of carbon materials such as graphene, graphite, and nanotubes via oxygen plasma treatment investigated via XPS and SIMS.18,52,53
 | ||
| Fig. 4 LDI-MS spectra for unmodified and oxygen plasma-modified graphenic surfaces together with the corresponding carbon and carbon–oxygen functionalized clusters. | ||
Exposure of graphenic surfaces to plasma results in significant changes in hydrophilicity once the oxygen functional groups are introduced. The impact of modification by oxygen plasma on the water contact angle (WCA) as a function of treatment time for various plasma powers is presented in Fig. 5. The water contact angle for the unmodified graphenic surface is 99.7° ± 3.6°, similar to the previously reported data,19 which defines the surface as hydrophobic (WCA > 90°). Upon plasma treatment, a gradual increase in the surface hydrophilicity was observed; after a short plasma treatment (6–30 s), the values of the WCA decreased, depending on the applied plasma generator power 25–100 W down to 33.3°–20.2°, respectively, indicating that the surfaces become hydrophilic. The plasma treatment under more severe conditions, i.e., longer treatment time resulted in further reduction of WCA to 5.4° ± 0.7° (60 s) and further to 3.6° ± 0.6° (300 s), rendering the surface wettable. It can be observed that the total SFE calculated based on the Owens–Wendt method gradually increases for the oxygen plasma modified surfaces from 48.18 mJ m−2 (unmodified graphene) to 74.53 mJ m−2 (modified graphene, 100 W, 300 s) being in line with previously reported values for similar materials.21
 | ||
| Fig. 5 The influence of oxygen plasma modification on the water contact angle and surface free energy as a function of exposure time for various plasma powers (25–100 W). | ||
To present the effect of graphene surface functionalization on its biocompatibility, the adhesion and morphology of mouse NIH/3T3 fibroblasts were assessed and presented in Fig. 6. After 24 hours following seeding, cells cultured on the modified surface were significantly more spread (average cell area 1807 ± 83 μm2 compared to 1079 ± 47 μm2) and elongated (average cell length, designated as the major axis of the fitted ellipse, 74.5 ± 2.1 μm compared to 52.8 ± 1.5 μm, on the modified and unmodified surface, respectively). All the quantified differences in cell morphology are statistically highly significant (p < 0.0001, nonparametric Mann–Whitney U test). In contrast, the increase in the circularity of the cells on the unmodified surface confirms their far more rounded morphology visible in the representative images. A well-developed actin cytoskeleton structure, including the presence of stress fibers assembled by cells growing on the modified surface, confirms their tight adhesion to the graphenic material. At the same time, migratory structures like lamellipodia abundant within the examined cell population confirm their maintained ability to active migration; however, the final proof requires experiments on living cells.
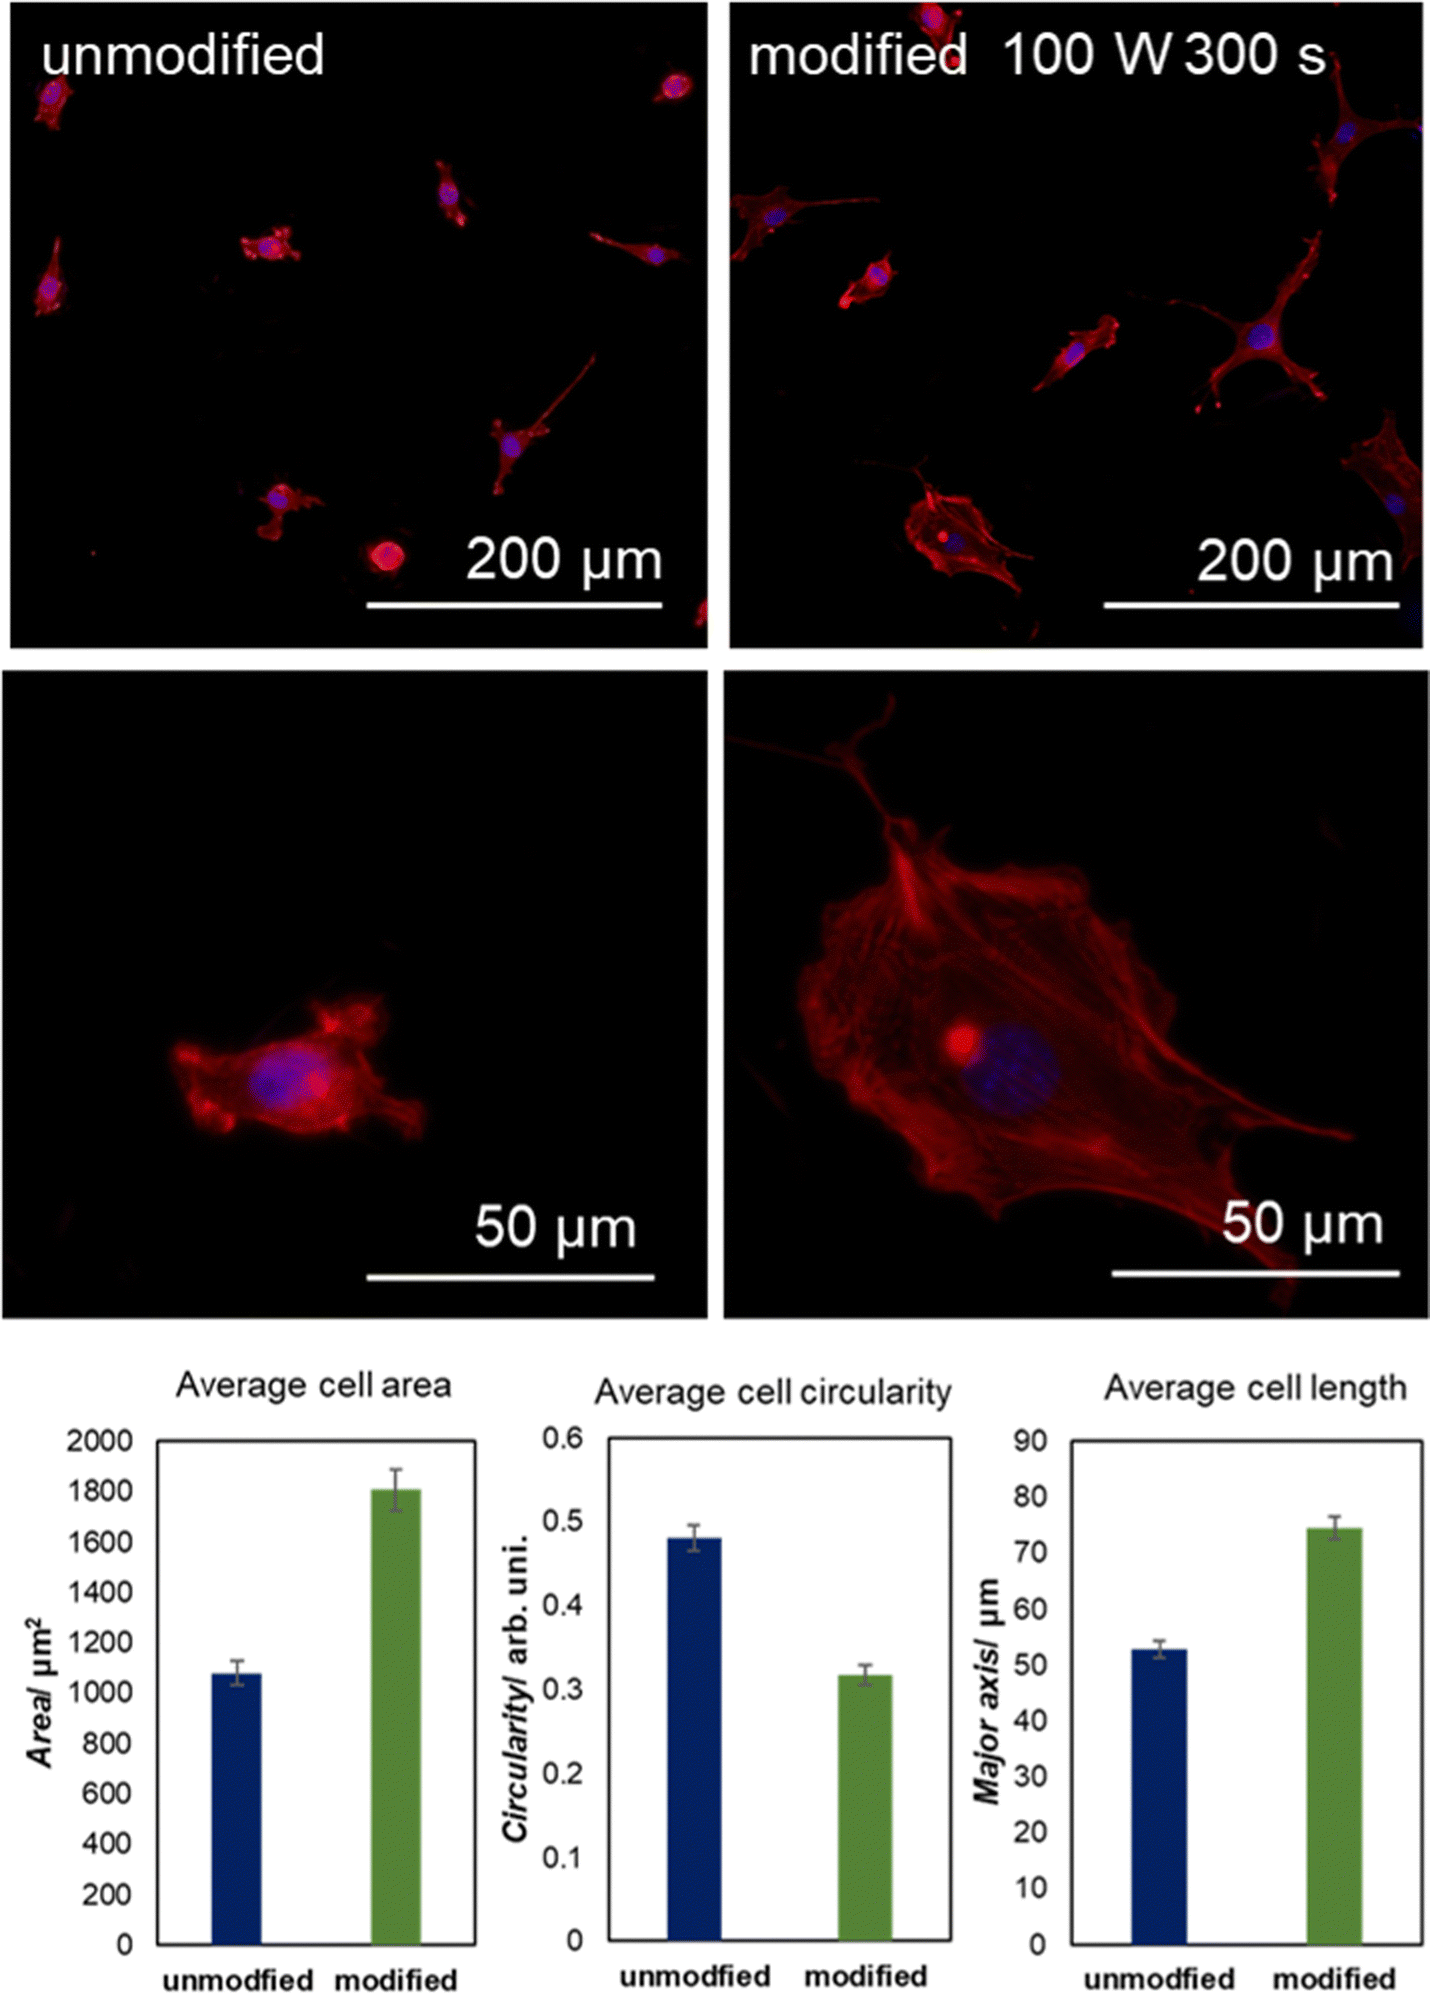 | ||
| Fig. 6 Representative images of mouse NIH/3T3 fibroblasts cultivated on unmodified and oxygen plasma-modified graphene surfaces. The actin cytoskeleton (red) and cell nuclei (blue) were stained and visualized via fluorescence microscopy. Quantitative analysis shows the effect of functionalization on average cell area, circularity, and elongation (lower panel). The error bars are standard errors of the mean (SEM). | ||
The DFT modelling provides a molecular picture of the water-graphenic surface interfaces. The interactions between water molecules and the bare and functionalized surfaces strongly depend on the nature and the number of the functional groups. A representative example of the interaction of 3 –OH groups with a slab of ice is shown in Fig. 7, whereas the geometrical parameters used for interaction analysis are defined in Fig. 8.
 | ||
| Fig. 7 The functional –OH groups at the graphene layer and their interaction with the ice slab. The hydrogen bonds are marked as pale blue dashed lines and the maximal H–O distance for the hydrogen bond was equal to 2.5 Å, while the minimal O–H–O angle was 90°. The “counterweight” groups attached to the bottom graphenic layer are not shown for the sake of clarity. The O and H atoms of the functional groups are presented in magenta and turquoise, and the O and H atoms of the ice slab are coded as red and white, respectively. The bottom and top graphene layers are blue and gray, respectively. | ||
 | ||
| Fig. 8 Geometry measurement definition: interatomic distance and C–O–H angle values (denoted in blue), interatomic distances and H–O–H angle (denoted in pink), the distance between the surface and the carbon atom connected to –OH group (green lines). The specific values are provided in Tables 3 and 4. | ||
The introduction of polar functional groups strongly affects the wettability, quantified by the water contact angle values, as shown in Table 2. It is noteworthy that the calculated values, based on the Young–Dupré equation are in very good agreement with the experimentally measured values. While for the bare surface, the WCA was calculated to be 89°, the experimental value equals 99°. Upon functionalization with oxygen plasma (insertion of surface oxygen groups), the trends in the water contact angle, both theoretical and experimental, are the same, i.e., the higher the surface oxygen coverage, the higher the wettability. For the highest number of functional groups (4 OH/84 Å2), the theoretical WCA drops down to 22°, while the measured value was as low as 5°. Although the spectroscopic results show the –OH groups as a dominating surface functionality, it should be noted that the –COOH groups also similarly alter wettability. Since they substantially differ in size and polarity, at the lower coverage (1 functional group/84 Å2), the carboxyls have a greater effect on wettability than hydroxyls, while for the saturated surface (4 functional groups/84 Å2), the difference vanishes (Table 2 and Table S2, ESI†). In conclusion, it can be inferred from the WCA trends (theoretical and experimental) that both –OH and –COOH groups efficiently increase the hydrophilicity of the graphenic surfaces which are otherwise hydrophobic.
| Numer of –OH groups | WCA/deg |
|---|---|
| 0 | 89 |
| 1 | 81 |
| 2 | 27 |
| 4 | 22 |
In Fig. 8 and Table 3, the details of the ice impact on the geometry of the functional groups, parameterized by the C–O and H–O bond lengths, and the C–O–H angle, are presented. It can be noticed that the elongation of the O–H bond upon contact with ice takes place, suggesting that the hydrogen bonds between the surface –OH groups and the water molecules are formed. This is also reflected in the distortion of the C–O–H angles. It should not be overlooked, however, that the particular values of both mentioned parameters are observed for the specific location of the functional groups which, under the experimental conditions, is stochastically averaged. The changes in the geometry of the plasma-generated functional groups upon interaction with ice are summarised in Table 3, while the distortion within the graphenic layer and the changes in H2O molecule geometry are summarized in Table 4. As can be seen, upon the interaction of the –OH group with the ice layer, the O–H bond undergoes elongation, and the C–O–H angle rises which reflects the surface O–H bond weakening imposed by the formation of the hydrogen bond with the ice layer. This effect is most pronounced for the single –OH system. The changes in the surface geometry and the adjacent water molecules imposed by their mutual interactions are also reflected by the distortion of the protruding –OH groups, namely the distance between the rehybridized carbon atom and the average plane formed by the adjacent carbons, DC-Plane, changes non-monotonically with the number of –OH groups. Particularly, for 1OH, the distortion is lower in the presence of ice which is in line with the higher elongation of the C–O bond and the shortening of  in this case. However, for higher –OH coverage, the
  rises, albeit only slightly. All these contributions cumulatively contribute to the changes in the adhesion energy (Fig. 2) and thus, via the Young-Dupré equation, in the WCA.
| Numer of –OH groups | D C–O/Å | D O–H/Å | ∢C–O–H/° | |||
|---|---|---|---|---|---|---|
| w/o ice | Ice | w/o ice | Ice | w/o ice | Ice | |
| 1 | 1.494 | 1.673 | 0.899 | 0.979 | 106.26 | 117.86 |
| 2 | 1.496 | 1.481 | 0.979 | 1.015 | 106.41 | 111.66 |
| 3 | 1.498 | 1.485 | 0.979 | 1.001 | 106.56 | 111.31 |
| 4 | 1.499 | 1.495 | 0.979 | 0.998 | 106.53 | 110.60 |
| Numer of –OH groups | D C-plane/Å |
|
∢H–O–H/° | ∢H–O–H std. deviation/° | ||||
|---|---|---|---|---|---|---|---|---|
| w/o ice | Ice | w/o ice | Ice | w/o ice | Ice | w/o ice | Ice | |
| 1 | 0.383 | 0.332 | 0.993 | 0.992 | 106.14 | 106.23 | 1.87 | 1.86 |
| 2 | 0.395 | 0.412 | 0.991 | 0.996 | 105.81 | 106.48 | 1.85 | 1.79 |
| 3 | 0.370 | 0.369 | 0.992 | 0.995 | 105.58 | 105.88 | 1.81 | 3.41 |
| 4 | 0.367 | 0.371 | 0.991 | 0.996 | 106.12 | 105.65 | 1.89 | 3.36 |

Summing up, the series of functionalized graphenic surfaces were investigated experimentally and corroborated with DFT molecular modeling. It has been shown that the parent surfaces (hydrophobic) were turned into wettable ones upon oxygen plasma treatment. The chemical nature of the surface functional groups has been determined with the use of LDI-TOF-MS, revealing that –OH groups are dominant. The optimized plasma treatment parameters allow for modification confined to the outermost layers, while the properties of the graphenic materials remain unchanged. Such controlled modification is of key importance for the application of graphenic flakes as a component of composite biomaterials, as was illustrated by the cell adhesion tests. The results clearly show that the introduction of surface –OH groups stimulated their spreading, which indicates better biocompatibility of the functionalized graphenic surfaces.
The theoretical model of graphenic bilayer interaction with the condensed water slab was proposed to evaluate the changes in water contact angle via Young–Dupré theory. It was also found that the inherent drawbacks of the limited size of the slab surface and its translational symmetry, contrary to the experimental stochastic decoration of the surface, can be solved with the use of the averaged values of the solvent model (DFTsol). Such correction allows for the determination of the adhesion energy from the results of the DFTsol calculations which allows for the significant speedup of the DFT-based modelling of the WCA (implicit solvent modelling instead of the much more computationally demanding explicit mode). The practical implications of the study consist in a direct correlation between the water contact angle and the number of functional groups. In our previous works, we determined the correlation between the work function and the number of surface functional groups.24 Following this relationship, the experimental values of water contact angle based on the surface coverage can be determined. This allows for a direct comparison between the experimental and theoretical values of WCA. In Fig. 9, the good agreement between the theoretically and experimentally determined water contact angle values is presented, verifying the applied methodology.
 | ||
| Fig. 9 The correlation between experimentally measured and theoretically determined water contact angle values. | ||
4. Conclusions
In this work, the modification of the graphenic surface as a function of oxygen functional groups introduced via plasma treatment was investigated experimentally, while the molecular interpretation was provided by DFT modelling. The effects of oxygen plasma functionalization were evaluated by AFM, LDI-MS, and water contact measurements. The obtained results clearly illustrate that even a short exposure to plasma (5 s, 100 W, 0.2 mbar O2) leads to the transformation of the hydrophobic graphenic surface into the hydrophilic one as evidenced by a change of water contact angle from ∼100° to 5°, respectively. The AFM microscopic images show that the surface topography remains unchanged, while LDI-MS revealed the introduction of the surface oxygen groups (mostly –OH). The changes in wettability were discussed in terms of DFT-calculated surface dipoles and their interactions with the water phase via the Young–Dupré model which links the DFT adhesion and cohesion energies directly with the water contact angle. Such a methodology was proved to be valid since the calculated contact angle was 89° and 22° for unmodified and oxygen-functionalized surfaces, respectively. As surface wettability is a well-known primary descriptor of material biocompatibility, biological tests were performed to elucidate the beneficial role of surface functional groups on cell adhesion. This study represents a successful approach, where the AFM, LDI-MS, and WCA experimental results were corroborated with the DFT modelling (both explicit and implicit water phase), which provided the molecular interpretation of the functionalization processes and water-graphenic surface interactions, serving as descriptors of graphenic surface biocompatibility. The combined experimental and computational results provide evidence for the validity of this methodology and suggest its potential application to the functionalization of other biomaterial surfaces.Conflicts of interest
There are no conflicts to declare.Acknowledgements
This study was supported by the National Science Centre, Poland, under grant no. 2020/37/B/ST5/03451.References
- R. Kumar, R. Rauti, D. Scaini, M. Antman-Passig, O. Meshulam, D. Naveh, L. Ballerini and O. Shefi, Adv. Funct. Mater., 2021, 31, 2104887 CrossRef CAS.
- L. Daneshmandi, M. Barajaa, A. Tahmasbi Rad, S. A. Sydlik and C. T. Laurencin, Adv. Healthcare Mater., 2021, 10, 2001414 CrossRef CAS PubMed.
- C. Cheng, S. Li, A. Thomas, N. A. Kotov and R. Haag, Chem. Rev., 2017, 117, 1826–1914 CrossRef CAS PubMed.
- J. Li, H. Zeng, Z. Zeng, Y. Zeng and T. Xie, ACS Biomater. Sci. Eng., 2021, 7, 5363–5396 CrossRef CAS PubMed.
- D. P. Singh, C. E. Herrera, B. Singh, S. Singh, R. K. Singh and R. Kumar, Mater. Sci. Eng. Carbon, 2018, 86, 173–197 CrossRef CAS PubMed.
- Y. Qu, F. He, C. Yu, X. Liang, D. Liang, L. Ma, Q. Zhang, J. Lv and J. Wu, Mater. Sci. Eng. Carbon, 2018, 90, 764–780 CrossRef CAS PubMed.
- R. Imani, F. Mohabatpour and F. Mostafavi, Carbon, 2018, 140, 569–591 CrossRef CAS.
- Y. Jin, J. Zhou, X. Zhao, X. Zhang and Z. Su, J. Mater. Chem. B, 2022, 10, 9040–9053 RSC.
- K. Yang, L. Feng and Z. Liu, Adv. Drug Delivery Rev., 2016, 105, 228–241 CrossRef CAS PubMed.
- N. B. Moghadam, M. Avatefi, M. Karimi and M. Mahmoudifard, J. Mater. Chem. B, 2023, 11, 2568–2613 RSC.
- M. Yan, Y. Liu, X. Zhu, X. Wang, L. Liu, H. Sun, C. Wang, D. Kong and G. Ma, ACS Appl. Mater. Interfaces, 2019, 11, 1876–1885 CrossRef CAS PubMed.
- T. Hu, L. Zhang, W. Wen, X. Zhang and S. Wang, Biosens. Bioelectron., 2016, 77, 451–456 CrossRef CAS PubMed.
- J. Lin, X. Chen and P. Huang, Adv. Drug Delivery Rev., 2016, 105, 242–254 CrossRef CAS PubMed.
- G. Cao, J. Yan, X. Ning, Q. Zhang, Q. Wu, L. Bi, Y. Zhang, Y. Han and J. Guo, Colloids Surf., B, 2021, 200, 111588 CrossRef CAS PubMed.
- E. Kolanthai, P. A. Sindu, D. K. Khajuria, S. C. Veerla, D. Kuppuswamy, L. H. Catalani and D. R. Mahapatra, ACS Appl. Mater. Interfaces, 2018, 10, 12441–12452 CrossRef CAS PubMed.
- H. Nalvuran, A. E. Elçin and Y. M. Elçin, Int. J. Biol. Macromol., 2018, 114, 77–84 CrossRef CAS PubMed.
- P. C. Henriques, I. Borges, A. M. Pinto, F. D. Magalhães and I. C. Gonçalves, Carbon, 2018, 132, 709–732 CrossRef CAS.
- J. Duch, M. Gołda-Cępa, W. Piskorz, J. Rysz and A. Kotarba, Appl. Surf. Sci., 2021, 539, 148190 CrossRef CAS.
- X. Chi, J. Zhang, J. P. Nshimiyimana, X. Hu, P. Wu, S. Liu, J. Liu, W. Chu and L. Sun, RSC Adv., 2017, 7, 48184–48188 RSC.
- J. Feng and Z. Guo, Nanoscale Horiz., 2019, 4, 339–364 RSC.
- W. Pajerski, J. Duch, D. Ochonska, M. Golda-Cepa, M. Brzychczy-Wloch and A. Kotarba, Mater. Sci. Eng. Carbon, 2020, 113, 110972 CrossRef CAS PubMed.
- E. K. Price, T. Bansala, T. C. Achee, W. Sun and M. J. Green, J. Colloid Interface Sci., 2019, 552, 771–780 CrossRef CAS PubMed.
- S. Priyadarsini, S. Mohanty, S. Mukherjee, S. Basu and M. Mishra, J. Nanostruct. Chem., 2018, 8, 123–137 CrossRef CAS.
- M. Białoruski, D. Kumar, M. Gołda-Cępa, W. Piskorz and A. Kotarba, Appl. Surf. Sci., 2022, 597, 153671 CrossRef.
- K. R. Sumesh, Z. Ghanem, P. Spatenka and Z. Jenikova, Polym. Compos., 2023, 44, 1004–1016 CrossRef CAS.
- A. A. Ivanova, D. S. Syromotina, S. N. Shkarina, R. Shkarin, A. Cecilia, V. Weinhardt, T. Baumbach, M. S. Saveleva, D. A. Gorin, T. E. L. Douglas, B. V. Parakhonskiy, A. G. Skirtach, P. Cools, N. De Geyter, R. Morent, C. Oehr, M. A. Surmeneva and R. A. Surmenev, RSC Adv., 2018, 8, 39106–39114 RSC.
- M. Golda-Cepa, K. Riedlová, W. Kulig, L. Cwiklik and A. Kotarba, ACS Appl. Mater. Interfaces, 2020, 12, 12426–12435 CrossRef CAS PubMed.
- M. F. Griffin, A. Ibrahim, A. M. Seifalian, P. E. M. Butler, D. M. Kalaskar and P. Ferretti, Mater. Sci. Eng. Carbon, 2019, 105, 110085 CrossRef CAS PubMed.
- W. Kuhs, D. Bliss and J. Finney, J. Phys. Colloques, 1987, 48, C1-631–C1-636 Search PubMed.
- M. Golda-Cepa, M. Brzychczy-Wloch, K. Engvall, N. Aminlashgari, M. Hakkarainen and A. Kotarba, Mater. Sci. Eng. Carbon, 2015, 52, 273–281 CrossRef CAS PubMed.
- M. Paw, D. Wnuk, D. Kadziołka, A. Sęk, S. Lasota, J. Czyż, Z. Madeja and M. Michalik, Int. J. Mol. Sci., 2018, 19, 2571 CrossRef PubMed.
- J. Schindelin, I. Arganda-Carreras, E. Frise, V. Kaynig, M. Longair, T. Pietzsch, S. Preibisch, C. Rueden, S. Saalfeld, B. Schmid, J. Y. Tinevez, D. J. White, V. Hartenstein, K. Eliceiri, P. Tomancak and A. Cardona, Nat. Methods, 2012, 9(9:7), 676–682 CrossRef CAS PubMed.
- P. C. Rieke and J. Cryst, Growth, 1997, 182, 472–484 CrossRef CAS.
- J. Y. Lu, C. Y. Lai, I. Almansoori and M. Chiesa, Phys. Chem. Chem. Phys., 2018, 20, 22636–22644 RSC.
- Q. Zhang and A. Asthagiri, Catal. Today, 2019, 323, 35–43 CrossRef CAS.
- G. Kresse and J. Hafner, Phys. Rev. B: Condens. Matter Mater. Phys., 1993, 48, 13115 CrossRef CAS PubMed.
- G. Kresse and J. Furthmüller, Comput. Mater. Sci., 1996, 6, 15–50 CrossRef CAS.
- P. E. Blöchl, Phys. Rev. B: Condens. Matter Mater. Phys., 1994, 50, 17953 CrossRef PubMed.
- G. Kresse and D. Joubert, Phys. Rev. B: Condens. Matter Mater. Phys., 1999, 59, 1758 CrossRef CAS.
- J. P. Perdew, K. Burke and M. Ernzerhof, Phys. Rev. Lett., 1997, 78, 1396 CrossRef CAS.
- S. Grimme, J. Comput. Chem., 2004, 25, 1463–1473 CrossRef CAS PubMed.
- S. Grimme, J. Comput. Chem., 2006, 27, 1787–1799 CrossRef CAS PubMed.
- J. Y. Lu, Q. Ge, H. Li, A. Raza and T. Zhang, J. Phys. Chem. Lett., 2017, 8, 5309–5316 CrossRef CAS PubMed.
- W. D. Kaplan, D. Chatain, P. Wynblatt and W. C. Carter, J. Mater. Sci., 2013, 48, 5681–5717 CrossRef CAS.
- S. Sakong, M. Naderian, K. Mathew, R. G. Hennig and A. Grob, J. Chem. Phys., 2015, 142, 234107 CrossRef PubMed.
- K. Mathew, R. G. Hennig and J. Bértoli DOI:10.5281/ZENODO.2555053.
- K. Mathew, R. Sundararaman, K. Letchworth-Weaver, T. A. Arias and R. G. Hennig, J. Chem. Phys., 2014, 140, 084106 CrossRef PubMed.
- K. Mathew, V. S. C. Kolluru, S. Mula, S. N. Steinmann and R. G. Hennig, J. Chem. Phys., 2019, 151, 234101 CrossRef PubMed.
- J. Zhu, H. Deng, W. Xue and Q. Wang, Appl. Surf. Sci., 2018, 428, 941–947 CrossRef CAS.
- N. Singh, J. Chen, K. K. Koziol, K. R. Hallam, D. Janas, A. J. Patil, A. Strachan, J. G. Hanley and S. S. Rahatekar, Nanoscale, 2016, 8, 8288–8299 RSC.
- S. Seo, S. Kim, S. Yamamoto, K. Cui, T. Kodama, J. Shiomi, T. Inoue, S. Chiashi, S. Maruyama and A. J. Hart, Carbon, 2021, 180, 204–214 CrossRef CAS.
- J. Duch, M. Golda-Cepa and A. Kotarba, Appl. Surf. Sci., 2019, 463, 1134–1140 CrossRef CAS.
- J. Duch, M. Mazur, M. Golda-Cepa, J. Podobiński, W. Piskorz and A. Kotarba, Carbon, 2018, 137, 425–432 CrossRef CAS.
Footnote |
| † Electronic supplementary information (ESI) available. See DOI: https://doi.org/10.1039/d3tb00536d |
| This journal is © The Royal Society of Chemistry 2023 |