
Enhancing the Marangoni flow by inner side chain engineering in nonfullerene acceptors for reproducible blade coating-processed organic solar cell manufacturing†
Geunhyung
Park‡
a,
Yongjoon
Cho‡
 ac,
Seonghun
Jeong
a,
Jeewon
Park
a,
Seong-Jun
Yoon
*a and
Changduk
Yang
*ab
ac,
Seonghun
Jeong
a,
Jeewon
Park
a,
Seong-Jun
Yoon
*a and
Changduk
Yang
*ab
aSchool of Energy and Chemical Engineering, Perovtronics Research Center, Low Dimensional Carbon Materials Center, Ulsan National Institute of Science and Technology (UNIST), 50 UNIST-gil, Ulju-gun, Ulsan 44919, South Korea. E-mail: yang@unist.ac.kr; yoonsj@unist.ac.kr
bGraduate School of Carbon Neutrality, Ulsan National Institute of Science and Technology (UNIST), 50 UNIST-gil, Ulju-gun, Ulsan 44919, South Korea
cDepartment of Chemistry and Materials Research Center, Northwestern University, 2145 Sheridan Road, Evanston, IL 60208, USA
First published on 12th May 2023
Abstract
The industrial-scale, uniform film production of active layers is a prerequisite for high-performance, reproducible organic solar cells (OSCs), becoming a significant challenge. Blade coating, one of the most suitable protocols for industrial-scale OSC manufacturing, can be significantly affected by evaporation-driven convective flows (e.g., capillary and Marangoni flows), which directly influence film uniformity. Here, we present in-depth studies on how convective flows in blade coating-processed OSC fabrication depend on the inner side chain lengths of nonfullerene acceptors (L8-i-EB, L8-i-EH, and L8-i-BO). By analyzing the device performance in nine different regions in a blade-coated substrate, we find that the degree of variations in power conversion efficiency ranges from 15.61% to 16.85% (standard deviation (σ) of 0.38%) for the L8-i-EB-based device, 15.31% to 17.20% (σ of 0.57%) for the L8-i-EH-based device, and 13.92% to 16.66% (σ of 0.97%) for the L8-i-BO-based device. This demonstrates that compared with the others, the L8-i-EB-based device with a shorter inner side chain enables higher reproductivity in blade coating-processed OSC fabrication, attributed to its superior film uniformity induced by the enhanced inward-directional Marangoni flow while counteracting the capillary flow. This study highlights the importance of the Marangoni flow effect and its contribution to realizing reproducible blade coating-processed OSCs.
Introduction
The film uniformity of active layers in organic solar cells (OSCs) is critical to realizing their commercialization because power conversion efficiency (PCE) depends strongly on the thickness and morphology of the layer.1–13 Therefore, most state-of-the-art, highly efficient OSCs require a sophisticated control of device fabrication for the optimal thickness and morphology of the active layer with less fluctuation. Although spin coating is an easy and simple method for depositing the active layer in solution-processed OSCs, there is an implicit limitation of incompatibility with the roll-to-roll (R2R) process for mass production owing to their feature of discrete manufacturing.13–17 To overcome such a limitation, various printing techniques such as slot die coating, spray coating, and vapor-based deposition have emerged.18–25 Among these, blade coating is considered a promising method for large-area OSC fabrication due to its simple, reproducible, cost-effective process, and compatibility with the R2R process, resulting in a significant amount of research on blade coating-based large-area OSC fabrication.26–30 However, convective flows, which are generated during active layer film deposition in the blade coating process, can still cause film uniformity issues. Furthermore, they can be severe during large-area manufacturing.In principle, there are two dominant evaporation-driven convective flows, namely, capillary flow and Marangoni flow, assisting the mass transport of dissolved molecules during the blade coating process.31–36 (i) The capillary flow is attributed to a distortion of the equilibrium shape of a surface by non-uniform evaporation. It generates outward convective flows and induces excessive mass transport to the edge, which is a common undesirable phenomenon for printing uniform films, also called the coffee ring effect. (ii) The Marangoni flow is closely correlated with the surface tension gradient, which can be produced by the concentration gradient. In this regard, the surface tension of a solution begins to diverge as the solution evaporates and solidifies. The direction of the Marangoni flow is from a region with lower surface tension to that with higher surface tension. As surface tension is inversely proportional to the solution concentration in the case of a general solution with a weak intermolecular force, the Marangoni flow is expected to move from the high-concentration region (high evaporation rate) to the low-concentration region (low evaporation rate) along the solution–air interface.37,38 The Marangoni flow toward the inward direction can compensate for the outward mass transport of molecules induced by the capillary flow. Consequently, the Marangoni flow is a key factor for determining thin film uniformity by compensating for excessive mass transport.
The Marangoni flow is closely related to the solubility of molecules because surface free energy correlates with solubility parameters.39,40 One way to alter the solubility is to tune side chains as a solubilizing group in organic active layer materials.41–43 The tuning of side chains is an important factor in controlling morphological properties such as domain size and purity, as well as molecular packing, induced by changes in the miscibility of active layer materials in bulk-heterojunction OSCs.44–52 Therefore, many efforts have been devoted to finding the optimal side chain of active layer materials to improve PCE despite the sufficient solubility of state-of-the-art active layer materials reported recently. There is substantial research on side chain tuning of active layer materials for enhanced device performance in lab-scale OSCs. However, research reports on the effects of the side chain of active layer materials on large-area OSC fabrication processes are lacking even though large-area OSC fabrication is inevitable for the commercial viability of OSCs. Therefore, it is critical to understand how active layer molecular structures affect film uniformity in the blade coating process.
In this study, we systematically investigate how different Marangoni flows occur depending on the inner side chain lengths of nonfullerene acceptors (NFAs) and the degree of difference in film uniformity caused by the Marangoni flow during the blade coating process. For this research purpose, we have synthesized three L8-core-based NFAs with different inner side chains namely, (2-ethylbutyl (EB), 2-ethylhexyl (EH), and 2-butyloctyl (BO) substitutions), termed L8-i-EB, L8-i-EH (well-known as L8-BO), and L8-i-BO (previously reported as BT-4BO), respectively.53,54 To investigate the relationship between the Marangoni flow and the length of the inner side chain of NFAs, we measured the surface energy of each NFA neat film and the surface tension of each NFA solution at various concentrations using the pendant drop method. We found that the surface tensions of the NFA solutions decrease as the concentration increases, indicating that the Marangoni flow is in the inward direction. Besides, we observed that as the length of the side chains in the NFAs decreases (from L8-i-BO to L8-i-EH and then L8-i-EB), the surface tensions of the NFA solutions at the same concentration and the surface energy of the NFA neat films gradually decrease. This implies that a stronger Marangoni flow in an inward direction in the L8-i-EB solution induces a more uniform film than in the L8-i-EH and L8-i-BO solutions. To further identify film uniformity, the thickness and surface roughness of the blade-coated active layer at nine different spots on a thin film were measured using a surface profiler and atomic force microscopy (AFM). As expected, the L8-i-EB thin film exhibited the most uniform roughness and thickness, whereas the L8-i-BO thin film exhibited the most irregular roughness and thickness. Moreover, the PCE of nine different devices on a substrate exhibited different deviations depending on the inner side chain lengths of the NFAs, presumably due to the varying film uniformity of the active layer. The variations in device performance were evaluated to be from 15.61% to 16.85% (standard deviation (σ) of 0.38%) for the L8-i-EB-based device, 15.31% to 17.20% (σ of 0.57%) for the L8-i-EH-based device, and 13.92% to 16.66% (σ of 0.97%) for the L8-i-BO-based device. This indicates that a short inner side chain of NFAs is preferable to a long one for uniform device fabrication using the blade coating process.
Results and discussion
Material characterization and blade coating film optimization
Fig. 1a shows a schematic illustration of the blade coating process for OSC fabrication. The height of the blade from the substrate is fixed at a distance of 200 μm. The concentration and amount of the cast solution affecting the film thickness were fixed as 16 mg mL−1 in chloroform and 15 μL, respectively. Notably, the temperature of the substrate was maintained at 45 °C. A donor polymer PM6 and three NFAs ((L8-i-EB, L8-i-EH, and L8-i-BO); see their chemical structures in Fig. 1b) were used in this study. Their synthetic routes and characterization are provided in Scheme S1 and ESI.† The normalized ultraviolet-visible absorption spectra of the three NFAs in solution and film states are shown in Fig. S1,† and the relevant data are summarized in Table S1.† The three NFAs exhibited excellent absorption spectra complementary to PM6 in the visible region of 650–750 nm with high absorption coefficients. The highest occupied molecular orbital (HOMO) and the lowest unoccupied molecular orbital (LUMO) energy levels were measured by cyclic voltammetry, as depicted in Fig. S2.† The energetic EHOMO/ELUMO values are −5.68/−3.98, −5.72/−3.99, and −5.80/−3.97 eV for L8-i-EB, L8-i-EH, and L8-i-BO, respectively. These results support the hypothesis that the donor PM6 and the three NFAs can be efficient donor–acceptor pairs for OSC active layers in terms of optical and electrochemical properties.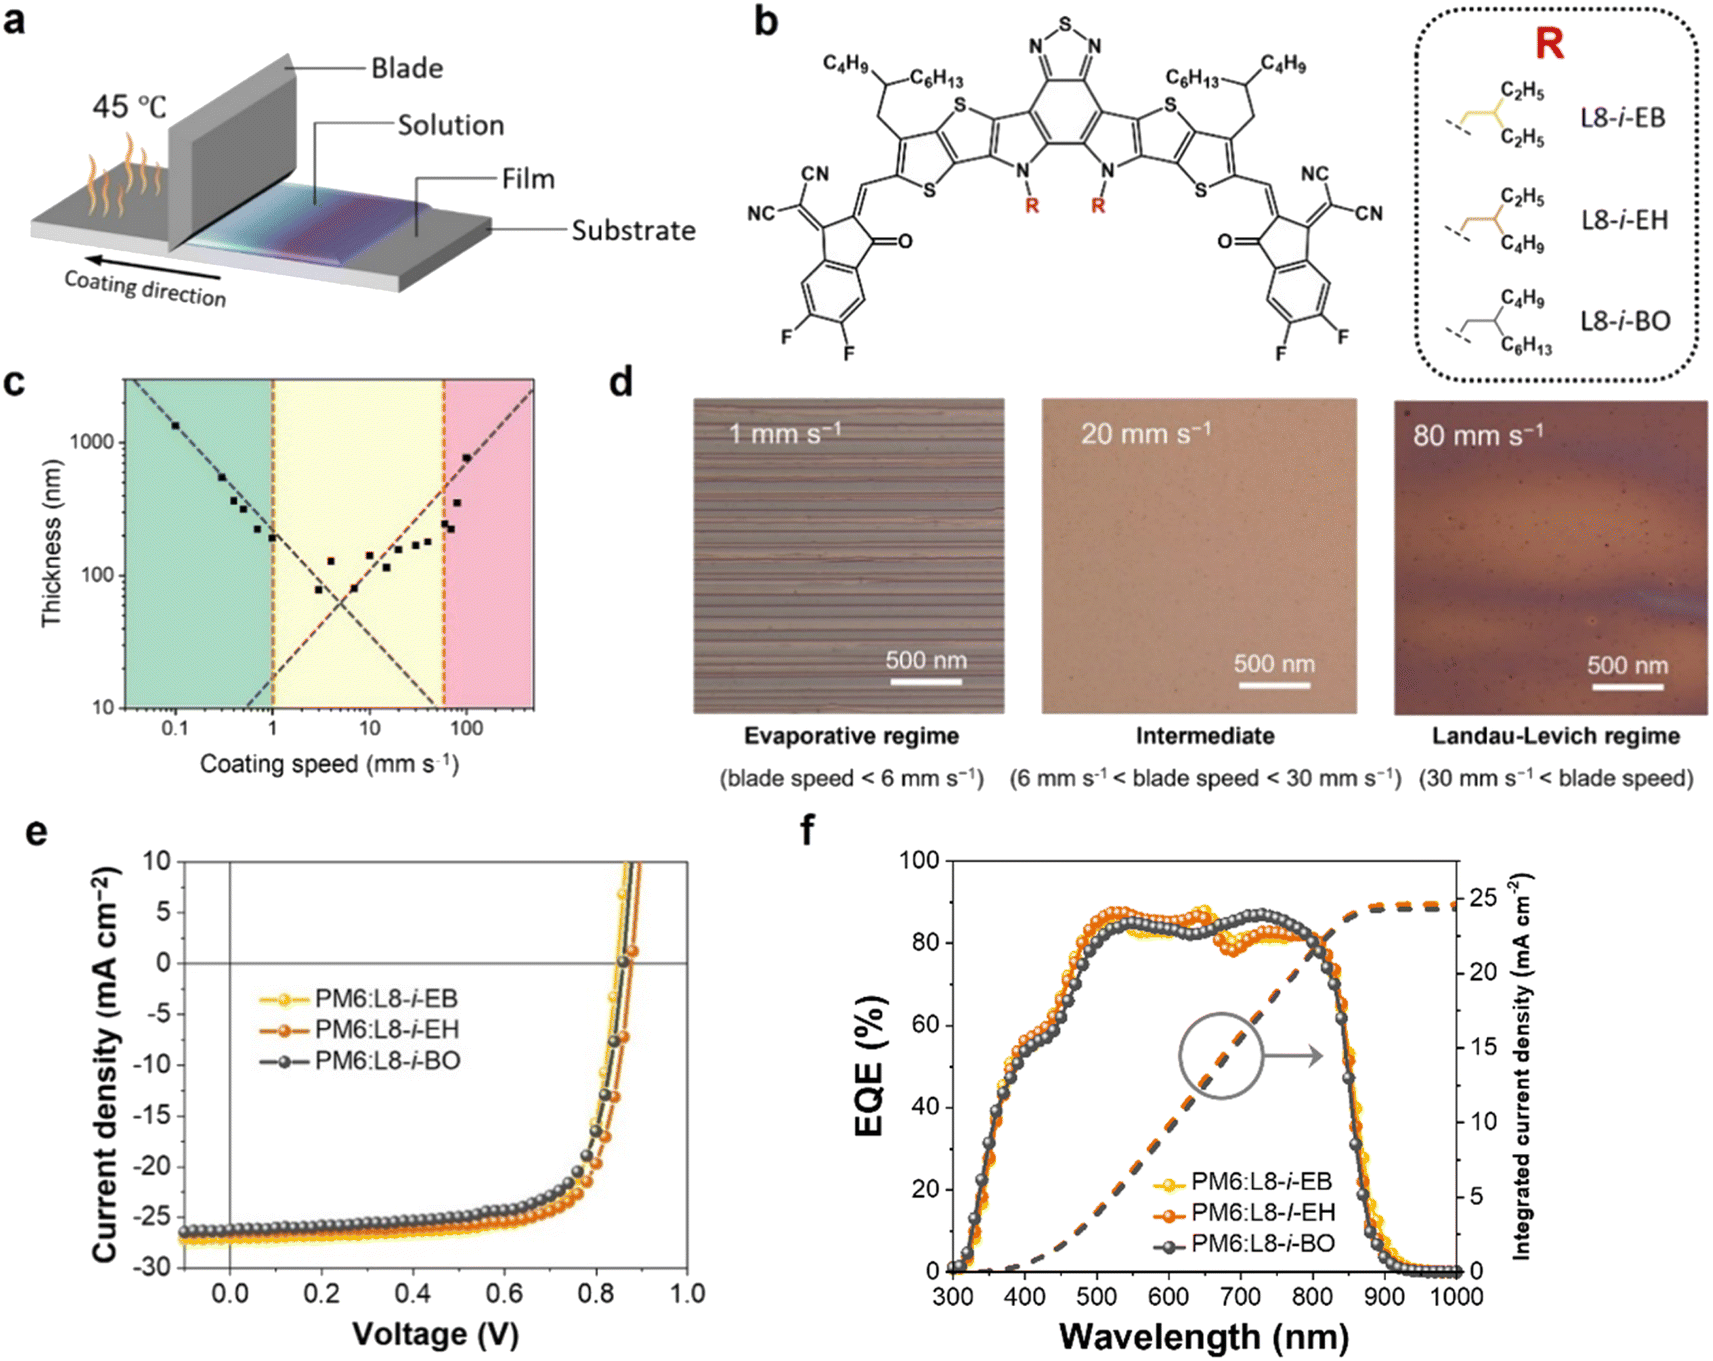 | ||
| Fig. 1 (a) The schematic illustration of the blade-coating process. (b) Chemical structures of L8-i-EB, L8-i-EH, L8-i-BO, and PM6. (c) Thickness of active layers depending on blade speed. (d) Optical microscopy images of films fabricated at a speed within the evaporative regime, intermediate, and Landau–Levich regime. (e) J–V curves and (f) EQE spectra and integrated current density curves of the optimized PM6:NFA-based device. | ||
First, we thoroughly screened the blade speeds for film uniformity because microscale morphology is sensitive to the blade speed and consequent solution drying time.55–57 As shown in Fig. 1c, the thickness of the coated film has a strong dependence on the blade speed, characterizing two deposition regimes: the evaporative regime, where the increased blade speed decreases the thickness of deposited films; the Landau–Levich regime, where the increased blade speed increases the thickness of deposited films. Thus, the evaporative and Landau–Levich regimes typically occur at low and high blade speeds, respectively. The optimal blade speed range is the intermediate region of these two regimes, with the following underlying reasons. In the evaporative regime, the blade speed is too low for mass production, and a stick-slip phenomenon can be observed, which is a repetitive fluctuation of film thickness, as observed in the microscopy image in Fig. 1d (left). In the Landau–Levich regime, the high blade speed is advantageous for industrial-scale production. However, the film formation is unaffected by the meniscus, indicating that the blade cannot control the generation of additional nucleation sites.58,59 The additional nucleation caused irregular film formation, as observed in the microscopy image in Fig. 1d (right). Consequently, improved film uniformity can be observed in the intermediate regime, a boundary between the two regimes (Fig. 1d shows the intermediate regime and Fig. 1d (middle) shows the microscopy image). The intermediate region was estimated to range from 6 to 40 mm s−1 under the specific drying conditions of chloroform as a solvent with a substrate temperature of 45 °C.
Photovoltaic properties and film crystallinities of blade-coated OSCs
To evaluate the photovoltaic performance of the blade-coated films, the conventional configuration OSC devices (ITO/PEDOT:PSS/PM6:NFA/PNDIT-F3N-Br/Ag) based on PM6:NFAs were prepared using the blade coating process (see ESI† for the fabrication details). Fig. 1e illustrates the representative current density–voltage (J–V) curves of the optimized devices with an active area of 0.04 cm2 under simulated AM1.5G one-sun illumination at 100 mW cm−2. The relevant photovoltaic parameters are summarized in Table 1. Among the three systems, the PM6:L8-i-EH-based device exhibited the best PCE of 17.30% with an open-circuit voltage (VOC) of 0.885 V, a short-circuit current density (JSC) of 25.86 mA cm−2, and a fill factor (FF) of 75.56%. The L8-i-EB exhibited a PCE of 16.71% with a VOC of 0.869 V, a JSC of 25.97 mA cm−2, and a FF of 74.04%. The L8-i-BO-based device exhibited the lowest PCE of 16.36% with a VOC of 0.881 V, a JSC of 24.31 mA cm−2, and a FF of 76.40%. In addition, Fig. 1f shows the corresponding external quantum efficiency spectra and integrated JSC curves for each system. The calculated JSC values from EQE spectra were estimated to be 24.64, 24.59, and 24.29 mA cm−2 for L8-i-EB-, L8-i-EH-, and L8-i-BO-based devices, respectively, which were found to be in good agreement with the values from the J–V curves within a 6% inaccuracy. Note also that the photovoltaic performance of the blade coating-processed devices was optimized at a blade speed within the intermediate region, implying that the processed films have as much uniformity as possible. The photovoltaic parameters depending on the blade speed are summarized in Tables S2–S4.†| Active layer | V OC [V] | J SC [mA cm−2] | J EQESC [mA cm−2] | FF [%] | PCE [%] |
|---|---|---|---|---|---|
| a Average PCEs are obtained from at least 10 devices. | |||||
| PM6:L8-i-EB | 0.869 (0.862 ± 0.007) | 25.97 (25.93 ± 0.04) | 24.64 | 74.04 (73.83 ± 0.21) | 16.71 (16.51 ± 0.20) |
| PM6:L8-i-EH | 0.885 (0.885 ± 0.000) | 25.86 (25.81 ± 0.05) | 24.59 | 75.56 (75.23 ± 0.33) | 17.30 (17.20 ± 0.10) |
| PM6:L8-i-BO | 0.881 (0.876 ± 0.005) | 24.31 (24.24 ± 0.07) | 24.29 | 76.40 (76.21 ± 0.19) | 16.36 (16.18 ± 0.18) |
To examine the charge recombination, the relationship between light intensity (Plight) and JSC and VOC was measured. The relationship between JSC and Plight can be described as JSC ∝ Plightα. α close to unity reflects the efficient suppression of bimolecular recombination in a device.60–62 As shown in Fig. S3a,† the devices have comparable levels of bimolecular recombination, as evidenced by their similar α values above 0.96 in the fitted curves. In addition, the relationship between VOC and Plight can be described as VOC ∝ nkT/q![[thin space (1/6-em)]](https://www.rsc.org/images/entities/char_2009.gif) ln(Plight), where k, T, and q represent the Boltzmann constant, temperature (K), and elementary charge, respectively. If the slope is larger than kT/q, it can be implied that trap-assisted recombination occurs in addition to bimolecular recombination.63,64 Fig. S3b† shows that the n values of the L8-i-EB-, L8-i-EH-, and L8-i-BO-based devices are 1.32, 1.32, and 1.34, respectively, implying that the degrees of trap-assisted recombination in the three NFA-based devices are similar.
ln(Plight), where k, T, and q represent the Boltzmann constant, temperature (K), and elementary charge, respectively. If the slope is larger than kT/q, it can be implied that trap-assisted recombination occurs in addition to bimolecular recombination.63,64 Fig. S3b† shows that the n values of the L8-i-EB-, L8-i-EH-, and L8-i-BO-based devices are 1.32, 1.32, and 1.34, respectively, implying that the degrees of trap-assisted recombination in the three NFA-based devices are similar.
The crystallinity of NFA-based neat and blend films was investigated by grazing-incidence wide-angle X-ray scattering measurements (see Fig. S4†). All films were prepared on a Si substrate using the blade casting method under the same conditions as the device fabrication. Both the NFA-based neat and blend films exhibited strong π–π diffraction peaks in the out-of-plane direction, demonstrating their face-on dominant packing orientation. Notably, as the inner side chains of the NFAs are increased from EB to BO, the π–π diffraction peaks are split, and numerous scattering spots appear in the low-q range, corresponding to high-ordered interferences from the unit cell.65 Besides, for the π–π diffraction peak, the d-spacing gradually decreased, whereas the crystal coherence length increased when the length of the inner side chain of the NFAs increased (see Table S5†). These results indicate that NFAs with longer inner side chains form more aggregated and crystalline films than those with shorter inner side chains during the blade casting process, which might be responsible for the low PCE of the L8-i-BO-based device.
Induced Marangoni flow estimation in NFA solutions
To fabricate high-quality thin films, the coating solution must be spread out and evaporated uniformly. Evaporation starts simultaneously with solution spreading. Although the blade evenly distributes the coating solution under precise control of parameters such as solution amount, blade height and speed, and substrate temperature, evaporation-driven flows cause inhomogeneity in films. The origin of these evaporation-driven flows is the prevailing non-equilibrium conditions, such as evaporative flux gradients and concentration gradients. Non-uniformity of evaporation can be observed from various points of view, as shown in Fig. 2a. In the front view, the difference in evaporation flux is caused by the shape of the drop of the solution. The surface area-to-volume ratio on the edge is higher than that at the center, indicating that fast evaporation occurs on the edge. However, this influence is negligible in the conventional blade coating process of OSCs because rims contribute to a small portion of the entire area, which might be considered a dead area in full device structures.61 Conversely, in the side view, the difference in evaporative flux results from different starting times of film deposition, meaning more influence of evaporation-driven flows than in the front view. Therefore, many efforts have been made to solve this problem, for example, preparing wettability-patterned substrates, using solvent additives, and using an accelerated blade.55,66–69 In this regard, our study focused on the dominant convective flows in directions vertical to the blade, the capillary flow, and the Marangoni flow, as shown in Fig. 2b. Both the capillary and Marangoni flows occur due to the non-uniform evaporation of the solution. A distortion of the equilibrium shape of the drop-free surface produces a capillary flow. As the solution dries, the evaporative mass loss is replenished by the capillary flow, which flows outward from the body of a cast coating solution. Therefore, excessive materials are stacked at the edge, causing severe inhomogeneity. The Marangoni flow is produced by a gradient in surface tension, inducing the flow with a direction from the low- to high-surface tension regions. This surface tension gradient originated from the difference in the concentration of dissolved materials. Generally, increasing the concentration of the organic solution may decrease the surface tension, indicating that the Marangoni flow moves inward along the surface. Consequently, the Marangoni flow is expected to draw back the transport of excessive mass from the edge to the body, resulting in the formation of homogeneous films.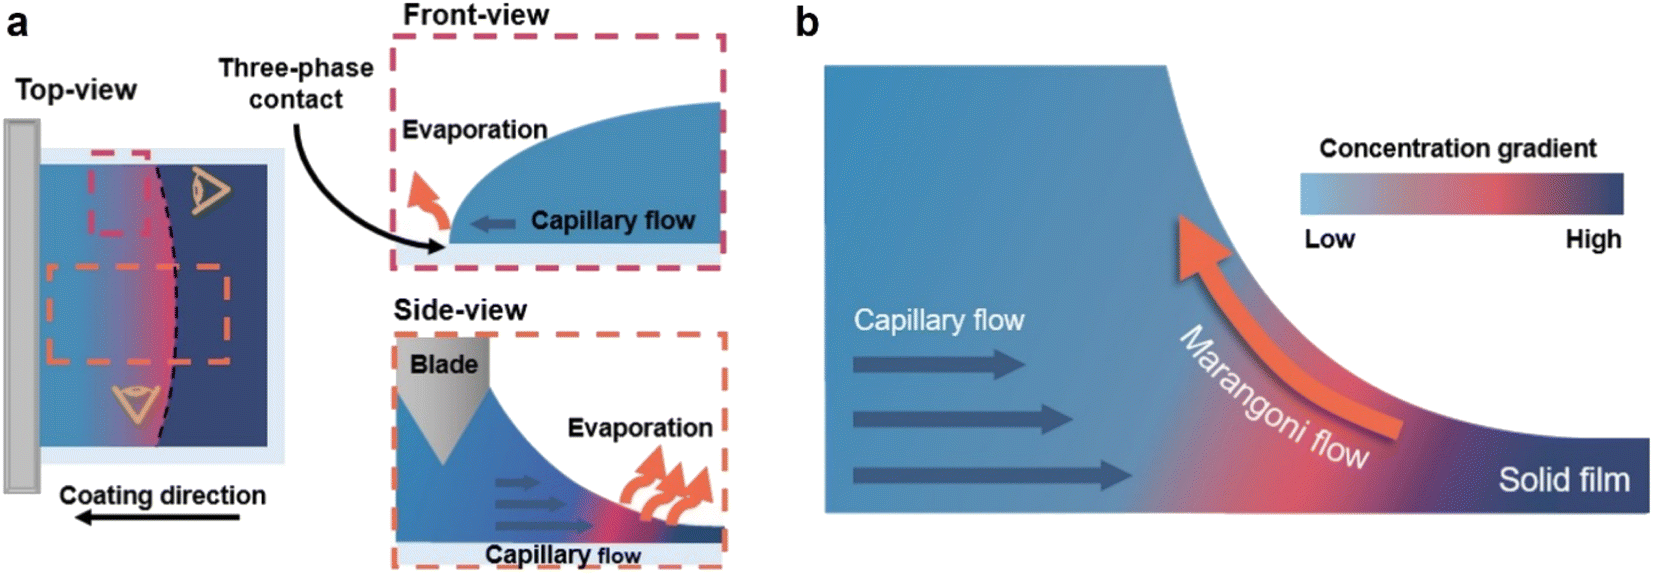 | ||
| Fig. 2 (a) Schematic illustrations of non-uniform evaporation in the blade coating process in the top-view, side-view, and front-view. (b) Schematic illustration of two dominant convective flows: the capillary flow and the Marangoni flow in the side-view of the blade-coating process. | ||
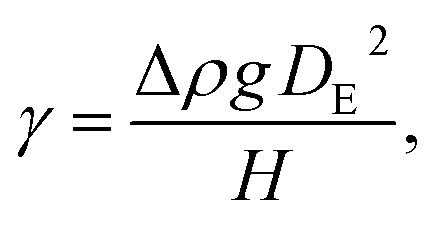
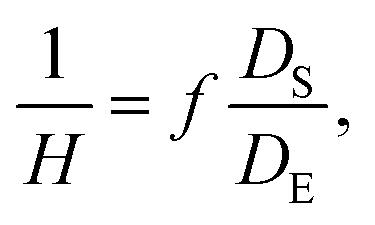
The dependence of surface tension on the solution concentration determines the occurrence of the Marangoni flow during the film deposition process. To measure the surface tension variation of the active layer material-dissolved solution depending on the concentration, the pendant drop method was implemented with the experimental setup shown in Fig. 3a. Solutions of L8-i-EB, L8-i-EH, and L8-i-BO with concentrations of 8, 16, 24, and 32 mg mL−1 in chloroform were prepared, and their surface tensions were measured in a controlled temperature of 25 °C and humidity of 31%. Surface tension can be calculated with the following Young–Laplace equation using the pendant drop image in the inset of Fig. 3a:
 | (1) |
 | (2) |
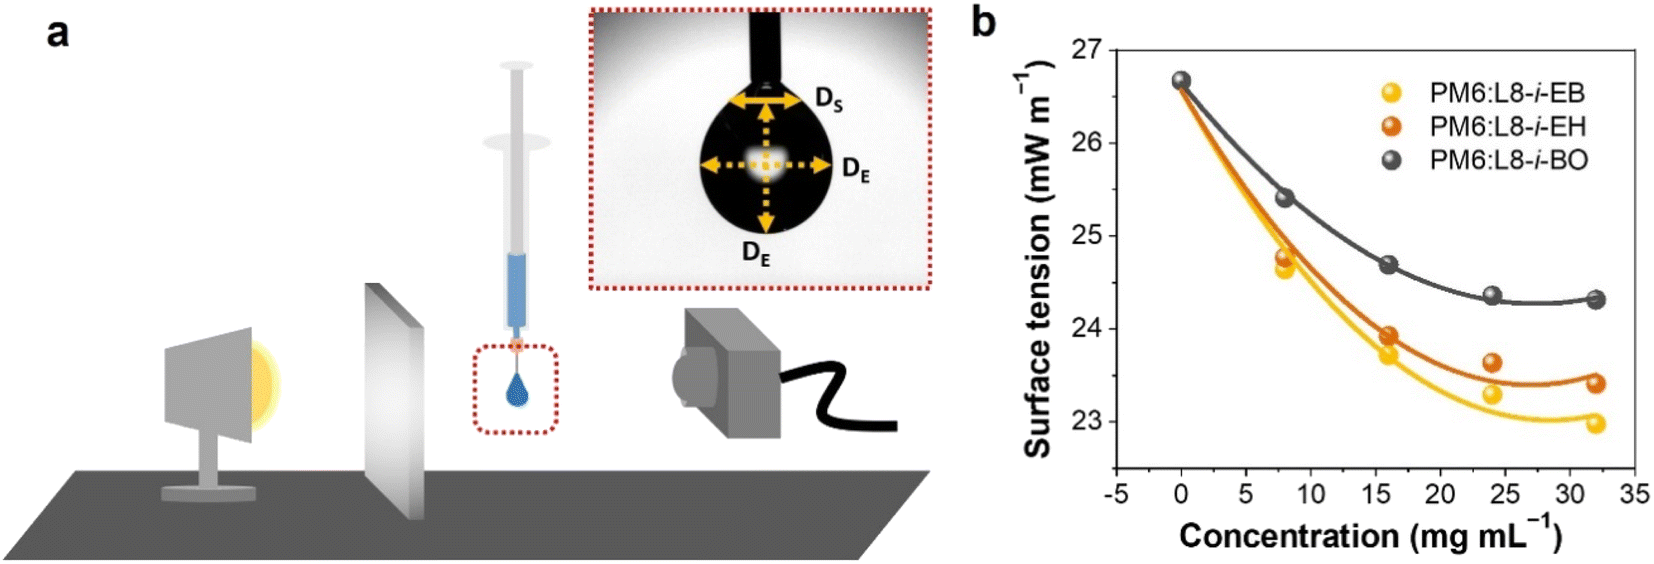 | ||
| Fig. 3 (a) Illustration of the experimental setup of the pendant drop method and an image of a hanging droplet. (b) Surface tension of three NFA-dissolved solutions depending on concentration. | ||
Large area uniformity investigation of blade-coated films
The thickness of the active layer is one of the important factors in the device optimization process as it is directly related to the charge carrier pathway and light absorption, which is closely related to the photovoltaic parameters FF and JSC. The tradeoff relationship between FF and JSC is influenced by the thickness of the active layer. Regarding thick films, the more light absorbed through such films increases the number of charge carriers, resulting in high JSC. However, the long charge carrier pathway to the electrode increases the probability of recombination, resulting in low FF. Regarding thin films, the short charge carrier pathway to the electrode is favorable to achieve a high FF, but the insufficient light absorption results in deficient charge carriers, leading to low JSC. Many representative OSCs have exhibited strong thickness dependence on device performance during the device optimization process.43,46,47,49To further verify the effects of controlled Marangoni flow on film formation, the thickness of active layers and surface morphology were thoroughly investigated in nine different regions of each 5 cm × 5 cm substrate by the surface profiler and AFM. If the inward Marangoni flow counteracts the outward capillary flow effectively, the thickness of active layers and surface morphology in each region will show similar results, indicating almost the same film deposition conditions. The range of thickness variation in the nine different regions was measured to be 123.5–132.5 nm for the L8-i-EB-based blend film, 135.0–145.7 nm for the L8-i-EH-based blend film, and 127.0–156.5 nm for the L8-i-BO-based blend film, as depicted in Fig. 4a–c. The regular thickness distribution of the L8-i-EB-based blend film indicated that evaporation-driven flows resulting in the mass transfer were more balanced than the L8-i-BO-based blend film with an uneven film thickness distribution. Therefore, the fluctuation of the PCE of the L8-i-EB-based device is expected to be less than that of the L8-i-BO-based device, attributable to the more uniform thickness of the film.
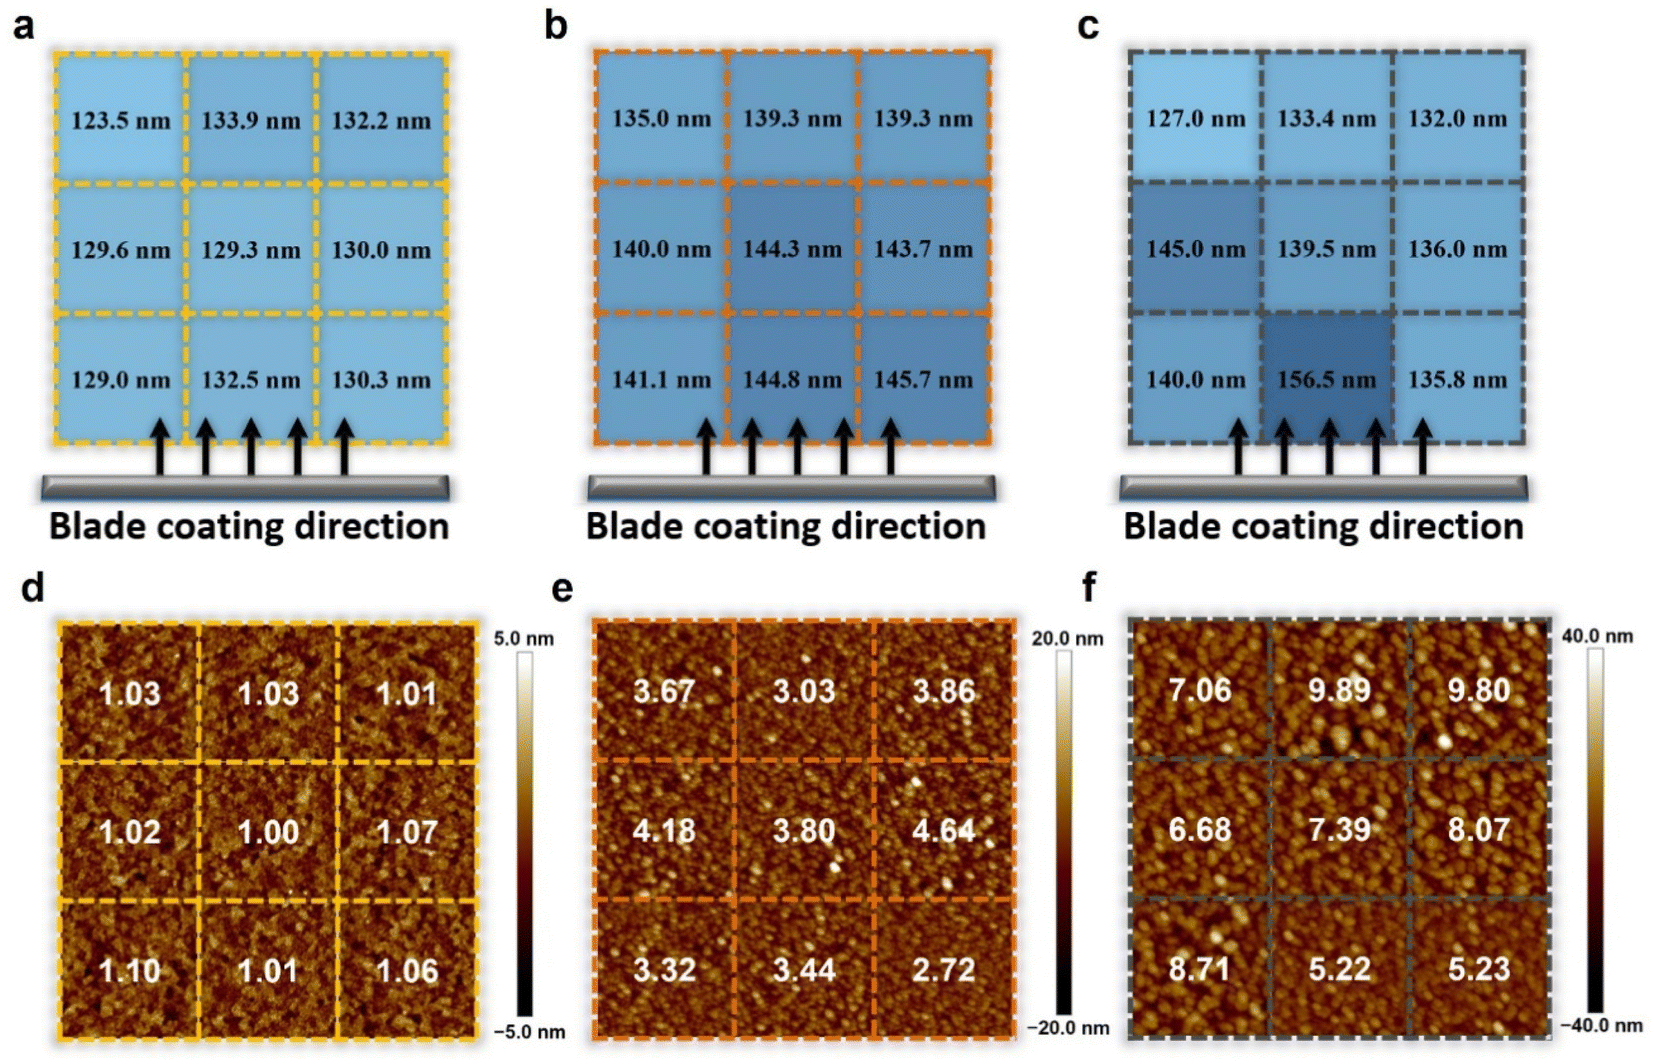 | ||
| Fig. 4 Thickness and 2D height images of active layers from AFM for (a and d) PM6:L8-i-EB, (b and e) PM6:L8-i-EH, and (c and f) PM6:L8-i-BO with the RMS values of surface roughness on 5 cm × 5 cm substrates. | ||
For AFM, the samples were also prepared with the deposition of the blend active layers on glass/ITO/PEDOT:PSS substrates. Fig. 4d–f show the two-dimensional height images of AFM with the root mean square (RMS) values of surface roughness of the L8-i-EB-, L8-i-EH-, and L8-i-BO-based blend films. Overall, the RMS values of surface roughness of the L8-i-EB-based blend film (from 1.00 to 1.10 nm) are significantly smaller than those of the L8-i-EH-based blend film (from 2.72 to 4.64 nm) and L8-i-BO-based blend film (from 5.22 to 9.89 nm). The smooth surface of the L8-i-EB sample is favorable to large-area fabrication due to the less probability of contact resistance.71,72 As shown in Fig. S7,† the surface roughness values of all blend films fabricated by the spin coating process are significantly smaller than those of films fabricated by the blade coating process, implying that excessive agglomeration may have occurred during the blade coating process. Moreover, the surface roughness variation in various regions was the least in the L8-i-EB-based film, indicating that the Marangoni flow can also affect the nanometer-scale uniformity of films.
To further evaluate photovoltaic performance depending on the different NFA-based blade-coated films with varying degrees of Marangoni flow, we fabricated nine OSC devices with active areas of 0.032 cm2 in a large blade-coated film. The illustration of the device fabrication and structure with a large area of 2.5 cm × 2.5 cm size is displayed in Fig. 5a and b. The same blade coating process condition was used as the device configuration optimized in the “Material characterization and blade coating film optimization” section. The distributions of photovoltaic parameters from the nine devices on the same substrate are shown in Fig. 5c–f, and the photovoltaic parameters are summarized in Tables S7–S9.† The distribution of VOC in L8-i-EB-, L8-i-EH-, and L8-i-BO-based devices was almost the same. However, the distribution of JSC and FF in the L8-i-BO-based devices is the most divergent, resulting in a wide range of PCEs (13.92–16.66%). The width of the range for JSC in the L8-i-EB- and L8-i-EH-based devices is comparable. In addition, compared to the L8-i-EB-based devices (15.61–16.86%), a more scattered distribution of FF in the L8-i-EH-based devices ultimately causes a larger PCE fluctuation (15.31–17.20%). Fig. 5g shows the standard deviation of the thickness and surface roughness of active layers and PCE for PM6:L8-i-EB, PM6:L8-i-EH, and PM6:L8-i-BO. The least standard deviation values for each characterization were observed in the L8-i-EB-based device, which is consistent with the enhanced Marangoni flow effect in the inward direction in the L8-i-EB-based solution, as observed above.
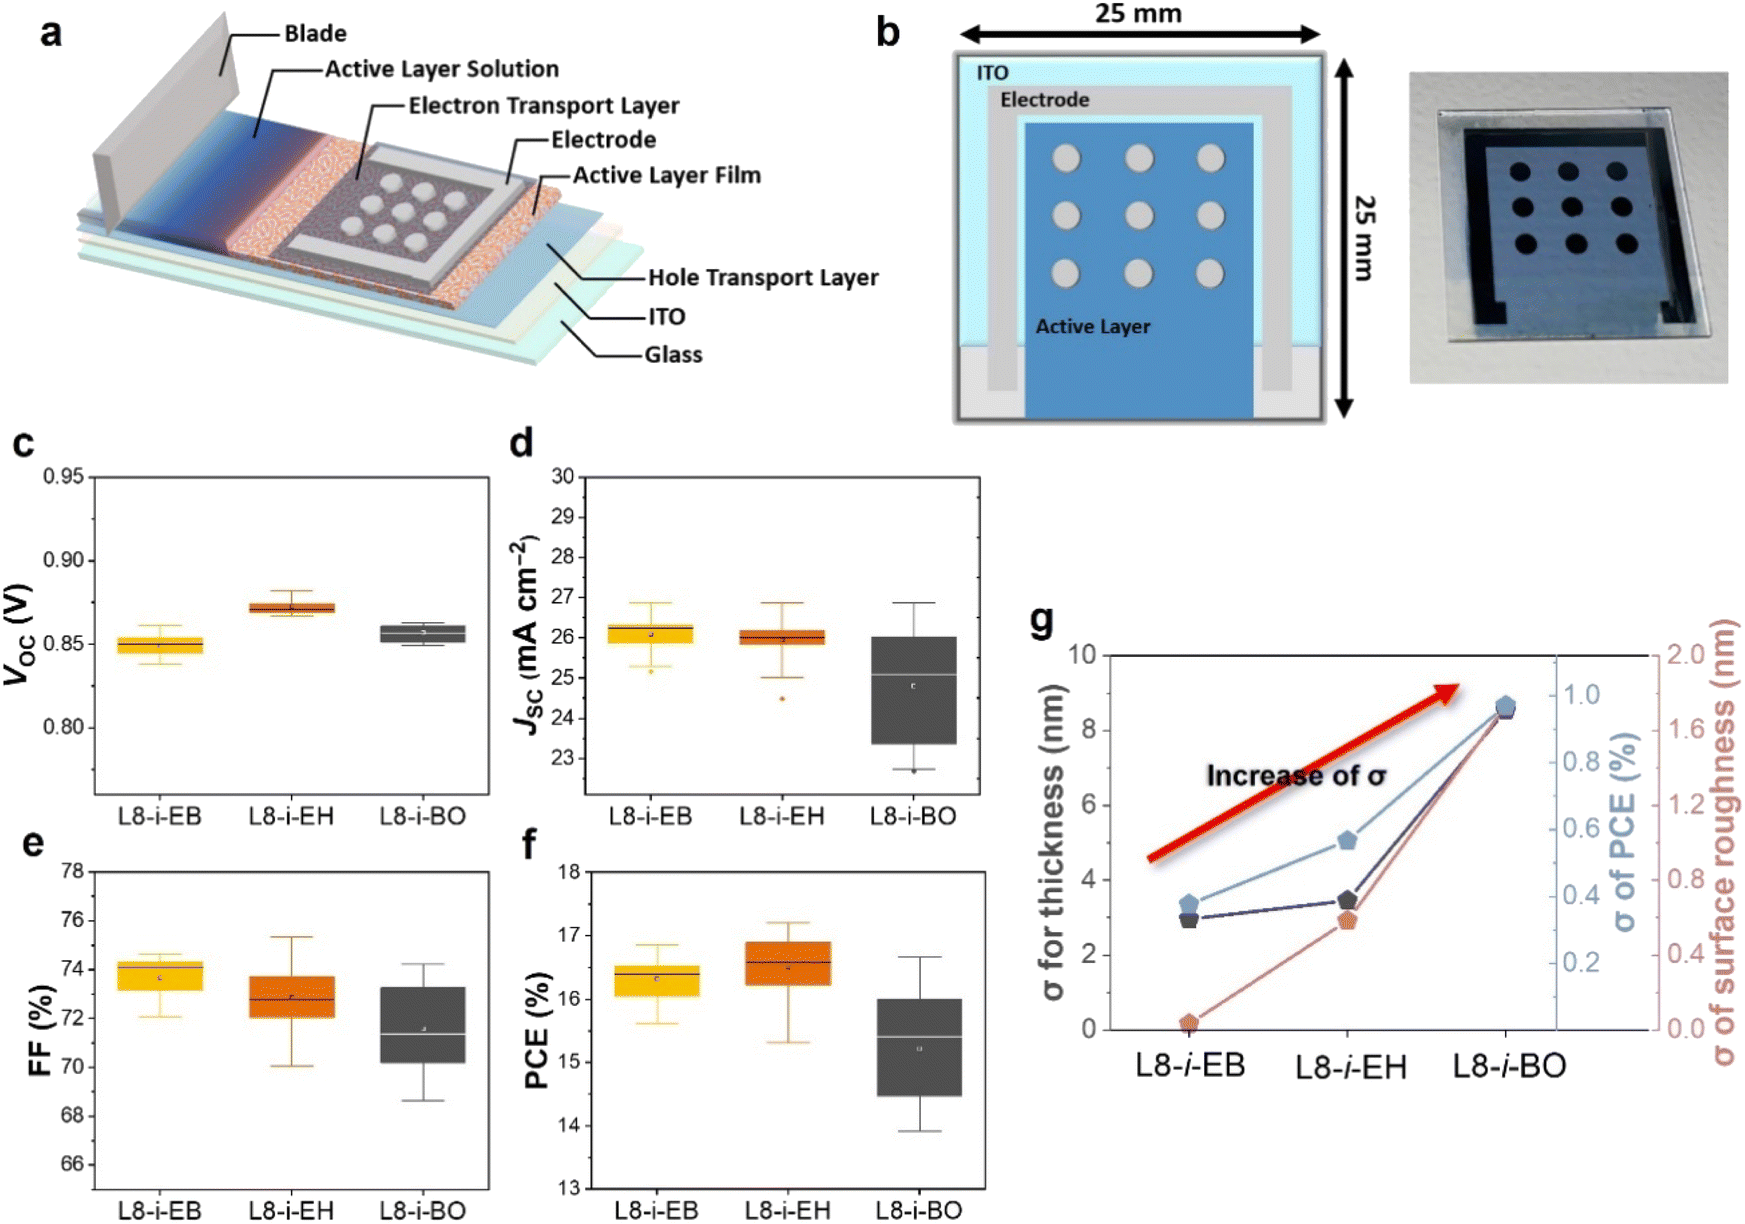 | ||
| Fig. 5 (a) The schematic illustration of device fabrication via the blade-coating process with device configuration. (b) The illustration and picture of the 2.5 cm × 2.5 cm device. Distribution of (c) VOC, (d) JSC, (e) FF, and (f) PCE for L8-i-EB, L8-i-EH, and L8-i-BO based 9 devices on 2.5 cm × 2.5 cm substrate. (g) The values of standard deviation for thickness, surface roughness of active layers, and PCEs based on PM6:L8-i-EB, PM6:L8-i-EH, and PM6:L8-i-BO. | ||
Conclusion
In summary, three NFAs (L8-i-EB, L8-i-EH, and L8-i-BO) with different inner side chain lengths were used in blade coating PM6-based OSC fabrication to investigate the effects of the blade speed and different degrees of evaporation-driven convective flows on film uniformity. First, we delicately controlled the blade speed to achieve optimized blade coating conditions between the evaporative and Landau–Levich regimes for uniform film fabrication. The optimal device performance was achieved at a blade speed range, where film uniformity was sufficient. After that, we evaluated how the molecular structure affects the Marangoni flow and consequent film uniformity by measuring the surface tension dependence on the solution concentration. As a result, the L8-i-EB-based solution exhibited the highest dependence among the solutions, indicating sufficient inward-directional Marangoni flow to compensate for excessive mass transport caused by capillary flow during the blade coating process. To confirm that film uniformity is influenced by the degree of Marangoni flow in three different NFA-based solutions, variations in the thickness and surface roughness of active layers and device performance in nine different regions of a blade-coated substrate were measured. The L8-i-EB-based blend films exhibited the most uniformly deposited films in terms of thickness and surface roughness of active layers. In addition, the variation in the performance of the L8-i-EB-based device was the least with a PCE range of 15.61–16.86%, indicating higher reproducibility, due to excellent film homogeneity. This study reinforces the advantage of side chain engineering in NFAs for tuning the effect of Marangoni flow, enabling us to improve the film uniformity and reproducibility of blade coating-processed OSCs.Author contributions
G. P. and Y. C. conceived the idea and analyzed the data. S. J. and J. P. conducted the measurements and prepared relevant figures. G. P., S.-J. Y., and C. Y. wrote the manuscript. C. Y. conceived and supervised the project and provided intellectual and technical guidance. All authors reviewed the manuscript.Conflicts of interest
There are no conflicts to declare.Acknowledgements
G. Park and Y. Cho contributed equally to this work. The authors would like to thank Prof. Dong Suk Kim and Prof. Sung-Yeon Jang for helpful discussions. This work was supported by the National Research Foundation of Korea (NRF) grant funded by the Korea government (MSIP) (2021R1A2C3004202), Wearable platform Materials Technology Center (2022R1A5A6000846) funded by the Korean Government (MSIT), the Technology Development Program to Solve Climate Changes of the National Research Foundation (NRF) funded by the Ministry of Science, ICT & Future Planning (2020M1A2A2080746), and Korea Institute of Energy Technology Evaluation and Planning (KETEP) grant funded by Korea government (MOTIE) (20213091010010, Super Solar cells-Development of double junction solar cells, breakthrough for the theoretical limit of silicon solar cell efficiency (>35%)).References
- Y. Cai, Q. Li, G. Lu, H. S. Ryu, Y. Li, H. Jin, Z. Chen, Z. Tang, G. Lu, X. Hao, H. Y. Woo, C. Zhang and Y. Sun, Nat. Commun., 2022, 13, 2369 CrossRef CAS PubMed.
- Y. Chang, X. Zhu, K. Lu and Z. Wei, J. Mater. Chem. A, 2021, 9, 3125–3150 RSC.
- Y. Diao, L. Shaw, Z. Bao and S. C. B. Mannsfeld, Energy Environ. Sci., 2014, 7, 2145–2159 RSC.
- J. Gao, W. Gao, X. Ma, Z. Hu, C. Xu, X. Wang, Q. An, C. Yang, X. Zhang and F. Zhang, Energy Environ. Sci., 2020, 13, 958–967 RSC.
- Y. Huang, E. J. Kramer, A. J. Heeger and G. C. Bazan, Chem. Rev., 2014, 114, 7006–7043 CrossRef CAS PubMed.
- F. Pan, M. Luo, X. Liu, H. Jiang, Z. Wang, D. Yuan, Q. Wang, L. Qing, Z. Zhang, L. Zhang, Y. Zou and J. Chen, J. Mater. Chem. A, 2021, 9, 7129–7136 RSC.
- J. Rivnay, S. C. B. Mannsfeld, C. E. Miller, A. Salleo and M. F. Toney, Chem. Rev., 2012, 112, 5488–5519 CrossRef CAS PubMed.
- M. B. Upama, M. A. Mahmud, G. Conibeer and A. Uddin, Sol. RRL, 2020, 4, 1900342 CrossRef CAS.
- H. Zhao, B. Lin, J. Xue, H. B. Naveed, C. Zhao, X. Zhou, K. Zhou, H. Wu, Y. Cai, D. Yun, Z. Tang and W. Ma, Adv. Mater., 2022, 34, 2105114 CrossRef CAS PubMed.
- L. Zhou, S.-Y. Lu and S. Guo, SusMat, 2021, 1, 194–210 CrossRef CAS.
- P. Cong, Z. Wang, Y. Geng, Y. Meng, C. Meng, L. Chen, A. Tang and E. Zhou, Nano Energy, 2023, 105, 108017 CrossRef CAS.
- Q. Guo, Q. Guo, Y. Geng, A. Tang, M. Zhang, M. Du, X. Sun and E. Zhou, Mater. Chem. Front., 2021, 5, 3257–3280 RSC.
- Q. Nie, A. Tang, Q. Guo and E. Zhou, Nano Energy, 2021, 87, 106174 CrossRef CAS.
- N.-G. Park and K. Zhu, Nat. Rev. Mater., 2020, 5, 333–350 CrossRef CAS.
- R. R. Søndergaard, M. Hösel and F. C. Krebs, J. Polym. Sci., Part B: Polym. Phys., 2013, 51, 16–34 CrossRef.
- R. Swartwout, M. T. Hoerantner and V. Bulović, Energy Environ. Mater., 2019, 2, 119–145 CrossRef CAS.
- G. Wang, M. A. Adil, J. Zhang and Z. Wei, Adv. Mater., 2019, 31, 1805089 CrossRef CAS PubMed.
- J. Alstrup, M. Jørgensen, A. J. Medford and F. C. Krebs, ACS Appl. Mater. Interfaces, 2010, 2, 2819–2827 CrossRef CAS PubMed.
- I. Burgués-Ceballos, M. Stella, P. Lacharmoise and E. Martínez-Ferrero, J. Mater. Chem. A, 2014, 2, 17711–17722 RSC.
- M. S. Chung, S. C. Hong, A. Mayer, P. H. Cutler, B. L. Weiss and N. M. Miskovsky, Appl. Phys. Lett., 2008, 92, 083505 CrossRef.
- T. T. Larsen-Olsen, B. Andreasen, T. R. Andersen, A. P. L. Böttiger, E. Bundgaard, K. Norrman, J. W. Andreasen, M. Jørgensen and F. C. Krebs, Sol. Energy Mater. Sol. Cells, 2012, 97, 22–27 CrossRef CAS.
- R. Po, A. Bernardi, A. Calabrese, C. Carbonera, G. Corso and A. Pellegrino, Energy Environ. Sci., 2014, 7, 925–943 RSC.
- A. Singh, S. K. Gupta and A. Garg, Org. Electron., 2016, 35, 118–127 CrossRef CAS.
- S. Zhang, S. Cao, T. Zhang, Q. Yao, A. Fisher and J. Y. Lee, Mater. Horizons, 2018, 5, 291–297 RSC.
- S. Zhang, L. Ye, H. Zhang and J. Hou, Mater. Today, 2016, 19, 533–543 CrossRef CAS.
- Q. Kang, B. Yang, Y. Xu, B. Xu and J. Hou, Adv. Mater., 2018, 30, 1801718 CrossRef PubMed.
- Y. Li, H. Liu, J. Wu, H. Tang, H. Wang, Q. Yang, Y. Fu and Z. Xie, ACS Appl. Mater. Interfaces, 2021, 13, 10239–10248 CrossRef CAS PubMed.
- R. Sun, J. Guo, Q. Wu, Z. Zhang, W. Yang, J. Guo, M. Shi, Y. Zhang, S. Kahmann, L. Ye, X. Jiao, M. A. Loi, Q. Shen, H. Ade, W. Tang, C. J. Brabec and J. Min, Energy Environ. Sci., 2019, 12, 3118–3132 RSC.
- R. Sun, Q. Wu, J. Guo, T. Wang, Y. Wu, B. Qiu, Z. Luo, W. Yang, Z. Hu, J. Guo, M. Shi, C. Yang, F. Huang, Y. Li and J. Min, Joule, 2020, 4, 407–419 CrossRef CAS.
- Z. Yang, C.-C. Chueh, F. Zuo, J. H. Kim, P.-W. Liang and A. K.-Y. Jen, Adv. Energy Mater., 2015, 5, 1500328 CrossRef.
- A. Gençer, C. Schütz and W. Thielemans, Langmuir, 2017, 33, 228–234 CrossRef PubMed.
- G. Qu, J. J. Kwok and Y. Diao, Accounts Chem. Res., 2016, 49, 2756–2764 CrossRef CAS PubMed.
- W. Sempels, R. De Dier, H. Mizuno, J. Hofkens and J. Vermant, Nat. Commun., 2013, 4, 1757 CrossRef PubMed.
- C. Seo, D. Jang, J. Chae and S. Shin, Sci. Rep., 2017, 7, 500 CrossRef PubMed.
- D. Zang, S. Tarafdar, Y. Y. Tarasevich, M. Dutta Choudhury and T. Dutta, Phys. Rep.-Rev. Sec. Phys. Lett., 2019, 804, 1–56 CAS.
- W. Zhang, T. Yu, L. Liao and Z. Cao, AIP Adv., 2013, 3, 102109 CrossRef.
- A. W. Adamson and A. P. Gast, Physical Chemistry of Surfaces, Interscience publishers, New York, 1967 Search PubMed.
- A. Bhattacharya and P. Ray, J. Appl. Polym. Sci., 2004, 93, 122–130 CrossRef CAS.
- M. Enekvist, X. Liang, X. Zhang, K. Dam-Johansen and G. M. Kontogeorgis, Chin. J. Chem. Eng., 2021, 31, 186–197 CrossRef CAS.
- C. M. Hansen, Hansen Solubility Parameters: a User's Handbook, CRC press, 2007 Search PubMed.
- H. Chen, X. Xia, J. Yuan, Q. Wei, W. Liu, Z. Li, C. Zhu, X. Wang, H. Guan, X. Lu, Y. Li and Y. Zou, ACS Appl. Mater. Interfaces, 2021, 13, 36053–36061 CrossRef CAS PubMed.
- S. Dong, T. Jia, K. Zhang, J. Jing and F. Huang, Joule, 2020, 4, 2004–2016 CrossRef CAS.
- K. Jiang, Q. Wei, J. Y. L. Lai, Z. Peng, H. K. Kim, J. Yuan, L. Ye, H. Ade, Y. Zou and H. Yan, Joule, 2019, 3, 3020–3033 CrossRef CAS.
- Z. Abbas, S. U. Ryu, M. Haris, C. E. Song, H. K. Lee, S. K. Lee, W. S. Shin, T. Park and J.-C. Lee, Nano Energy, 2022, 101, 107574 CrossRef CAS.
- E. K. Burnett, Q. Ai, B. P. Cherniawski, S. R. Parkin, C. Risko and A. L. Briseno, Chem. Mater., 2019, 31, 6900–6907 CrossRef CAS.
- Y. Cui, H. Yao, J. Zhang, K. Xian, T. Zhang, L. Hong, Y. Wang, Y. Xu, K. Ma, C. An, C. He, Z. Wei, F. Gao and J. Hou, Adv. Mater., 2020, 32, 1908205 CrossRef CAS PubMed.
- C. Li, J. Zhou, J. Song, J. Xu, H. Zhang, X. Zhang, J. Guo, L. Zhu, D. Wei, G. Han, J. Min, Y. Zhang, Z. Xie, Y. Yi, H. Yan, F. Gao, F. Liu and Y. Sun, Nat. Energy, 2021, 6, 605–613 CrossRef CAS.
- D. Li, X. Zhang, D. Liu and T. Wang, J. Mater. Chem. A, 2020, 8, 15607–15619 RSC.
- S. Li, C.-Z. Li, M. Shi and H. Chen, ACS Energy Lett., 2020, 5, 1554–1567 CrossRef CAS.
- Y. Ma, M. Zhang, S. Wan, P. Yin, P. Wang, D. Cai, F. Liu and Q. Zheng, Joule, 2021, 5, 197–209 CrossRef CAS.
- L. Wang, C. Guo, X. Zhang, S. Cheng, D. Li, J. Cai, C. Chen, Y. Fu, J. Zhou, H. Qin, D. Liu and T. Wang, Chem. Mater., 2021, 33, 8854–8862 CrossRef CAS.
- L. Yang, S. Zhang, C. He, J. Zhang, Y. Yang, J. Zhu, Y. Cui, W. Zhao, H. Zhang, Y. Zhang, Z. Wei and J. Hou, Chem. Mater., 2018, 30, 2129–2134 CrossRef CAS.
- B. Fan, W. Gao, Y. Wang, W. Zhong, F. Lin, W. J. Li, F. Huang, K.-M. Yu and A. K. Y. Jen, ACS Energy Lett., 2021, 6, 3522–3529 CrossRef CAS.
- C. Li, J. Zhou, J. Song, J. Xu, H. Zhang, X. Zhang, J. Guo, L. Zhu, D. Wei, G. Han, J. Min, Y. Zhang, Z. Xie, Y. Yi, H. Yan, F. Gao, F. Liu and Y. Sun, Nat. Energy, 2021, 6, 605–613 CrossRef CAS.
- H. Chen, X. Ding, X. Pan, T. Hayat, A. Alsaedi, Y. Ding and S. Dai, ACS Appl. Mater. Interfaces, 2018, 10, 23466–23475 CrossRef CAS PubMed.
- S. H. Park, S. Park, S. Lee, J. Kim, H. Ahn, B. J. Kim, B. Chae and H. J. Son, Nano Energy, 2020, 77, 105147 CrossRef CAS.
- K. Zhao, H. Hu, E. Spada, L. K. Jagadamma, B. Yan, M. Abdelsamie, Y. Yang, L. Yu, R. Munir, R. Li, G. O. N. Ndjawa and A. Amassian, J. Mater. Chem. A, 2016, 4, 16036–16046 RSC.
- M. He, B. Li, X. Cui, B. Jiang, Y. He, Y. Chen, D. O'Neil, P. Szymanski, M. A. Ei-Sayed, J. Huang and Z. Lin, Nat. Commun., 2017, 8, 16045 CrossRef CAS PubMed.
- Y. Yue, B. Zheng, W. Yang, L. Huo, J. Wang and L. Jiang, Adv. Mater., 2022, 34, 2108508 CrossRef CAS PubMed.
- S. R. Cowan, A. Roy and A. J. Heeger, Phys. Rev. B, 2010, 82, 245207 CrossRef.
- L. J. A. Koster, V. D. Mihailetchi, H. Xie and P. W. M. Blom, Appl. Phys. Lett., 2005, 87, 203502 CrossRef.
- P. Schilinsky, C. Waldauf and C. J. Brabec, Appl. Phys. Lett., 2002, 81, 3885–3887 CrossRef CAS.
- A. K. K. Kyaw, D. H. Wang, V. Gupta, W. L. Leong, L. Ke, G. C. Bazan and A. J. Heeger, ACS Nano, 2013, 7, 4569–4577 CrossRef CAS PubMed.
- C. M. Proctor, M. Kuik and T.-Q. Nguyen, Prog. Polym. Sci., 2013, 38, 1941–1960 CrossRef CAS.
- B. Fan, W. Gao, Y. Wang, W. Zhong, F. Lin, W. J. Li, F. Huang, K.-M. Yu and A. K. Y. Jen, ACS Energy Lett., 2021, 6, 3522–3529 CrossRef CAS.
- S. B. Lee, S. Lee, D. G. Kim, S. H. Kim, B. Kang and K. Cho, Adv. Funct. Mater., 2021, 31, 2100196 CrossRef CAS.
- P.-T. Tsai, K.-C. Yu, C.-J. Chang, S.-F. Horng and H.-F. Meng, Org. Electron., 2015, 22, 166–172 CrossRef CAS.
- J. Yuan, D. Liu, H. Zhao, B. Lin, X. Zhou, H. B. Naveed, C. Zhao, K. Zhou, Z. Tang, F. Chen and W. Ma, Adv. Energy Mater., 2021, 11, 2100098 CrossRef CAS.
- Z. Zhang, B. Peng, X. Ji, K. Pei and P. K. L. Chan, Adv. Funct. Mater., 2017, 27, 1703443 CrossRef.
- J. D. Berry, M. J. Neeson, R. R. Dagastine, D. Y. C. Chan and R. F. Tabor, J. Colloid Interface Sci., 2015, 454, 226–237 CrossRef CAS PubMed.
- J. Yuan, Y. Zhang, L. Zhou, G. Zhang, H.-L. Yip, T.-K. Lau, X. Lu, C. Zhu, H. Peng, P. A. Johnson, M. Leclerc, Y. Cao, J. Ulanski, Y. Li and Y. Zou, Joule, 2019, 3, 1140–1151 CrossRef CAS.
- I. J. Park, G. Kang, M. A. Park, J. S. Kim, S. W. Seo, D. H. Kim, K. Zhu, T. Park and J. Y. Kim, ChemSusChem, 2017, 10, 2660–2667 CrossRef CAS PubMed.
Footnotes |
| † Electronic supplementary information (ESI) available. See DOI: https://doi.org/10.1039/d3ta01806g |
| ‡ G. Park and Y. Cho contributed equally to this work. |
| This journal is © The Royal Society of Chemistry 2023 |