
 Open Access Article
 This Open Access Article is licensed under a
 Creative Commons Attribution 3.0 Unported Licence
Hot carrier relaxation dynamics in non-stoichiometric CdSe quantum dots: computational insights†
Shriya
Gumber
 ag,
Omolola
Eniodunmo
bg,
Sergei A.
Ivanov
c,
Svetlana
Kilina
b,
Oleg V.
Prezhdo
ad,
Dibyajyoti
Ghosh
*ef and
Sergei
Tretiak
*cg
ag,
Omolola
Eniodunmo
bg,
Sergei A.
Ivanov
c,
Svetlana
Kilina
b,
Oleg V.
Prezhdo
ad,
Dibyajyoti
Ghosh
*ef and
Sergei
Tretiak
*cg
aDepartment of Chemistry, University of Southern California, Los Angeles, California 90089, USA
bDept. Chemistry and Biochemistry, North Dakota State University, Fargo, North Dakota 58108, USA
cCenter for Integrated Nanotechnologies, Los Alamos National Laboratory, Los Alamos, NM 87545, USA. E-mail: serg@lanl.gov
dDepartment of Physics and Astronomy, University of Southern California, Los Angeles, California 90089, USA
eDepartment of Chemistry, Indian Institute of Technology, Delhi, Hauz Khas, New Delhi-110016, India. E-mail: dibyajyoti@iitd.ac.in
fDepartment of Materials Science and Engineering (DMSE), Indian Institute of Technology, Delhi, Hauz Khas, New Delhi-110016, India
gTheoretical Division, Los Alamos National Laboratory, Los Alamos, NM 87545, USA
First published on 15th March 2023
Abstract
Spatial confinement of charge carriers in nanosize semiconductor quantum dots (QDs) results in highly tunable, size-dependent optoelectronic properties that can be utilized in various commercial applications. Although in such nanostructures, non-stoichiometry is frequently encountered using conventional synthesis techniques, it is not often addressed or considered. Here, we perform ab initio molecular dynamics simulations on non-stoichiometric CdSe clusters to study the phonon-mediated charge carrier relaxation dynamics. We model cation-rich and anion-rich QDs passivated with monocharged neutralizing ligands of different sizes. Our studies confirm the presence of localized trap states at the valence band edge in only anion-rich QDs due to the presence of undercoordinated exposed surface Se atoms. Noteworthily, these localized states disappear when using bulkier ligands. Calculations reveal that the size of the ligands controls the crystal vibrations and electron–phonon coupling, while ligand coordination number affects the electronic structure. For a particular non-stoichiometric CdSe QD, a change of a ligand can either increase or decrease the total electron relaxation time compared to that of stoichiometric QDs. Our results emphasize the importance of ligand engineering in non-stoichiometric QDs for photoinduced dynamics and guide future work for the implementation of improved materials for optoelectronic devices.
Introduction
Quantum dots (QDs) are semiconductor nanostructures with all three linear dimensions smaller than or comparable to the exciton Bohr radius. Spatial confinement of charge carriers in these clusters gives rise to size-tunable optical and electronic properties, making them promising materials for a broad range of applications ranging from optoelectronic devices such as light-emitting diodes (LEDs), photovoltaics, and photocatalysis, to biological imaging probes, and quantum computing.1–5 Due to the large surface-to-volume ratio, QD properties are highly sensitive to surface morphology and composition. Their photophysical properties can be precisely tuned by modification of the surface, size, ligand passivation, and overall chemical environment.6–11 The major challenge lies in fabricating identical nanostructures with well-defined shapes and sizes at a large scale. The reproducibility of properties of each unit with the same physical and chemical properties from batch to batch is determined by the complete control of reaction conditions and several parameters, which is hard to maintain in traditional synthesis routes.12 The chemical composition and geometry of synthesized QDs often differ from the ideal stoichiometric structures. Hence, it is of utmost importance to study how the non-stoichiometry in QDs affects their photophysics and photo-excited dynamics. The phonon-mediated exciton relaxation is essential for both the fundamental understanding and the applications standpoint of QDs since it competes with processes of charge transfer, carrier multiplication, and radiative recombination – key processes that govern the efficiency of both solar-to-electrical and solar-to-chemical energy conversion.13,14The non-stoichiometry in CdSe arises when the cation-to-anion ratio deviates from unity, and it can be realized in two ways: via an excess of cations or anions on a QD surface. The coordination sphere of surface ions is not completed by the material's counterions, resulting in so-called dangling bonds (unsaturated valences) and localized surface states.15–19 Often, the charge-neutralizing ligands coordinate with the surface atoms and partially remedy the undercoordination of the latter. Although these nanostructures are common during chemical synthesis, research on these clusters is limited.20,21 Xia et al. reported that the exposed Cd atoms on surface-ligand-removed Cd-rich QDs act as photocatalysts for the conversion of CO2 to CO.22 Huang et al. manipulated the surface stoichiometry of CdSe QDs by decreasing the amount of surface Se to enhance the photogenerated H2 evolution yield.23 Apart from the photocatalytic studies, recently Bhati et al. reported the electronic transitions in non-stoichiometric QDs, studied via first-principle simulations.24 However, none of these reports focus on the time-resolved photoexcited charge carrier dynamics. Furthermore, the influence of the size of coordinated ligands on carrier relaxation is yet to be understood at the atomistic level. In this study, we emphasize the importance of a ligand choice to modify the electronic structure, and hence the electron and hole relaxation dynamics for the targeted applications.
The absorption of high-energy photons in molecular and bulk semiconductor materials creates electron–hole pairs or excitons. These hot charge carriers cool to the band edges by losing their energy to vibrations on a femtosecond to a picosecond time scale, predominantly by electron–phonon interactions.25–27 In QDs, due to the spatial confinement of charge carriers, the electronic states near the band edges are quantized and transitions acquire atom-like discreteness in contrast to continuous broad-band spectra in bulk semiconductors. The energy gap between consecutive orbitals can be larger than the highest phonon frequency of the lattice, leading to an energy mismatch between electronic and vibrational quanta. In turn, it weakens the electron–phonon coupling and substantially slows down the electron and hole cooling dynamics. This phenomenon in low-dimensional materials is known as “phonon bottleneck”.28–31 In recent decades, alternative relaxation channels such as electron–hole interactions through the Coulomb interaction have been reported that break the phonon bottleneck and lead to faster dynamics, but the ambiguity around it remains unresolved.32–35 If these proposed alternative channels are suppressed, energy relaxation would be as slow as a few nanoseconds.35 The suppressed dynamics of excited electrons is favorable for photocatalysis and other relevant applications in QDs.36 Moreover, slow cooling can result in a higher probability of carrier multiplication (CM): that is, the generation of multiple excitons per photon.37–39 In this regard, chemical non-stoichiometry can also substantially alter the relaxation dynamics rates of QDs.
Here, we investigate the hot carrier cooling in non-stoichiometric CdSe QDs that are charge-balanced by different-size ligands. As ligands, we utilize cationic H+, Na+, and K+ to compensate for the excess of the negative charge in QDs with Cd-to-Se ratio below unity, and anionic halogenides (F− and Cl−) for positive charge compensation in QDs with the ratio above unity. We employ a mixed quantum-classical approach that includes time-domain density functional theory (TD-DFT)40 in conjunction with non-adiabatic molecular dynamics (NAMD)41 to address how the non-stoichiometry in a quantum dot affects the intra-band electron–phonon relaxation of photogenerated excitons. The atomistic simulation results are followed by ab initio molecular dynamics (AIMD) and NAMD calculations to model the photoinduced electron and hole relaxation dynamics. Our results corroborate the literature reports about the presence of localized trap states close to the valence-band edge in only Se-rich clusters.42 Interestingly, we observe that these states disappear when using bulkier ligands for QD passivation, highlighting the importance of ligand choice in non-stoichiometric QDs. Furthermore, we find that the ligands control lattice vibrations that influence the electron–phonon coupling. This coupling directly affects the rates of phonon-mediated exciton dynamics. With the same Cd/Se configuration, enhanced and reduced electron relaxation rates with respect to their stoichiometric counterparts are obtained by using different ligands. Overall, these atomistic simulations offer the first step towards a comprehensive understanding of how photophysical processes can be tuned by the structural modification affecting the electronic character of QDs.
Results and discussion
We model (see Computational methods) stoichiometric Cd33Se33 QD (Fig. 1a) (as a reference) together with five non-stoichiometric CdSe systems – two Cd-rich Cd28Se17X22 (X = F, Cl) (Fig. 1b and c) and three Se-rich Cd17Se28M22 (M = H, Na, K) quantum dots (Fig. 1d–f). The initial Cd33Se33 structure is constructed from the CdSe bulk wurtzite lattice, and it attained the relaxed geometry at the energy minimum upon optimization. Non-stoichiometric QDs, on the other hand, maintain a Td symmetry where the Cd and Se atoms are arranged in a hybrid wurtzite/zinc blende crystal structure – the interior of the cluster has the zinc blend atomic arrangement, and the vertices of the tetrahedron have a wurtzite configuration of Cd and Se. Two types of non-stoichiometric QDs can be obtained from each structure by switching the Cd and Se atoms. The excess charge on its surface is balanced by the monocationic H+, Na+ and K+ in Se-rich QDs – these ligands coordinate to the anionic Se atoms – and by anionic F−, Cl− ligands in Cd-rich QDs – these ligands coordinate with the cationic Cd atoms. The C6H5– moiety present in experimental structures is replaced by H+ for the computational speed up in Cd17Se28H22.43 The bulkier ligands Na+ and K+ replace H+ in Se-rich QDs to understand the effect of the extent of Se passivation on surface trap states. The values of the average charge on the core, surface, and ligand atoms for all nanoclusters are reported in Table S4.†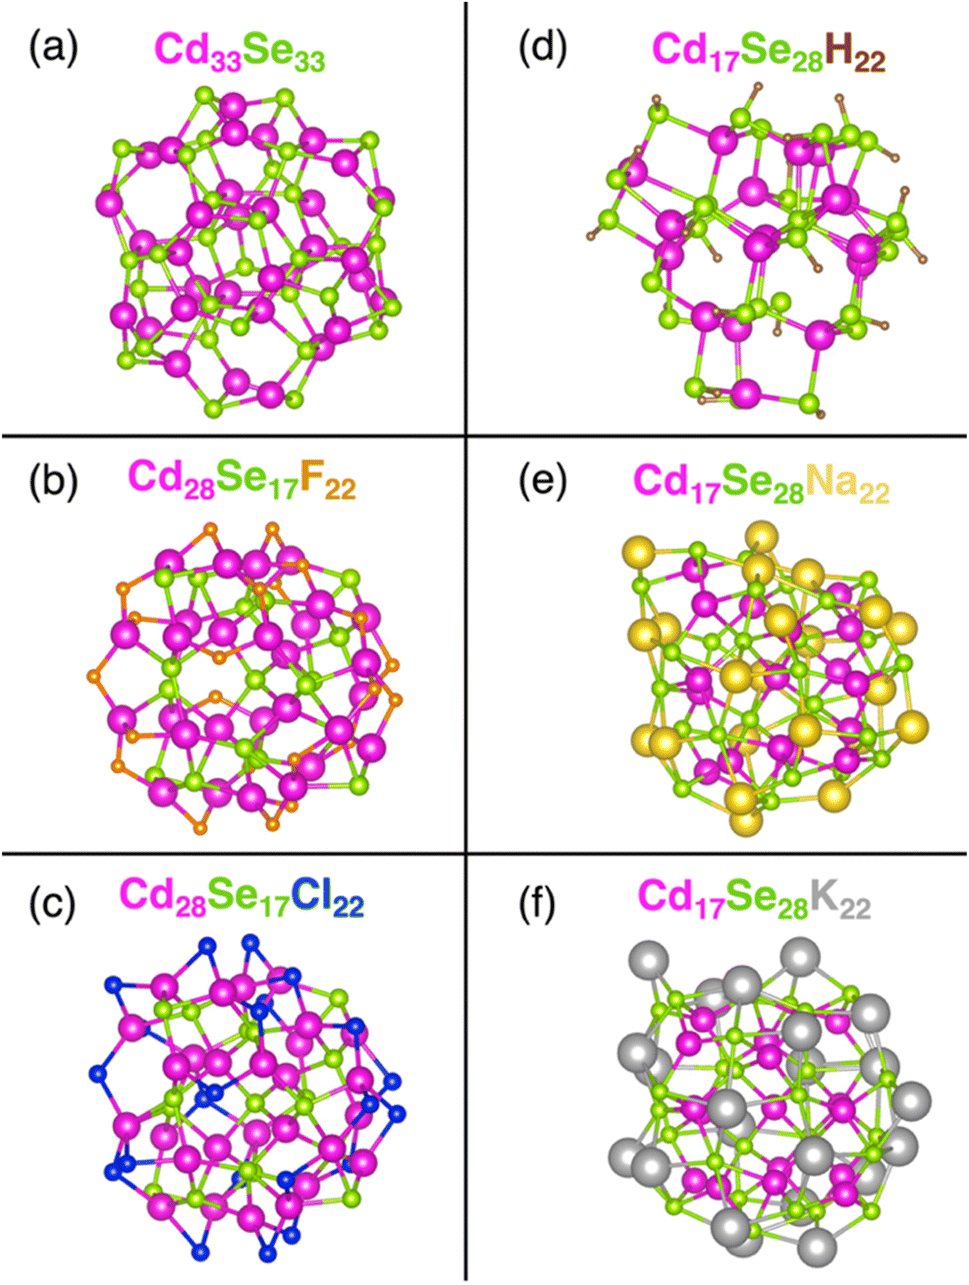 | ||
| Fig. 1 The DFT optimized geometry of stoichiometric (a) Cd33Se33, and non-stoichiometric: Cd-rich (b) Cd28Se17F22, (c) Cd28Se17Cl22 and Se-rich (d) Cd17Se28H22, (e) Cd17Se28Na22, (f) Cd17Se28K22 quantum dots (QDs). Anionic ligands bond to the surface Cd atoms and cationic ligands bind to the surface Se atoms. Each H+ is monodentate i.e., it coordinates only one Se atom per ligand and leads to the formation of a polar covalent H–Se bond. The denticity of other ligands ranges from two in Cd-rich QDs to two to four in Se-rich QDs, due to the more ionic interaction. | ||
Because of the large surface-to-volume ratio, atoms at the core of the QD are in a different chemical environment than those at the surface. In a stoichiometric Cd33Se33 nanocrystal, the core Cd (or Se) is coordinated with four other atoms, while the atoms on the surface are only three-coordinate. Consequently, the Cd–Se bonds on the surface are stronger and shorter compared to the weaker and longer core Cd–Se bonds (Table 1), which agrees with previous calculations.7 In non-stoichiometric QDs, the monocharged ligands adjust to the surface undercoordination to a different extent, depending on their size. In Se-rich QDs, the H atom binds to only one surface Se atom due to the small size of the former, formally giving rise to a commonly encountered hydroselenide anion, HSe−. Furthermore, only 22 ligands in Cd17Se28H22 are available for 24 surface Se atoms, leaving two surface Se atoms not bonded to a ligand. This ligand arrangement further increases the difference between the surface and core Cd–Se bond lengths. Na+ and K+, on the other hand, have larger surface coordination numbers, thus leading to a decreased difference between bond lengths of two types of Cd–Se bonds. In Cd-rich QDs, following a similar trend, the halogenide coordination results in a little (in the case of F−) to none (in the case of Cl−) bond length difference between interior and surface Cd–Se bonds.
| Distance (Å) | Cd33Se33 | Cd rich | Se rich | |||
|---|---|---|---|---|---|---|
| Cd28Se17F22 | Cd28Se17Cl22 | Cd17Se28H22 | Cd17Se28Na22 | Cd17Se28K22 | ||
| Cd–Se surface | 2.66 | 2.67 | 2.68 | 2.68 | 2.70 | 2.71 |
| Cd–Se core | 2.74 | 2.70 | 2.68 | 2.82 | 2.75 | 2.76 |
| Se–ligand | — | — | — | 1.49 | 2.93 | 3.21 |
| Cd–ligand | — | 2.21 | 2.60 | — | — | — |
Fig. 2 shows the projected density of states (PDOS) derived by the projection of the total density of states into atomic orbitals for optimized geometries at 0 K of all systems under investigation. Insets show the charge density plots of the Kohn–Sham (KS) orbitals corresponding to the highest occupied molecular orbital (HOMO) and lowest unoccupied molecular orbital (LUMO) energies. The LUMO orbital is isolated in energy from the rest of the band, while its charge density is distributed nearly uniformly over the QD for all structures. According to the effective mass approximation, this peak is attributed to the S-electron state emerging from the s-type atomic orbitals of Se.44 The valence band (VB) state structure is quasi-continuous and is mostly localized on the Se atomic orbitals. In Se-rich QDs, the orbital overlap between consecutive orbitals further increases as the energy gap between those narrows. Because of the deficiency of Se in Cd-rich QDs, the interorbital energy gaps in VB widen thereby increasing the discreteness of the VB. The conduction band (CB) is discrete near the band-edge at low energy as expected for the spatially confined nanostructures. The extent of discreteness is subject to the size and ligand coordination. A smaller ligand H+ in Se-rich QDs leads to a larger energy difference between the S-electron state and the next higher energy state. These trends in sub-band gaps persist during dynamic processes (Fig. S4 and S5†) and play a significant role in electron and hole relaxation rates as discussed later. The Na+ or K+ cation draws to itself highly polarizable electron density of surface Se anions; in contrast, F− or Cl− anion cannot provide much electron density to many neighboring cationic Cd on the QD surface. Consequently, the surface charges have higher absolute value in Se-rich QDs than in Cd-rich QDs (Table S4†). Furthermore, there is an emergence of sub-band gaps in CB of Na- and K-ligated systems, which are more prominent in the K-ligated system. Simulations neglecting the dielectric environment effect tend to generate these in-gap states.
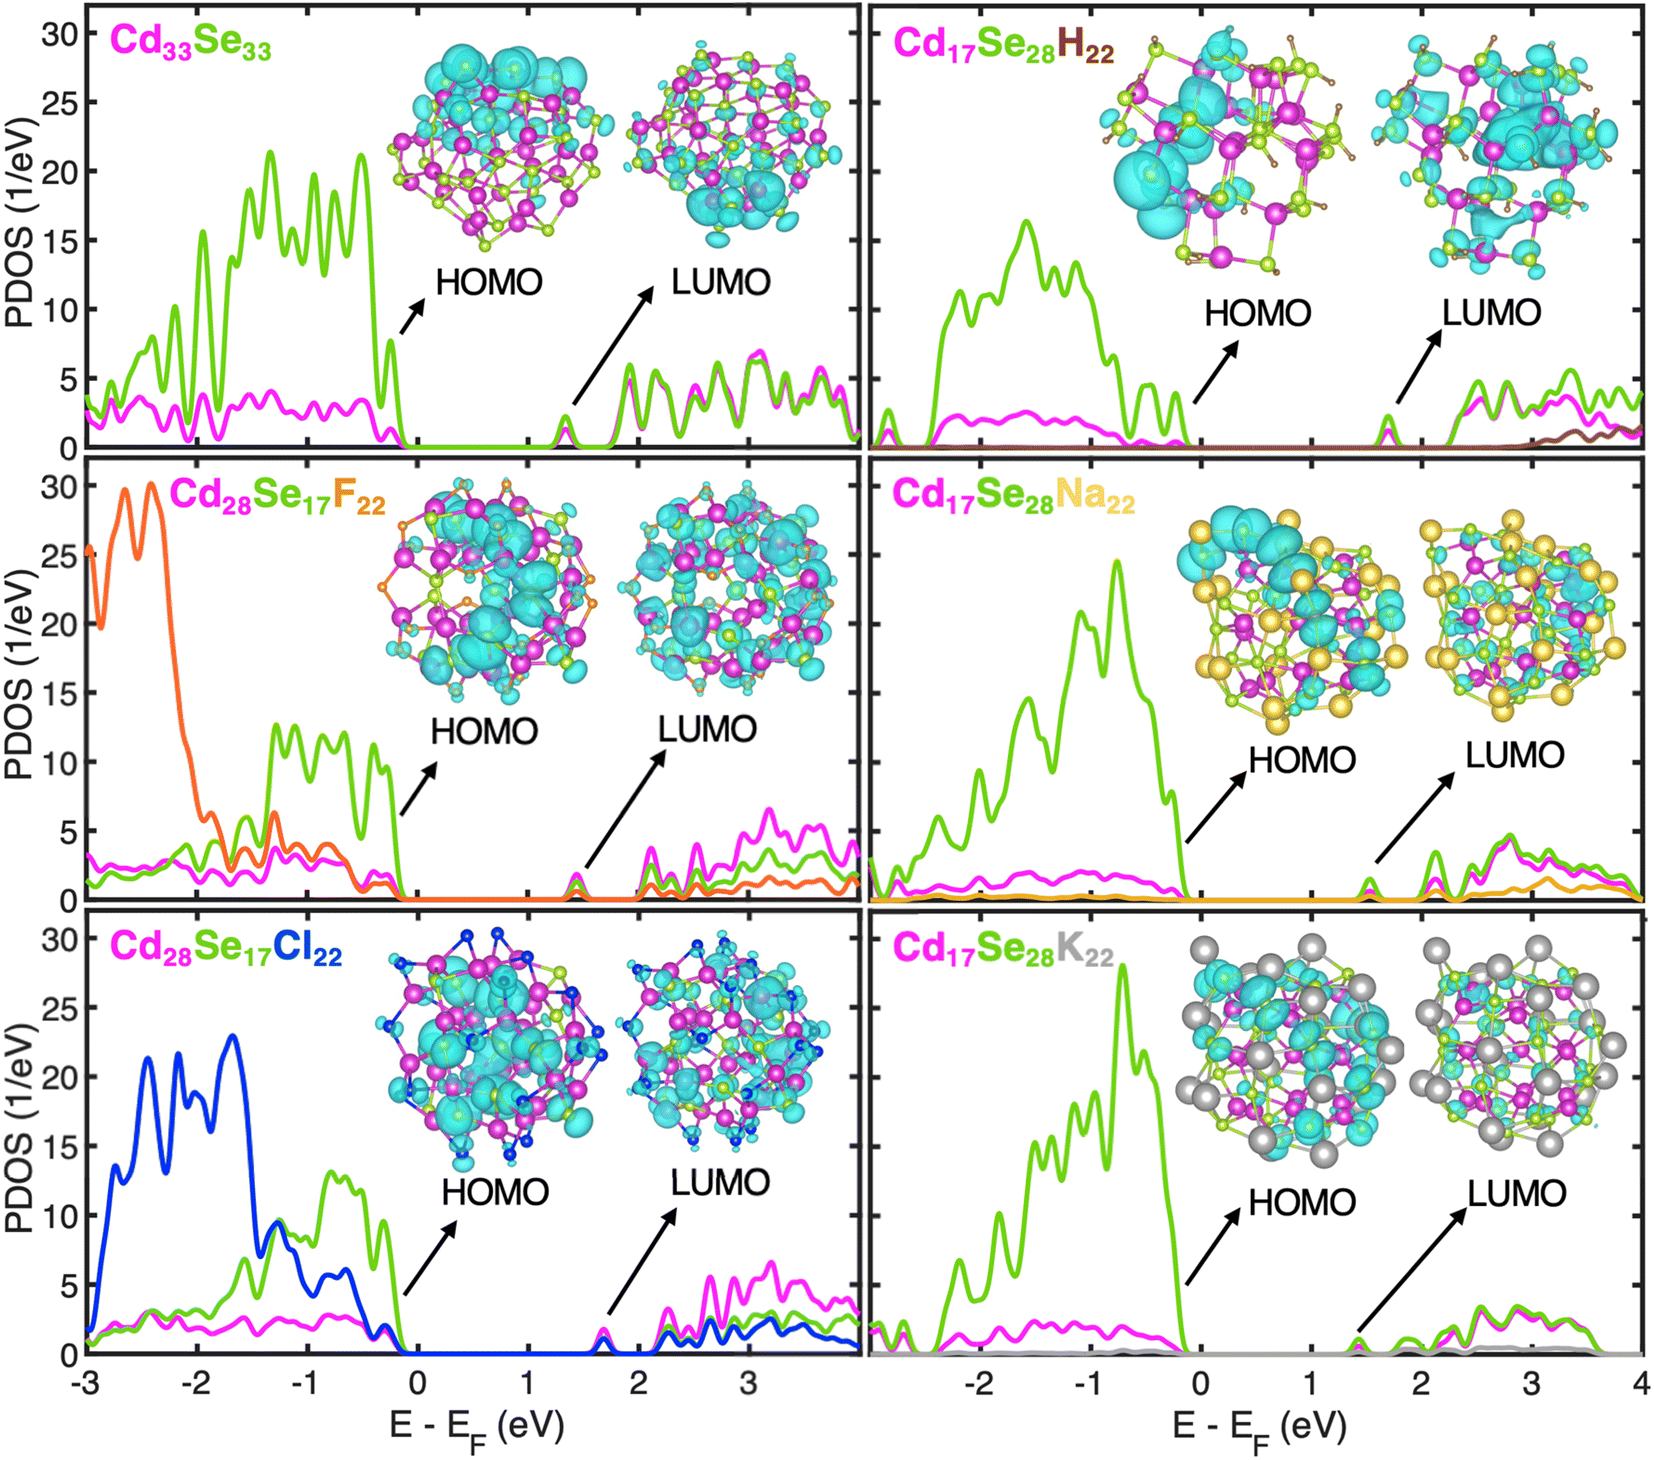 | ||
| Fig. 2 Projected density of states (PDOS) of stoichiometric, Cd33Se33 and non-stoichiometric-Cd-rich Cd28Se17X22, (X = F, Cl) and Se-rich Cd17Se28M22, (M = H, Na, K) clusters separated into contributions from atomic orbitals for optimized geometries at 0 K. The Fermi energy (EF) level is set to 0 eV. Atom types in the structure, the corresponding PDOS plot, and atomic symbols are represented by the same colour in the upper left corner of each panel. The charge density plots of HOMO and LUMO calculated at an isosurface level of 0.0005e ao−3 (where ao is the Bohr radius) are in turquoise colors in the insets for each system. The LUMO is separated from the rest of the conduction band by an energy gap greater than 0.4 eV. | ||
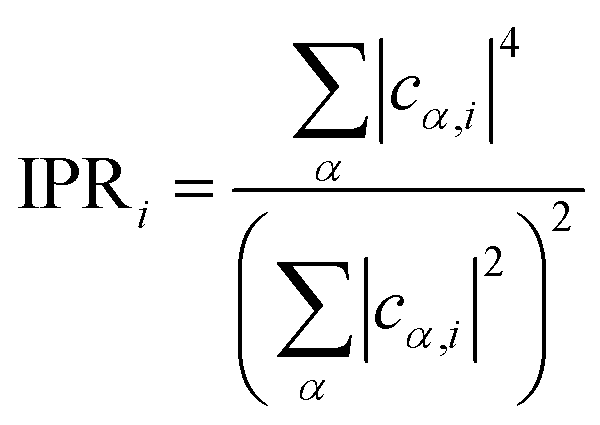
The first three orbitals at the VB edge of H- and Na-ligated clusters appear highly localized. As seen in the charge density plots for the first two orbitals given in Fig. S6,† they are mostly localized on the undercoordinated surface Se atoms. However, when a bulkier K+ is used in the same configuration of Cd/Se atoms, this localization disappears. Because of its larger size, it is easier for K+ to extend bonding to the undercoordinated Se compared to H+ and Na+. Consequently, HOMO and HOMO−1 of Cd17Se28K22 are much more delocalized, which is consistent with the conclusion by Leung et al. stating that the absence of dangling bonds on a QD surface reduces the presence of the localized in-gap states.45 For better quantification of localization and the comparison between structures, we used the inverse participation ratio (IPR). This dimensionless quantity varies from 0 to 1 with limiting values corresponding to fully delocalized (0) or localized (1) Kohn–Sham wavefunction on one atom (see Computational methods for definition). The IPR values of the first four orbitals at the valence and conduction band edges for all systems under investigation are given in Table 2. The orbitals highlighted in bold corresponding to the H- and Na-ligated system are highly localized, much higher than those of K-ligated QD. This underpins the influence of ligand size and coordination on the electronic structure of non-stoichiometric QDs. Our findings that the passivation of surface Se plays an important role in the removal of surface trap states are in line with the experimental work by Jasieniak et al. in which Se-rich QD is passivated with trioctylphosphine (TOP) ligand.20 On the contrary, in Cd-rich QDs, most of the Se atoms are within the core and fully coordinated. Therefore, no trap states near the VB edge are observed irrespective of the ligand, with the related IPR values being slightly smaller than stoichiometric QD. Overall, in all QDs, the IPR of orbitals close to the VB edge (HOMO−3 to HOMO) indicates higher localization than that of orbitals near the CB edge (LUMO to LUMO+3). This is because the VB is localized predominantly on only Se atomic orbitals, while CB is delocalized over both Cd and Se atomic orbitals, as also shown in charge density plots (Fig. S6†).
| Cd33Se33 | Cd rich | Se rich | ||||
|---|---|---|---|---|---|---|
| Cd28Se17F22 | Cd28Se17Cl22 | Cd17Se28H22 | Cd17Se28Na22 | Cd17Se28K22 | ||
| HOMO−3 | 0.10 | 0.11 | 0.07 | 0.09 | 0.09 | 0.05 |
| HOMO−2 | 0.11 | 0.07 | 0.06 | 0.16 | 0.17 | 0.06 |
| HOMO−1 | 0.09 | 0.10 | 0.07 | 0.54 | 0.12 | 0.09 |
| HOMO | 0.09 | 0.09 | 0.05 | 0.18 | 0.16 | 0.08 |
| LUMO | 0.03 | 0.02 | 0.02 | 0.03 | 0.02 | 0.02 |
| LUMO+1 | 0.05 | 0.03 | 0.03 | 0.05 | 0.03 | 0.03 |
| LUMO+2 | 0.03 | 0.04 | 0.03 | 0.10 | 0.03 | 0.04 |
| LUMO+3 | 0.03 | 0.03 | 0.02 | 0.04 | 0.04 | 0.03 |
The non-radiative excitation dynamics is guided by the interaction between electronic and vibrational subsystems. This interaction results in elastic and inelastic electron–phonon scattering. Elastic scattering is characterized by the pure-dephasing time, and it has no direct effect on energy dissipation. Inelastic scattering causes energy exchange between electrons and phonons and it is characterized by non-adiabatic coupling (NAC). The frequency of the charge transition between two electronic states is directly proportional to the NAC between them. Fig. 3 shows the average coupling strength between consecutive orbitals that are involved in electron relaxation starting from 1 eV in the CB to the band edge. The coupling strength between LUMO and LUMO+1 is crucial from the dynamics viewpoint as discussed later and hence it is shown as a separate bar plot in blue. The NAC values are shown only between the consecutive orbitals as it is being the dominating factor that drives most of the energy dissipation. When two states differ by two or more orbitals, the coupling between them is weak (Fig. S7†), indicating that the transition across large energy gaps is less likely.
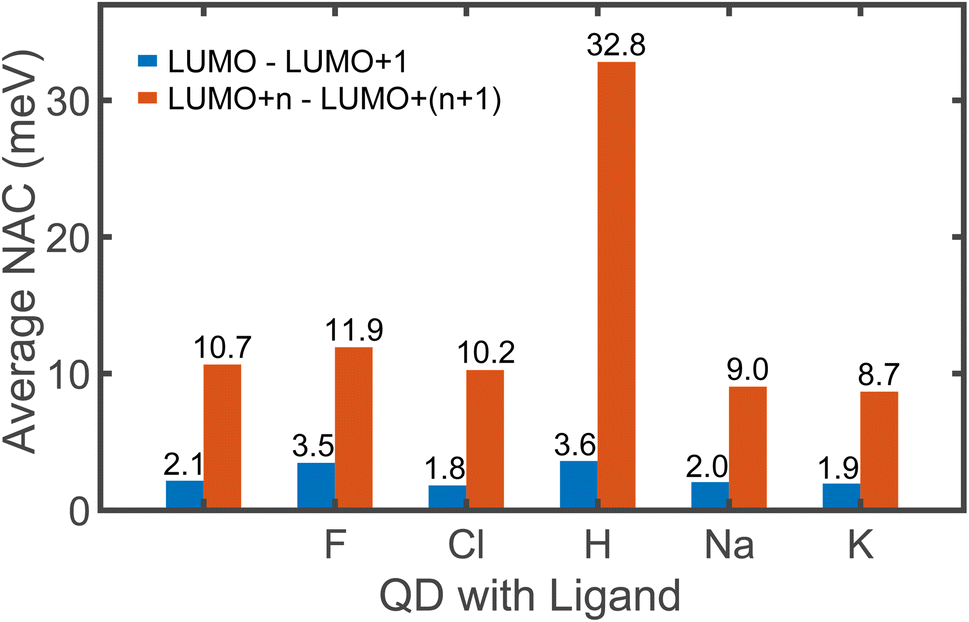 | ||
| Fig. 3 The average non-adiabatic coupling (NAC) between the Kohn–Sham orbitals involved in electron relaxation. The LUMO is always separated from the rest of the conduction band by an energy greater than 0.4 eV. Consequently, the NAC between LUMO and (LUMO+1) is weak and is considered separately, as shown in blue. The average coupling between consecutive orbitals of higher energy, i.e., (LUMO + n) and (LUMO + n + 1) is shown in orange. Here, n is an integer greater than 0. The number of orbitals considered in the range is different for all QDs, as we include just the orbitals within 1 eV of the CB. We do not consider the coupling between non-consecutive orbitals due to its negligible magnitude, as shown in Fig. S7.† | ||
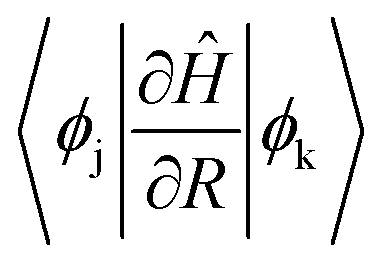
The magnitude of NAC between the first two orbitals of CB is quite low due to the large energy difference, since NAC is inversely proportional to the energy gap, εk − εj, between the two electronic states k and j, as shown in eqn (1) in Computational methods. NAC is also directly proportional to the nuclear velocity Ṙ, and the nuclear velocities are inversely proportional to the atomic mass at a given temperature. H is the lightest of all the ligands, thus dramatically increasing the NAC for H-ligated QDs – at least three times compared to other QDs. For similar reasons, F-ligated QD has a larger magnitude of NAC between consecutive orbitals compared to the Cl-ligated Cd-rich QD system. The H- and F-ligated systems also have the largest NAC between LUMO and (LUMO+1). In contrast, the NAC values for Na- and K-ligated systems do not show a large difference, with NAC value in the Na-ligated system being only slightly larger than that in the K-ligated system, as expected from eqn (1). The largest values of NAC of the H- and F-ligated QDs associated with large nuclear velocities may result in breaking of some bonds in the system during dynamical processes. This might lead to ligand detachment from the QD surface and the overall instability and rearrangement of the system. To check stability of considered systems, we compared the radial distribution function g(r) for Cd–Se bonds and Cd(Se)–ligand bonds in static initial structures with those averaged over 5 picoseconds of AIMD trajectory (Fig. S8†). Insignificant deviations between the static and time-averaged g(r) point to the stability of all nanostructures with no ligands breaking their bonds with the surface during electron relaxation dynamics.
The calculated time evolution of non-radiative phonon-mediated electron relaxation energy for Cd-rich and Se-rich non-stoichiometric quantum dots is shown in Fig. 4a and b, respectively. The corresponding population evolution is shown in Fig. S9.† The initially excited state electron and hole charge densities are dominated by Cd(Se) atomic orbitals, with little contribution from the ligands (Fig. S10†). The orbital for initial excitation is chosen at 1 eV above the LUMO. Observed dynamics of electrons suggests two distinct rates: (i) a major part of relaxation from the initially excited state to the second lowest unoccupied orbital (LUMO+1) takes place within a few picoseconds through the dense manifold of electronic states; (ii) relaxation from (LUMO+1) to the band edge takes hundreds of picoseconds. The fast component is highlighted by enlarging the initial dynamics for 15 ps, as shown in the insets of Fig. 4a and b. The frequencies of phonons strongly coupled to the initial and the final electron/hole states are shown in Fig. S11.† The QDs containing smaller ligands have significant contributions of higher frequency vibrations (>300 cm−1 in Se-rich and >500 cm−1 in Cd-rich). Thus, we can conclude that the ligands control the lattice vibrations.
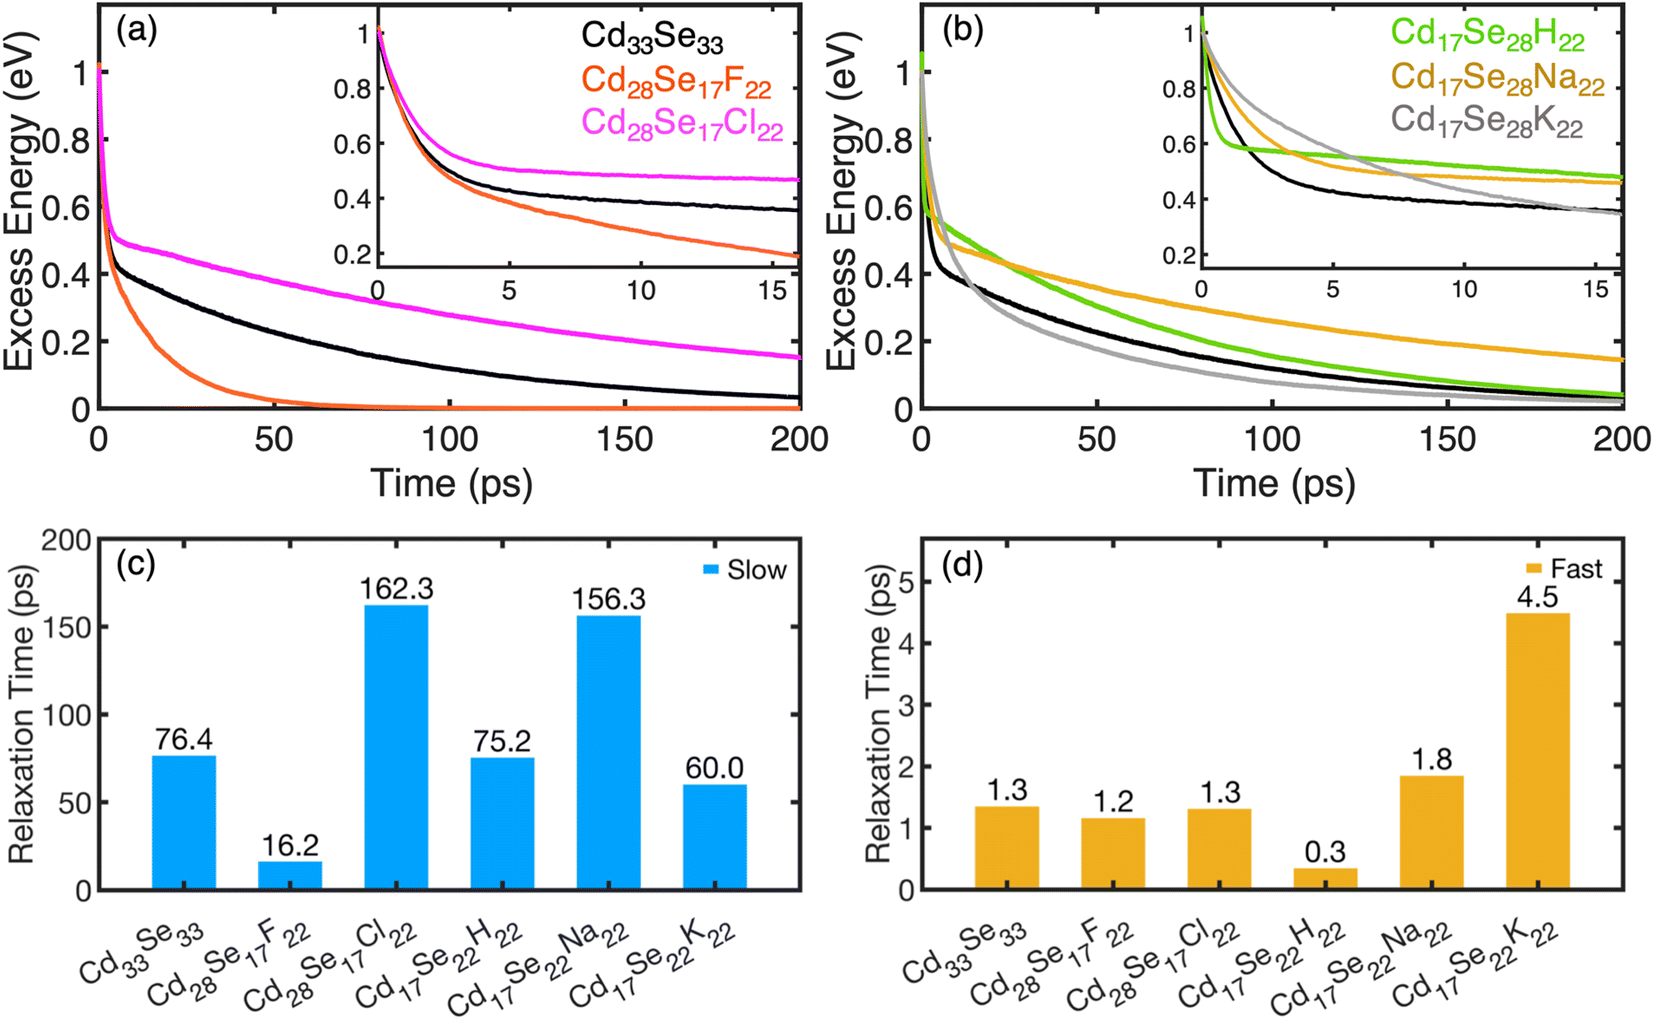 | ||
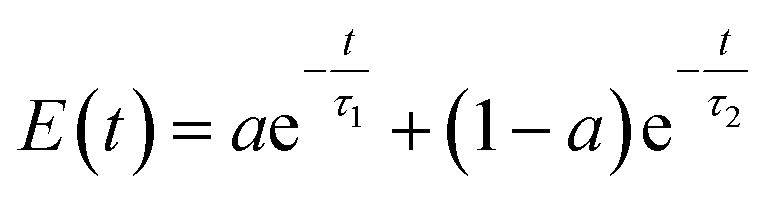
| Fig. 4 The excess energy dissipation over time during electron relaxation in Cd-rich QDs (a) and in Se-rich QDs (b). The electron relaxation in QDs demonstrates two distinct rate components (fast and slow). Insets show the zoomed-in plots for the decay of the fast component. The curves fit a biexponential function given by eqn (2) with the relaxation time components τ1 (slow) and τ2 (fast) for all systems under study compared in (c) and (d), respectively. Table S6 in the ESI† compares the relaxation time components. | ||
The maximum phonon frequency contributing to NAC does not exceed 800 cm−1 for all nanostructures, which corresponds to ∼0.1 eV, compared to the energy gap of at least 0.4 eV between the first and second lowest unoccupied orbitals. This mismatch leads to a “phonon bottleneck”, which takes place when the energy difference between the electronic states is greater than the participating phonon frequencies. This consequently accounts for the slow dynamical component. As such, the dynamics rates are quantified by fitting the energy decay plots to a bi-exponential function.
Relative to electrons, the hole relaxation is about a hundred times faster, as it happens through a dense manifold of states (Fig. S13†). To investigate the decoherence effect, we compared hole relaxation starting at 1 eV and 1.5 eV from the VB edge using the FSSH method, which doesn't account for decoherence effects, and the DISH algorithm, which includes decoherence correction. Despite an order of magnitude faster relaxation time for FSSH data compared to DISH, both methods show similar trends in hole relaxation for QDs with heavy ligands. However, systems with F− and H+ ligands feature more significant deviations between methods due to the presence of small sub-gaps at the VB near its edge (Fig. S5†), resulting in a shorter dephasing time than the quantum transition time. Overall, inclusion of the decoherence effect in NAMD is important even for relatively dense states of heavy holes. However, regardless of the method used, though, non-stoichiometry makes the holes decay faster as a result of stronger NACs originates from surface-ligand states.
Conclusion
In summary, we study the exciton relaxation dynamics of non-stoichiometric quantum dots with cation-rich and anion-rich surfaces. Different charge-neutralizing ligands – F− and Cl− ligands in cation-rich and H+, Na+ and K+ ligands in anion-rich QDs – are used to passivate the surfaces. We find the presence of highly localized trap states at the VB edge of anion-rich QDs as a result of the undercoordination of surface Se atoms. Noteworthy, the trap states disappear upon using bulkier ligand K+. In addition, such trap states are absent from cation-rich counterparts because of the limited exposure of Se atoms on the surface. Depending on the size and coordination of the ligand, we observe the different electronic structures and electron–phonon coupling strengths, which leads to different non-radiative rates of phonon-mediated relaxation of the electron. The slowdown of the relaxation rate would potentially increase the efficiency of hot carrier transport and emphasize the dynamics of charges governed by many-body electronic interactions. This underpins the importance of ligand engineering in non-stoichiometric nanocrystals for different applications. Our study guides future work to Taylor QD-based materials for various applications through a strategic synthesis process.Computational methods
TD-DFT calculations in Kohn Sham (KS) framework46,47 were performed using the Vienna Ab initio Simulation Package (VASP)48–50 which uses a converged plane-wave basis with a cutoff of 550 eV. VESTA software is used as a visualization tool.51 The Perdew–Burke–Ernzerhof (PBE) functional was used to calculate the exchange-correlation effects.52 The PBE functional is well known to underestimate the band gaps due to self-interaction errors.53 Hybrid functionals include exact Hartree–Fock exchange and are known to reproduce the experimental band gaps.54 However, these methods require additional computational efforts, which are expensive for NAMD, and our current calculations involve only the intraband charge relaxation. Additional calculations with the inclusion of spin–orbit coupling were done for all QDs and it is realized that SOC does not affect the electronic structure considerably (see Fig. S3 and Table S3 in ESI†). The interactions between ionic cores and valence electrons are described using the projector augmented wave (PAW)55 method with 4d and 5s (Cd), 4s and 4p (Se), 2s and 2p (F), 3s and 3p (Cl), 1s (H), 3s (Na) and 3s, 3p and 4s (K) electrons treated as valence electrons. The cubic simulation cell containing QD was repeated in three dimensions and to avoid spurious interactions with its replica, a vacuum of at least 10 Å was placed in all directions. The smallest distance between a QD and its replica in x, y, and z directions is listed in Table S1.† To verify if the vacuum space is sufficient to avoid interactions between a quantum dot and its image, we increased the lattice vector length of the cubic unit cell by 8 Å and 16 Å in all three directions and compared the electronic structure of systems with varied cubic simulation cell dimensions (Fig. S1†). For comparison, we plot PDOS (Fig. S2†), band gaps and projection of HOMO and LUMO over the Cd, Se, and ligand atomic orbitals (Table S2†). All structures were completely optimized until the interatomic energy and forces are less than 10−6 eV and 10−3 eV Å−1, respectively. The AIMD simulations use these optimized structures as the initial geometries and gradually heat up those to 300 K through repeated velocity rescaling in 2 ps. Furthermore, the equilibration process was conducted at 300 K using the canonical ensemble (NVT). Finally, 5 ps adiabatic MD trajectories were generated in the microcanonical ensemble (NVE) at one femtosecond time step for each cluster.Non-adiabatic coupling (NAC) matrix elements are computed for the relevant electronic states along the 5 ps trajectory at each time step using the CA-NAC package.56 Mathematically, time-dependent NAC matrix element djkṘ between states j and k is defined as:
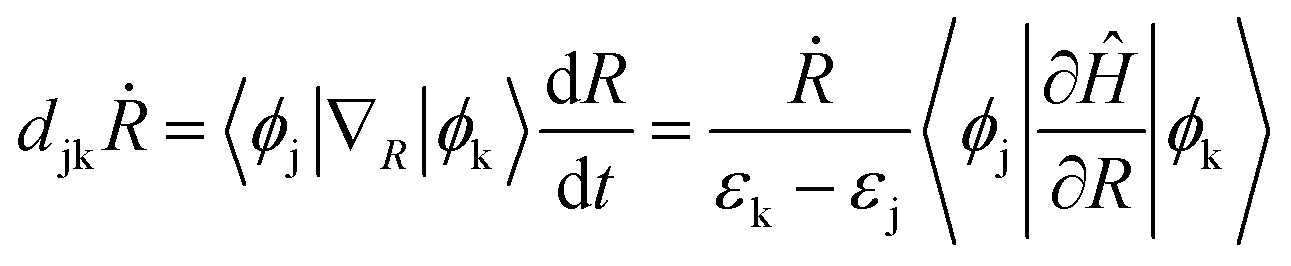 | (1) |
 and (iii) the nuclear velocity Ṙ. To simulate the charge relaxation dynamics on the timescale of hundreds of picoseconds, the 5 ps Hamiltonian is repeated several times. The ab initio dynamics timescale is long enough to capture the statistical vibrational information at the raised temperature (Fig. S4†).
The energy of each Kohn–Sham orbital and the coupling between them were fed into the quantum-classical DISH technique. DISH is useful when the pure dephasing time is shorter than the quantum transition time.57 In QDs, since the electronic states near the conduction band edge are discrete and have considerable energy differences, decoherence effects are important.58 DISH follows the classical path approximation (CPA), as it is implemented within the real-time TD-DFT framework in the PYthon eXtension for Ab Initio Dynamics (PYXAID) package.59,60 DISH method incorporates the decoherence effects which are otherwise missing in the commonly used Fewest Switch Surface Hopping (FSSH).61 DISH slows down the dynamics compared to FSSH as exemplified by the quantum Zeno effect.35 A semiclassical estimate of the quantum decoherence time is calculated using the pure dephasing function of the optical response theory. To estimate the decoherence effects, hole relaxation dynamics using the FSSH approach are also performed (Fig. S13†), showing an order of magnitude faster relaxation time compared to those obtained by DISH methods. For reliable results, we average 10![[thin space (1/6-em)]](https://www.rsc.org/images/entities/char_2009.gif) 000 electron–nuclear evolutions modeled by using 100 initial conditions and 100 stochastic hop sequences per initial condition. The DISH approach has been applied to study the photoinduced exciton dynamics in a broad set of nanomaterials in the literature.62–68 A detailed description of the methodology adopted in this study can be found elsewhere.69
000 electron–nuclear evolutions modeled by using 100 initial conditions and 100 stochastic hop sequences per initial condition. The DISH approach has been applied to study the photoinduced exciton dynamics in a broad set of nanomaterials in the literature.62–68 A detailed description of the methodology adopted in this study can be found elsewhere.69
Inverse participation ratio (IPR) corresponding to the ith KS state is calculated as:
 | (2) |
 | (3) |
Conflicts of interest
There are no conflicts to declare.Acknowledgements
The work at Los Alamos National Laboratory (LANL) was supported by the Laboratory Directed Research and Development (LDRD) programme at LANL under project 20200213DR. This work was done in part at the Center for Nonlinear Studies (CNLS) and the Center for Integrated Nanotechnologies (CINT), a U.S. Department of Energy and Office of Basic Energy Sciences user facility, at LANL. This research used resources provided by the LANL Institutional Computing Program. Los Alamos National Laboratory is operated by Triad National Security, LLC, for the National Nuclear Security Administration of the U.S. Department of Energy (Contract No. 89233218NCA000001). O. V. P. acknowledges support of the US Department of Energy, grant No. DE-SC0014429. S. K. acknowledges support of the National Science Foundation under grant No. 2004197. For computational resources, the authors acknowledge the Center for Computationally Assisted Science and Technology (CCAST) at North Dakota State University and the National Energy Research Scientific Computing Center (NERSC), supported by the Office of Science of the Department of Energy under Contract DE-AC02-439 05CH11231. All authors thank Dr Victor I. Klimov for fruitful discussions. DG acknowledges the IIT Delhi SEED Grant (PLN12/04MS), the Science and Engineering Research Board (SERB), Department of Science and Technology (DST), India for Start-up Research Grant SRG/2022/00l234 and the IIT Delhi HPC facility for computational resources.References
- M. G. Bawendi, M. L. Steigerwald and L. E. Brus, Annu. Rev. Phys. Chem., 1990, 41, 477–496 CrossRef CAS.
- S. V. Gaponenko, Optical Properties of Semiconductor Nanocrystals, Cambridge University Press, Cambridge, 1998 Search PubMed.
- A. Foerster and N. A. Besley, J. Phys. Chem. A, 2022, 126, 2899–2908 CrossRef CAS PubMed.
- M. A. Cotta, ACS Appl. Nano Mater., 2020, 3, 4920–4924 CrossRef CAS.
- D. Harankahage, J. Cassidy, M. Yang, D. Porotnikov, M. Williams, N. Kholmicheva and M. Zamkov, J. Phys. Chem. C, 2021, 125, 22195–22203 CrossRef CAS.
- D. Ghosh, S. A. Ivanov and S. Tretiak, Chem. Mater., 2021, 33, 7848–7857 CrossRef CAS.
- S. Kilina, S. Ivanov and S. Tretiak, J. Am. Chem. Soc., 2009, 131, 7717–7726 CrossRef CAS PubMed.
- S. Kilina, K. A. Velizhanin, S. Ivanov, O. V. Prezhdo and S. Tretiak, ACS Nano, 2012, 6, 6515–6524 CrossRef CAS PubMed.
- S. V. Kilina, P. K. Tamukong and D. S. Kilin, Acc. Chem. Res., 2016, 49, 2127–2135 CrossRef CAS PubMed.
- N. A. Hill and K. B. Whaley, J. Chem. Phys., 1994, 100, 2831–2837 CrossRef CAS.
- K. L. Sowers, Z. Hou, J. J. Peterson, B. Swartz, S. Pal, O. Prezhdo and T. D. Krauss, Chem. Phys., 2016, 471, 24–31 CrossRef CAS.
- E. A. Weiss, Acc. Chem. Res., 2013, 46, 2607–2615 CrossRef CAS PubMed.
- P. Guyot-Sionnest, M. Shim, C. Matranga and M. Hines, Phys. Rev. B: Condens. Matter Mater. Phys., 1999, 60, R2181–R2184 CrossRef CAS.
- P. Guyot-Sionnest, B. Wehrenberg and D. Yu, J. Chem. Phys., 2005, 123, 074709 CrossRef PubMed.
- A. Franceschetti and A. Zunger, Phys. Rev. B: Condens. Matter Mater. Phys., 2000, 62, R16287–R16290 CrossRef CAS.
- M. Califano, A. Franceschetti and A. Zunger, Nano Lett., 2005, 5, 2360–2364 CrossRef CAS PubMed.
- A. Puzder, A. J. Williamson, F. Gygi and G. Galli, Phys. Rev. Lett., 2004, 92, 217401 CrossRef PubMed.
- M. Yu, G. W. Fernando, R. Li, F. Papadimitrakopoulos, N. Shi and R. Ramprasad, Appl. Phys. Lett., 2006, 88, 231910 CrossRef.
- A. J. Houtepen, Z. Hens, J. S. Owen and I. Infante, Chem. Mater., 2017, 29, 752–761 CrossRef CAS.
- J. Jasieniak and P. Mulvaney, J. Am. Chem. Soc., 2007, 129, 2841–2848 CrossRef CAS PubMed.
- H. H. Wei, C. M. Evans, B. D. Swartz, A. J. Neukirch, J. Young, O. V. Prezhdo and T. D. Krauss, Nano Lett., 2012, 12, 4465–4471 CrossRef CAS PubMed.
- W. Xia, J. Wu, J. C. Hu, S. Sun, M. D. Li, H. Liu, M. Lan and F. Wang, ChemSusChem, 2019, 12, 4617–4622 CrossRef CAS PubMed.
- M.-Y. Huang, X.-B. Li, Y.-J. Gao, J. Li, H.-L. Wu, L.-P. Zhang, C.-H. Tung and L.-Z. Wu, J. Mater. Chem. A, 2018, 6, 6015–6021 RSC.
- M. Bhati, S. A. Ivanov, T. P. Senftle, S. Tretiak and D. Ghosh, J. Mater. Chem. A, 2022, 10, 5212–5220 RSC.
- T. F. Lu, S. Gumber, M. V. Tokina, J. A. Tomko, P. E. Hopkins and O. V. Prezhdo, Nanoscale, 2022, 14, 10514–10523 RSC.
- W. A. Tisdale, K. J. Williams, B. A. Timp, D. J. Norris, E. S. Aydil and X. Y. Zhu, Science, 2010, 328, 1543–1547 CrossRef CAS PubMed.
- Y. Gao and X. Peng, J. Am. Chem. Soc., 2015, 137, 4230–4235 CrossRef CAS PubMed.
- O. V. Prezhdo, Chem. Phys. Lett., 2008, 460, 1–9 CrossRef CAS.
- P. T. Landsberg, Recombination in Semiconductors, Cambridge University Press, Cambridge, 1992 Search PubMed.
- X.-Q. Li, H. Nakayama and Y. Arakawa, Phys. Rev. B: Condens. Matter Mater. Phys., 1999, 59, 5069–5073 CrossRef CAS.
- T. Inoshita and H. Sakaki, Phys. B, 1996, 227, 373–377 CrossRef CAS.
- S. V. Kilina, D. S. Kilin and O. V. Prezhdo, ACS Nano, 2009, 3, 93–99 CrossRef CAS PubMed.
- G. Zhou, G. Lu and O. V. Prezhdo, Nano Lett., 2021, 21, 756–761 CrossRef CAS PubMed.
- D. J. Trivedi, L. Wang and O. V. Prezhdo, Nano Lett., 2015, 15, 2086–2091 CrossRef CAS PubMed.
- S. V. Kilina, A. J. Neukirch, B. F. Habenicht, D. S. Kilin and O. V. Prezhdo, Phys. Rev. Lett., 2013, 110, 180404 CrossRef PubMed.
- A. Pandey and P. Guyot-Sionnest, Science, 2008, 322, 929–932 CrossRef CAS PubMed.
- R. D. Schaller, V. M. Agranovich and V. I. Klimov, Nat. Phys., 2005, 1, 189–194 Search PubMed.
- J. Huang, Z. Huang, Y. Yang, H. Zhu and T. Lian, J. Am. Chem. Soc., 2010, 132, 4858–4864 CrossRef CAS PubMed.
- A. J. Nozik, Phys. E, 2002, 14, 115–120 CrossRef CAS.
- E. Runge and E. K. U. Gross, Phys. Rev. Lett., 1984, 52, 997–1000 CrossRef CAS.
- J. C. Tully, J. Chem. Phys., 1990, 93, 1061–1071 CrossRef CAS.
- M. D. Peterson, L. C. Cass, R. D. Harris, K. Edme, K. Sung and E. A. Weiss, Annu. Rev. Phys. Chem., 2014, 65, 317–339 CrossRef CAS PubMed.
- V. N. Soloviev, A. Eichhofer, D. Fenske and U. Banin, J. Am. Chem. Soc., 2001, 123, 2354–2364 CrossRef CAS PubMed.
- A. J. Nozik, Annu. Rev. Phys. Chem., 2001, 52, 193–231 CrossRef CAS PubMed.
- K. Leung and K. B. Whaley, J. Chem. Phys., 1999, 110, 11012–11022 CrossRef CAS.
- C. F. Craig, W. R. Duncan and O. V. Prezhdo, Phys. Rev. Lett., 2005, 95, 163001 CrossRef PubMed.
- S. A. Fischer, B. F. Habenicht, A. B. Madrid, W. R. Duncan and O. V. Prezhdo, J. Chem. Phys., 2011, 134, 024102 CrossRef PubMed.
- G. Kresse and J. Furthmüller, Phys. Rev. B: Condens. Matter Mater. Phys., 1996, 54, 11169–11186 CrossRef CAS PubMed.
- G. Kresse and J. Hafner, Phys. Rev. B: Condens. Matter Mater. Phys., 1993, 47, 558–561 CrossRef CAS PubMed.
- G. Kresse and J. Hafner, Phys. Rev. B: Condens. Matter Mater. Phys., 1994, 49, 14251–14269 CrossRef CAS PubMed.
- K. Momma and F. Izumi, J. Appl. Crystallogr., 2008, 41, 653–658 CrossRef CAS.
- J. P. Perdew, K. Burke and M. Ernzerhof, Phys. Rev. Lett., 1996, 77, 3865–3868 CrossRef CAS PubMed.
- J. P. Perdew, in Advances in Quantum Chemistry, ed. P.-O. Löwdin, Academic Press, 1990, vol. 21, pp. 113–134 Search PubMed.
- S. Tretiak, K. Igumenshchev and V. Chernyak, Phys. Rev. B: Condens. Matter Mater. Phys., 2005, 71, 033201 CrossRef.
- G. Kresse and D. Joubert, Phys. Rev. B: Condens. Matter Mater. Phys., 1999, 59, 1758–1775 CrossRef CAS.
- W. Chu, Q. Zheng, A. V. Akimov, J. Zhao, W. A. Saidi and O. V. Prezhdo, J. Phys. Chem. Lett., 2020, 11, 10073–10080 CrossRef CAS PubMed.
- O. V. Prezhdo and P. J. Rossky, J. Chem. Phys., 1997, 107, 5863–5878 CrossRef CAS.
- J. C. Wong, L. Li and Y. Kanai, J. Phys. Chem. C, 2018, 122, 29526–29536 CrossRef CAS.
- A. V. Akimov and O. V. Prezhdo, J. Chem. Theory Comput., 2013, 9, 4959–4972 CrossRef CAS PubMed.
- A. V. Akimov and O. V. Prezhdo, J. Chem. Theory Comput., 2014, 10, 789–804 CrossRef CAS PubMed.
- H. M. Jaeger, S. Fischer and O. V. Prezhdo, J. Chem. Phys., 2012, 137, 22A545 CrossRef PubMed.
- S. Agrawal, W. Lin, O. V. Prezhdo and D. J. Trivedi, J. Chem. Phys., 2020, 153, 054701 CrossRef CAS PubMed.
- S. Agrawal, A. S. Vasenko, D. J. Trivedi and O. V. Prezhdo, J. Chem. Phys., 2022, 156, 094702 CrossRef CAS PubMed.
- C. M. Perez, D. Ghosh, O. Prezhdo, W. Nie, S. Tretiak and A. Neukirch, J. Phys. Chem. Lett., 2022, 5213–5219, DOI:10.1021/acs.jpclett.2c00575.
- C. M. Perez, D. Ghosh, O. Prezhdo, S. Tretiak and A. J. Neukirch, J. Phys. Chem. Lett., 2021, 12, 1005–1011 CrossRef CAS PubMed.
- J. He, W. H. Fang, R. Long and O. V. Prezhdo, J. Am. Chem. Soc., 2020, 142, 14664–14673 CrossRef CAS PubMed.
- W. Li, R. Long, J. Tang and O. V. Prezhdo, J. Phys. Chem. Lett., 2019, 10, 3788–3804 CrossRef CAS PubMed.
- D. Ghosh, C. M. Perez, O. Prezhdo, W. Nie, S. Tretiak and A. J. Neukirch, J. Mater. Chem. C, 2022, 10, 9563–9572 RSC.
- S. Gumber, S. Agrawal and O. V. Prezhdo, J. Phys. Chem. Lett., 2022, 13, 1033–1041 CrossRef CAS PubMed.
Footnote |
| † Electronic supplementary information (ESI) available. See DOI: https://doi.org/10.1039/d3ta00149k |
| This journal is © The Royal Society of Chemistry 2023 |