
 Open Access Article
 This Open Access Article is licensed under a Creative Commons Attribution-Non Commercial 3.0 Unported Licence
Cation deficiency enables reversal of dopant segregation at perovskite oxide surfaces under anodic potential†
Dongha
Kim‡
 a,
Adrian
Hunt
b,
Iradwikanari
Waluyo
b and
Bilge
Yildiz
*ac
a,
Adrian
Hunt
b,
Iradwikanari
Waluyo
b and
Bilge
Yildiz
*ac
aDepartment of Materials Science and Engineering, Massachusetts Institute of Technology, 77 Massachusetts Avenue, Cambridge, MA 02139, USA. E-mail: byildiz@mit.edu
bNational Synchrotron Light Source II, Brookhaven National Laboratory, Upton, NY 11973, USA
cDepartment of Nuclear Science and Engineering, Massachusetts Institute of Technology, 77 Massachusetts Avenue, Cambridge, MA 02139, USA
First published on 13th March 2023
Abstract
Surface instability of perovskite oxides caused by aliovalent dopant segregation and resultant formation of insulating surface layers and precipitates, such as SrOx, limits the performance and durability of these materials in energy conversion, including in solid oxide fuel and electrolysis cells. Previous studies showed that reversal (re-incorporation) of such dopant segregation layers can occur under both cathodic and anodic potential in Sr-doped lanthanum manganite (LSM) as a model perovskite system. Sr segregation under anodic and reversal of segregation under cathodic potential could be explained by a defect equilibrium reaction involving A-site cation vacancies and Mn oxidation state. Sr segregation under cathodic and reversal of segregation under anodic potential is also known to take place, but it has been poorly understood and its governing mechanism is not known. In this study, we show that defect reactions involving cation vacancies and oxygen holes at high oxygen pressures can account for re-incorporation of the segregated dopant from the surface into the bulk of lanthanum manganite under anodic conditions. We use Ca-doped lanthanum manganite (LCM) as a model perovskite oxide. We have demonstrated with X-ray photoelectron and absorption spectroscopy that the precipitation and re-incorporation of the surface CaOx under cathodic and anodic potential, respectively, are coupled with the reduction and oxidation of the perovskite surface. Under oxidizing, anodic conditions, cation-deficient perovskite unit cells form on/near the surface, allowing for the dissolution of the excess Ca at the surface back into the perovskite lattice. Notably, applying anodic potential could remove half of the surface Ca precipitates within a few minutes, thus improving the oxygen exchange kinetics of the LCM surface significantly. These results establish a highly efficient oxidative route for activating perovskite oxide surfaces and advance the quantitative understanding of dopant segregation and re-incorporation reactions.
Introduction
Perovskite oxides (ABO3) are widely used in clean energy conversion applications, including solid oxide fuel and electrolysis cells (SOFC/ECs),1–6 solar thermochemical fuel production,7–9 and gas separation membranes.10 Many state-of-the-art perovskites, such as La1−xSrxMnO3,11–16 La1−xSrxCoO3,17–22 La1−xSrxCo1−yFeyO3,23–27 and SrTixFe1−xO3 (ref. 28–31) suffer from degradation of their surface chemistry and oxygen exchange kinetics at elevated temperatures. This process limits their long-term stability in the aforementioned applications. This degradation is primarily because of dopant segregation to the surface and precipitation in the form of insulating phases, such as SrOx. These insulating surface layers block the electron transfer and oxygen exchange pathways, impeding the oxygen exchange kinetics12,24,32 and reducing the attainable power densities.2In our previous studies, we have demonstrated that electrostatic (Eelec) and elastic (Eela) energies of dopant are important driving forces for dopant segregation on perovskite oxides.33,34 Predominantly under cathodic overpotentials (or low pO2,eff), negatively charged dopant 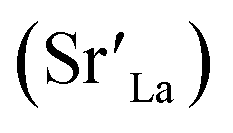 can segregate to the surface due to the electrostatic attraction (Eelec) to the positively charged oxygen vacancies
  enriched at the surface. Under anodic overpotentials (or high pO2,eff), too, the dopant can segregate and precipitate in the form of a binary oxide at the surface, e.g. SrOx. This is because precipitation of the larger dopant cation (RLa3+ < RSr2+) to the surface relaxes the elastic energy (Eela) in the perovskite phase which contracts when oxidized. Due to their different overpotential dependence, Eelec and Eela dominate at the low and high pO2,eff regimes, respectively, giving rise to a convex total segregation behavior with respect to pO2,eff (red and blue solid lines in Fig. 1a).
 | ||
| Fig. 1 Electrochemically driven dopant segregation and re-incorporation. (a) Schematic rendering of the dependence of dopant segregation on electrochemical potential for an acceptor-doped lanthanum manganite, described by the sum of the two driving forces; red solid and dashed line = electrostatic energy (Eelec), blue solid and dashed line = elastic energy (Eela). (b) Segregation vs. potential graph of La0.8Ca0.2MnO3 (LCM). The thin-film LCM samples were annealed under different potentials at 770 °C for 1 h in pure oxygen by using the lateral polarization method (open circles).34 Another set of LCM samples were annealed with the two-step polarization approach to investigate the reversal of Ca segregation. In this approach, the samples were initially annealed for 1 h under cathodic potential, followed by anodic potential for another 1 h; black dashed arrows indicate the change of the applied local potential during the two-step polarization experiment. The resulting{Casurf/(La + Ca)}norm after this two-step polarization experiment are plotted as triangles. All the error bars are smaller than the size of the data points. | ||
Importantly, the fact that dopant segregation is a thermodynamically driven process implies that it can be reversed if the reverse reaction is kinetically unrestricted. Several previous studies reported that dopant segregation induced by anodic potential (or under oxidizing environment) could be reversed with cathodic potential.13,35,36 Jiang13 and Janek36 groups have reported that applying cathodic potential to (La0.8Sr0.2)0.9MnO3 and La1−xSrxCoO3 incorporated the surface SrOx back into the perovskite phase. This led to the improvement of the surface oxygen exchange rate by several orders of magnitude.13 Based on the role of Eela described in Fig. 1a, we can reason that the reduction of Eela under reducing conditions (or cathodic potential) is one reason for this reversal of segregation. However, increasing contribution from Eelec under reducing conditions can actually drive segregation as well.19,34,37 Therefore, it is difficult to reconcile this reversal of segregation under cathodic conditions only by considering Eela and Eelec as shown in Fig. 1a. In addition to the elastic and electrostatic energy contributions, we believe that we must also consider the defect equilibria in the perovskite oxide in the segregation in the form of dopant oxide precipitates, and reversal of such segregation on perovskite oxides, as we have recently studied theoretically.38Eqn (1) demonstrates the known defect reaction that can explain the dopant segregation (forward) under anodic conditions and dopant re-incorporation (backward) under cathodic conditions.36,39
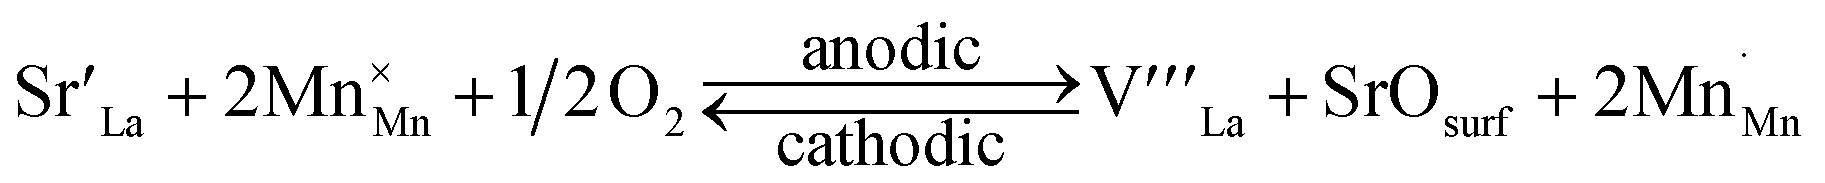 | (1) |
 = Sr on the La lattice site,
  = Mn on the Mn lattice site,
 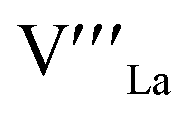 = La vacancy,
  = Mn with single positive charge on the Mn lattice site)
In contrast, the opposite segregation behavior, dopant segregation under cathodic and its reversal under anodic conditions, is also observed in similar perovskite oxides such as La1−xSrxCo1−yFeyO3 (ref. 20, 23 and 24) and La1−xSrxMnO3.40–42 However, the defect reaction in eqn (1) cannot explain this segregation and reversal phenomenon. Also, as described in Fig. 1a, going toward anodic conditions suppresses the Eelec contribution but it also increases the elastic energy contribution to Sr segregation. Hence, the Eela and Eelec argument fails to explain the dopant re-incorporation under anodic conditions after segregation at cathodic conditions as well. Therefore, in addition to eqn (1), we need to consider another defect equilibrium to fully explain this contradicting segregation and reversal phenomenon. To this end, a defect reaction that we may have to consider is:
 | (2) |
 (empty unit cells),
  = O vacancy,
 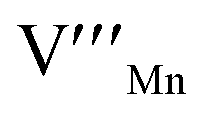 = Mn vacancy,
  = O on the O lattice site)
This Schottky reaction under oxidizing conditions is known from the bulk point defect equilibrium in doped lanthanum manganites where cation vacancies are formed as the perovskite oxides incorporate oxygens into the lattice as they are oxidized.43,44 Importantly, this reaction also describes the formation of new empty perovskite unit cells (labeled as ‘nil’) with cation vacancies. Hinted by this, we reasoned that these cation-deficient unit cells at the surface could take in the segregated Sr, leading to the dopant re-incorporation under anodic conditions. The defect reaction in eqn (2) can be coupled with the dopant re-incorporation reaction occurring at the surface under anodic conditions.
In this study, we propose a new defect reaction that successfully explains the dopant segregation under cathodic and re-incorporation under anodic potential. We used thin-film La0.8Ca0.2MnO3 (LCM) as a primary model system because dopant segregation in LCM increases monotonically as potential goes from anodic to cathodic,34 which corresponds exactly to the dopant segregation and re-incorporation reactions that we aim to investigate. With X-ray photoelectron spectroscopy (XPS) and X-ray absorption spectroscopy (XAS) measurements, we quantitatively analyzed the dopant segregation and re-incorporation reactions on LCM induced by electrochemical potential and found that dopant re-incorporation reaction on LCM is coupled to its surface oxidation process. We have found that such an oxidation process at the ‘surface’ is mediated predominantly by oxygen, O, rather than Mn which becomes redox-active only in the bulk. Also, the fact that lanthanum manganites equilibrate with cation vacancies under oxidizing conditions (eqn (2)) is key to formulating the defect reaction explaining the dopant re-incorporation reaction. Electrochemical impedance spectroscopy (EIS) showed that applying anodic potential to LCM improved its oxygen exchange kinetics, i.e., reduced impedance, in a short time (<5 min) by removing the insulating CaOx at the surface. This process was reversible over several cycles. Also, we show that the results from LCM can be transferred to La0.8Sr0.2MnO3 (LSM) which is one of the state-of-the-art air electrodes in solid oxide fuel and electrolysis cells. These findings advance our understanding of the governing mechanisms of surface instability and provide insights for operating perovskite oxides to maintain their surface chemical stability in a range of energy conversion applications.
Experimental methods
Sample preparation and characterizations
La0.8Ca0.2MnO3, La0.8Sr0.2MnO3, and La0.8Ba0.2MnO3 thin films were deposited onto (100)-oriented single crystals of YSZ (yttria-stabilized zirconia, 8 mol% Y2O3, MTI Corp.) via pulsed laser deposition (PLD). During the deposition, the substrate temperature was maintained at 700 °C and the oxygen pressure of the chamber was kept at 0.5 mTorr. The oxygen pressure was increased to 500 mTorr O2 while cooling to room temperature. In order to remove pre-existing surface dopant oxide layers, which form at the surface during PLD deposition, the thin-film samples were immersed in high-purity deionized water for 1 min. The effect of this pre-treatment process was demonstrated in earlier work.45 The thickness of the thin films was measured by Bruker DXT Stylus profilometer and was measured 80–100 nm. To examine the dopant segregation and re-incorporation on La0.8Ca0.2MnO3, La0.8Ca0.2MnO3 thin-film samples from the same PLD batch were used for each set of potential experiments to avoid any experimental artefact. Out-of-plane X-ray diffraction (XRD, Rigaku Smartlab) measurement showed that all the films were in the perovskite phase and had preferential texture along (110) and (100). The surfaces of the films were imaged by high-resolution scanning electron microscopy (HRSEM) using a Zeiss Merlin HRSEM with an in-lens secondary electron detector.X-ray photoelectron spectroscopy (XPS) measurement
The chemical composition of the films' near-surface region was characterized by X-ray photoelectron spectroscopy (XPS) using a Physical Electronics Versaprobe II X-ray photoelectron spectrometer equipped with a monochromated Al Kα X-ray source. The angle between the analyzer and the surface plane was set to 45°. Please note that all the XPS experiments were done ex situ. For quantitative analysis, core-level emission lines with similar inelastic mean free paths (λ) were chosen; La 4d (λ = 1.66–1.69 nm), Mn 3p (λ = 1.72–1.74 nm), Ba 4d (λ = 1.70 nm), Sr 3d (λ = 1.65 nm), and Ca 2p (λ = 1.43 nm).46 The resulting spectra were analyzed to quantify the amount of each component by normalizing their peak area by the sensitivity factor of each core-level orbital.47 The quantification of the Casurf on LCM samples was done in this way. In Fig. 2, 4, and 6, the amount of the Casurf was normalized with the total A-site cations (Casurf/(La + Ca)), and further normalized with the Casurf/(La + Ca) of a separate reference sample that had the least segregated state. This reference sample was annealed solely under +0.3 V for 1 h. In Fig. 1 and 7, the normalization was done in the same way but the reference sample was the as-prepared LCM and LSM. We used the reference sample because LCM films from different PLD batches often showed a big difference in the absolute amount of Casurf even under the same annealing conditions. Due to the limit of the number of thin films we could deposit in a PLD batch at once, we used the amount of Casurf on one of the LCM thin films annealed under +0.3 V for 1 h as a reference segregation state of each PLD batch. | ||
| Fig. 2 Re-incorporation of surface segregates under anodic potential and the resulting changes in the surface morphology of the LCM film. (a) Amount of Casurfvs. time duration of anodic potential. Two different cathodic potentials, −0.15 V (pink star, y-axis on the left) and −0.6 V (brown star, y-axis on the right), were first applied to the LCM thin films to induce dopant segregation. Different anodic potentials, +0.3 V (circles), +0.45 V (squares), and +0.9 V (triangles), were then applied for different time durations to induce dopant re-incorporation. The error bars in (a) are standard deviation of the results of the three different sample sets deposited from different PLD batches. SEM images of the sample annealed under (b) −0.15 V, 1 h, (c) −0.15 V, 1 h → +0.9 V, 20 min, (d) −0.15 V, 1 h → +0.9 V, 1 h, (e) −0.6 V, 1 h, (f) −0.6 V, 1 h → +0.9 V, 3.5 h, and (g) −0.6 V, 1 h → +0.9 V, 9 h. The colored symbols in the top-left corner of the images indicate the corresponding data points in (a). Scale bars in (b) and (e) indicate 4 μm and the one in the inset of (b) indicates 800 nm. | ||
 | ||
| Fig. 3 Redox-active species at the surface of LCM. (a) O K-edge and (b) Mn L-edge spectra in total-electron-yield (TEY) mode measured from the LCM thin-film samples annealed under different potentials. The inset of (a) shows a magnified view of the Mn 3d–O 2p hybridization peak at ∼530 eV. (c) Comparison between the integrated area of the Mn 3d–O 2p peaks under different potentials (colored circles, y-axis on the right) and the oxygen non-stoichiometry curve of LSM obtained under similar experimental conditions43 (black dots, y-axis on the left). The blue-colored region in (c) indicates the range of the effective pO2 (log(pO2) > 0) induced by applying anodic potential. | ||
 | ||
| Fig. 4 Dopant re-incorporation under anodic potential correlates with the oxidation of the LCM surface. (a and b) Total-electron-yield O K-edge XAS spectra measured from the LCM thin films annealed under different potentials. (c) Integrated area of the Mn 3d–O 2p peak in O K-edge XAS with respect to the time duration of anodic potential (pink and brown data points, y-axis on the left); samples polarized under −0.15 V, 1 h (pink star), −0.15 V → +0.3 V (pink circles), −0.15 V → +0.9 V (pink triangles), −0.6 V, 1 h (brown star), −0.6 V → +0.45 V (brown squares), and −0.6 V → +0.9 V (brown triangles). The temporal changes of the amount of Casurf (Fig. 2a) are also plotted as thick solid lines (y-axis on the right). (d) Proposed dopant re-incorporation reaction on the LCM surface under anodic potential. | ||
 | ||
| Fig. 5 Activation of the LCM surface under different potentials. (a) After annealing an LCM film under −0.15 V for 1 h at 770 °C (pink solid line), electrochemical impedance spectroscopy (EIS) was taken at every 5 or 10 min while applying +0.3 V at the same temperature (blue dashed lines). Please note that all the EIS were consistently taken under 0 V. (b) −0.6 V was first applied to LCM film for 1 h (brown solid line) and the potential was switched to +0.3 V. During the annealing under +0.3 V, EIS spectra were taken periodically under 0 V (blue dashed lines). | ||
 | ||
| Fig. 6 Normalized impedance of the LCM film (Znorm) calculated from the electrochemical impedance spectra shown in Fig. 5. Znorm is plotted with respect to the time duration of anodic potential; −0.15 V (1 h) → +0.3 V (pink circles), −0.15 V (1 h) → +0.9 V (pink triangles), and −0.6 V (1 h) → +0.3 V (brown circles). Znorm = Z/Z0: Z = polarization resistance of LCM measured at 0 V after applying cathodic potential for 1 h and sequentially applying anodic potential for different time durations; Z0 = polarization resistance of LCM measured at 0 V before applying any potentials (right after the temperature reached to 770 °C and dwelling for 15 min). The temporal changes of the amount of Casurf (Fig. 2a) are plotted as thick solid lines (y-axis on the right) together with Znorm. | ||
 | ||
| Fig. 7 (a) Segregation vs. potential on La0.8Sr0.2MnO3 (LSM). (b) Another set of LSM samples were annealed with the two-step approach to investigate the reversal of Sr segregation; black dashed arrows indicate the change of the applied local potential during the two-step polarization experiment. The amounts of the resulting {Srsurf/(La + Sr)}norm after changing the potential to 0 to +0.2 V are plotted as triangles and overlapped with the data points in (a). | ||
Lateral polarization method
Lateral polarization method enabled us to investigate a wide range of potentials with a small number of thin-film samples, thus minimizing experimental artifacts. Possible experimental artifacts include using samples from different PLD batches or different experimental conditions such as variations in sputtering conditions or annealing temperatures. This method is based on the original design by Huber et al.48 and the utility of this method for segregation study was previously demonstrated by our group34 (Fig. S1†). For the preparation of the cells, Pt paste (SPI Corp.) was applied at the back side and one edge of YSZ crystals before the thin-film growth process to form a porous Pt counter electrode (CE). The deposited Pt electrode was heated at 700 °C in the air for 30 min to evaporate the solvent and sinter the electrode. After depositing the thin films, electrical contact points were created by sputter deposition of a Ti adhesion layer (10 nm) followed by a Pt contact layer (100 nm). The regions for sputtering were defined by a Kapton mask which covered the film surface, leaving a 2 mm gap at the side for depositing the upper side of the CE. The WE was deposited through a 3 × 7 mm2 rectangular opening of the mask at a distance of 3 mm from the CE. With such a configuration, we could create the electrical connection between the WE and CE along the perovskite thin-film electrode. Upon application of electrical potential to the WE, the thin film serves as an ohmic resistor for the electronic current, resulting in a linear voltage drop across the distance between the WE and CE. The local potential applied at a local measurement point can be calculated with the applied potential on the WE and the distance between the measurement point and the WE (Fig. S1b†). This was proven by an in situ XPS measurement performed in our previous study.34 After potential experiments, the exposed surface of the thin film in between the WE and CE was analyzed with a variety of characterization tools, such as XPS and SEM, by scanning along the sample surface. Further details can be found in our previous report.34 In the two-step polarization approach, cathodic and anodic potentials were sequentially applied to LCM for 1 h each, and the potential change was done gradually with a rate of 1 mV s−1 to prevent any electrochemical shock to the films.X-ray absorption spectroscopy (XAS) measurement
XAS reveals the oxidation state of a sample in an element-specific way, and thus allows us to find the relationship between the oxidation of the samples and dopant re-incorporation reaction, and also which chemical species are involved in the oxidation process. In general, the redox-active species of perovskite oxides are transition metal cations or oxygen anions as they constitute the valence band.49–51 Hence, we investigated the O K-edge and Mn L-edge spectra of the La0.8Ca0.2MnO3 (LCM) samples used in our experiments. Please also note that all the XAS experiments were done ex situ. The oxidation of the LCM thin-film samples was probed by using XAS at beamline 23-ID-2 of the National Synchrotron Light Source II in Brookhaven National Laboratory (BNL). O K-edge and Mn L-edge X-ray absorption spectra were collected from each sample. The spectra were collected both in the total-electron-yield (TEY) and partial-fluorescence-yield (PFY) modes, corresponding to a probing depth of less than 10 nm and 100 nm, respectively. In the O K-edge spectra of La0.8Ca0.2MnO3 thin-film samples, the integrated area of the peak at ∼530 eV (Ival) serves as an indicator of the concentration of the oxygen holes in the valence band, thus the oxidation of the sample. Thus, we used Ival to quantify the oxidation extent of LCM. Possible contributions from the formation of binary oxides or hydroxides, such as CaO, Ca(OH)2, CaCO3, La2O3, and MnOx, to the Ival are negligible.52–56 The concentration of the lattice Ca (Calatt) which could also influence the Ival does not show any trend during the oxidation of LCM (Fig. S22†), thus confirming that the increase in Ival is attributed to the oxidation of LCM.Results and discussion
Dopant segregation and re-incorporation on Ca-doped LaMnO3 under electrochemical potential
First, we investigated the segregation behavior of LCM under different potentials using the lateral polarization approach (Fig. S1†). For this, two LCM thin-film samples were kept at 770 °C in 1 atm O2 for 1 h under a wide range of potentials, −0.6 and +1.2 V at the WE, respectively. For the following ex situ analysis, we chose three local points between the CE and WE on the two LCM samples. The local potentials applied during the lateral polarization experiment on the sample annealed under −0.6 V (at its WE) were −0.45, −0.3, and −0.15 V, and those on the sample annealed under +1.2 V (at its WE) were +0.3, +0.6, and +0.9 V. The extent of the resulting segregation was analyzed with X-ray photoelectron spectroscopy (XPS). Ca 2p core-level spectra were deconvoluted into the surface (Casurf, red envelops in Fig. S2a†) and lattice components (Calatt, blue envelops in Fig. S2a†). This allowed the quantification of the surface CaOx-like precipitates (Casurf) which were formed as a result of segregation. The amount of Casurf was first divided by the total A-site cations and the resulting Casurf/(La + Ca) was then normalized by the Casurf/(La + Ca) of the as-prepared sample. The resulting {Casurf/(La + Ca)}norm are plotted with respect to the applied local potential as open circles in the segregation graph of LCM in Fig. 1b. The monotonic relationship between the amount of Casurf and potential is consistent with our previous results.34 In our previous work, we confirmed that such a monotonic increase in the amount of Casurf observed by XPS was in line with the increase in the surface roughness of the LCM films calculated by AFM.34 Next, in order to examine the reversibility of Ca segregation, another set of LCM samples were annealed with a two-step polarization approach. In this approach, cathodic and anodic potentials were sequentially applied to the LCM samples for 1 h each. The same local cathodic potentials, −0.45, −0.3, and −0.15 V, as in the previous sample were applied for the first 1 h, followed by local anodic potential of +0.3, +0.6, and +0.9 V, respectively, for another hour. The resulting amounts of the Casurf after this two-step polarization experiment were again quantified by XPS, normalized by the same method as before ({Casurf/(La + Ca)}norm), and are plotted as triangles in Fig. 1b. It can be seen that the amounts of the Casurf on these samples were close to those on the sample annealed only under anodic potential that we got before (circles at the same potentials). This indicates that Ca segregation resulting from cathodic potential can be reversed by applying anodic potential afterwards. This result was further supported by additional experiments and SEM measurement which will be explained in the next section. Recalling the underlying energetics of dopant segregation described in Fig. 1a, this desegregation phenomenon could be related to the suppression of Eelec component (red dashed arrow at high pO2) under anodic conditions. However, as mentioned earlier, such energetics alone cannot explain the reaction that promotes the removal of dopant precipitates and their re-incorporation into the perovskite phase under anodic potential. In order to better understand this reversal reaction, we investigated the dopant re-incorporation process under various combinations of cathodic and anodic potentials.Dopant re-incorporation under different cathodic and anodic potentials
We further investigated dopant re-incorporation with the conventional potential method (Fig. S1a†) under different magnitudes of the initial cathodic potential and the subsequent anodic potential. Two different cathodic potentials, −0.15 V or −0.6 V, were applied for 1 h to first induce Ca segregation on LCM and three different anodic potentials, +0.3, +0.45, or +0.9 V, were thereafter applied for different time durations to reverse the dopant segregation. We found in our previous study34 that applying high negative potential (≤−0.6 V) to the LCM surface resulted in significantly different surface morphology and amount of Ca segregation compared to those treated under low negative potential (∼−0.15 V). In this study, the two cathodic potentials, −0.15 V and −0.6 V, were chosen to investigate how such different initial states of LCM induced under these potentials affect the following dopant re-incorporation reaction under anodic potentials. Also, we avoided applying too high negative potential not to destroy the perovskite structure of LCM. After the polarization experiment, the amount of the resulting Casurf was quantified by XPS and plotted with respect to the time duration of anodic potential as shown in Fig. 2a. First, when dopant segregation is induced under −0.15 V, more than twice the amount of Casurf/(La + Ca) is formed at the surface of LCM (a pink star, y-axis on the left) compared to a reference sample annealed under +0.3 V for 1 h (relative value of 1 in the plot). As can be seen in Fig. 2a (pink data points), when anodic potentials are sequentially applied to the sample, more than a half of the Casurf is removed in 5 min and the amount of Casurf gets closer to that on the reference sample over time ({Casurf/(La + Ca)}norm approaching 1). The corresponding XPS spectra are available in Fig. S3a.† Also, the amount of the Casurf removed under anodic potential was almost independent of the magnitude of the anodic potential (between +0.3 (circles), +0.45 (a square), and +0.9 V (triangles)). These XPS results were further supported by scanning electron microscopy (SEM) measurement. Fig. 2b–d show that the number of the CaOx precipitates on the surface decreases with increasing time spent at a potential of +0.9 V and the surface of LCM starts to exhibit a grainy structure (inset of Fig. 2d). This surface morphology matches well with that of the as-prepared sample (Fig. S4†). The samples polarized at a different anodic potential (−0.15 → +0.3 V) also showed similar SEM results (Fig. S5a†).When −0.6 V was applied to LCM (brown star in Fig. 2a, y-axis on the right), more than 6-times higher amount of Casurf/(La + Ca) was formed at the surface than the reference sample. Unlike the rectangular precipitates observed at the surface of the sample initially polarized at −0.15 V (Fig. 2b), the surface of the sample initially polarized under −0.6 V seems to be evenly covered by CaOx layers (Fig. 2e). Such different surface morphologies of LCM formed under different potentials were also reported in our previous report.34 Applying anodic potential could also reverse the dopant segregation that was induced under −0.6 V, as evidenced by the decrease in the XPS signal from the Casurf component (Fig. S3b†). However, the amount of Casurf on this sample (brown circles in Fig. 2a) decreased at a slower rate than the sample polarized under −0.15 V. Only after the prolonged application of anodic potential for >1 h, the surface morphology of LCM started to change as the CaOx layer was removed (Fig. 2g). The samples polarized at a different anodic potential (−0.6 → +0.45 V) also showed similar SEM results (Fig. S5b†). After applying anodic potential for 9 h, the amount of the CaOx decreased down to one third of its initial amount. Different from the samples treated initially under −0.15 V, the samples treated first at −0.6 V gave different final amounts of Casurf when different anodic potentials were applied (Fig. 2a). Also, the Casurf amount was highest at +0.3 V and lowest at +0.9 V after 60 min, but such a trend was inversed at 540 min. We think such a different dopant re-incorporation behavior is attributed to the formation of microcracks in the sample pretreated under −0.6 V. Further discussion on this is given in the later section.
Above results from XPS and SEM clearly show that the dopant precipitates at the LCM surface formed under cathodic potential can be removed by applying anodic potential. Also, the magnitude of the initial cathodic potential had a significant impact on the rate of dopant re-incorporation under anodic potential. Then, a question arises as to which chemical reactions induces the re-incorporation of the dopant precipitates into the perovskite phase. We believe that understanding the oxidation behavior of the LCM surface is key to answer this question, so we investigated the dominant redox-active species of the LCM surface under anodic potential. Then, we analyzed how the initial cathodic potential and the following anodic potential affect the oxidation kinetics of the LCM surface.
Redox-active species of the LCM surface
To identify the dominant redox-active species in relation to Ca segregation at the LCM surface, we performed X-ray absorption spectroscopy (XAS) measurement in total-electron-yield (TEY) mode on the LCM thin films. The samples were annealed in 1 atm O2 at 770 °C for 1 h under potentials ranging from −0.75 to +0.3 V using conventional polarization method. Fig. 3a shows the O K-edge XAS spectra (ex situ) of these LCM samples. The peak at ∼530 eV, known as the hybridized Mn 3d–O 2p state,49,50,57,58 indicates the presence of the oxygen holes in the valence band of LCM.57 The inset of Fig. 3a shows that the intensity of this peak increases as higher anodic potential is applied. This means that the lattice oxygen at/near the LCM surface is oxidized under anodic potential, thus creating more oxygen holes. By contrast, the Mn L-edge XAS spectra in Fig. 3b show no noticeable peak shifts beyond the instrument error (∼0.1 eV) or changes in the spectral shape. These results indicate that O is the predominantly redox-active species in the oxidation of the LCM surface. When we measured the bulk of LCM in partial-fluorescence-mode (PFY) mode, the Mn L-edge spectra showed a shift of ∼0.2 eV as potential changed from −0.75 to +0.3 V, while O K edge did not show notable changes (Fig. S6†). Thus, the conventional understanding that the transition metal, Mn, is the redox-active species of manganite perovskite oxides is valid in the bulk of LCM,59 but the surface of this perovskite oxide had oxygen as the redox-active species, consistent with another perovskite oxide surface reported earlier.50To quantify the oxidation of the LCM surface, the area of the Mn–O peaks is calculated (see Fig. S7† for the details of the peak integration) and plotted with respect to the effective pO2 applied to the LCM thin films by potential as shown in Fig. 3c (colored circles, y-axis on the right). Each potential value was converted to the effective pO2 by using the Nernst equation (high effective pO2 is applied at anodic potential). We then compared the resulting curve to the oxygen non-stoichiometry curve of the LSM bulk (black dots and line in Fig. 3c) with the same amount of dopant as a reference. We assumed here that LCM would have similar oxygen non-stoichiometry with LSM. It can be found that the oxidation of the LCM surface (colored circles) shows similar pO2 dependence with the oxidation of the LSM bulk (black dots), having two steeply ascending regions and two plateau regions. The oxidation of the LSM bulk in the first ascending region at low pO2 (−20 < log(pO2) < −15) is explained by the formation/annihilation of the oxygen vacancies. The oxidation of the LCM surface also increased at low pO2 presumably as oxygen vacancies are annihilated, but this occurred at higher pO2 (−15 < log(pO2) < −5) than the LSM bulk. This mismatch between the two is thought to be because the surface of manganite perovskite oxides is more reducible than the bulk;60 the reduction of the LCM surface occurs at higher pO2 than its bulk. After passing the first plateau region, both the LSM bulk and LCM surface start to exhibit the second ascending region at high pO2; −5 < log(pO2) < 0 for the LSM bulk and 0 < log(pO2) < 5 for the LCM surface. It is known that the LSM bulk starts to accommodate oxygen excess at this high pO2 by creating cation vacancies,  and
and  (eqn (2)).43 Based on the chemical similarity between LSM and LCM, it is reasonable to assume that the LCM surface also undergoes similar oxidation process, i.e., creation of cation vacancies, during oxidation at this high pO2 (0 < log(pO2) < 5). It is hence expected that the formation of the cation vacancies at the LCM surface would be related to the dopant re-incorporation reaction on the LCM surface under anodic potential (log(pO2) > 0, blue-colored region in Fig. 3c). As the LSM bulk and LCM surface get further oxidized, the creation of additional cation vacancies becomes energetically more demanding due to the significant repulsive forces among these defects.43 Therefore, perovskite oxides can hardly undergo further oxidation and this is manifested as the second plateau in the non-stoichiometry curve of the LSM bulk (0 < log(pO2) < 7.5) and the oxidation curve of the LCM surface (2.5 < log(pO2) < 6) (Fig. 3c, blue-colored region). Based on this result, we performed mechanistic studies and quantitative analysis on the dopant re-incorporation at the LCM surface, and the results are given in the following section.
Mechanism behind dopant re-incorporation under anodic potential
Examining the relation between dopant re-incorporation rates and oxidation rates is helpful in resolving the mechanism of dopant incorporation under anodic potential. Hence, we measured ex situ XAS on the LCM samples used in Fig. 2 to investigate their oxidation kinetics. Fig. 4a and b show the resulting O K-edge XAS spectra of the LCM samples in total-electron-yield (TEY) mode. The sample annealed first under −0.15 V (Fig. 4a) shows a fast increase in the Mn 3d–O 2p peak intensity shortly after applying +0.9 V without further changes afterwards. Based on the results in Fig. 3, this can be interpreted that the sample underwent fast oxidation under +0.9 V within a few minutes without further oxidation afterwards. On the other hand, the LCM film pre-annealed under −0.6 V shows a gradual increase in the Mn 3d–O 2p peak intensity over 9 h under the same +0.9 V potential (Fig. 4b). This means that this sample took much longer time to be oxidized compared to the one pre-annealed under −0.15 V. Similar results are observed also under different anodic potentials (see Fig. S8 in ESI†). The temporal changes of the integrated area of the Mn 3d–O 2p peak are summarized in Fig. 4c (pink and brown data points, y-axis on the left), clearly showing that the samples kept initially under −0.15 V (pink data points) underwent much faster oxidation than those kept under −0.6 V (brown data points). Such a difference in the oxidation rates of these two sample sets is very similar to the rate of dopant re-incorporation behaviors shown in Fig. 2a. For easy comparison, the graph in Fig. 2a showing the temporal changes of the amount of Casurf is also plotted in Fig. 4c (thick solid lines, y-axis on the right). The resulting plots show that the oxidation of the LCM surface and dopant re-incorporation reaction on it have very similar time dependence. This implies that the oxidation of the LCM surface and the re-incorporation of CaOx are coupled and take place simultaneously.One possible question here would be, why the oxidation of the LCM surface should occur by re-incorporating the dopant precipitates, rather than it undergoing the typical oxidation reaction of manganite perovskite oxides (eqn (2)). We think this is because the near-surface region of LCM is highly A-site deficient after the dopant segregation under cathodic potential.61 The oxidation process through eqn (2) accompanies the formation of A- and B-site vacancies and new unit cells at the surface. However, the formation of additional unit cells at the already A-site deficient surface would be highly unfavorable. Therefore, the surface would create only B-site vacancies while incorporating Ca, which is readily available in the surface CaOx precipitates, into the A sites of the new unit cells. The relevant defect equation is given in eqn (3) in the next section.
In Fig. 2 and 4, we showed that the magnitude of the initial cathodic potential had a significant effect on the dopant re-incorporation and oxidation rates of the LCM surface when reversed to anodic potential. Both reactions occurred very slowly at anodic potentials after the LCM samples were pre-annealed under high cathodic potential (−0.6 V). We think this was because the dissolution of the CaOx was kinetically slow on these samples, causing also a slow reoxidation of the LCM surface. The magnitude of the initial cathodic potential would affect the amount, size, and shape of the CaOx precipitates (Fig. 2b and e), and their interfacial energy with the perovskite phase. These factors might have contributed to the sluggish dissolution of the large amount of CaOx precipitates formed under −0.6 V. The magnitude of the anodic potential did not have a significant impact on the dopant re-incorporation reaction when the LCM film was pretreated under −0.15 V (Fig. 2a). This can be explained by the oxidation behavior of the LCM surface shown in Fig. 3c. The oxidation of the LCM surface becomes energetically demanding at high pO2 (blue points in Fig. 3c), and thus applying higher anodic potential than +0.3 V would not lead to further oxidation of the LCM surface. Therefore, the amount of the CaOx being re-incorporated into the perovskite phase through the oxidation reaction in eqn (3) does not change significantly with increasing the anodic potential. In contrast, the samples treated first at −0.6 V gave different final amounts of Casurf when different anodic potentials were applied. Also, the trend of the Casurf amount at different anodic potentials was inversed as time increased. We think that this is because the amount of Casurf can also be largely affected by the kinetics of the dopant re-incorporation reaction or microstructural changes in the film. The film treated under +0.9 V after −0.6 V initially showed the lowest amount of Casurf at 60 min because of the fast dopant re-incorporation reaction induced by the large anodic potential, −0.6 V → +0.9 V. However, due to the large potential change, microcracks gradually formed in this film and dopant re-incorporation reaction no longer occurred over the whole film surface. This is manifested by the nominal decrease in the dopant re-incorporation rate over time seen in Fig. 2a (brown triangles). In the LCM film treated under +0.3 V after −0.6 V (brown circles), the number of microcracks, if any, was far less, and hence, the dopant reincorporation rate was almost constant over 9 h. The LCM film treated under +0.45 V after −0.6 V (brown squares) showed intermediate behavior. Such a change of trend in the Casurf amount was not observed when −0.15 V was applied first because (1) the magnitude of the potential change was not huge (max. −0.15 V → +0.9 V) and (2) dopant re-incorporation occurred much faster within an hour before the formation microcracks, if any, gave any noticeable effects.
We have also investigated the bulk oxidation of the LCM samples initially polarized under −0.6 V, to see if it has any relation to their dopant re-incorporation reactions. In their bulk Mn spectra (Fig. S9g and h†), we observed a noticeable peak shift of around 0.2–0.3 eV upon the application of anodic potential. The amount of the shift is almost identical to the peak position difference observed between the LCM sample annealed with single polarization approach under −0.75 and that under 0.3 V (Fig. S6a†), thus meaning that the LCM bulk was fully oxidized. Also, it should be noted that the shift occurred much faster (<1 h) than both the oxidation rate of the surface O (∼9 h) and the rate of CaOx being removed. This result indicates that the bulk oxidation of these LCM samples was not related to the sluggish oxidation and dopant re-incorporation kinetics at the surface. Also, this further supports our above argument that the oxidation of the LCM surface does not undergo the typical oxidation process (eqn (2), where Mn is the redox-active species), but rather involves the reincorporation of the aliovalent dopant, Ca. If the reaction in eqn (2) had occurred at the surface, the surface oxidation should have been as fast as the bulk, and independent from the dopant incorporation rate.
Based on the results presented above, we formulated a surface defect reaction that explains dopant segregation under cathodic and re-incorporation under anodic potential:
 | (3) |
 = Ca on the La lattice site,
  = oxygen hole in the Mn 3d–O 2p band)
Eqn (3) comprises defect reactions that lanthanum manganites undergo under anodic conditions: formation of cation vacancies  and oxygen holes
  and re-incorporation of the dopant precipitates (CaOsurf) into the perovskite phase. It is derived from a linear combination of eqn (1) and (2), and modification of the redox-active species from Mn to O (eqn (S1)–(S4) in ESI†). Basically, it describes that dopant re-incorporation under anodic potential occurs by forming new perovskite unit cells that incorporate CaOx and oxygen molecules into the A and O sites and that have B-site vacancies (Fig. 4d). In this scenario, the oxidation of the LCM surface can be impeded if the dissolution kinetics of CaOsurf is slow as explained above. The formation of the B-site vacancies
  under anodic conditions is in line with a recent theoretical and computational work from our group which predicted the formation of a large amount of B-site vacancies in La0.8Sr0.2MnO3 under anodic conditions.38 In other papers, it was reported that undoped LaMnO3 contained similar amounts of A- and B-site vacancies under oxidizing conditions,44,62 and also, some other perovskites are known to exhibit B-site deficiency such as Pr0.5Sr0.5Co1−yO3 (10%)63 and Sr0.9La0.1Ti1−yO3 (6%).64 Also, we point out the redox-active species on the LCM surface in eqn (3). Mn is thought to be the redox active species in doped LaMnO3,44,65 and we have also assumed that in our previous theoretical work connecting defect reactions to surface segregation.38 This knowledge comes from bulk defect equilibria studies on the manganite system.44,65 From the XAS measurements, we found that Mn is indeed redox-active in the bulk, but at the surface it is the lattice oxygen that was redox-active.
Lastly, we investigated if dopant re-incorporation under anodic conditions can occur not only by applying anodic potential, but also by exposing the LCM surface to oxidizing gas environment. First, we observed that a significant amount of Casurf is formed at the LCM surface after annealing it in 5% H2/N2 (reducing condition) for 1 h (Fig. S10†). This matches well with the above result in Fig. 2 that Ca segregation is induced under cathodic potential. To test dopant re-incorporation under oxidizing environment, we annealed another LCM film in 5% H2/N2 for 1 h, switched the gas to synthetic air, and annealed it additionally for 3 h. As a result, this sample showed a significantly reduced amount of Casurf compared to the one annealed only in H2. This result clearly shows that dopant re-incorporation can also occur chemically at oxidizing conditions, and its applicability is not limited to the electrochemically anodic conditions.
Activation of the LCM surface under anodic potential
We then investigated if the removal of CaOx by reversing dopant segregation under anodic potential activates the oxygen exchange kinetics on the LCM surface. For this, we performed electrochemical impedance spectroscopy (EIS) measurements on LCM films under the same experimental conditions as described above in Fig. 2 and 4. Black dashed lines in Fig. 5a and b are the EIS spectra of the as-prepared LCM film under 0 V which comprise two semicircles with the peak frequencies of 6 and 1000 Hz. Based on the previous EIS studies on LSM, the low-frequency arc is attributed to the oxygen exchange reaction at the surface (O2,gas + 4e− ↔ 2O2−oxide) and the high frequency arc is attributed to the oxygen ion transport processes along the grain boundaries and/or bulk.36,39,41,66–68 After cathodic potentials (−0.15 or −0.6 V) are applied to the LCM film, its total impedance measured under 0 V grows gradually over time as can be seen in Fig. S11a.† This result coincides well with the XPS and SEM results in Fig. 2a, b and e, showing the formation of insulating CaOx after applying cathodic potential; CaOx layers at the surface blocks the active site for surface oxygen exchange reactions and increases the impedance of the sample. After applying cathodic potential for 1 h, anodic potential was then applied to remove the CaOx and the impedance of the cell was measured over time consistently under 0 V. Fig. 5a and b (blue dashed lines) show that the impedances of both samples, initially annealed under −0.15 and −0.6 V, decrease as CaOx is removed under anodic potential. This clearly indicates that applying anodic potential recovers the degraded oxygen exchange activity of the LCM surface under cathodic potential.The polarization resistance of the LCM films (Z, difference between the low- and high-frequency intercepts of the semicircles) was normalized by their initial polarization resistance before applying any potentials (Z0) and the resulting Znorm (= Z/Z0) was plotted with respect to the time duration of anodic potential (pink and brown data points in Fig. 6). In the case of the samples annealed initially under −0.15 V (pink data points), Znorm sharply decrease close to unity (the impedance of LCM before applying any potentials) within a few minutes after applying anodic potentials. Interestingly, even after a prolonged time period of degradation process (10 h), applying anodic potential recovered 50% of the LCM's initial oxygen exchange activity just in a few minutes (Fig. S12†). On the other hand, for the samples initially polarized under −0.6 V (brown data points), Znorm decrease in a far slower rate under anodic potential than those polarized under −0.15 V, and they do not fully recover their initial impedance even after 10 h. Such difference observed in the two sets of the LCM samples matches very well with the different rates of dopant re-incorporation shown in Fig. 2a. For easier comparison, the plots in Fig. 2a are overlapped with Znorm in Fig. 6 (thick solid lines, y-axis on the right). The conformity between the temporal changes of Znorm and Casurf clearly indicates that the removal of CaOx under anodic potential leads to the activation of the oxygen kinetics in LCM.
Lastly, we investigated the reversibility of the passivation and activation processes by the formation and removal of CaOx layers, respectively. Four to five potential cycles under −0.15 V ↔ +0.9 V, −0.15 V ↔ +0.3 V, and −0.6 V ↔ +0.3 V were applied to LCM films and the resulting EIS spectra are given in Fig. S13.† In all cases, the impedance changes were reversible in terms of both the shape and magnitude of the EIS spectra. However, when the change of potential was large, e.g., −0.6 V ↔ +0.9 V, the EIS spectrum became irreversible. Fig. S14† shows the irreversible changes of EIS spectrum after finishing the first potential cycle of −0.6 V (1 h) ↔ +0.9 V (10 h). According to the previous studies on LSM thin films, microcracks or holes can form under high anodic potential because of the high effective pO2 applied to the film, and this can lead to the decrease in the impedance of the film as the cracks or holes serve as additional surface and diffusion pathways.5,36,69 Likewise, we could also observe the formation of microcracks or delamination of the LCM films (Fig. S15†) after undergoing a large potential change from −0.6 V to +0.45 V or +0.9 V.
Comparison to Sr-substituted LaMnO3
Though LCM was used as a primary model system in this work, it is important to investigate whether the results can be transferred to LSM which is much more widely used as the air electrode in SOFC/EC cells. To this end, we investigated the dopant segregation and re-incorporation behaviors of LSM in a similar way that we did above for LCM in Fig. 1b. Again, LSM thin-film samples were annealed at 770 °C in 1 atm O2 for 1 h under a wide range of potentials by using the lateral polarization method; −0.45, −0.3, −0.15, +0.3, +0.6, and +0.9 V. XPS core-level spectra of Sr, specifically Sr 3d, were deconvoluted into the surface (Srsurf, red envelops in Fig. S16†) and lattice components (Srlatt) to quantify the surface SrOx-like phase which was formed as a result of dopant segregation. The amount of Srsurf was then divided by the total A-site cations and the resulting Srsurf/(La + Sr) was normalized by the Srsurf/(La + Sr) of the as-prepared LSM sample. The resulting {Srsurf/(La + Sr)}norm are plotted with respect to the applied local potential in Fig. 7a (open circles). The resulting segregation behavior of LSM is consistent with our previous results;34 dopant segregation occurs also under anodic potential when the dopant size is larger than the host cation, La (RCa ≈ RLa < RSr), and hence the dopant has a high Eela. In order to examine the dopant re-incorporation in LSM, another set of samples were annealed with the two-step polarization approach. The same potentials as above, from −0.45 to +0.9 V, were first applied for 1 h, followed by application of 0.0 to +0.2 V for another hour. This value of anodic potential corresponds to the minimum of the Sr segregation graph in Fig. 7a. The resulting {Srsurf/(La + Sr)}norm were again quantified by XPS (Fig. S16†) and plotted together with the data points in (a) (Fig. 7b, triangles). Notably, applying 0.0 to +0.2 V could remove the dopant segregation in LSM induced under both high cathodic and anodic potentials (dashed arrows in Fig. 7b). The XPS results were further supported by SEM measurements on the LSM films (Fig. S17 and S18†); surface particles, assumed as SrOx, are removed after annealing under 0.0 to +0.2 V. The observed two different types of segregation (cathodic and anodic) and re-incorporation at 0 to +0.2 V, might explain the contradicting segregation behaviors of LSM reported in the literature; Sr segregation under both cathodic and anodic potential, and Sr re-incorporation under both anodic and cathodic potential. We also performed similar experiments with La0.8Ba0.2MnO3 (LBM) and showed that Ba segregation on LBM could also be removed under ‘relatively’ anodic potential (Fig. S19†). The results from LSM and LBM were reproducible with conventional polarization method as well (Fig. S20 and S21†).The two different types of dopant segregation/precipitation and re-incorporation on LSM shown in Fig. 7 can be explained by the defect reactions in eqn (1) and (3), which become predominant at different potential regimes. In the anodic-potential regime (+0.2 to +0.8 V), SrOx precipitation and re-incorporation can be explained by the defect reaction in eqn (1). When high anodic potential is applied (oxidizing conditions), the formation of SrOx is promoted according to the backward reaction of eqn (1) (positive-slope branch of the segregation graph in Fig. 7a). When ‘small anodic, and relatively cathodic’ potential (0 to +0.2 V) is applied thereafter, dopant re-incorporation reaction occurs as explained by the forward reaction of eqn (1) (Fig. 7b). On the other hand, in the strongly cathodic-potential regime (−0.45 to +0.2 V), the defect reaction in eqn (3) becomes predominant. When high cathodic potential is applied (reducing conditions), the formation of SrOx is promoted according to the backward reaction of eqn (3) (negative-slope branch of the segregation graph in Fig. 7a). When low anodic potential (0 to +0.2 V) is applied thereafter, dopant re-incorporation reaction occurs as explained by the forward reaction of eqn (3) (Fig. 7b). In our previous studies,19,34 we used the electrostatic and elastic energy of dopant to explain the predominant driving force of the dopant segregation under reducing and oxidizing conditions. However, these energy-based drivers of segregation rather limit us to the ‘enrichment’ of the dopant at/near the surface, and does not account for how dopant oxide ‘precipitation’ and redissolution can occur. Here, we show that we must consider the predominant defect reactions (eqn (1) and (3)) in the reducing and oxidizing regimes to account for dopant oxide phase precipitation and redissolution, as seen on LCM and LSM.
Summary
In summary, we established that the mechanism of the dopant re-incorporation at a doped manganite surface under anodic potential involves the dominant defect equilibria at highly oxidizing conditions. Based on XPS and XAS results and by taking LCM as a model system, we have shown that the dopant re-incorporation reaction on LCM is coupled with its surface oxidation by creating B-site cation-deficient perovskite unit cells under high-pO2 conditions. In addition, oxidation of the LCM surface was mediated by the redox-active surface oxygen anions rather than the surface Mn cations. The EIS experiments showed that applying anodic potential improved the oxygen exchange kinetics of LCM in a short time (<5 min) as it removed the insulating CaOx at the surface. We also showed that the results from LCM can be transferred to LSM which is one of the state-of-the-art air electrodes in SOF/EC. Importantly, the new defect reaction proposed in this paper reconciles the contradicting experimental results on dopant segregation and re-incorporation reactions in the literature. We believe that this anodic activation pathway of lanthanum manganites would be applicable to other perovskite oxides which also exhibit a large cation deficiency under oxidizing conditions.70 Our findings indicate that operating perovskite oxides in a reversible solid oxide cell5 would be advantageous in achieving their long-term stability by periodically removing dopant segregation under alternating polarizations.Author contributions
D. K. and B. Y. conceived the original ideas. D. K. and B. Y. designed the research. D. K. performed all the experiments. A. H. and I. W. helped the beamline experiments at beamline 23-ID-2 of the National Synchrotron Light Source II in BNL. D. K. wrote the manuscript with contributions from all authors.Conflicts of interest
There are no conflicts of interest to declare.Acknowledgements
D. K. acknowledges support from the MIT Energy Initiative and Exxon Mobil for a graduate student fellowship. This work made use of the MRSEC Shared Experimental Facilities at MIT, supported by the National Science Foundation under award number DMR-1419807. This research used resources (IOS/23-ID-2 beamline) of the National Synchrotron Light Source II, a U.S. Department of Energy (DOE) Office of Science User Facility operated for the DOE Office of Science by Brookhaven National Laboratory under Contract No. DE-SC0012704.References
- S. C. Singhal, Advances in solid oxide fuel cell technology, Solid State Ionics, 2000, 135(1–4), 305–313 CrossRef CAS.
- S. C. Singhal and K. Kendall, High-temperature solid oxide fuel cells: fundamentals, design and applications, Elsevier, 2003 Search PubMed.
- R. J. Gorte and J. M. Vohs, Catalysis in Solid Oxide Fuel Cells, Annu. Rev. Chem. Biomol. Eng., 2011, 2(1), 9–30 CrossRef CAS PubMed.
- M. M. Kuklja, E. A. Kotomin, R. Merkle, Y. A. Mastrikov and J. Maier, Combined theoretical and experimental analysis of processes determining cathode performance in solid oxide fuel cells, Phys. Chem. Chem. Phys., 2013, 15(15), 5443–5471 RSC.
- C. Graves, S. D. Ebbesen, S. H. Jensen, S. B. Simonsen and M. B. Mogensen, Eliminating degradation in solid oxide electrochemical cells by reversible operation, Nat. Mater., 2015, 14(2), 239–244 CrossRef CAS PubMed.
- Y. Chen, Y. Chen, D. Ding, Y. Ding, Y. Choi, L. Zhang, S. Yoo, D. Chen, B. deGlee, H. Xu, Q. Lu, B. Zhao, G. Vardar, J. Wang, H. Bluhm, E. J. Crumlin, C. Yang, J. Liu, B. Yildiz and M. Liu, A robust and active hybrid catalyst for facile oxygen reduction in solid oxide fuel cells, Energy Environ. Sci., 2017, 10(4), 964–971 RSC.
- D. R. Barcellos, M. D. Sanders, J. Tong, A. H. McDaniel and R. P. O'Hayre, BaCe0.25Mn0.75O3−δ—a promising perovskite-type oxide for solar thermochemical hydrogen production, Energy Environ. Sci., 2018, 11(11), 3256–3265 RSC.
- A. H. McDaniel, E. C. Miller, D. Arifin, A. Ambrosini, E. N. Coker, R. O'Hayre, W. C. Chueh and J. Tong, Sr- and Mn-doped LaAlO3−δ for solar thermochemical H2 and CO production, Energy Environ. Sci., 2013, 6(8), 2424 RSC.
- Y. Kim, S. J. Jeong, B. Koo, S. Lee, N. W. Kwak and W. Jung, Study of the surface reaction kinetics of (La,Sr)MnO3−δ oxygen carriers for solar thermochemical fuel production, J. Mater. Chem. A, 2018, 6(27), 13082–13089 RSC.
- M. A. Habib, M. Nemitallah and R. Ben-Mansour, Recent Development in Oxy-Combustion Technology and Its Applications to Gas Turbine Combustors and ITM Reactors, Energy Fuels, 2012, 27(1), 2–19 CrossRef.
- S. P. Jiang, Activation, microstructure, and polarization of solid oxide fuel cell cathodes, J. Solid State Electrochem., 2005, 11(1), 93–102 CrossRef.
- S. P. Jiang, Development of lanthanum strontium manganite perovskite cathode materials of solid oxide fuel cells: a review, J. Mater. Sci., 2008, 43(21), 6799–6833 CrossRef CAS.
- W. Wang and S. Jiang, A mechanistic study on the activation process of (La, Sr)MnO3 electrodes of solid oxide fuel cells, Solid State Ionics, 2006, 177(15–16), 1361–1369 CrossRef CAS.
- T. T. Fister, D. D. Fong, J. A. Eastman, P. M. Baldo, M. J. Highland, P. H. Fuoss, K. R. Balasubramaniam, J. C. Meador and P. A. Salvador, In situ characterization of strontium surface segregation in epitaxial La0.7Sr0.3MnO3 thin films as a function of oxygen partial pressure, Appl. Phys. Lett., 2008, 93(15), 151904 CrossRef.
- H. Kwon, W. Lee and J. W. Han, Suppressing cation segregation on lanthanum-based perovskite oxides to enhance the stability of solid oxide fuel cell cathodes, RSC Adv., 2016, 6(74), 69782–69789 RSC.
- M. Zhi, G. Zhou, Z. Hong, J. Wang, R. Gemmen, K. Gerdes, A. Manivannan, D. Ma and N. Wu, Single crystalline La0.5Sr0.5MnO3microcubes as cathode of solid oxidefuel cell, Energy Environ. Sci., 2011, 4(1), 139–144 RSC.
- A. K. Opitz, C. Rameshan, M. Kubicek, G. M. Rupp, A. Nenning, T. Götsch, R. Blume, M. Hävecker, A. Knop-Gericke, G. Rupprechter, B. Klötzer and J. Fleig, The Chemical Evolution of the La0.6Sr0.4CoO3−δ Surface Under SOFC Operating Conditions and Its Implications for Electrochemical Oxygen Exchange Activity, Top. Catal., 2018, 61(20), 2129–2141 CrossRef CAS PubMed.
- F. Pişkin, R. Bliem and B. Yildiz, Effect of crystal orientation on the segregation of aliovalent dopants at the surface of La0.6Sr0.4CoO3, J. Mater. Chem. A, 2018, 6(29), 14136–14145 RSC.
- N. Tsvetkov, Q. Lu, L. Sun, E. J. Crumlin and B. Yildiz, Improved chemical and electrochemical stability of perovskite oxides with less reducible cations at the surface, Nat. Mater., 2016, 15(9), 1010–1016 CrossRef CAS PubMed.
- E. Mutoro, E. J. Crumlin, H. Pöpke, B. Luerssen, M. Amati, M. K. Abyaneh, M. D. Biegalski, H. M. Christen, L. Gregoratti, J. Janek and Y. Shao-Horn, Reversible Compositional Control of Oxide Surfaces by Electrochemical Potentials, J. Phys. Chem. Lett., 2011, 3(1), 40–44 CrossRef.
- Z. Cai, M. Kubicek, J. Fleig and B. Yildiz, Chemical Heterogeneities on La0.6Sr0.4CoO3−δ Thin Films—Correlations to Cathode Surface Activity and Stability, Chem. Mater., 2012, 24(6), 1116–1127 CrossRef CAS.
- E. J. Crumlin, E. Mutoro, Z. Liu, M. E. Grass, M. D. Biegalski, Y.-L. Lee, D. Morgan, H. M. Christen, H. Bluhm and Y. Shao-Horn, Surface strontium enrichment on highly active perovskites for oxygen electrocatalysis in solid oxide fuel cells, Energy Environ. Sci., 2012, 5(3), 6081 RSC.
- S. P. Jiang, Development of lanthanum strontium cobalt ferrite perovskite electrodes of solid oxide fuel cells – A review, Int. J. Hydrogen Energy, 2019, 44(14), 7448–7493 CrossRef CAS.
- N. Ai, S. He, N. Li, Q. Zhang, W. D. A. Rickard, K. Chen, T. Zhang and S. P. Jiang, Suppressed Sr segregation and performance of directly assembled La0.6Sr0.4Co0.2Fe0.8O3-δ oxygen electrode on Y2O3-ZrO2 electrolyte of solid oxide electrolysis cells, J. Power Sources, 2018, 384, 125–135 CrossRef CAS.
- J. Laurencin, M. Hubert, D. F. Sanchez, S. Pylypko, M. Morales, A. Morata, B. Morel, D. Montinaro, F. Lefebvre-Joud and E. Siebert, Degradation mechanism of La0.6Sr0.4Co0.2Fe0.8O3-δ/Gd0.1Ce0.9O2-δ composite electrode operated under solid oxide electrolysis and fuel cell conditions, Electrochim. Acta, 2017, 241, 459–476 CrossRef CAS.
- M. Niania, R. Podor, T. B. Britton, C. Li, S. J. Cooper, N. Svetkov, S. Skinner and J. Kilner, In situ study of strontium segregation in La0.6Sr0.4Co0.2Fe0.8O3−δ in ambient atmospheres using high-temperature environmental scanning electron microscopy, J. Mater. Chem. A, 2018, 6(29), 14120–14135 RSC.
- J. Druce, H. Téllez, M. Burriel, M. D. Sharp, L. J. Fawcett, S. N. Cook, D. S. McPhail, T. Ishihara, H. H. Brongersma and J. A. Kilner, Surface termination and subsurface restructuring of perovskite-based solid oxide electrode materials, Energy Environ. Sci., 2014, 7(11), 3593–3599 RSC.
- Y. Chen, W. Jung, Z. Cai, J. J. Kim, H. L. Tuller and B. Yildiz, Impact of Sr segregation on the electronic structure and oxygen reduction activity of SrTi1−xFexO3 surfaces, Energy Environ. Sci., 2012, 5(7), 7979 RSC.
- W. Jung and H. L. Tuller, Investigation of surface Sr segregation in model thin film solid oxidefuel cell perovskite electrodes, Energy Environ. Sci., 2012, 5(1), 5370–5378 RSC.
- S.-L. Zhang, H. Wang, M. Y. Lu, A.-P. Zhang, L. V. Mogni, Q. Liu, C.-X. Li, C.-J. Li and S. A. Barnett, Cobalt-substituted SrTi0.3Fe0.7O3−δ: a stable high-performance oxygen electrode material for intermediate-temperature solid oxide electrochemical cells, Energy Environ. Sci., 2018, 11(7), 1870–1879 RSC.
- J. Liu, J. K. Kim, Y. Wang, H. Kim, A. Belotti, B. Koo, Z. Wang, W. Jung and F. Ciucci, Understanding and mitigating A-site surface enrichment in Ba-containing perovskites: a combined computational and experimental study of BaFeO3, Energy Environ. Sci., 2022, 4069–4082 RSC.
- A. Chroneos, B. Yildiz, A. Tarancón, D. Parfitt and J. A. Kilner, Oxygen diffusion in solid oxide fuel cell cathode and electrolyte materials: mechanistic insights from atomistic simulations, Energy Environ. Sci., 2011, 4(8), 2774 RSC.
- W. Lee, J. W. Han, Y. Chen, Z. Cai and B. Yildiz, Cation size mismatch and charge interactions drive dopant segregation at the surfaces of manganite perovskites, J. Am. Chem. Soc., 2013, 135(21), 7909–7925 CrossRef CAS PubMed.
- D. Kim, R. Bliem, F. Hess, J. J. Gallet and B. Yildiz, Electrochemical Polarization Dependence of the Elastic and Electrostatic Driving Forces to Aliovalent Dopant Segregation on LaMnO3, J. Am. Chem. Soc., 2020, 142(7), 3548–3563 CrossRef CAS PubMed.
- E. J. Crumlin, E. Mutoro, W. T. Hong, M. D. Biegalski, H. M. Christen, Z. Liu, H. Bluhm and Y. Shao-Horn, In Situ Ambient Pressure X-ray Photoelectron Spectroscopy of Cobalt Perovskite Surfaces under Cathodic Polarization at High Temperatures, J. Phys. Chem. C, 2013, 117(31), 16087–16094 CrossRef CAS.
- A.-K. Huber, M. Falk, M. Rohnke, B. Luerssen, M. Amati, L. Gregoratti, D. Hesse and J. Janek, In situ study of activation and de-activation of LSM fuel cell cathodes – Electrochemistry and surface analysis of thin-film electrodes, J. Catal., 2012, 294, 79–88 CrossRef CAS.
- R. Bliem, D. Kim, J. Wang, E. J. Crumlin and B. Yildiz, Hf Deposition Stabilizes the Surface Chemistry of Perovskite Manganite Oxide, J. Phys. Chem. C, 2021, 125(6), 3346–3354 CrossRef CAS PubMed.
- F. Hess and B. Yildiz, Precipitation of dopants on acceptor-doped LaMnO3±δ revealed by defect chemistry from first principles, J. Chem. Phys., 2021, 154(6), 064702 CrossRef CAS PubMed.
- A. K. Huber, M. Falk, M. Rohnke, B. Luerssen, L. Gregoratti, M. Amati and J. Janek, In situ study of electrochemical activation and surface segregation of the SOFC electrode material La0.75Sr0.25Cr0.5Mn0.5O(3+/-delta), Phys. Chem. Chem. Phys., 2012, 14(2), 751–758 RSC.
- M. Liang, B. Yu, M. Wen, J. Chen, J. Xu and Y. Zhai, Preparation of LSM–YSZ composite powder for anode of solid oxide electrolysis cell and its activation mechanism, J. Power Sources, 2009, 190(2), 341–345 CrossRef CAS.
- G. J. la O', R. F. Savinell and Y. Shao-Horn, Activity Enhancement of Dense Strontium-Doped Lanthanum Manganite Thin Films under Cathodic Polarization: A Combined AES and XPS Study, J. Electrochem. Soc., 2009, 156(6), B771 CrossRef.
- N. Caillol, M. Pijolat and E. Siebert, Investigation of chemisorbed oxygen, surface segregation and effect of post-treatments on La0.8Sr0.2MnO3 powder and screen-printed layers for solid oxide fuel cell cathodes, Appl. Surf. Sci., 2007, 253(10), 4641–4648 CrossRef CAS.
- J. Mizusaki, N. Mori, H. Takai, Y. Yonemura, H. Minamiue, H. Tagawa, M. Dokiya, H. Inaba, K. Naraya, T. Sasamoto and T. Hashimoto, Oxygen nonstoichiometry and defect equilibrium in the perovskite-type oxides La1−xSrxMnO3+d, Solid State Ionics, 2000, 129(1), 163–177 CrossRef CAS.
- S. Darvish, H. Sabarou, S. K. Saxena and Y. Zhong, Quantitative Defect Chemistry Analysis and Electronic Conductivity Prediction of La0.8Sr0.2MnO3±δPerovskite, J. Electrochem. Soc., 2015, 162(9), E134–E140 CrossRef CAS.
- M. Kubicek, A. Limbeck, T. Frömling, H. Hutter and J. r. Fleig, Relationship between Cation Segregation and the Electrochemical Oxygen Reduction Kinetics of La0.6Sr0.4CoO3−δ Thin Film Electrodes, J. Electrochem. Soc., 2011, 158(6), B727 CrossRef CAS.
- NIST Database 71, U.S. Department of Commerce, Washington, D.C., 2001, accessed in 2017/2018 Search PubMed.
- Values acquired from the KolXPD spectrum fitting program.
- T. M. Huber, E. Navickas, K. Sasaki, B. Yildiz, H. Tuller, G. Friedbacher, H. Hutter and J. Fleig, Experimental Design for Voltage Driven Tracer Incorporation and Diffusion Studies on Oxide Thin Film Electrodes, J. Electrochem. Soc., 2017, 164(7), F809–F814 CrossRef CAS.
- M. Abbate, F. M. F. de Groot, J. C. Fuggle, A. Fujimori, O. Strebel, F. Lopez, M. Domke, G. Kaindl, G. A. Sawatzky, M. Takano, Y. Takeda, H. Eisaki and S. Uchida, Controlled-valence properties ofLa1−xSrxFeO3andLa1−xSrxMnO3studied by soft-x-ray absorption spectroscopy, Phys. Rev. B: Condens. Matter Mater. Phys., 1992, 46(8), 4511–4519 CrossRef CAS PubMed.
- D. N. Mueller, M. L. Machala, H. Bluhm and W. C. Chueh, Redox activity of surface oxygen anions in oxygen-deficient perovskite oxides during electrochemical reactions, Nat. Commun., 2015, 6, 6097 CrossRef CAS PubMed.
- W. T. Hong, K. A. Stoerzinger, Y.-L. Lee, L. Giordano, A. Grimaud, A. M. Johnson, J. Hwang, E. J. Crumlin, W. Yang and Y. Shao-Horn, Charge-transfer-energy-dependent oxygen evolution reaction mechanisms for perovskite oxides, Energy Environ. Sci., 2017, 10(10), 2190–2200 RSC.
- B. Gilbert, B. H. Frazer, A. Belz, P. G. Conrad, K. H. Nealson, D. Haskel, J. C. Lang, G. Srajer and G. De Stasio, Multiple Scattering Calculations of Bonding and X-ray Absorption Spectroscopy of Manganese Oxides, J. Phys. Chem. A, 2003, 107(16), 2839–2847 CrossRef CAS.
- S.-i. Nakai, T. Mitsuishi, H. Sugawara, H. Maezawa, T. Matsukawa, S. Mitani, K. Yamasaki and T. Fujikawa, OxygenKx-ray-absorption near-edge structure of alkaline-earth-metal and 3d-transition-metal oxides, Phys. Rev. B: Condens. Matter Mater. Phys., 1987, 36(17), 9241–9246 CrossRef CAS PubMed.
- J.-Y. Liu, W.-N. Su, J. Rick, S.-C. Yang, C.-J. Pan, J.-F. Lee, J.-M. Chen and B.-J. Hwang, Rational design of ethanol steam reforming catalyst based on analysis of Ni/La2O3 metal–support interactions, Catal. Sci. Technol., 2016, 6(10), 3449–3456 RSC.
- K. S. Holliday, T. A. Kohlgruber, I. C. Tran, D. Åberg, Z. M. Seeley, M. Bagge-Hansen, A. M. Srivastava, N. J. Cherepy and S. A. Payne, Increased fluorescence intensity in CaTiO3:Pr3+ phosphor due to NH3 treatment and Nb Co-doping, Opt. Mater., 2016, 60, 359–365 CrossRef CAS.
- R. T. DeVol, R. A. Metzler, L. Kabalah-Amitai, B. Pokroy, Y. Politi, A. Gal, L. Addadi, S. Weiner, A. Fernandez-Martinez, R. Demichelis, J. D. Gale, J. Ihli, F. C. Meldrum, A. Z. Blonsky, C. E. Killian, C. B. Salling, A. T. Young, M. A. Marcus, A. Scholl, A. Doran, C. Jenkins, H. A. Bechtel and P. U. Gilbert, Oxygen spectroscopy and polarization-dependent imaging contrast (PIC)-mapping of calcium carbonate minerals and biominerals, J. Phys. Chem. B, 2014, 118(28), 8449–8457 CrossRef CAS PubMed.
- J. Suntivich, W. T. Hong, Y.-L. Lee, J. M. Rondinelli, W. Yang, J. B. Goodenough, B. Dabrowski, J. W. Freeland and Y. Shao-Horn, Estimating Hybridization of Transition Metal and Oxygen States in Perovskites from O K-edge X-ray Absorption Spectroscopy, J. Phys. Chem. C, 2014, 118(4), 1856–1863 CrossRef CAS.
- J. Suntivich, H. A. Gasteiger, N. Yabuuchi, H. Nakanishi, J. B. Goodenough and Y. Shao-Horn, Design principles for oxygen-reduction activity on perovskite oxide catalysts for fuel cells and metal-air batteries, Nat. Chem., 2011, 3(7), 546–550 CrossRef CAS PubMed.
- Y.-L. Lee, J. Kleis, J. Rossmeisl, Y. Shao-Horn and D. Morgan, Prediction of solid oxide fuel cell cathode activity with first-principles descriptors, Energy Environ. Sci., 2011, 4(10), 3966 RSC.
- Y.-L. Lee and D. Morgan, Prediction of Surface Oxygen Vacancy Concentrations of (La1-xSrx)MnO3, ECS Trans., 2009, 25(2), 2769–2774 CrossRef CAS.
- M. A. R. Niania, A. K. Rossall, J. A. Van den Berg and J. A. Kilner, The effect of sub-surface strontium depletion on oxygen diffusion in La0.6Sr0.4Co0.2Fe0.8O3−δ, J. Mater. Chem. A, 2020, 8(37), 19414–19424 RSC.
- J. A. M. Van Roosmalen, E. H. P. Cordfunke, R. B. Helmholdt and H. W. Zandbergen, The Defect Chemistry of LaMnO3±δ: 2. Structural Aspects of LaMnO3+δ, J. Solid State Chem., 1994, 110(1), 100–105 CrossRef CAS.
- L. Zhang, S. Li, T. Xia, L. Sun, L. Huo and H. Zhao, Co-deficient PrBaCo2−xO6−δ perovskites as cathode materials for intermediate-temperature solid oxide fuel cells: Enhanced electrochemical performance and oxygen reduction kinetics, Int. J. Hydrogen Energy, 2018, 43(7), 3761–3775 CrossRef CAS.
- M. Mori, Z. Wang, T. Itoh, S. Yabui, K.-i. Murai and T. Moriga, A-Site and B-Site Non-stoichiometry and Sintering Characteristics of (Sr1−xLax)1−yTi1−zO3 Perovskites, J. Fuel Cell Sci. Technol., 2011, 8(5), 051014–051017 CrossRef.
- Y. L. Lee and D. Morgan, Ab initio and empirical defect modeling of LaMnO(3+/-delta) for solid oxide fuel cell cathodes, Phys. Chem. Chem. Phys., 2012, 14(1), 290–302 RSC.
- A. M. Saranya, D. Pla, A. Morata, A. Cavallaro, J. Canales-Vázquez, J. A. Kilner, M. Burriel and A. Tarancón, Engineering Mixed Ionic Electronic Conduction in La0.8Sr0.2MnO3+δNanostructures through Fast Grain Boundary Oxygen Diffusivity, Adv. Energy Mater., 2015, 5(11), 1500377 CrossRef.
- T. M. Huber, E. Navickas, G. Friedbacher, H. Hutter and J. Fleig, Apparent Oxygen Uphill Diffusion in La0.8Sr0.2MnO3 Thin Films upon Cathodic Polarization, ChemElectroChem, 2015, 2(10), 1487–1494 CrossRef CAS PubMed.
- C. Zhao, Y. Li, W. Zhang, Y. Zheng, X. Lou, B. Yu, J. Chen, Y. Chen, M. Liu and J. Wang, Heterointerface engineering for enhancing the electrochemical performance of solid oxide cells, Energy Environ. Sci., 2020, 13(1), 53–85 RSC.
- V. Brichzin, J. Fleig, H. U. Habermeier, G. Cristiani and J. Maier, The geometry dependence of the polarization resistance of Sr-doped LaMnO3 microelectrodes on yttria-stabilized zirconia, Solid State Ionics, 2002, 152–153, 499–507 CrossRef CAS.
- M. A. Peña and J. L. G. Fierro, Chemical Structures and Performance of Perovskite Oxides, Chem. Rev., 2001, 101(7), 1981–2018 CrossRef PubMed.
Footnotes |
| † Electronic supplementary information (ESI) available. See DOI: https://doi.org/10.1039/d2ta09118f |
| ‡ Present address: University of Toronto, Toronto, ON M5S, Canada. |
| This journal is © The Royal Society of Chemistry 2023 |