Synthesis of platinum nanoparticles on strontium titanate nanocuboids via surface organometallic grafting for the catalytic hydrogenolysis of plastic waste†
Katherine E.
McCullough
 a,
Ian L.
Peczak
b,
Robert M.
Kennedy
 ab,
Yi-Yu
Wang
c,
James
Lin
d,
Xun
Wu
 cd,
Alexander L.
Paterson‡
d,
Frédéric A.
Perras
 d,
Jacklyn
Hall
a,
A. Jeremy
Kropf
 a,
Ryan A.
Hackler
a,
Youngho
Shin
e,
Jens
Niklas
a,
Ryan A.
Hackler
a,
Youngho
Shin
e,
Jens
Niklas
 a,
Oleg G.
Poluektov
 a,
Jianguo
Wen
 *f,
Wenyu
Huang
 *cd,
Aaron D.
Sadow
 *cd,
Kenneth R.
Poeppelmeier
*b,
Massimiliano
Delferro
 *ag and
Magali S.
Ferrandon
*a
aChemical Sciences and Engineering Division, Argonne National Laboratory, Lemont, Illinois 60439, USA. E-mail: delferro@anl.gov; ferrandon@anl.gov
bDepartment of Chemistry, Northwestern University, Evanston, Illinois 60208, USA. E-mail: krp@northwestern.edu
cDepartment of Chemistry, Iowa State University, Ames, Iowa 50011, USA. E-mail: whuang@iastate.edu; sadow@iastate.edu
dU.S. DOE Ames National Laboratory, Ames, Iowa 50011, USA
eApplied Materials Division, Argonne National Laboratory, Lemont, Illinois 60439, USA. E-mail: jwen@anl.gov
fCenter for Nanoscale Materials, Argonne National Laboratory, Lemont, Illinois 60439, USA
gPritzker School of Molecular Engineering, University of Chicago, Chicago, Illinois 60637, USA
First published on 12th December 2022
Abstract
Pt/SrTiO3 (Pt/STO), prepared on small scale by atomic layer deposition (ALD), is a capable heterogeneous catalyst for the selective hydrogenolysis of polyolefins to hydrocarbon oils, providing a promising approach for upcycling plastic waste. However, because deposition by ALD is costly and resource-intensive, a new synthesis of Pt/STO is needed to effectively scale catalyst production and pursue the commercialization of upcycling processes. To that effect, this work details a scalable deposition method for Pt/STO made by surface organometallic chemistry (SOMC) techniques using Pt(II) acetylacetonate or and trimethyl(methylcyclopentadienyl)platinum. The STO support was calcined (550 °C), treated with ozone (200 °C), and finally steamed (200 °C) to afford a clean STO surface populated with only hydroxyl groups. Pt precursors were dissolved in toluene and deposited onto STO. After reduction at 300 °C, the STO support was decorated with 1.0–1.5 nm Pt nanoparticles. The size and loading of these nanoparticles were varied by employing a multi-cycle deposition and oxidation and/or reduction process designed to ALD techniques. These Pt/STO catalysts hydrogenolyzed isotactic polypropylene into liquid products (>95% yield) with average molecular weights of 200–300 Da (∼25 carbon atoms) and narrow size distributions at 300 °C and 180 psi H2.
Introduction
Single-use plastics constitute an important cornerstone of the current chemical economy because of their wide-ranging use in many critical industrial sectors. As many as 400 million metric tons of plastics are produced globally each year to meet consumer needs in textiles, medical and construction equipment, and food and beverage products, among other uses.1–6 Modern society lacks the infrastructure to process post-consumer plastics efficiently and economically, meaning that up to 80% of these products are discarded to landfills. A minority of plastic waste is downcycled, via traditional mechanical recycling, which prevents recovery of their inherent chemical value.4,5 While several chemical recycling approaches have been proposed, there are barriers to their broad implementation at scale. For example, pyrolysis, a high-temperature (∼500 °C) decomposition process in an oxygen-free environment, can successfully break down plastics at various industrial scales but it (1) is inherently unselective and tends to afford wide product distributions, and (2) the value of these products is intimately related to the current price of crude oil, which limits the process' economic upside.7–10 Overall, developing an economically viable method for chemical recycling will require a process that selectively creates value-added products across a wide range of starting plastics. Ideally, these chemical upcycling techniques should simultaneously recoup the inherent chemical value built into single-use plastics and create a uniform product that can meet a particular commercial need.At the laboratory scale, a promising upcycling technology is catalytic hydrogenolysis, in which waste polyolefins are selectively converted into liquid and wax-like products using metal nanoparticle catalysts deposited on a metal oxide support.11–19 We have previously reported such a system in which platinum (Pt) on SrTiO3 nanocuboid (STO; Pt/STO) catalysts convert various high-density polyethylene, low-density polyethylene, polypropylene, and waste plastic streams into highly uniform liquid and waxlike lubricant products with 60–80 carbon atom backbones.18–21 Recent efforts to model a conceptual pilot plant for this process have shown that Pt/STO upcycling at a scale of 250 Mt day−1 could profitably generate lubricant materials while reducing process emissions relative to current industrial methods.22 These results incentivize further study of Pt/STO upcycling, part of which involves scale-up of Pt/STO catalyst synthesis to the kilogram and ton scales. STO nanocuboids have also previously been investigated as a model catalyst support, and as a bridge between templates for surface science studies and performance-oriented, high surface area supports, and the work developed here may also affect innovation of other M/STO catalyzed processes.18,19,23–26
Scaling up the Pt/STO synthesis will require establishing new procedures for support synthesis and Pt deposition. We have previously explored such methods for the scale-up of the STO synthesis, demonstrating that 20+ g of support can be synthesized in a 4 L batch reactor without significant changes to support physical properties nor impact on products of hydrogenolysis when used in a final Pt/STO catalyst.19 Currently, Pt nanoparticles are introduced onto STO supports via atomic layer deposition (ALD), a well-established technique that deposits metals from a gaseous precursor in a precise fashion.18,23 This process, however, requires highly specialized instrumentation, making it difficult to increase output beyond the gram scale in a short period of time. It is, therefore, necessary to develop a Pt deposition method that retains the precision and tunability of ALD while also facilitating an increase in the output of Pt/STO. Such a deposition method would likely be based on a solution-phase process. Several types of solution-based processes are attractive alternatives to ALD and have found applications in numerous areas of industrial importance not limited to waste plastic upcycling.27,28
Solution atomic layer deposition (sALD) is one attempt to develop such a process. Starting from dissolved metal precursors, sALD proceeds via the same surface-limited chemistry as conventional, vapor-phase ALD, but improves on the process by both increasing deposition yield and eliminating the need for precursors that are stable in the vapor phase, which are often prohibitively expensive.29–31 Several sALD systems have been reported for the deposition of inorganic and organic thin films on common metal oxide supports (e.g. titania, silica), among other exploratory examples.29–33
Another promising synthetic method analogous to ALD is surface organometallic chemistry (SOMC), in which organometallic precursors are chemisorbed onto catalyst support surfaces.34 Straddling homogeneous and heterogeneous catalysis, this technique generates supported catalysts with single, well-defined active sites without uncontrolled deposition and molecular degradation.34–37 These active sites also lend themselves well to spectroscopic and kinetic characterization, facilitating the optimization of activity and selectivity.34 Unlike ALD, SOMC is also scalable and an appealing target for large-scale catalyst deposition.
In the last forty years, SOMC-derived supported catalysts have been tuned through precursor engineering and support control to optimize catalyst activity and selectivity for processes as wide-ranging as metathesis, polymerization, hydrogenation, and hydrogenolysis, among others.34–39 These works largely focus on grafting onto amorphous silica, a support that is desirable because of its high surface area and high density of surface hydroxyls available for bonding. Many seminal SOMC systems have been developed around early transition metal (e.g., Ti) complexes. Late transition metals form weaker M–O bonds relative to early transition metals, and under hydrogen treatment during SOMC form metal nanoparticles on the catalyst surfaces.34 For example, SOMC-derived Cu/ZrO2 catalysts have shown selectivity for the conversion of carbon dioxide to methanol. This selectivity is partially attributed to the activation of CO2via interaction with Zr(IV) Lewis acid sites in close proximity to deposited Cu particles. Importantly, an SOMC-derived synthesis is integral to this mechanism since it allows for the introduction of highly dispersed and isolated Zr(IV) sites.34 Comparable activity has been shown for Cu/Ti@SiO2, whose SOMC synthesis affords a high density of Ti(IV) isolated sites. SOMC techniques have also been used to synthesize PtGa@SiO2 alloyed nanoparticles, which show high selectivity for alkane dehydrogenation. Additionally, high-throughput screening techniques have been used to synthesize >100 possible SOMC catalysts for testing in dry reforming of methane.40 Together, these results show that SOMC can produce small, supported nanoparticles for catalysis, with the potential to synthesize a broad range of bimetallic systems.34
In this work, we report the synthesis of a supported platinum nanoparticle catalyst via SOMC grafting onto STO nanocuboids (Fig. 1 and S1†). We have studied surface treatment via calcination, ozonolysis, and steaming of the STO nanocuboids to influence surface hydroxyl density and clean the STO surface. The rationale for using this pre-processing method is consistent with other studies of analogous zeolite supports in which pre-reaction processing influences reaction selectivity.41–46 Then, the SOMC grafting of Pt precursors was studied, along with chemical treatments to generate Pt nanoparticles from the SOMC materials. All Pt/STO catalysts prepared in these ways were investigated in hydrogenolysis of isotactic polypropylene to provide liquid products with narrow dispersity, replicating the outcomes from ALD materials.
Experimental
Materials
Isotactic polypropylene (i-PP), number-averaged molecular weight (Mn) = 5000 Da, weight-averaged molecular weight (Mw) = 12![[thin space (1/6-em)]](https://www.rsc.org/images/entities/char_2009.gif) 000 Da, was obtained from Sigma-Aldrich and used as received.
000 Da, was obtained from Sigma-Aldrich and used as received.
Synthesis of SrTiO3 nanocuboids
The procedure for the synthesis of large-scale STO nanocuboids was reported by Peczak et al.19 The solution concentrations were proportionally scaled for a 4 L reactor, with the concentrations of Sr, Ti, and NaOH halved relative to the liquid volume to decrease the concentration of chloride ions in the unlined Hastelloy C-276 reactor. Solution A was prepared with 38.69 g of Sr(OH)2·8H2O dissolved in a solution of 48.04 g of acetic acid and 640.00 g of H2O under stirring for 2 h. A solution B was prepared with 27.62 g of TiCl4 dissolved in 504.96 g of ethanol for 10 min. The two solutions A and B were mixed and stirred for 10 min in a 2000 mL Erlenmeyer flask; 276.85 g of 10 M NaOH solution was injected into the AB solution for 28 min at a flow rate of 10 mL min−1 using a syringe pump. The AB–OH solution was stirred using a magnetic stirrer at the maximum stir rate of the stir plate; no gelation was observed. After mixing and stirring, the AB–OH solution was allowed to sit for 10 min; the pH of the solution was 13.0, and sedimentation occurred.The solution and sediment were transferred to a 4 L Hastelloy C-276 reactor with an internal impeller and a heating jacket. The reactor was heated to 240 °C at a rate of 2 °C min−1 and held for 2 h with a stir speed of 400 rpm. After the reaction, the reactor was cooled at a rate of 2 °C min−1. The precipitate and liquid were transferred from the reactor to a secondary container. The solution pH was 13.2 after the hydrothermal reaction. Initially, the liquid was a light-yellow color but changed to dark orange with time. The precipitate was washed with vacuum filtration and dried in air overnight (12 h, 110 °C).
Treatments of SrTiO3 nanocuboids
Prior to Pt deposition, STO supports were treated through a mixture of calcination in air, ozonolysis, and steaming. STO nanocuboids (∼300 mg at a time) were calcined in air between 350 °C and 550 °C for 4 h. STO samples were then introduced into a fixed bed flow reactor and treated with a flow (400 sccm) of ozone in oxygen (8% O3) using an ozonolyzer (Pacific Ozone, Evoqua Water Technologies LLC) at a constant temperature (200 °C) for 2 h. Samples were then treated with steam at 200 °C for 2 h.Deposition of Pt onto STO nanocuboids
Vacuum-dried STO nanocuboids (200 °C, 12 h) were suspended in a solution of trimethyl(methylcyclopentadienyl)platinum(IV) (MeCpPtMe3) (Sigma Aldrich, 98%) or platinum(II)acetylacetonate (Pt(acac)2) (Sigma Aldrich, >99.98%) in toluene (target 2 wt% Pt) at various temperatures for 72 h under an inert atmosphere in a N2-filled glovebox, washed and filtered three times with toluene and once with pentane to remove physisorbed precursor, and then vacuum dried at 60 °C overnight. The sample was either calcined at 300 °C in air for 4 h, and/or reduced under 10% hydrogen at 300 °C for 4 h. In order to increase the amount of Pt loaded onto the STO surface, a multi-cycle (i.e. multiple cycles of deposition and reduction) approach was implemented. In a one-cycle (1c) deposition and reduction process, STO samples were introduced into a toluene solution for Pt metalation and then reduced to afford metal Pt nanoparticles as above. The reduction treatment of the ligated Pt/STO catalyst regenerates surface hydroxyls, which creates more available sites for deposition and removes any ligands bound to the Pt metal. Afterward, the 1c-sample was vacuum dried (200 °C, 12 h) and reintroduced into a glovebox to be used for an additional round of deposition and reduction to give the two-cycle (2c) sample. Repeating this process again produced the three-cycle (3c) sample.Characterization
Dynamic nuclear polarization (DNP)-enhanced 17O solid-state NMR experiments were carried out on the bare STO nanocuboids to characterize their surface termination. STO materials were surface-enriched with 17O by first partially dehydroxylating them at 300 °C overnight, rewetting them with 40% 17O-water in a dry atmosphere, and then removing excess water at room temperature under vacuum overnight. This process partially exchanges oxide and hydroxide centers from the surface. The procedure was repeated to surface 17O-enrich a sample of anatase titania that was used as a reference. The material was then wetted with a 16 mM solution of the TEKPol biradical polarizing agent in either fully protonated or fully deuterated 1,1,2,2-tetrachloroethane (TCE),48 packed into a 3.2 mm sapphire rotor, and inserted into the pre-cooled (100 K) low-temperature MAS probe installed from a Bruker AVANCE III 400 MHz/263 GHz MAS-DNP spectrometer. Measurements were carried out using three approaches, namely, (1) a 17O{1H} PRESTO-II experiment excites exclusively hydroxyl 17O species,49,50 (2) a 17O{1H} D-RINEPT-SR412(tt) experiment excites both hydroxyls and oxide 17O centers that are near 1H nuclei,51 and (3) a 17O direct DNP experiment that reveals all surface 17O centers,52 regardless of 1H locality. The MAS spinning frequency was set to 13.888 kHz and 17O pulses utilized effective RF powers of 25 kHz. 1H RF powers were of 100 kHz for hard and CW pulses and 132 kHz for the tanh/tan adiabatic SR412 pulses used in the D-RINEPT-SR412(tt) experiments. Recycle delays were set to 2 s and 8 s for the indirect and direct DNP experiments performed on the STO, respectively, and 10 s in the case of anatase TiO2. Quadrupolar Carr–Purcell Meibook–Gill (QCPMG) was applied for sensitivity enhancement.53 34 echoes were acquired, with a spikelet separation of 694 Hz. PRESTO spectra were acquired in 2048 and 768 scans for STO and TiO2, respectively, with 2 rotor cycles of recoupling and INEPT spectra were acquired in 8192 and 1536 scans with 32 rotor cycles of recoupling. Direct DNP experiments utilized a 6.94 kHz spikelet separation, recycle delays between 1 and 256 s and acquired in 256 scans. Through-space 17O{1H} heteronuclear correlation experiments were measured using the D-RINEPT-SR412(tt) pulse sequence and 100 kHz 1H frequency-switched Lee-Goldburg homonuclear decoupling.54 672 scans were acquired for each of the 16 t1 increments of 130.672 μs and the QCPMG spikelet separation was increased to 2.315 kHz.
1H{195Pt} experiments were carried out using a sideband-selective perfect-echo (PE)-RESPDOR experiment using an Agilent DD2 400 MHz spectrometer equipped with a Samoson 1.7 mm fast-MAS probe.55 Samples were packed into 1.7 mm rotors in an inert atmosphere and spun to 40 kHz using pressurized nitrogen. Hard 1H pulses utilized a 100 kHz RF field while the sideband-selective, 50 μs, 195Pt pulses were applied with a 13 kHz RF power. The total recoupling time was equal to 1.2 ms. Sub-spectra were acquired in either 2048 or 16![[thin space (1/6-em)]](https://www.rsc.org/images/entities/char_2009.gif) 384 scans with a 1 s recycle delay. The 195Pt offset frequency was first stepped in 10 kHz increments around −2000 ppm to find a spinning sideband and was then stepped in 40 kHz increments to measure the intensities of the neighboring spinning sidebands.
384 scans with a 1 s recycle delay. The 195Pt offset frequency was first stepped in 10 kHz increments around −2000 ppm to find a spinning sideband and was then stepped in 40 kHz increments to measure the intensities of the neighboring spinning sidebands.
![[thin space (1/6-em)]](https://www.rsc.org/images/entities/char_2009.gif) 562.76 eV at the zero-crossing of the second derivative. Samples were diluted with SiO2 and pressed into self-supporting wafers at a 45° angle and placed within an in situ gas cell as described in detail in a previous report.63a Spectra were measured under He flow (200 mL min−1) at room temperature before and after reduction (3.5% H2/He, 250 °C, 10 minutes, 50 mL min−1) to remove surface oxide species formed in the samples upon contact with air. Data processing (includes normalization, background subtraction calibration, and fitting) was performed using the Demeter/Athena/Artemis suite of XAFS analysis software.63b
562.76 eV at the zero-crossing of the second derivative. Samples were diluted with SiO2 and pressed into self-supporting wafers at a 45° angle and placed within an in situ gas cell as described in detail in a previous report.63a Spectra were measured under He flow (200 mL min−1) at room temperature before and after reduction (3.5% H2/He, 250 °C, 10 minutes, 50 mL min−1) to remove surface oxide species formed in the samples upon contact with air. Data processing (includes normalization, background subtraction calibration, and fitting) was performed using the Demeter/Athena/Artemis suite of XAFS analysis software.63b
![[thin space (1/6-em)]](https://www.rsc.org/images/entities/char_2009.gif) :
:![[thin space (1/6-em)]](https://www.rsc.org/images/entities/char_2009.gif) 1 ratio of H2
1 ratio of H2![[thin space (1/6-em)]](https://www.rsc.org/images/entities/char_2009.gif) :
:![[thin space (1/6-em)]](https://www.rsc.org/images/entities/char_2009.gif) He) three times. The reactor was pressurized with mixed gas (9
He) three times. The reactor was pressurized with mixed gas (9![[thin space (1/6-em)]](https://www.rsc.org/images/entities/char_2009.gif) :
:![[thin space (1/6-em)]](https://www.rsc.org/images/entities/char_2009.gif) 1 ratio of H2
1 ratio of H2![[thin space (1/6-em)]](https://www.rsc.org/images/entities/char_2009.gif) :
:![[thin space (1/6-em)]](https://www.rsc.org/images/entities/char_2009.gif) He) at 827 kPa at room temperature, and then heated to 300 °C (1.2 MPa). After 24 h, the reactor was allowed to cool to room temperature. The gas in the headspace was directly injected into a gas chromatograph (GC) for analysis (see below). The remaining gas in the headspace was slowly released. The liquid products were collected and fractionated based on their location either outside the liner (OL) or inside the liner (IL). OL-products were directly collected by pipette, while IL-products were extracted with n-hexane (HPLC grade) warmed at 55 °C. The extracted solution was filtered through silica gel, and the solvent was removed using a rotary evaporator. Both OL- and IL-products were analyzed by ultra-high pressure liquid chromatography (UHPLC), NMR, and thermogravimetric analyzer-differential scanning calorimetry (TGA-DSC). In the manuscript, the total amount of liquid is the sum of OL and IL.
He) at 827 kPa at room temperature, and then heated to 300 °C (1.2 MPa). After 24 h, the reactor was allowed to cool to room temperature. The gas in the headspace was directly injected into a gas chromatograph (GC) for analysis (see below). The remaining gas in the headspace was slowly released. The liquid products were collected and fractionated based on their location either outside the liner (OL) or inside the liner (IL). OL-products were directly collected by pipette, while IL-products were extracted with n-hexane (HPLC grade) warmed at 55 °C. The extracted solution was filtered through silica gel, and the solvent was removed using a rotary evaporator. Both OL- and IL-products were analyzed by ultra-high pressure liquid chromatography (UHPLC), NMR, and thermogravimetric analyzer-differential scanning calorimetry (TGA-DSC). In the manuscript, the total amount of liquid is the sum of OL and IL.
Results and discussion
Preparation of STO nanocuboids prior to surface modification studies
Strontium titanate (SrTiO3, STO) nanocuboids (nano-rectangular prisms) were synthesized hydrothermally as per the scaled-up method described in Peczak et al. at 240 °C for 2 h.19,64 The STO nanocuboids have an average size of 45 ± 10 nm and an average shape of a cube composed of (100) facets, with rounded edges. 70 to 75% of nanoparticles in the STO sample take this shape, though the batch is 100% crystalline SrTiO3 by powder X-ray diffraction. Previous work has demonstrated that hydrothermally synthesized STO nanocuboids predominantly have a Ti-rich, by
by  , 33.3° rotated TiO2 double layer reconstruction on the surface of the {100} facets,19,64–72 and that upon annealing at elevated temperatures, the rounded corners between these {100} facets reform into {110} facets.66 Additionally, bulk STO has a close lattice match with platinum, which can result in a high degree of epitaxial stabilization of platinum nanoparticles on the support surface.23,26,73 Previously, platinum nanoparticles with narrow size distribution and a range of sizes were synthesized on STO nanocuboids by atomic layer deposition (ALD).18,23,25,26,74 These ALD-derived Pt/STO catalysts synthesized show no signs of immediately evident SrCO3 buildup at room temperature or typical reaction conditions (200–300 °C), per results collected via X-ray diffraction (Fig. S4†), though some carbonate desorption was observed at high temperatures (Fig. S5†).
In atomic layer deposition, ozone treatment is used to clean the STO surface because as-synthesized STO nanocuboids can have a range of adventitious species on the surface, including hydroxyls as part of the surface termination, adsorbed water, or ions (e.g. sodium, chloride, hydroxide, acetate, carbonate) from the hydrothermal solution, as suggested in Peczak et al.19 Carbonates, for example, can form during the STO synthesis when inhomogeneity in the pre-heating Sr–Ti–OH mixture creates local environments with intermediate pH (e.g. 3 < pH < 9). In this range, strontium carbonate is more thermodynamically stable than strontium titanate.19,75–77 The concentration of the adsorbed ions from the reaction mixture can be significantly decreased by washing and drying the nanoparticles post-synthesis. However, such post-reaction processing still allows for some species, such as hydroxyls and water, to remain on the surface. Variation in the concentration of hydroxyls and water on the surface, both between batches and between individual cuboids, can result in inhomogeneity in the grafting of catalyst precursors on the surface of the support. To minimize this effect, various pre-treatments can be performed to burn or desorb species on the surface or to selectively re-introduce desired surface species. Here, calcination and ozonolysis were used for the former, and steam for hydroxyls.
Surface modification through calcination
STO nanocuboids were calcined for 4 h at temperatures between 350 °C and 550 °C. Particle size and the relative amount of nanocuboid particles are statistically equivalent in the as-synthesized sample and post-calcination samples (Fig. S6 and Table S1†). Calcination of as-synthesized STO nanocuboids at 350 °C and 550 °C desorbed most surface species, which generally desorb between 200 °C and 600 °C, as seen by TGA of the calcined materials (Fig. 2). These results demonstrate that calcination at 550 °C exhibits the lowest weight loss of desorbed species, indicating that this surface is the least contaminated and therefore cleanest. At around 550 °C, the surface area of the STO sample has decreased 37% from the as-synthesized sample even though particle morphology does not visibly change. This likely stems from the coalescence of individual STO nanocuboids (Table S2†). To avoid this and ensure that the STO support surface area was sufficiently high for catalyst deposition, calcination treatments were not carried out at temperatures higher than 550 °C.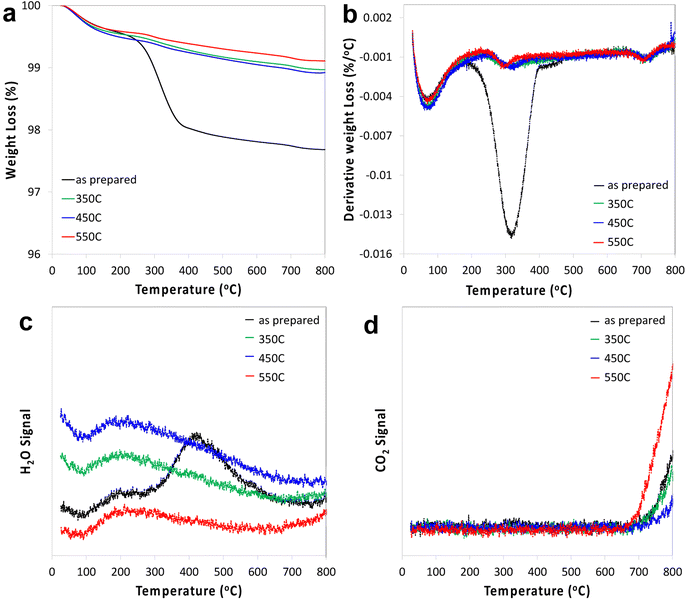 | ||
| Fig. 2 TGA (a), 1st derivative (b), water signal (c) and CO2 signal (d) of STO as prepared and after calcination at 350 °C, 450 °C and 550 °C. | ||
Effect of calcination on MeCpPtMe3 grafting
One cycle of platinum was deposited at room temperature on STO samples calcined at 350 °C or 550 °C, using the MeCpPtMe3, the organometallic precursor used for ALD of Pt, resulting in Pt/STO samples with weight loadings of 0.019 wt% and 0.13 wt%, respectively. It appears that the Pt particle size is uneven on the STO calcined at 350 °C, while it is more uniform when deposited on STO calcined at 550 °C (Fig. 3). Uneven deposition on otherwise equivalent samples is likely due to remaining surface species that interfere with Pt grafting, making calcination at 550 °C the preferred temperature. However, the weight loading of Pt is still low relative to previously reported ALD deposition and can likely be increased through additional pre-deposition surface treatments.Surface modification through ozonolysis
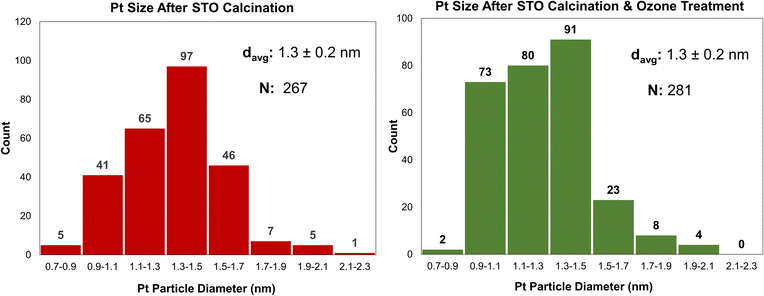
A similar effect to calcination can be achieved at lower temperatures using stronger oxidants, such as ozone through ozonolysis. The lower temperature of ozonolysis can be beneficial if there are other properties, such as phase transitions or sintering, that would be accelerated at higher temperatures. In this work, both processes were used in sequence to ensure that STO support surfaces were sufficiently clean for Pt deposition. Additionally, because ozone treatment at 200 °C was previously used to deposit Pt by ALD,18 the use of ozonolysis in this work enables a comparative study between ALD- and SOMC-derived Pt deposition methods. Ozone treatment at 200 °C was used to treat the STO surface after calcination prior to catalyst deposition. Pt deposition was conducted via SOMC of MeCpPtMe3 at 65 °C on STO supports treated by both calcination and a combination of calcination and ozonolysis. Ozone treatment did not significantly affect final Pt particle size, as final particle sizes for both samples were 1.3 nm (Fig. 4), and Pt weight loadings were similar (0.13 wt% without ozone and 0.12 wt% with ozone).Effect of steam treatment
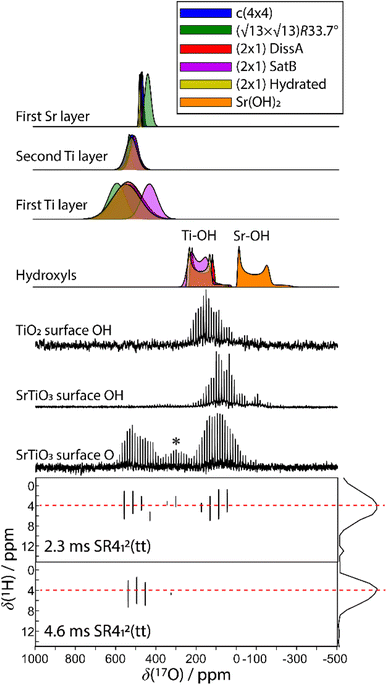
Any combination of calcination and ozonolysis likely leads to significant dehydroxylation, meaning that hydroxyls must be replenished prior to SOMC grafting. Steam treatment at elevated temperatures can be used to re-introduce controlled concentrations of surface hydroxyls.78 NMR titration of surface hydroxyls on STO nanocuboids with Bn2Mg(THF)2 on samples calcined at 550 °C and then steam-treated at temperatures ranging from 100 °C to 500 °C revealed that the hydroxyl concentration reaches a maximum of 17.3 OH per nm2 at 200 °C (Fig. S7†). The presence of O3 did not significantly affect surface hydroxyl concentrations. Below that temperature, the number of reconstituted hydroxyls is low, and above that temperature, the formation of hydroxyls is increasingly in competition with the reverse dehydration reaction to form a bridging oxygen, shifting the equilibrium toward low hydroxyl concentrations.79a,b Steam treatment at 200 °C was selected to use as a post-treatment of ozonolysis. TGA confirms a higher loss of water when ozone is used in between the calcination at 550 °C and the steam treatment at 200 °C (Fig. S8†). It is likely that the increased oxidizing power of ozone is leading to re-arrangement and stabilization of the surface, making it more prone to reaction with water to form hydroxyls.DNP-enhanced 17O solid-state NMR was carried out to characterize the structure of the formed hydroxy species and surface termination. Three experiments, PRESTO, D-RINEPT-SR412(tt), and direct DNP, were conducted to selectively detect hydroxyl species, all oxygen centers near 1H spins, and all oxygen centers regardless of environment, respectively. The D-RINEPT-SR412(tt) experiment revealed two major surface environments resonating near 500 and 100 ppm at 9.4 T, the later of which could be assigned to hydroxyls using the PRESTO measurement (Fig. 5). Plane-wave DFT calculations were carried out on the c(4 × 4)80 and  terminations of STO,81 in addition to three hydrated variants of the (2 × 1) termination,82,83 to predict the 17O chemical shifts and quadrupolar coupling parameters for various surface environments. These calculations revealed that the signal around 500 ppm can be attributed to surface oxygen species in the TiO2 double layer, with potentially a shoulder from the Sr layer. No evidence for Sr–OH species was detected, meaning that, as expected, the Pt grafting sites are Ti–OH species. The ratio of the Ti–O–Ti and Ti–OH signal intensities was similar in a direct DNP experiment and was not affected by the solvent protonation level. 17O{1H} HETCOR experiments revealed that the major correlation for the oxide resonances was from a neighboring Ti–OH species, and this was not affected by the application of a longer recoupling time in protonated TCE (i.e. no correlations to solvent were observed, Fig. 5). This indicates that hydroxyls are found homogeneously on all STO facets and that significant defects are present in the usually hydrophobic
  surfaces, in agreement with the high average hydroxyl density.
Effect on Pt precursor and solution temperature on grafting
The amount of Pt loading via SOMC can be increased by changing the starting Pt complex that is grafted to the STO surface. Pt(acac)2 and MeCpPtMe3 are two common platinum precursors used in catalyst synthesis.82–85 In addition to traditional methods such as wet impregnation, incipient wetness, and co-precipitation, these precursors have been used for ALD of Pt nanoparticles on oxide surfaces,86 with MeCpPtMe3 specifically used to grow Pt nanoparticles of a range of sizes through cyclic growth on STO nanocuboids.18,23,24,26,86 On STO calcined at 550 °C, ozone and steam treated at 200 °C, grafting at 50 °C of Pt(acac)2 was more efficient (0.50 wt% Pt) than the grafting using MeCpPtMe3 (0.12 wt%), which is expected due the covalent nature of the Pt–C bond in the latter.Solid-state NMR 1H{195Pt} perfect-echo RESPDOR experiments (Fig. 6) were performed on a sample of MeCpPtMe3 grafted onto STO. Correlations were observed in the sideband-selective experiment corresponding to a uniform Pt environment characterized by an isotropic 195Pt chemical shift of −2100 ± 100 ppm, a tensor span of 1600 ± 200 ppm, and a skew of −0.8 ± 0.2. These parameters are similar to those measured in a MeCpPtMe3/Zn–SiO2 catalyst,87 suggesting that it adopts a similar bipodal coordination environment. This is consistent with the observation that after grafting of MeCpPtMe3 onto STO supports, the final Pt loading (0.5 wt%) was lower than that obtained with Pt(acac)2 (2 wt%), as a bipodal mode of grafting consumes surface hydroxyls that would otherwise be available for additional Pt deposition. No evidence of monopodal or tripodal Pt species was detected.
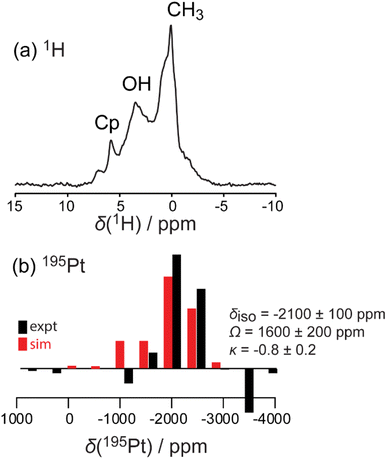 | ||
| Fig. 6 Simulated (red) and experimental (black) 1H MAS (a) and 1H{195Pt} perfect-echo RESPDOR (b) solid-state NMR spectra acquired on a MeCpPtMe3/STO material. | ||
EPR spectroscopy confirmed the presence of Ti(III) on STO both as synthesized and after calcination (Fig. S9†). The observation of Ti(III) in these samples is consistent with previous reports that show Ti(III) evolution in STO after treatment in both reducing environments and high-temperature annealing environments. It has been proposed that such an environment can introduce oxygen vacancies into the STO crystal lattice, leading to a reduction of Ti4+ to Ti3+ to preserve electrical neutrality.87–89 Overall, Ti(IV) appears to be the dominant Ti species, though paramagnetic effects from Ti(III) overwhelm the NMR signals for 1H and 195Pt.
Metalation temperature for Pt(acac)2 deposition
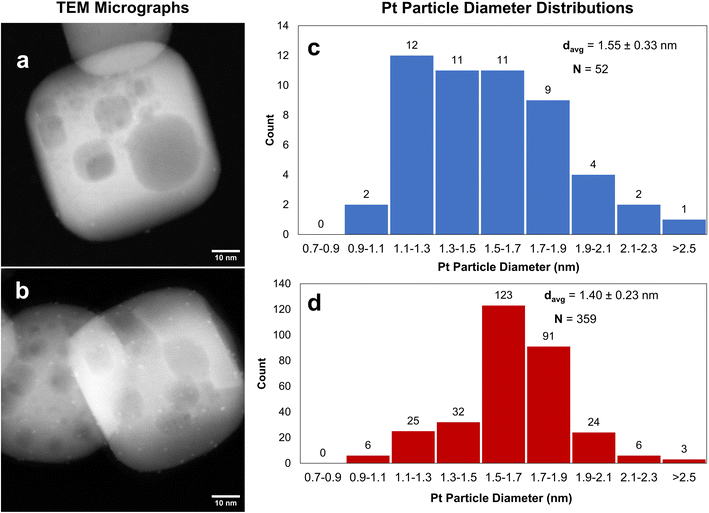
After STO nanocuboids were calcined at 550 °C and treated by ozonolysis and steaming (both at 200 °C), Pt(acac)2 was grafted onto the STO nanocuboids in toluene at temperatures ranging from 50 °C to 120 °C for 72 h. The Pt loading was slightly affected by solution temperature for Pt(acac)2, with 0.50 wt% Pt deposition being observed at 50 °C, and increasing slightly to 0.54 wt% at 80 °C and 0.55 wt% at 120 °C (Fig. 7). A metalation temperature of 90 °C was also tested, and average Pt particle size was comparable to that observed for depositions carried out at 80 °C (Fig. S10†). A metalation temperature of 120 °C led to larger particles, however, which are thought to be less active for polyolefin hydrogenolysis.18 Thus, metalation at 80 °C was selected for further experiments.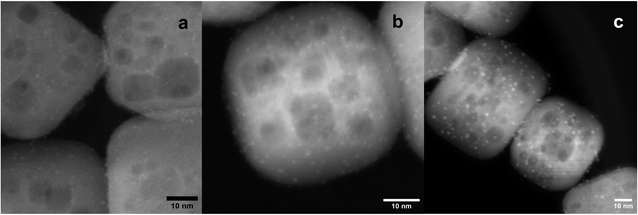 | ||
| Fig. 7 STEM HAADF micrographs of SOMC 1cPt/STO calcined at 550 °C, followed by O3 and steam treatment at 200 °C, made at a 50 °C (1.2 ± 0.3 nm; (a)), 80 °C (1.3 nm, (b)), and 120 °C (1.8 nm, (c)). | ||
Multiple-cycle deposition
One of the unique features of the self-limiting ALD processes is that particles or layers of a desired size or thickness can be grown by repeating the growth cycle a specific number of times.23,90 SOMC is also a self-limiting deposition process, and it should be possible to perform additional cycles of grafting to deposit controlled amounts of Pt on the surface until a desired particle density or size is reached. We observed the Pt surface loading increase from 0.90 Pt atoms per nm2 after one cycle to 1.66 Pt atoms per nm2 after two cycles. Interestingly, the average Pt nanoparticle diameter was independent of the number of cycles at 1.3 ± 0.3 nm, 1.2 ± 0.39 nm, and 1.5 ± 0.35 nm after the 1, 2, and 3 cycles (Table 1). Instead, increases in Pt loading are driven by new nanoparticle formation. The cycle-by-cycle growth behavior of SOMC under reducing conditions is different from analogous ALD depositions, where oxidizing conditions appear to favor particle growth over new nucleation on subsequent cycles.86,90| Average diameter ± SD (nm) | Particle rangea (nm) | Pt loading (wt%) | Pt/Ti | |
|---|---|---|---|---|
| a The number of atoms per particle was calculated using estimations described by Jentys88 and assuming a spherical particle shape. | ||||
| 1cPt_red/STO | 1.3 ± 0.30 | 0.562 | 0.0224 | |
| 2cPt_red/STO | 1.2 ± 0.39 | 1.3–1.8 | 1.082 | 0.0446 |
| 3cPt_red/STO | 1.5 ± 0.35 | 1.636 | 0.0365 | |
| 2cPt_red/STO_spent | 1.8 ± 0.89 | 1.3–1.9 | 1.204 | 0.0443 |
| 2cPt_calc/STO | 0.8 ± 0.22 | 0.884 | 0.0374 | |
| 2cPt_cal + red/STO | 1.0 ± 0.20 | 1.1–1.9 | 0.936 | 0.0374 |
| 2cPt_cal + red/STO_spent | 1.3 ± 0.49 | 1.0–1.3 | 0.960 | 0.0214 |
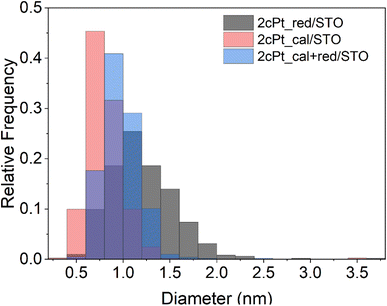
After the Pt precursor is grafted to the STO nanocuboid surface (two cycles), the excess precursor is washed off with toluene and the pre-catalyst is dried before forming Pt nanoparticles. Like ALD,86 Pt nanoparticles can be formed via oxidation or reduction of the grafted species to remove the stabilizing ligands. In both the oxidizing and reducing cases, the individual Pt atoms are mobile on the oxide surface and nucleate to form nanoparticles. In the case of ALD at sub-atmospheric pressures, under oxidizing conditions, PtOx/Pt0 core–shell particles form, while a metallic Pt0 particle forms under reducing conditions.86,90 The mobility of the Pt species can be modified by adjusting the partial pressure of the oxidant or reductant.85 Here, the grafted Pt species were either annealed under air at 300 °C, or reduced under hydrogen at 300 °C for 4 h, or annealed at 300 °C under air followed by reduction at 300 °C for 4 h. An annealing temperature of 300 °C was chosen to remove organics according to TGA (Fig. S11†). The average particle sizes and distributions for all three conditions are summarized in Fig. 8 and Table 1 along with the Pt loadings. Oxidizing before reducing lowers the average Pt particle size from 1.2 to 1.0 nm compared to reduction only, indicating that PtOx may be better stabilized onto STO, also shown by the Pt/Ti ratio of 0.374 that remains constant after reactions. The higher Pt/Ti ratio in the reduced sample only may be due to the higher reduction of Pt species compared to the calcined and reduced samples (Fig. 8 and Table 1). A layer of PtOx in contact with the support would favor stronger binding compared to Pt0.90,91
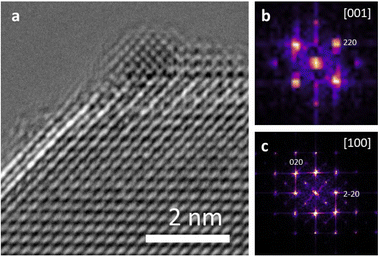
Both Pt/STO catalysts mentioned in Fig. 8 were examined by high-resolution transmission electron microscopy (HRTEM) to examine the interface between the Pt catalyst and STO support. The results are presented below in Fig. 9. These micrographs demonstrate cube-on-cube epitaxy between the Pt metal {100} facet and {100} STO support facet. However, planar epitaxy between the Pt metal {101} facet and the {100} facet was observed in some images. Image analysis suggests that the epitaxy shown in Fig. 9 represents a minor portion of all Pt/STO catalyst–support interactions. This epitaxial stabilization is likely responsible for the high stability of deposited Pt nanoparticles against sintering. Although previous reports of Pt/STO synthesized by ALD show a larger relative amount of cube-on-cube epitaxy in comparable samples,24,26,92 these results are generally consistent with observations that smaller average sizes for deposited nanoparticles lead to distortions in epitaxial stabilization.92,93 Such distortions include but are not limited to planar epitaxy, as is the case here, or existences as twinned particles, as was observed in some images corresponding to the experiment in Fig. 9. An example of such epitaxy is presented in the ESI (Fig. S12†).
Catalytic testing and recyclability
The 2cPt_red/STO was tested in the hydrogenolysis of i-PP at 300 °C and 180 psi for 24 h. The sample was chosen because its Pt loading and average Pt particle diameter most closely match Pt/STO catalysts synthesized by one cycle of ALD,18,23 allowing comparison of hydrogenolysis results between physically similar samples. The yield of liquid products was 96.3%. The Mn of the product was ∼270 Da with a dispersity (Đ) of 1.1 (Fig. 10). A key feature of the ALD-Pt/STO is its reusability, which is a result of its stability against sintering, as determined by repeated catalytic tests and TEM of the post-reaction catalyst. The 2cPt_red/STO was recovered and used four additional times for a total of five catalytic runs, and full conversion of i-PP was obtained for all runs (no solid product remained). The Mn of the product was obtained from the used 2cPt_red/STO catalyst was identical to the first experiment with fresh catalyst. There were a few changes in hydrogenolysis experiments over catalyst recycling. First, the molar H2 consumption, corresponding to the moles of C–C bonds that are hydrogenolyzed, was 3.0 mmol for the first run and approximately 4 mmol for subsequent runs, with less than 10% of the i-PP converted (Fig. S13†). There was a small decrease in the quantity of methane formed after the first two runs, which may be related to changes in the available active sites. After the first catalytic run, the headspace is comprised of around 70 mol% methane. An equivalent mole percent of methane formation was reported by Hackler et al., who used a comparable Pt/STO catalyst for i-PP upcycling under largely equivalent conditions.21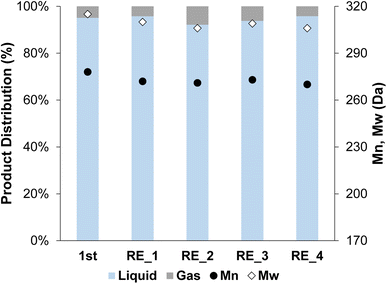 | ||
| Fig. 10 Product distribution (liquid and gas) and Mn and Mw from OL after the first hydrogenolysis and 4 consecutive recycling experiments using 2cPt_red/STO. Conditions: i-PP (3 g), 301.0 mg 2cPt_red/STO catalyst, 300 °C, 180 psi mixed gas, 24 h. For gas distribution, see ESI.† No solid products were observed. Đ = 1.1 for all. | ||
After the 5 consecutive catalytic runs, Pt particle size increased slightly from 1.2 nm to 1.8 nm (Fig. 11a and b) and the Pt loading increased from 1.082 to 1.204 wt%, likely because of the loss of carbon-rich species from the as-prepared catalyst. However, the Pt/Ti ratio decreased only slightly from 0.0446 to 0.0443, indicating a negligible loss of Pt.
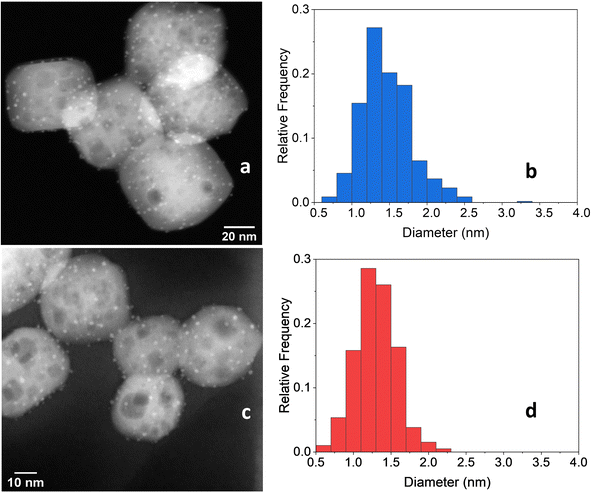 | ||
| Fig. 11 (a) STEM-HAADF image of 2cPt/STO and (b) platinum particle size distributions (1.8 ± 0.89 nm) (right) after 5 catalytic runs. The initial sample is 2cPt_red/STO (Table 1). (c) STEM-HAADF image of 2cPt/STO and (d) platinum particle size distributions (1.3 ± 0.49 nm) after 5 catalytic runs. The initial sample is 2cPt_cal+red/STO (Table 1). | ||
The 2cPt_cal+red/STO catalyst, containing smaller nanoparticles, was also tested for stability against sintering by repeated catalytic testing for i-PP hydrogenolysis at 300 °C, 180 psi for 24 h. The Mn of the product was ∼200 Da for the first 4 runs and 218 Da after the 4th run (Fig. 12). More light gases, in particular methane, and liquid alkanes (C5H12 and C6H14) were formed after initial runs, although the amounts of gases and liquids formed decreased with successive reactions (Fig. S14†). It was previously proposed that smaller catalyst nanoparticles produce lower molecular-weight upcycling products due to the availability of more Pt edge sites, which may be active sites for polymer hydrogenolysis, potentially explaining the greater methane production. The particle sizes reported above are consistent with this relative definition of “smaller” particles.18 Pictures of the initial polymer and final products are presented in Fig. S15.† In general, the SOMC-derived Pt/STO catalyst reported herein hydrogenolyzes polyolefins to upcycled products with similar yields and average molecular weights to those made by comparable catalysts, such as those reported by Hackler.20,21 A table of comparable catalysts is presented in the ESI (Table S3†). After the 5 consecutive catalytic runs, Pt particle size increased slightly from 1.0 nm to 1.3 nm (Fig. 11c and d) and the Pt loading increased from 0.936 to 0.960 wt%. However, the Pt/Ti ratio decreased only slightly from 0.0374 to 0.0214, also indicating a negligible loss of Pt.
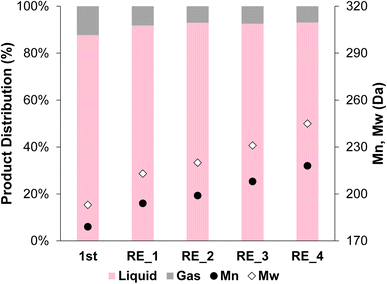 | ||
| Fig. 12 Product distribution (liquid and gas) and Mn and Mw from OL after the first hydrogenolysis and 4 consecutive recycling experiments using 2cPt_cal+red/STO. Conditions: i-PP (3 g), 301.0 mg 2cPt_cal+red/STO catalyst, 300 °C, 180 psi mixed gas, 24 h. For gas distribution, see ESI.† No solid products were observed. Đ = 1.1 for all. | ||
XAFS was performed on the fresh and spent 2cPt_red/STO and 2cPt_cal+red/STO. According to the Pt L3 XANES, the 2cPt_cal+red/STO was the least reduced sample while the two spent samples were the most reduced (Fig. S16†) by qualitative comparison of the spectra with Pt metal and PtO2. Linear combination fitting (LCF) with the metal and oxide spectra for the fresh samples indicates a larger fraction of oxidized Pt in 2cPt_cal+red/STO than 2cPt_red (Table S4†), consistent with smaller average particle sizes observed for the former (Table 1). Spent 2cPt_red and 2cPt_cal+red/STO closely resemble metallic Pt even after air exposure (Fig. S16†), suggesting surface species deposited from the hydrogenolysis experiments may have prevented re-oxidation of surface Pt unlike the fresh materials. After an in situ reduction in 3.5% H2/He at 250 °C for 10 min, all samples were reduced (Fig. S17†). For both samples, there was no significant change in the Pt–Pt coordination number (Table 2) after reaction, although larger Pt–Pt bond lengths and smaller Debye–Waller factors fit for the spent samples also support an increase in the average Pt particle size following hydrogenolysis for both 2cPt_cal+red/STO and 2cPt_red. The sample that was calcined first had a lower coordination number (8.2 vs. 8.5) and Pt–Pt bond length than the sample reduced without calcination which is also in agreement with a smaller particle size observed in TEM and suggested from XANES LCF results (Table S4†).
| Sample | N | R (Å) | σ 2 (×10−3 Å2) | ΔE0 (eV) | R-Factor | |
|---|---|---|---|---|---|---|
| 2cPt_red/STO | Fresh | 8.5 ± 0.4 | 2.727 ± 0.002 | 7.5 ± 0.3 | 5.8 ± 0.4 | 0.004 |
| Spent | 8.6 ± 0.4 | 2.737 ± 0.002 | 6.6 ± 0.3 | 5.6 ± 0.4 | 0.004 | |
| 2cPt_cal+red/STO | Fresh | 8.2 ± 0.8 | 2.711 ± 0.006 | 9.5 ± 0.7 | 5.0 ± 0.3 | 0.020 |
| Spent | 7.7 ± 0.4 | 2.716 ± 0.003 | 8.2 ± 0.3 | 4.3 ± 0.4 | 0.004 | |
| Pt metal | — | 12 | 2.765 ± 0.002 | 4.8 ± 0.2 | 7.6 ± 0.4 | 0.008 |
Conclusions
In this work, we have established a multi-cycle, SOMC-derived process by which Pt/STO catalysts can be synthesized from organometallic Pt precursors in a toluene solution. Prior to deposition, the STO support surface is calcined, ozonolysed, and steamed at 200 °C. MeCpPtMe3 and Pt(acac)2 were both grafted onto STO in toluene, and Pt(acac)2 was found to afford a significantly higher Pt loading. Deposition of Pt(acac)2 at 80 °C was found to be optimal because it produced the highest Pt loading and best homogeneity after surface decoration. This afforded samples with average Pt particle sizes of 1.3, 1.2, and 1.5 nm, corresponding to Pt loadings of 0.6 wt%, 1.1 wt%, and 1.6 wt% after 1, 2, and 3 cycles of deposition and reduction in H2, respectively. These data suggest that SOMC techniques, when applied in successive cycles, favor new particle deposition over increasing the size of existing particles.Two samples of 2cPt/STO, one which was reduced and another which was both calcined and reduced after synthesis, were tested for hydrogenolysis of isotactic polypropylene (Mn = 5 kDa, Mw = 12 kDa). The Pt/STO samples have average Pt particle sizes of around 1.2 and 1.0 nm, respectively, and afforded final upcycling products (all >95% yield) with molecular weights around 300 and 200 Da, respectively. This suggests that smaller supported Pt nanoparticles are generally more active for polyolefin hydrogenolysis, which is consistent with previous reports of plastic upcycling with the Pt/STO system. Overall, the results suggest that SOMC-derived Pt/STO catalysts meet several proof-of-concept criteria and have the potential to be commercially viable upcycling catalysts.
Conflicts of interest
There are no conflicts to declare.Acknowledgements
This work was supported as part of the Institute for Cooperative Upcycling of Plastics (iCOUP), an Energy Frontier Research Center funded by the U.S. Department of Energy, Office of Science, Basic Energy Sciences. This work was also partially supported by DOE/EERE/AMO and BETO for studies of catalytic hydrogenolysis of plastic waste (Award Number DE-EE0009300). Argonne National Laboratory is operated by UChicago Argonne LLC under Contract DE-AC-02-06CH11357 for the United States Department of Energy, and Ames Laboratory is operated by Iowa State University under Contract DE-AC-02-07CH11358 for the United States Department of Energy. The authors acknowledge the Materials Engineering Research Facility (MERF) at Argonne National Laboratory for synthetic contributions in the large-scale batch synthesis of STO nanocuboid supports. Use of the Advanced Photon Source is supported by the U.S. Department of Energy, Office of Science, and Office of the Basic Energy Sciences, under Contract No. DE-AC-02-06CH11357. MRCAT operations at Sector 10 are supported by the Department of Energy and the MRCAT member institutions. The EPR work at Argonne National Laboratory was supported by the U.S. Department of Energy (DOE), Office of Science, Office of Basic Energy Sciences, Division of Chemical Sciences, Geosciences, and Biosciences, under Contract No. DE-AC-02-06CH11357. Work performed at the Center for Nanoscale Materials including ACAT and Talos, a U.S. Department of Energy Office of Science User Facility, was supported by the U.S. DOE, Office of Basic Energy Sciences, under Contract No. DE-AC02-06CH11357. This work also made use of (i) the EPIC and BioCryo facilities of Northwestern University's NUANCE Center, which has received support from the Soft and Hybrid Nanotechnology Experimental (SHyNE) Resource (NSF ECCS-1542205); the MRSEC program (NSF DMR-1720139) at the Materials Research Center; the International Institute for Nanotechnology (IIN); the Keck Foundation; and the State of Illinois, through the IIN, (ii) CryoCluster equipment, which has received support from the MRI program (NSF DMR-1229693), and (iii) Jerome B. Cohen X-ray Diffraction Facility supported by the MRSEC program of the National Science Foundation (DMR-1720139) at the Materials Research Center of Northwestern University and the Soft and Hybrid Nanotechnology Experimental (SHyNE) Resource (NSF ECCS-1542205). The authors thank Dr Uddhav Kanbur for synthetic contributions, Dr Ahmed Farghaly for helpful discussions, and Dr Long Qi for the development and use of UPLC to analyze molecular weights of liquid samples.References
- R. Gaye, J. R. Jambeck and K. L. Law, Sci. Adv., 2017, 3(7), e1700782 CrossRef PubMed.
- A. L. Andrady, Mar. Pollut. Bull., 2011, 62, 1596–1605 CrossRef CAS PubMed.
- D. Eerkes-Medrano, R. C. Thompson and D. C. Aldridge, Water Res., 2015, 75, 63–82 CrossRef CAS PubMed.
- J. M. Garcia and M. L. Robertson, Science, 2017, 358, 870–872 CrossRef CAS PubMed.
- S. B. Borrelle, J. Ringma, K. Law, C. C. Monnahan, L. Lebreton, A. McGivern, E. Murphy, J. R. Jambeck, G. H. Leonard, M. A. Hilleary, M. Eriksen, H. P. Possingham, H. De Frong, L. R. Gerber, B. Polidoro, A. Tahir, M. Bernard, N. Mallos, M. Barnes and C. M. Rochman, Science, 2020, 369, 1515–1518 CrossRef CAS PubMed.
- L. Lebreton and A. Andrady, Palgrave Communications, 2019, 5, 6 CrossRef.
- S. M. Al-Salem, A. Antelaya, G. Constantinou, A. Manos and J. Dutta, Environ. Manage., 2017, 197, 177–198 CAS.
- K. V. Popov and V. D. Knyazev, J. Phys. Chem. A, 2015, 119, 11737–11760 CrossRef CAS PubMed.
- S. E. Levine and L. J. Broadbelt, Polym. Degrad. Stab., 2009, 94, 810–822 CrossRef CAS.
- G. Lopez, M. Artetxe, M. Amutio, J. Bilbao and M. Olazar, Renewable Sustainable Energy Rev., 2017, 73, 346–368 CrossRef CAS.
- P. A. Kots, B. C. Vance and D. G. Vlachos, React. Chem. Eng., 2022, 7, 41–54 RSC.
- B. C. Vance, P. A. Kots, C. Wang, Z. R. Hinton, C. M. Quinn, T. H. Epps, L. T. J. Korley and D. G. Vlachos, Appl. Catal., B, 2021, 299, 120483 CrossRef CAS.
- F. Zhang, M. Zeng, R. D. Yappert, J. Sun, Y. H. Lee, A. M. LaPointe, P. Peters, M. M. Abu-Omar and S. L. Scott, Science, 2020, 370, 437–441 CrossRef CAS PubMed.
- A. Tennakoon, X. Wu, A. L. Paterson, S. Patnaik, Y. Pei, A. M. LaPoint, S. C. Ammal, R. A. Hackler, A. Heyden, I. I. Slowing, G. W. Coates, M. Delferro, B. Peters, W. Huang, A. D. Sadow and F. A. Perras, Nat. Catal., 2020, 893–908 CrossRef CAS.
- J. E. Rorrer, G. T. Beckham and Y. Román-Leshkov, JACS Au, 2021, 1, 8–12 CrossRef CAS PubMed.
- Y. Nakaji, M. Tamura, S. Miyaoka, S. Kumagai, M. Tanji, Y. Nakagawa, T. Yoshioka and K. Tomishige, Appl. Catal., B, 2021, 286, 119805 CrossRef.
- J. E. Rorrer, C. Troyano-Valls, G. T. Beckham and Y. Román-Leshkov, ACS Sustainable Chem. Eng., 2021, 9, 11661–11666 CrossRef CAS.
- G. Celik, R. M. Kennedy, R. A. Hackler, M. Ferrandon, A. Tennakoon, S. Patnaik, A. M. LaPointe, S. C. Ammal, A. Heyden, F. A. Perras, M. Pruski, S. L. Scott, K. R. Poeppelmeier, A. D. Sadow and M. Delferro, ACS Cent. Sci., 2019, 5, 1795–1803 CrossRef CAS PubMed.
- I. L. Peczak, R. M. Kennedy, R. A. Hackler, Y. Shin, M. Delferro and K. R. Poeppelmeier, ACS Appl. Mater. Interfaces, 2021, 13(49), 58691–58700 CrossRef CAS PubMed.
- R. A. Hackler, K. Vyayhare, R. M. Kennedy, G. Celik, U. Kanbur, P. J. Griffin, A. D. Sadow, G. Zang, A. Elgowainy, P. Sun, K. R. Poeppelmeier, A. Erdemir and M. Delferro, ChemSusChem, 2021, 14, 4181–4189 CrossRef CAS PubMed.
- R. A. Hackler, J. V. Lamb, I. L. Peczak, R. M. Kennedy, A. M. LaPointe, K. R. Poeppelmeier, A. D. Sadow and M. Delferro, Macromolecules, 2022, 55(15), 6801–6810 CrossRef CAS.
- V. Capello, P. Sun, G. Zang, S. Kumar, R. A. Hackler, H. E. Delgado, A. Elgowainy, M. Delferro and T. Krause, Green Chem., 2022, 24, 6306–6318 RSC.
- S. T. Christensen, J. W. Elam, F. A. Rabuffetti, Q. Ma, S. J. Weigand, B. Lee, S. Seifer, P. C. Stair, K. R. Poeppelmeier, M. C. Hersam and M. J. Bedzyk, Small, 2009, 5(6), 750–757 CrossRef CAS PubMed.
- Y. Lin, J. Wen, L. Hu, R. M. Kennedy, P. C. Stair, K. R. Poeppelmeier and L. D. Marks, Phys. Rev. Lett., 2013, 111, 156101 CrossRef PubMed.
- J. A. Enterkin, W. Setthapun, J. Elam, S. T. Christensen, F. A. Rabuffetti, L. D. Marks, P. C. Stair, K. R. Poeppelmeier and C. L. Marshall, ACS Catal., 2011, 1, 629–635 CrossRef CAS.
- J. Enterkin, K. R. Poeppelmeier and L. D. Marks, Nano Lett., 2011, 11, 993–997 CrossRef CAS PubMed.
- Y. Yang, D. Zhang, W. Ji, F. Bi, L. Song and X. Zhang, J. Colloid Interface Sci., 2022, 606, 1811–1823 CrossRef CAS PubMed.
- P. Munnik, P. E. de Jongh and K. P. de Jong, Chem. Rev., 2015, 115(14), 6687–6718 CrossRef CAS PubMed.
- V. M. Koch, M. K. S. Barr, P. Buttner, I. Minguez-Bacho, D. Dohler, B. Winzer, E. Reinhardt, D. Segets and J. Bachmann, J. Mater. Chem. A, 2019, 7, 25112–25119 RSC.
- J. Fitchner, Y. Wu, J. Hitzenberger, T. Drewello and J. Bachmann, J. Solid State Sci. Technol., 2017, 6(9), N171–N175 CrossRef.
- B. P. Le Monnier, F. Wells, F. Talebkeikhah and J. S. Luterbacher, Adv. Mater., 2019, 31(52), 1904276 CrossRef CAS PubMed.
- S. P. Zankowski, L. van Hoecke, F. Mattelaer, M. de Raedt, O. Richard, C. Detavernier and P. M. Vereecken, Chem. Mater., 2019, 31(13), 4805–4816 CrossRef CAS.
- Y. Wu, D. Dohler, M. Barr, E. Oks, M. Wolf, L. Santinacci and J. Bachmann, Nano Lett., 2015, 15(10), 6379–6385 CrossRef CAS PubMed.
- R. J. Witzke, A. Chaptoevsky, M. P. Conley, D. M. Kaphan and M. Delferro, ACS Catal., 2020, 10(20), 11822–11840 CrossRef CAS.
- M. Stalzer, M. Delferro and T. J. Marks, Catal. Lett., 2015, 145, 3–14 CrossRef CAS.
- C. Coperet, A. Comas-Vives, M. P. Conley, D. P. Estes, A. Fedorov, V. Mougel, H. Nagae, F. Nuñez-Zarur and P. Zhizhko, Chem. Rev., 2016, 116, 323–421 CrossRef CAS PubMed.
- J. D. A. Pelletier and J. M. Basset, Acc. Chem. Res., 2016, 49, 664–677 CrossRef CAS PubMed.
- C. Coperet, A. Federovo and P. A. Zhizhko, Catal. Lett., 2017, 147, 2247–2259 CrossRef CAS.
- C. Coperet, F. Allouche, K. W. Chan, M. P. Conley, M. F. Delley, A. Fedorov, I. B. Moroz, V. Mougel, M. Pucino, K. Searles, K. Yamamoto and P. A. Zhizhko, Angew. Chem., Int. Ed., 2018, 57, 6398–6440 CrossRef CAS PubMed.
- M. S. Ferrandon, C. Byron, G. Celik, Y. Zhang, C. Ni, J. Sloppy, R. A. McCormick, K. Booksh, A. V. Teplyakov and M. Delffero, Appl. Catal., A, 2022, 629, 118379 CrossRef CAS.
- K. R. Poeppelmeier, T. D. Trowbridge and J.-L. Kao, US Pat., 4568656, February 4, 1986 Search PubMed.
- S. J. Tauster, A. A. Montagna, J. J. Steger, S. C. Fung and V. R. Cross, US Pat., 4634517, January 6, 1987 Search PubMed.
- S. J. Tauster and J. J. Steger, J. Catal., 1990, 125, 387–389 CrossRef CAS.
- J. P. Marques, I. Gener, P. Ayrault, J. C. Bordado, J. M. Lopes, F. Ramôa Ribeiro and M. Guisnet, Microporous Mesoporous Mater., 2003, 1(60), 251–262 CrossRef.
- I. Batonnaeu-Gener, A. Yonli, S. Hazael-Pascal, J. Pedro Marques, J. Madeira Lopes, M. Guisnet, F. Ramôa Ribeiro and S. Mignard, Microporous Mesoporous Mater., 2008, 110(2), 480–487 CrossRef.
- H. Son, S. J. Lee, A. Soon, H.-S. Roh and H. Lee, Appl. Catal., B, 2013, 134, 103–109 CrossRef.
- R. R. Shrock, J. Organomet. Chem., 1976, 122(2), 209–225 CrossRef.
- A. Zagdoun, G. Casano, O. Ouari, M. Schwarzwalder, A. J. Rossini, F. Aussenac, M. Yulikov, G. Jeschke, C. Copéret, A. Lesage, P. Tordo and L. Emsley, J. Am. Chem. Soc., 2013, 135(34), 12790–12797 CrossRef CAS PubMed.
- F. A. Perras, T. Kobayashki and M. Pruski, J. Am. Chem. Soc., 2015, 137(26), 8336–8339 CrossRef CAS PubMed.
- X. Zhao, W. Hoffbauer, J. S. auf der Gunne and M. H. Levitt, Solid State Nucl. Magn. Reson., 2004, 26(2), 57–64 CrossRef CAS PubMed.
- H. Nagashima, J. Trébosc, Y. Kon, K. Sato, O. Lafon and J.-P. Amoureux, J. Am. Chem. Soc., 2020, 142(24), 10659–10672 CrossRef CAS PubMed.
- F. A. Perras, K. C. Boteju, I. I. Slowing, A. D. Sadow and M. Pruski, Chem. Commun., 2018, 54, 3472–3475 RSC.
- F. H. Larsen, J. Skibsted, H. J. Jakobsen and N. C. Nielsen, J. Am. Chem. Soc., 2000, 122(29), 7080–7086 CrossRef CAS.
- A. Bielecki, A. C. Kolbert and M. H. Levitt, Chem. Phys. Lett., 1989, 155(4–5), 341–346 CrossRef CAS.
- A. Venkatesh, D. Gioffre, B. A. Atterberry, K. Rochlitz, S. L. Carnahan, Z. Wang, G. Menzildjian, A. Lesage, C. Copéret and A. J. Rossini, J. Am. Chem. Soc., 2022, 144(30), 13511–13525 CrossRef CAS PubMed.
- S. J. Clark, M. D. Segall, C. J. Pickard, P. J. Hasnip, M. I. J. Probert and K. Refson, Zeitschrift für Kristallographie – Crystalline Materials, 2005, 220, 567–570 CrossRef CAS.
- D. Vanderbilt, Phys. Rev. B: Condens. Matter Mater. Phys., 1990, 41, 7892–7895 CrossRef PubMed.
- J. P. Perdew, K. Burke and M. Ernezkhof, Phys. Rev. Lett., 1996, 77, 3865–3868 CrossRef CAS PubMed.
- S. Grimme, Comput. Chem., 2006, 27(15), 1787–1799 CrossRef CAS PubMed.
- C. J. Pickard and F. Mauri, Phys. Rev. B: Condens. Matter Mater. Phys., 2001, 63, 245101 CrossRef.
- J. R. Yates, C. J. Pickard and F. Mauri, Phys. Rev. B: Condens. Matter Mater. Phys., 2007, 76, 024401 CrossRef.
- W. S. Rasband, ImageJ, U. S. National Institutes of Health, Bethesda, Maryland, USA, 1997–2018, https://imagej.nih.gov/ij/ Search PubMed.
- (a) B. Ravel and M. Newville, J. Synchrotron Radiat., 2005, 12, 537–541 CrossRef CAS PubMed; (b) T. B. Bolin, T. Wu, N. Schweitzer, R. Lobo-Lapidus, A. J. Kropf, H. Wang, Y. Hu, J. T. Miller and S. M. Heald, Catal. Today, 2013, 205, 141–147 CrossRef CAS.
- F. A. Rabuffetti, H.-S. Kim, J. A. Enterkin, Y. Wang, C. H. Lanier, L. D. Marks and K. R. Poeppelmeier, Chem. Mater., 2008, 20, 5628–5635 CrossRef CAS.
- T. K. Andersen, D. D. Fong and L. D. Marks, Surf. Sci. Rep., 2018, 73, 213–232 CrossRef CAS.
- L. A. Crosby, B.-R. Chen, R. M. Kennedy, J. Wen, K. R. Poeppelmeier, M. J. Bedzyk and L. D. Marks, Chem. Mater., 2018, 30, 841–846 CrossRef CAS.
- D. M. Kienzle and L. D. Marks, CrystEngComm, 2012, 14, 7833–7839 RSC.
- L. D. Marks and L. Peng, J. Phys.: Condens. Matter, 2016, 28, 053001 CrossRef CAS PubMed.
- L. Crosby, J. Enterkin, F. A. Rabuffetti, K. R. Poeppelmeier and L. D. Marks, Surf. Sci., 2015, 632, L22–L25 CrossRef CAS.
- L. Bai, F. Polo-Garzon, Z. Bao, S. Luo, B. M. Moskowitz, H. Tian and Z. Wu, ChemCatChem, 2019, 11, 2107–2117 CrossRef CAS.
- G. S. Foo, Z. D. Hood and Z. Wu, ACS Catal., 2018, 8(1), 555–565 CrossRef CAS.
- Z. Bao, V. Fung, F. Polo-Garzon, Z. D. Hood, S. Cao, M. Chi, L. Bai, D. Jiang and Z. Wu, J. Catal., 2020, 384, 49–60 CrossRef CAS.
- Z. Zhang, L. Li and J. C. Yang, J. Phys. Chem. C, 2013, 117, 21407–21412 CrossRef CAS.
- F. Grillo, H. Vanbui, D. La Zara, A. A. I. Arnink, A. Y. Kovalgin, P. Kooyman, M. T. Kreutzer and J. R. van Ommen, Small, 2018, 14, 1800765 CrossRef PubMed.
- M. M. Lencka and R. E. Riman, Chem. Mater., 1993, 5, 61–70 CrossRef CAS.
- M. M. Lencka and R. E. Riman, Chem. Mater., 1995, 7(1), 18–25 CrossRef CAS.
- M. M. Lencka and R. E. Riman, Ferroelectrics, 1994, 151, 159–164 CrossRef CAS.
- M. Crespin and W. K. Hall, J. Catal., 1981, 69(2), 359–370 CrossRef CAS.
- (a) N. Domingo, E. Pach, K. Cordero-Edward, V. Pérez-Dieste, C. Escudero and A. Veradguer, Phys. Chem. Chem. Phys., 2019, 21(9), 4920–4930 RSC; (b) A. E. Becerra-Toledo, J. A. Enterkin, D. M. Kienzle and L. D. Marks, Surf. Sci., 2012, 606(9–10), 791–802 CrossRef CAS.
- A. E. Becerra-Toledo, M. R. Castell and L. D. Marks, Surf. Sci., 2012, 606(7–8), 762–765 CrossRef CAS.
- D. M. Kienzle, A. E. Becerra-Toledo and L. D. Marks, Phys. Rev. Lett., 2011, 106, 176102 CrossRef CAS PubMed.
- D. Astruc, Nanoparticles and Catalysis, Wiley-VCH, Weinheim, 2008 Search PubMed.
- B. K. Hodnett, Heterogeneous Catalytic Oxidation, Wiley, West Sussex, 2000 Search PubMed.
- C. Dossi, R. Pasro, A. Bartsch, E. Brivio, A. Galadsco and P. Losi, Catal. Today, 1993, 17, 527–535 CrossRef CAS.
- H. Miura, Catal. Today, 1996, 215–221 CrossRef CAS.
- W. Setthapun, W. D. Williams, S. M. Kim, H. Feng, J. W. Elam, F. A. Rabuffetti, K. R. Poeppelmeier, P. C. Star, E. A. Stach, F. H. Ribeiro, J. T. Miller and C. L. Marshall, J. Phys. Chem. C, 2010, 21, 9758–9771 CrossRef.
- J. Camacho-Bunquin, M. Ferrandon, H. Sohn, D. Yang, C. Liu, P. A. Ignacio-de-Leon, F. A. Perras, M. Pruski, P. C. Stair and M. Delferro, J. Am. Chem. Soc., 2018, 140(11), 3940–3951 CrossRef CAS PubMed.
- A. Jentys, Phys. Chem. Chem. Phys., 1999, 1, 4059–4063 RSC.
- M. S. Martín González, M. H. Aguirre, E. Morán, M. Á. Alario-Franco, V. Perez-Dieste, J. Avila and M. C. Asensio, Solid State Sci., 2000, 2, 519–524 CrossRef.
- F. Grillo, H. Van Bui, D. La Zara, A. A. I. Aarnink, A. Y. Kovalgin, P. Kooyman, M. T. Kreutzer and J. R. van Ommen, Small, 2018, 14, 1800765 CrossRef PubMed.
- G. Bergeret and P. Gallezot, Particle Size and Dispersion Measurement, in Handbook of Heterogeneous Catalysis, 2008, pp. 738–765 Search PubMed.
- A. Enterkin, R. M. Kennedy, J. Lu, J. W. Elam, R. E. Cook, L. D. Marks, P. C. Stair, C. L. Marshall and K. R. Poeppelmeier, Top. Catal., 2013, 56, 1829–1834 CrossRef.
- J. R. Gallagher, T. Li, H. Zhao, J. Liu, Y. Lei, X. Zhang, Y. Ren, J. W. Elam, R. J. Meyer and R. E. Winans, Catal. Sci. Technol., 2014, 4(9), 3053–3063 RSC.
Footnotes |
| † Electronic supplementary information (ESI) available. See DOI: https://doi.org/10.1039/d2ta08133d |
| ‡ Present address: National Magnetic Resonance Facility at Madison, University of Wisconsin-Madison, Madison, Wisconsin 53706, USA. |
| This journal is © The Royal Society of Chemistry 2023 |


