
 Open Access Article
 This Open Access Article is licensed under a
 Creative Commons Attribution 3.0 Unported Licence
In-depth structural characterization of the influence of Li+ excess on spherical, Co-free layered LiMn0.5Ni0.5O2 cathode material using correlative Raman–SEM microscopy†
Florian
Klein
 a,
Claudia
Pfeifer
a,
Philipp
Scheitenberger
b,
Lukas
Pfeiffer
a,
Dominik
Zimmer
c,
Margret
Wohlfahrt-Mehrens
a,
Mika
Lindén
*b and
Peter
Axmann
*a
a,
Claudia
Pfeifer
a,
Philipp
Scheitenberger
b,
Lukas
Pfeiffer
a,
Dominik
Zimmer
c,
Margret
Wohlfahrt-Mehrens
a,
Mika
Lindén
*b and
Peter
Axmann
*a
aZentrum für Sonnenenergie- und Wasserstoffforschung Baden-Württemberg (ZSW), Helmholtzstrasse 8, Ulm D-89081, Germany. E-mail: peter.axmann@zsw-bw.de
bInstitute for Inorganic Chemistry II, Ulm University, Albert-Einstein-Allee 11, Ulm D-89081, Germany. E-mail: mika.linden@uni-ulm.de
cOxford Instruments GmbH, Borsigstr. 15A, Wiesbaden 65205, Germany
First published on 26th January 2023
Abstract
A series of different spherical Co-free Li1+x(Mn0.5Ni0.5)1−xO2 powders with 0 ≤ x ≤ 0.16 was synthesized to investigate the effect of excess Li+ on the host structure of LiMn0.5Ni0.5O2. Structural investigation with XRD shows less Li+/Ni2+ disordering and strong broadening of the pattern indicating phase separation with increasing x. A deeper understanding of the structural changes was gained from a combined approach of SEM, EDX and Raman microscopy. A phase separation into Ni-rich and Li-/Mn-rich layered oxide domains could be proven. In the investigated series, the best electrochemical performance was obtained for Li1.07(Mn0.5Ni0.5)0.93O2 with a stable specific discharge capacity of 173 mAh g−1 (658 Wh kg−1, 12 mA g−1) after 40 cycles. The presented results strongly highlight the strength of correlating chemical (EDX), structural (Raman) and morphological (SEM) information with sub-micrometer lateral resolution for the development and understanding of future battery materials.
Introduction
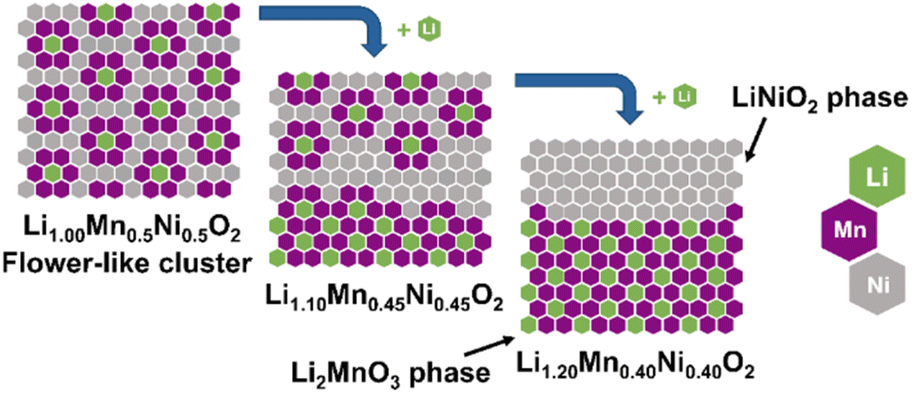
State-of-the-art layered lithium transition metal oxides, e.g. Li(Ni1−x−yMnxCoy)O2 (NMC) with high Ni content, are the most popular cathode material class for lithium ion battery (LIB) application.1 In 2001, several important papers were published by Dahn and Lu on Li(NixCo1−2xMnx)O2 (x = 1/4, 3/8) as well as by Ohzuku on LiNi1/3Mn1/3Co1/3O2 and LiMn0.5Ni0.5O2 with promising cycling performance.2–5 Particularly, the work of Ohzuku demonstrated the possibility to reduce the Ni compared to nowadays state-of-the-art Ni-rich compounds and to remove Co from the structure with stable discharge capacities of approximately 200 mAh g−1 for LiMn0.5Ni0.5O2, which will both reduce cost and critical raw material demand.3,6–9 Therefore, it is very important to further investigate and understand the structural diversity of the materials, represented in the Li–Ni–Mn–O phase diagram.10 In the past, many groups have intensively studied different regions of the phase diagram. Besides the spinel material with a general formula of Li(NixMn2−x)O4 (0 ≤ x ≤ 0.5),11,12 there are two further noteworthy cathode material classes in the ternary phase diagram with layered structures (Fig. 1): Li(Ni1−yMny)O2 (0 ≤ y ≤ 0.5, red line)13–16 and z Li2MnO3·(1 − z) LiMn0.5Ni0.5O2 (0 ≤ z ≤ 1.0, LRLO, green line).17–19 Obviously, the material with a composition of LiMn0.5Ni0.5O2 seems to be highly important for both layered systems and is from a structural point of view the end member of the solid solution of Li(Ni1−yMny)O2 (0 ≤ y ≤ 0.5, red line), which is isostructural to the α-NaFeO2 type with the space group R![[3 with combining macron]](https://www.rsc.org/images/entities/char_0033_0304.gif) m.13 Up to 50% of the Ni sites of LiNiO2 can be replaced by redox inactive Mn4+ ions without changing the structure.13,14,16 For charge compensation each Mn4+ ion requires an equivalent amount of Ni2+, thereby stabilizing the host structure.20 Consequently, LiMn0.5Ni0.5O2 is the most stable phase containing only Ni2+ and Mn4+ ions in its solid solution.16 Unfortunately, the Li+/Ni2+ cation disorder is particularly pronounced for LiMn0.5Ni0.5O2 (≈10%).21 In the literature, the combination of the high amount of Ni2+ ions in the structure and the high affinity of Mn and Li to each other is reported to be the reason for the formation of flower-like clusters in the TM layer (Fig. 2, left scheme).22–25 As a consequence of the clustering, LiMn0.5Ni0.5O2 shows a lower electrochemical performance due to the resulting kinetic limitations.16,19,26,27 Nevertheless, high specific discharge capacities are reported in a broad range from 150 to 200 mAh g−1.3,18,21,26,28–32
m.13 Up to 50% of the Ni sites of LiNiO2 can be replaced by redox inactive Mn4+ ions without changing the structure.13,14,16 For charge compensation each Mn4+ ion requires an equivalent amount of Ni2+, thereby stabilizing the host structure.20 Consequently, LiMn0.5Ni0.5O2 is the most stable phase containing only Ni2+ and Mn4+ ions in its solid solution.16 Unfortunately, the Li+/Ni2+ cation disorder is particularly pronounced for LiMn0.5Ni0.5O2 (≈10%).21 In the literature, the combination of the high amount of Ni2+ ions in the structure and the high affinity of Mn and Li to each other is reported to be the reason for the formation of flower-like clusters in the TM layer (Fig. 2, left scheme).22–25 As a consequence of the clustering, LiMn0.5Ni0.5O2 shows a lower electrochemical performance due to the resulting kinetic limitations.16,19,26,27 Nevertheless, high specific discharge capacities are reported in a broad range from 150 to 200 mAh g−1.3,18,21,26,28–32
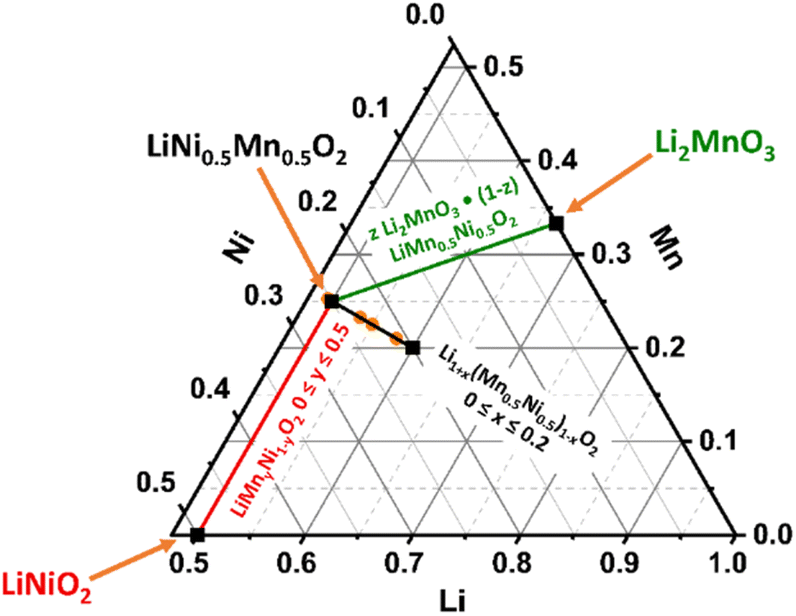 | ||
| Fig. 1 Schematic compositional diagram of the Li–Mn–Ni–O ternary system (Li + Mn + Ni = 1) with selected structures: Li(Ni1−xMnx)O2 (0 ≤ x ≤ 0.5, red), z Li2MnO3·(1 − z) LiMn0.5Ni0.5O2 (0 ≤ z ≤ 0.5, green) and Li1+x(Mn0.5Ni0.5)1−xO2 (0 ≤ x ≤ 0.2, black). The elemental compositions of the powders investigated in this study are dotted in orange. | ||
 | ||
| Fig. 2 Schematic illustration of a hypothetical complete phase separation in the transition metal layer with increased Li+ content in Li1+x(Mn0.5Ni0.5)1−xO2. The proposed flower-like structure is based on first-principle calculations by the group of Ceder.23 | ||
In general, the synthesis route for LiMn0.5Ni0.5O2, including the calcination procedure, temperature26,28,33,34 and the used Li+/TM ratio during the synthesis,28,32,34–36 significantly influences the electrochemical performance. The Li+/TM ratio is reported to be a prominent key factor for this material.37,38 Therefore, it is important to understand the reason for the increased specific capacity of LiMn0.5Ni0.5O2 with Li+ excess in the structure, which is represented by the chemical formula of Li1+x(Mn0.5Ni0.5)1−xO2 (0 ≤ x ≤ 0.2, Fig. 1, black line).32,35,38,39 Myung et al. showed with neutron diffraction that the excess Li+ was completely incorporated into the structure (0 ≤ x ≤ 0.06).38 In the following years, it was shown by XRD that the Li+/Ni2+ cation disordering decreases with increasing Li+ excess and that Li+ excess can suppress layer–layer composite formation during synthesis (0.06 ≤ x ≤ 0.16), which increases the specific discharge capacity.10,37
Nevertheless, a critical view on the diffraction patterns of Bian et al.32 shows a broadening of the reflections with increasing Li+ excess, which likely could indicate a phase separation into related crystallographic phases with similar lattice parameters, such as LiMn0.5Ni0.5O2 related layered stoichiometric (red line) and layered Li–Mn-rich oxides (green line). It is debatable whether the excess Li+ ions are incorporated in the TM layer in the form of a solid solution of Li, Mn and Ni ions or if there is an excess Li+ induced phase separation. Unfortunately, the SEM images of powders with high Li+ excess are rare to prove a possible macroscopic phase separation.35,40 However, the images of Kurilenko et al. indicate homogeneous crystallite morphology for x ≈ 0.13–0.16 after calcination at 900 °C using pelletized samples.35
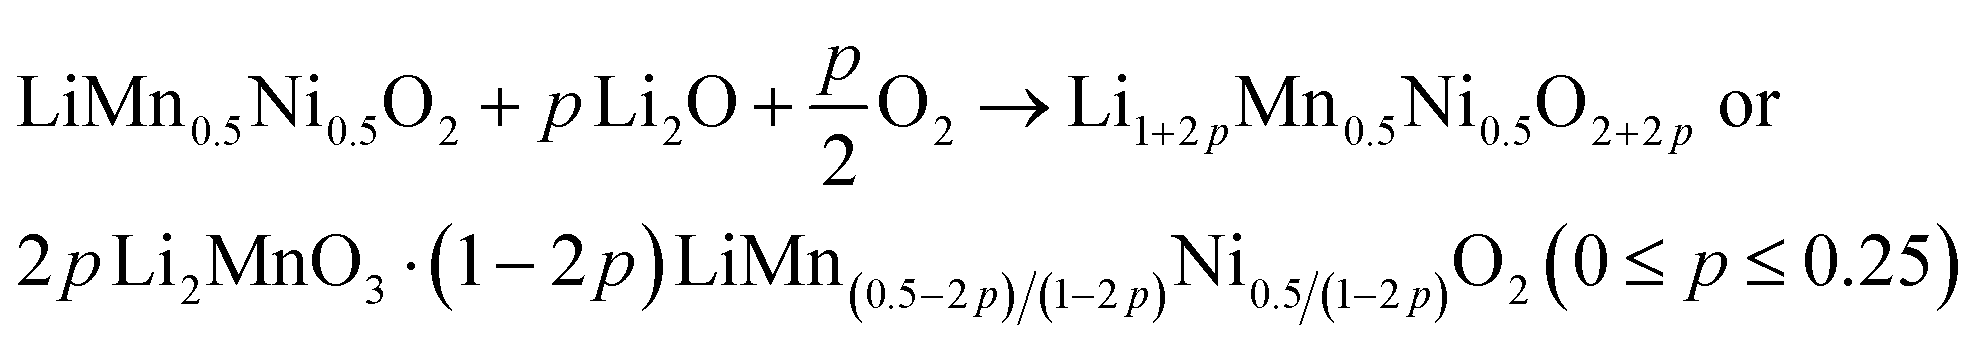
Overall, the discussion shows the structural complexity of the Li1+x(Mn0.5Ni0.5)1−xO2 system and the strong influence of the synthesis route. Therefore, the possibility of a Li+ induced phase separation needs to be considered from a structural point of view: increasing the excess Li+x in the stoichiometric formula Li1+x(Mn0.5Ni0.5)1−xO2 leads to a higher Li+ content in the TM layer and thereby theoretically to more Li2MnO3 clusters.25 The cluster formation concentrates the Mn ions locally and consequently creates a Mn depletion in the directly surrounding area, forming Ni-enriched areas.32 This hypothesis is described by eqn (1) below with the end members LiMn0.5Ni0.5O2 (p = 0, equates to x = 0) and 0.5 Li2MnO3·0.5 LiNiO2 (p = 0.25, equates to x = 0.2) (Fig. 2):
 | (1) |
To the best of our knowledge the length scale of this possible phase separation, whether it is on atomic scale within the lattice, on the microstructure level or on macroscopic scale, has not been fully investigated yet. In this work, the influence of excess Li+ on the structural homogeneity of Li1+x(Mn0.5Ni0.5)1−xO2 for a spherical shaped precursor was investigated, using a combination of different microscopy techniques to analyze the local structure and particle morphology with respect to a possible phase separation. The structural characterization was combined with electrochemical measurements to fully interpret the results.
Experimental
Synthesis of the powders
The Mn0.5Ni0.5(OH)2 precursor powder was synthesized via a scalable coprecipitation route. In a continuous stirred tank reactor (CSTR, V = 500 mL) a solution of Ni(NO3)2·6 H2O and Mn(NO3)2·4 H2O (both Roth) was mixed under vigorous stirring with a NH4OH (Roth) and NaOH (Roth) solution. The pH of the suspension was kept constant at ≈10. The excess suspension was removed from the reactor and filtered continuously. The obtained spherical precursor powder (Mn/Ni = 1.00![[thin space (1/6-em)]](https://www.rsc.org/images/entities/char_2009.gif) :1.00) was washed extensively with deionized water and dried. Subsequently, the precursor material was mixed with various stoichiometric amounts of LiOH·H2O (Roth, for the Li/M ratio see the theoretical values given in Table 1). After a pre-calcination step at 600 °C (4 h), the final calcination step was conducted at 1000 °C (12 h) under air.
:1.00) was washed extensively with deionized water and dried. Subsequently, the precursor material was mixed with various stoichiometric amounts of LiOH·H2O (Roth, for the Li/M ratio see the theoretical values given in Table 1). After a pre-calcination step at 600 °C (4 h), the final calcination step was conducted at 1000 °C (12 h) under air.
| Theoretical Li content | ICP-OES | Mean TM OS | Lattice parameters | Li+/Ni2+/% | ||||
|---|---|---|---|---|---|---|---|---|
| Li | Mn | Ni | a/Å | c/Å | ||||
| Li1.00 | 1.00 | 0.99 | 0.50 | 0.50 | 3.02 | 2.890 | 14.306 | 10 |
| Li1.07 | 1.06 | 1.07 | 0.46 | 0.46 | 3.17 | 2.880 | 14.289 | 8 |
| Li1.10 | 1.11 | 1.10 | 0.45 | 0.45 | 3.27 | 2.874 | 14.272 | 7 |
| Li1.16 | 1.20 | 1.16 | 0.42 | 0.42 | 3.33 | 2.867 | 14.255 | 6 |
Chemical and structural characterization
The chemical characterization of the powders was conducted via the inductively coupled plasma optical emission spectroscopy (ICP-OES) of a diluted aqua regia digestion (Spectro Arcos SOP) and cerimetric redox titration. The latter was divided into two steps: (a) determination of the amount of transition metal in the powders via complexometric back titration of Na–EDTA with a Cu(II) solution, buffering the pH with NH4+/NH3 buffer and (b) digestion of the powders in an acidic (NH4)2Fe(SO4)2 solution under nitrogen. The remaining Fe(II) was back titrated with acidic Ce(SO4)2 solution. Powder X-ray diffraction (XRD) measurements were performed using a D8 Advance diffractometer (Bruker AXS, Bragg–Brentano geometry in reflection mode, Cu-Kα radiation, LYNXEYE_XE detector). The diffraction patterns of the materials were refined using TOPAS V6 (Bruker) based on the structural model of LiMn0.5Ni0.5O2 of Bréger et al. and the model of Stephens.41,42 Scanning electron microscopy (SEM) was carried out using a Leo 1530VP (Zeiss) microscope equipped with a Schottky thermal emitter field. Images were taken at an acceleration voltage of 5 kV with an Everhart–Thornley detector. The elemental distribution was analyzed with energy dispersive X-ray spectroscopy (EDX, X-Max50, Oxford Instruments). The particle cross-sections were prepared by mixing the powders with an epoxy resin, depositing the mixture on a support substrate and polishing the surface with a broad Ar+ ion beam milling system (IM4000Plus, Hitachi). Raman investigations of the powders and the cross-sections were carried out with an alpha300 R confocal Raman microscope (WITec) over a spectral range between −70 and 1108 rel. cm−1. An Nd:YAG laser with an excitation wavelength of 532 nm was used. The laser power was adjusted to 1.5 mW after microscope transit. The spectrometer was equipped with a grating of 1800 lines mm−1 and a CCD-camera (1600 × 200 pixels). An objective with a magnification of 100× (Zeiss) was used. The particle mappings were evaluated with the software Project FIVE (WITec). For the evaluation of the peak positions, all spectra were fitted with up to three Lorentzian peak profiles.More detailed chemical and crystallographic investigation of the Li1.16 microstructure was performed via SEM in combination with EDX and electron backscatter diffraction (EBSD). The measurements were conducted on a Zeiss GeminiSEM 450 field-emission (FE) SEM (Zeiss), equipped with an Ultim Max 170 (Oxford Instruments) large area silicon drift detector (SDD) for EDX and a fiber optic-based CMOS EBSD camera Symmetry S2 (Oxford Instruments).
Simultaneous EBSD/EDX mappings were performed at 15 kV accelerating voltage, a beam current of 4 nA, a step size of 30 nm, a total pixel count of about 1.5 million pixels, an electron backscatter diffraction pattern (EBSP) resolution of 622 × 512 pixels and an illumination time per pattern of 1.4 ms (electron dose 5.6 nAms). For indexation, 11 bands were taken into account using Hough-space-based indexation with a resolution of 1.06° per pixel in the theta direction. The dataset was indexed based on the crystal structure of LiMn0.5Ni0.5O2 (SG 166, Rm, a = 2.8879 Å, c = 14.269 Å).41 The EBSD results were further improved using a pattern matching method, as implemented in the AztecCrystal MapSweeper Software (Oxford Instruments). Here each experimental EBSD pattern is matched to simulated pattern templates based on full dynamical pattern simulations in order to improve the angular precision of the orientation measurement and to correct for systematic indexing errors.
Electrochemical characterization
For each powder, a homogeneous slurry of active material, conductive carbon SuperP (Timcal) and polyvinylidene difluoride (PVdF, Solef 5130, Solvay) (dry ratio of 91:5:4), dispersed in an adequate amount of N-methyl-2-pyrrolidinone, (NMP, Sigma Aldrich) was coated on an aluminum foil using the doctor blade technique. After drying under vacuum, the electrodes were calendered to a thickness of approximately 70 μm, disk electrodes with a diameter of 12 mm were punched, dried overnight under dynamic vacuum (120 °C) and were transferred directly without contact to air into an argon-filled glovebox (MBraun, O2 and H2O < 0.1 ppm). Coin cells (CR2032, Hohsen) were assembled with a disk electrode, two glass fiber separators (16 mm diameter, Whatman), a lithium metal foil (450 μm, 12 mm diameter) and ethylene carbonate (EC) and dimethyl carbonate (DMC) containing electrolyte (150 μL, 1 M LiPF6 in EC:DMC = 1:1 by wt). The electrodes have a typical active material loading between 9 and 10 mg. The cells were cycled between 2.5 and 4.7 V at room temperature with an applied current of 12 mA g−1 using a BaSyTec galvanostat. The specific capacities are mean values of at least three cells. The optimization of the electrolyte was conducted using two further mixtures containing ethyl methyl carbonate (EMC) and vinylene carbonate (VC) (both 150 μL, 1 M LiPF6): EC:EMC (3:7 by wt) and EC:EMC (3:7 by wt) + 2 wt% VC. Long-term cycling performance was investigated with an applied current of 32 mA g−1 in combination with repetitive cycles at 12 mA g−1. After constant current delithiation up to the upper cut-off voltage, a constant voltage step at 4.7 V was conducted with a current limit of 12 mA g−1 and 8 mA g−1, respectively.
Results and discussion
Chemical and structural characterization
The investigated powders were synthesized via calcination of a dense, coprecipitated (Mn0.5Ni0.5)(OH)2 precursor with spherical morphology (Fig. S1, ESI†), using different amounts of Li+ (Li/TM = 1, 9/8, 5/4, 3/2). ICP-OES measurements were used to analyze the Li+–TM ratio and to quantify the Li+ loss during synthesis (Table 1). The as-prepared samples are abbreviated following their Li+ stoichiometry after synthesis, e.g., Li1.10 corresponds to Li1.10(Mn0.5Ni0.5)0.9O2. Up to Li1.10 the Li+ content of the synthesized powders matches closely with the lithium content during synthesis, while for Li1.16 the Li+ content strongly decreased during the heat-treatment from 1.20 to 1.16. The Mn/Ni ratio remained constant for all materials. The reason for the loss of Li+ during calcination is well known and can be assigned to the evaporation of surface Li2O.43,44 Interestingly, only the sample with the highest Li+ content showed a significant Li+ loss. This indicates that the incorporation of extra Li+ is more hindered with increased Li+ content. Possible impurities on the particle surface, originating from structurally not incorporated Li+ and the preservation of the spherical particle morphology, were investigated via SEM (Fig. 3). Generally, the spherical particle shape of the hydroxide precursors is well preserved after thermal lithiation. Nevertheless, there are morphological differences between the different powders, dependent on their Li+ content. The samples with stoichiometric Li+ content or a small excess, Li1.00 and Li1.07, exhibited relatively smooth surfaces with defined primary particles of a few-hundred nanometers in size. The primary particles themselves did not have specific crystal facets, but have kind of a molten appearance. The samples with a higher Li+ excess, Li1.10 and Li1.16, show more heterogeneous surfaces and partially strong agglomeration of the secondary particles. This is in accordance with the mechanical characteristics of the freshly calcined samples: While Li1.00 and Li1.06 were received as powders, Li1.10 and especially Li1.16 sintered strongly and had to be ground intensively before further characterization.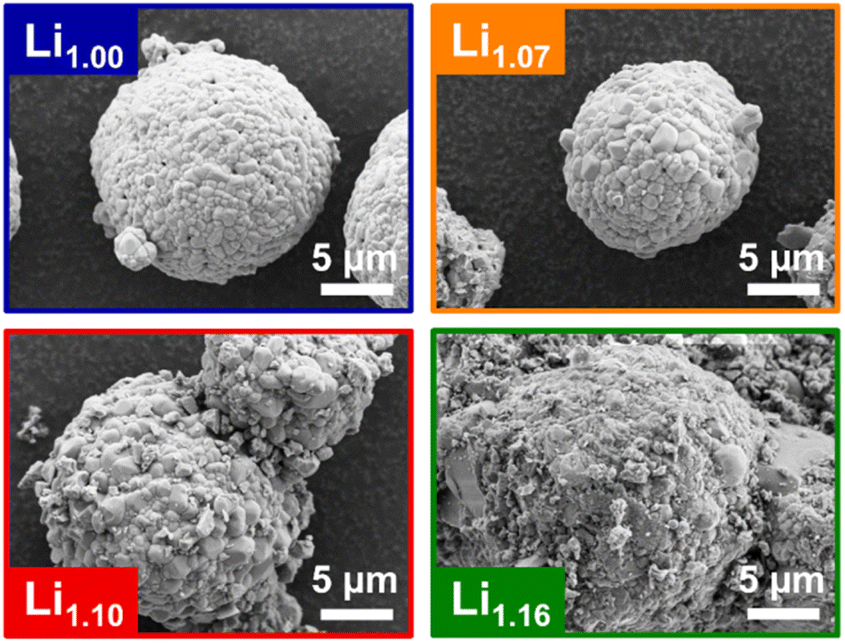 | ||
| Fig. 3 SEM images of the synthesized powders Li1.00 (blue), Li1.07 (orange), Li1.10 (red) and Li1.16 (green) showing the agglomeration behavior and the increase of surface heterogeneities. | ||
In addition, some of the particles of Li1.16 indicate areas with strong crystal growth and primary particles in the micrometer-size range. These observations suggest that Li+ excess plays an important role during the conversion of the precursor into the lithiated layered oxides.
The incorporation of excess Li+ into the structure was investigated by XRD and cerimetric redox back-titration. The latter method was used to analyze the mean TM oxidation state (OS) of the powders (Fig. 4a, Table 1). Theoretically, the average TM OS has to increase with the amount of incorporated Li+ ions into the lattice, in order to maintain charge neutrality. Plotting the mean OS of the TM against the amount of Li+ per formula (ICP-OES), an increase of the OS in the range of the theoretically calculated ones (red line) is observable. Further structural analysis of the materials was carried out by XRD (Fig. 4b and c). The complete patterns are presented in the ESI (Fig. S2a†). Generally, the powders show a typical layered oxide pattern of the α-NaFeO2 type. Consequently, most of the reflections can be assigned to a hexagonal crystal structure with the space group Rm. Impurities like Li2CO3 were not observable. Additional reflections were visible in the 2θ range between 20 and 25°. The presence of these additional reflections is indicative of LiMn6 clustering in the transition metal (TM) layer, e.g., in Li2MnO3 type materials, and the flower-like clustering of Li1.00, as already reported by the group of Ceder.23 The intensity of the honeycomb superstructure reflections increased and all reflections shifted towards higher 2θ angles with increased amount of excess Li+ in the lattice. This indicates an increased amount of Li+ in the TM layer as well as a decrease of at least one lattice parameter. The lattice parameters were determined by Rietveld refinement using TOPAS V6 and a LiMn0.5Ni0.5O2 structure model, which allows incorporating Ni2+ ions on Li sites and vice versa (Fig. S3, Table S1†).41,46,47 All excess Li+ was assumed to be incorporated into the TM layer (3b) and its occupancy (3b) was fixed to a value of one. Both lattice parameters decrease with a higher Li+ content in the structure (Fig. 4c, Table 1). This is in accordance with trends reported in the literature.32,38 A comparison of the single lattice parameters of LiMn0.5Ni0.5O2 (a = 2.891 Å, c = 14.301 Å),21 Li2MnO3 (a = 2.843 Å, c = 14.220 Å)‡48 and LiNiO2 (a = 2.875 Å, c = 14.18 Å)49 supports these shifts. With the incorporation of excess Li+ into the crystal lattice, the decrease of the a parameter is dominated by the increase of the Li+ content in the TM layer, while the decrease of the c parameter can be influenced by both the increase of Li2MnO3 domains and a possible enrichment of Ni in the layered domains. The decrease of the lattice parameters in combination with the increase of the superstructure reflections and the mean TM OS strongly indicates that excess Li+ is structurally incorporated into the material.
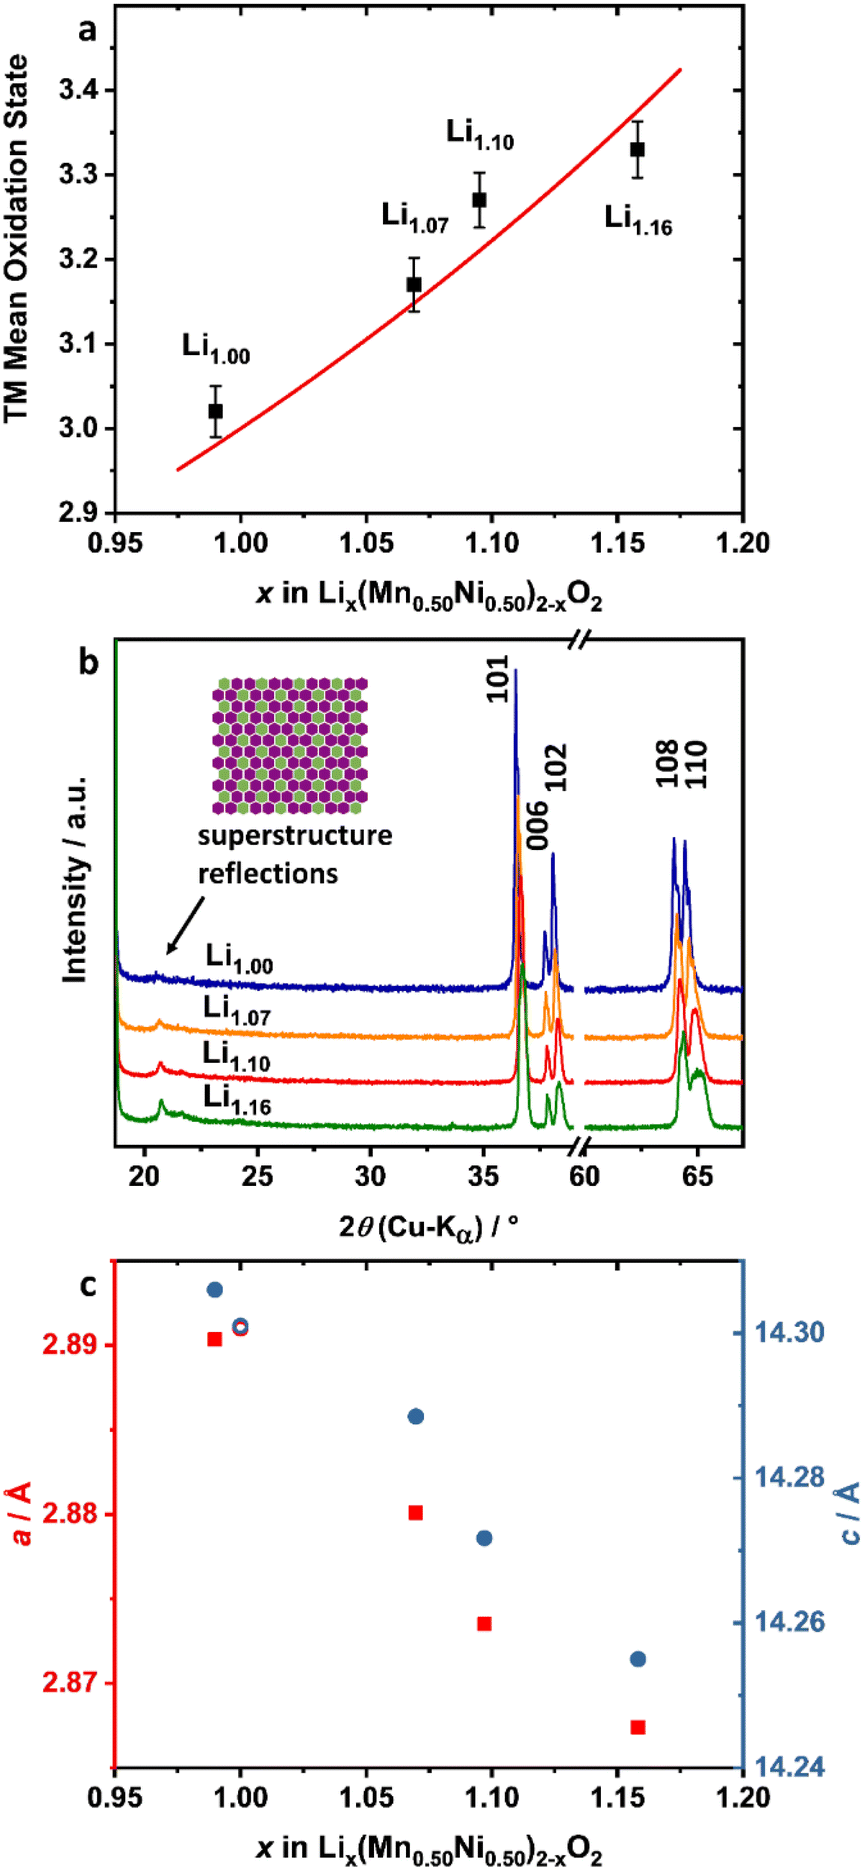 | ||
| Fig. 4 Analysis of the incorporation of excess Li+: (a) experimental (black dots) and theoretical calculated (red line) mean TM OS as a function of the Li+ content of Lix(Mn0.50Ni0.50)2−xO2, (b) detailed XRD pattern of Li1.00 (blue), Li1.07 (orange), Li1.10 (red) and Li1.16 (green) and (c) lattice parameters a (red squares) and c (blue circles) as a function of the Li+ content. As a comparison, lattice parameters of LiMn0.50Ni0.50O2 reported by Makimura et al. are presented in (c) (hollow circles).21 | ||
Li+/Ni2+ displacement is a crucial material issue for layered oxides.47,50 Due to the similar ion radii of Ni2+ and Li+,46 some of the Ni2+ ions are incorporated into the Li+ layer of the hexagonal crystal lattice.47 For LiMn0.5Ni0.5O2 this is more pronounced compared to, e.g., NMC, because Li–Mn-clustering in the TM layer is thermodynamically favored.23,51 In general, a high amount of Ni2+ ions in the Li+ layer leads to slower kinetics of Li+ diffusion, strongly affected by the lower Li slab space (Ni2+: stronger O–metal–O interactions) and the blocking of Li+ diffusion pathways.47,52,53 A Li+/Ni2+ displacement of 9.5% was obtained for Li1.00 from Rietveld refinement, which is comparable to reported values for LiMn0.5Ni0.5O2.41 With increasing excess Li+, the displacement shows a nearly linear decrease (Table 1, Fig. S4†). The main reason for the decreasing Li+/Ni2+ disordering is most probably the increase of the Ni3+ content in the structure. X-ray absorption spectroscopy (XAS) measurements of Yoon et al. showed that in LiMn0.5Ni0.5O2 most of the Ni ions are in the divalent state, whereas the Mn ions are tetravalent.54 Increasing the mean TM OS with excess Li+, which was shown to be the case by cerimetry, leads to an increase of the Ni OS, while the Mn OS can be assumed to be constant at +IV in an octahedral environment. The decreasing Li+/Ni2+ displacement is therefore consistent with both higher mean TM OS and higher lithium content.
For layered type oxides, the separation of the (006) and (102) as well as the (108) and (110) reflections can be used to evaluate the quality of the structure.55 Both pairs are well defined and separated for the Li1.00 sample (Fig. 4b, Fig. S2b†). With increasing Li+ excess, the reflections become broader and smoother. This effect is mostly pronounced for Li1.16. For instance, a shoulder on the low-angle side of the (108) reflection and a strong broadening of the (110) reflection is observable. A comparable behavior for most of the other reflections of Li1.16 is evident, which suggests a phase separation into regions with different Ni, Mn and Li stoichiometries. Due to the similar symmetry and comparable lattice parameters, a conclusive assignment of the XRD pattern to the three endmembers LiMn0.5Ni0.5O2, LiNiO2 and Li2MnO3 in terms of domains or mixtures thereof is not possible with the applied XRD measurement even for Li1.16.
Investigation of the microstructure
Based on the XRD results no conclusive statement about the extent of the phase separation or size of the domains can be made. Therefore, the powders were investigated with a combination of SEM, EDX and confocal Raman microscopy, so called correlative SEM–Raman microscopy (Fig. 5).56 SEM images taken with secondary electron (SE) detectors show crystallographic and material contrast and further contain topographical information.57 EDX provides additional information about the elemental composition, and Raman microscopy about the local structure of the excited volumes, different coordination geometries and oxidation states.58,59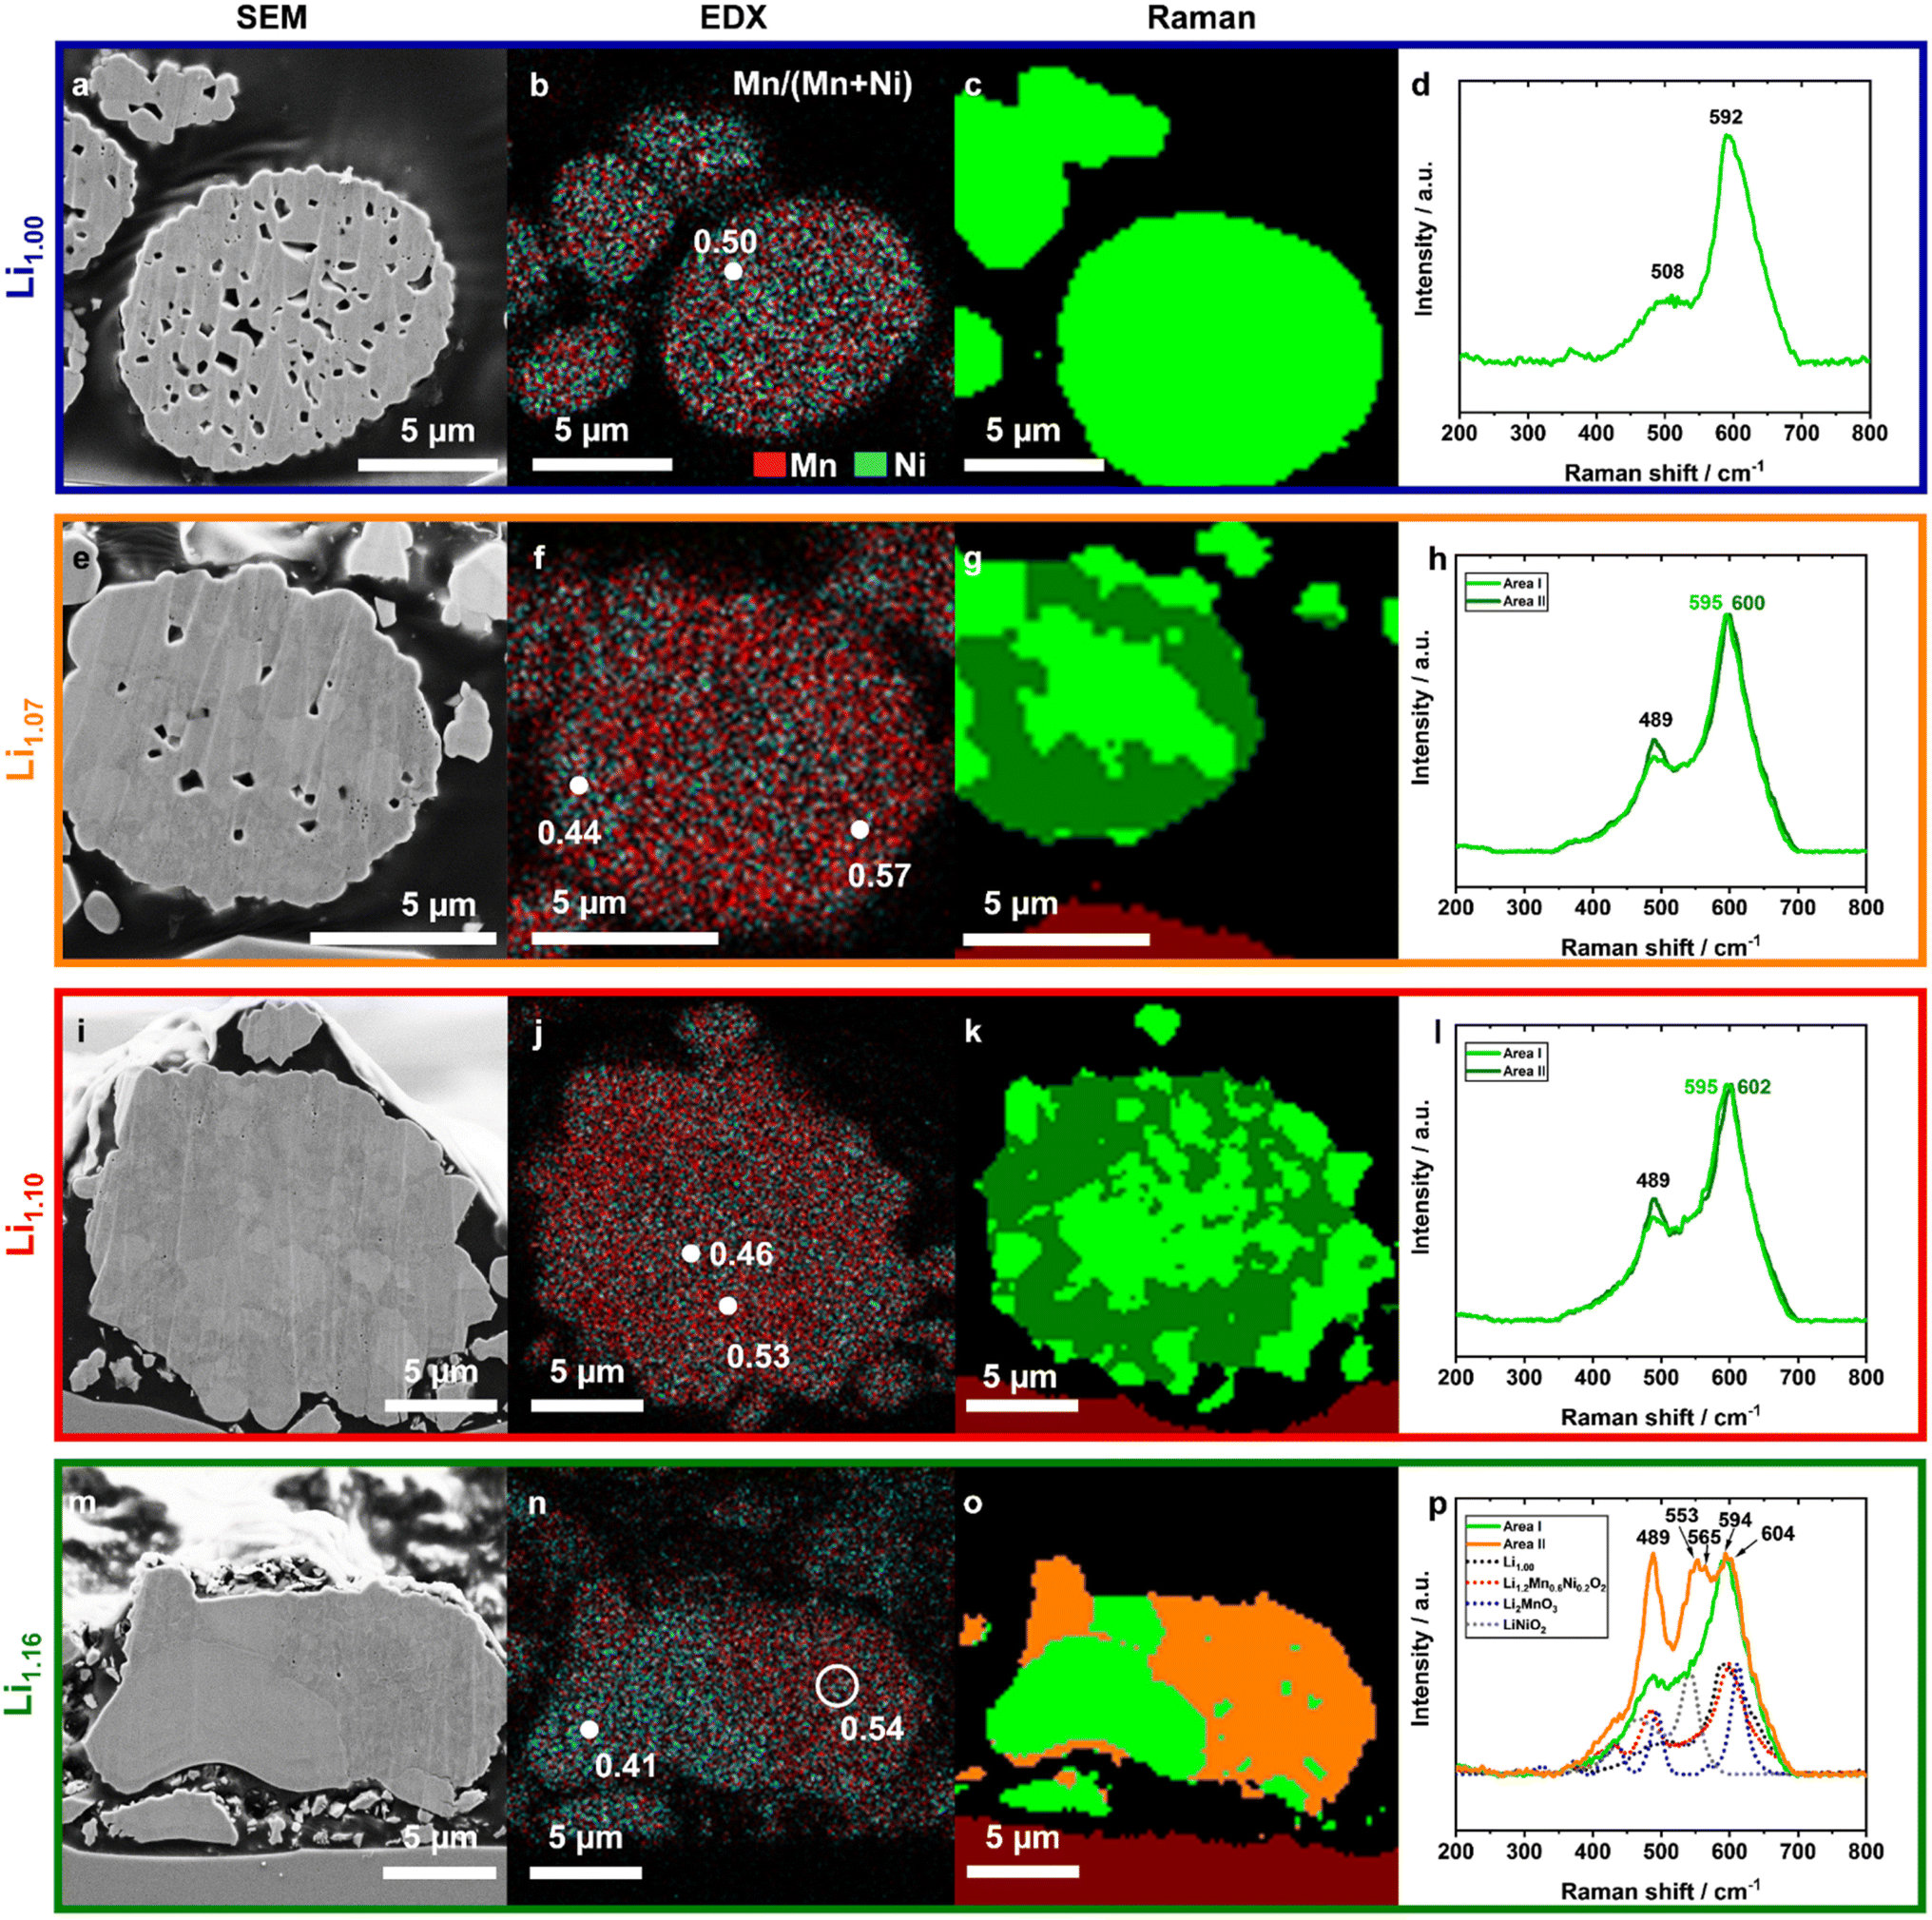 | ||
| Fig. 5 SEM–Raman imaging of Li1.00 (blue), Li1.07 (orange), Li1.10 (red) and Li1.16 (green) comparing the results of the different techniques SEM (1st column, (a), (e), (i), and (m)), EDX (2nd column, (b), (f), (j), and (n)) and Raman (3rd & 4th column, (c)–(d), (g)–(h), (k)–(l), and (o)–(p)) investigated on the same particle cross-section. In the EDX mappings the distribution of Mn (red) and Ni (turquoise) as well as the ratio of Mn/(Mn + Ni) are presented. The colored Raman maps show areas with similar Raman spectra. The resulting spectra are presented with the corresponding color in the 4th column. | ||
The SEM images of the prepared cross-sections (CS) shown in Fig. 5 clearly depict the particle microstructure, the embedding agent (black background) and a small part of the supporting substrate (red colored in the Raman mapping). Due to the applied preparation method, particles are not necessarily cut through the particle center – therefore direct particle size information gets lost. The curtaining effect of the surface can be assigned to the ion milling process. This artefact is more pronounced for the powders with a higher number of pores, but the surface was still plain enough for the applied methods.
An increasing excess of Li+ led to significant decreases in the pore sizes and in the amount of pores. Compared to Li1.10 and Li1.16, Li1.00 exhibited a high internal porosity in the secondary particle architecture, which is in agreement with the Li+ content dependent particle morphology changes (Fig. 3). In Li1.00 the microstructure is homogeneous and single primary particles cannot be identified. For Li1.07, primary particles are observable from different shadings, indicating either different orientations of the crystallites or deviations in their composition. With further increased Li+ content, the grain boundaries become more pronounced, too. For Li1.16, both shape and microstructure change significantly, as also seen in the SEM top view images of the original particles (Fig. 3). Most of the particles (Fig. S5†) lose their spherical morphology, become more irregular and partially agglomerate with other particles. An additional compositional segregation was observable, as indicated by the different coloring originating from local differences in electron densities,57,60 being well pronounced in the presented particle (Fig. 5m). The particle can be divided into two areas: one brighter part, which likely consists of two large crystallites and a darker part, which is dominated by smaller crystallites and bright grain boundaries.
In order to quantify the elemental distribution in the specific areas, EDX mappings and point analyses were conducted. The Mn signal (red) was overlaid with the Ni (turquoise) signal in the presented images to illustrate their lateral distribution (Fig. 5b, f, j and n). The distribution strongly differs between the investigated samples. Li1.00 has a homogeneous distribution of Mn and Ni, while Li1.16 indicates a Ni enrichment on the left side and a Mn enrichment on the opposite. Furthermore, the Ni-enriched areas have exactly the same shape and location like the bright crystallites in the SEM image. Local quantification of the Mn/(Mn + Ni) ratio shows that there is still a lot of Mn (Mn/(Mn + Ni) ≈ 0.41) inside. For the stoichiometries of Li1.07 and higher, local differences in the Mn/(Mn + Ni) ratios are evident, which were not seen for Li1.00.
EBSD measurements were conducted for Li1.16 in order to quantify the size distribution and the orientation of the crystallites (Fig. 6). The single crystallites can be identified with the band contrast map (Fig. 6a). They were divided into Mn- and Ni-enriched areas for further computational analysis of the data with the help of EDX measurements (Fig. 6b, S6a and b†). Computational analysis confirms the differences in crystallite size distribution (Fig. 6d). Whereas the Mn-enriched crystallites have an area-weighted mean area of 0.5 μm2 (maximum 1.9 μm2), the Ni-enriched ones have a value of 5.2 μm2 (maximum 13.4 μm2). Furthermore, the assignment of each single pixel to one of the two groups indicates strong differences in the grey values of the band contrast. The pixels in the Mn-enriched areas are shifted to lower numbers, which can be an indicator of higher defect density (Fig. 6c). However, we should note that due to the larger crystallite size, the ratio of dark grain boundaries with lower grey values is lower for the Ni-enriched crystallites compared to the small ones, influencing the distribution. The orientation of the crystallites was successfully determined using the crystal structure of LiMn0.5Ni0.5O2 (space group: Rm) for indexing the EBSD patterns. Orientation plots, pole figures and the correlation of the Mackenzie plot with random pair distribution are presented in the ESI (Fig. S6c–h†), indicating a random orientation of the crystallites.
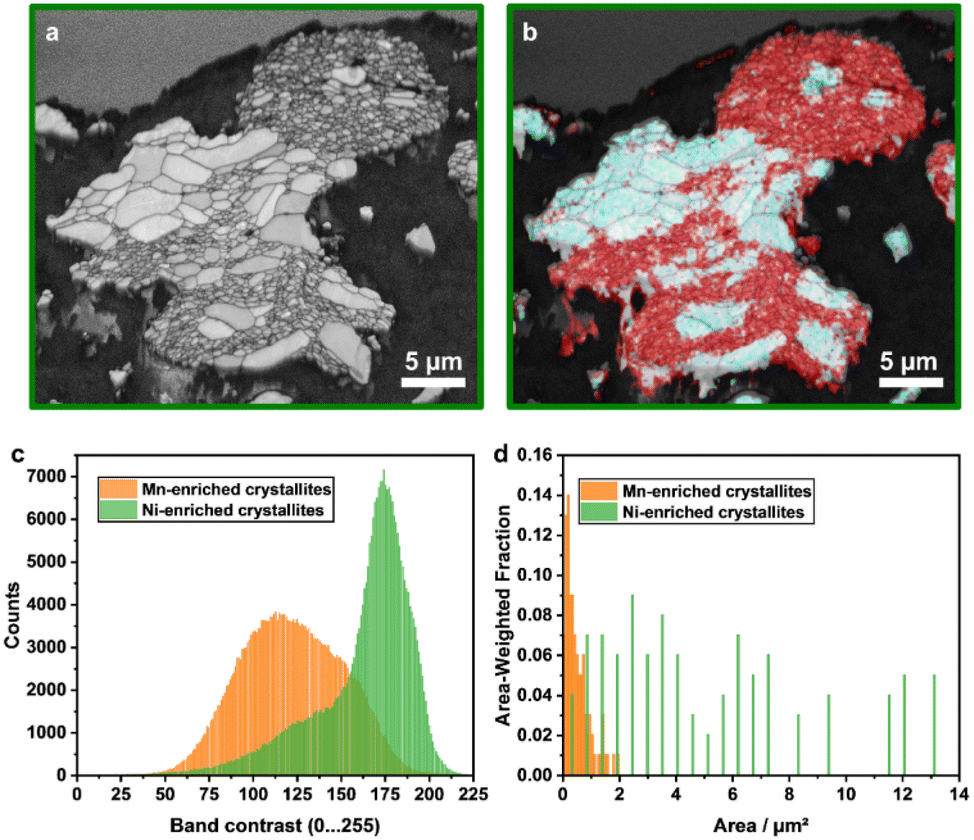 | ||
| Fig. 6 EBSD results of Li1.16: mappings of (a) band contrast and (b) elemental distribution with Ni-enriched (turquoise) and Mn-enriched (red) areas. Both the Mn- and Ni-enriched crystallites were analyzed via a data post-processing procedure in more detail with respect to (c) the frequency distribution of the grey values of the band contrast and (d) their size distribution at the surface of the particle cross-section. | ||
In order to shed more light on the observed local differences, confocal Raman microscopy measurements were performed (lateral resolution ≈ 300 nm). Similar Raman spectra were clustered together into groups, using the software Project FIVE (WITec) and plotted as a colored map (Fig. 5c, g, k and o). A first comparison of the Raman maps with the SEM images and the EDX data is self-consistent.
The Raman spectrum of Li1.00 contains one strong band at 592 cm−1 and a broad shoulder with a plateau between 480 cm−1 and 540 cm−1. All Raman shifts are similar to reported literature values of Kumar et al. and can be assigned to the LiMn0.5Ni0.5O2 structure.61 Based on the factor group analysis, layered Li–TM-oxide materials with the space group Rm have two Raman-active vibration modes, A1g and Eg, assuming a perfect crystallographic lattice. The vibration band 592 cm−1 represents the signal of the out-of-plane M–O stretching vibration of the A1g mode, which vibrates parallel to the c-axis, while the Eg mode is an in-plane O–M–O bending vibration parallel to the Li/TM layers (480 cm−1).58,62,63
However, both the asymmetry in the peak at 592 cm−1 and the plateau indicate that the spectrum consists of several signals with various chemical environments. One reason is most probably the high amount of Li+/Ni2+ disordering in the system, already shown in the XRD analysis, which implies the presence of Li2MnO3 domains. Li2MnO3 has a lower symmetry (C/2m) resulting in a higher amount of active vibration modes as shown in the reference spectrum (Fig. 5p, blue dots). They are located at 612 (Ag), 568, 493, 438, 413, 369, 332, 308 and 248 cm−1.64 But it is important to note that local structural differences, due to the presence of Ni and, e.g., the layered domains in Li-rich compounds, lead to peak broadening of all vibration bands and to lower intensities of the peaks below 440 cm−1.65 Therefore, the resulting Li2MnO3 domains of the honeycomb superstructure would explain both broadening of the vibration band at 592 cm−1 and the additional small vibration band at ≈362 cm−1.61
With increasing amount of excess Li+ up to Li1.10, a second cluster of spectra was detectable and is marked in dark green (Fig. 5h and l). The average spectrum of the second cluster is similar in shape to Li1.00, but has slightly higher Raman shifts of the A1g mode. Additionally, both average spectra (indicated as dark and light green) have a more pronounced peak at 489 cm−1 as compared to the spectra measured for Li1.00, which likely indicates a higher structural order in the system. This might be in accordance with the decrease of Li+/Ni2+ disordering in the powders as observed in the XRD. The minor blue-shift of the most intense peak from the light green (595 cm−1) to the dark green area (600 and 602 cm−1, respectively) indicates contributions of Li2MnO3 domains from the incorporation of excess Li+ into the dark green region of the mappings.66 Fitting each single spectrum of the Raman mappings with Lorentzian peak profiles allows the determination of the specific peak position and their frequency distribution (Fig. 7). The color change from Li1.00 to Li1.16 indicates a systematical shift of the peak maximum with increasing excess Li+ as well as the beginning of the phase separation, which is underlined by the frequency distribution provided in the ESI (Fig. S7†). This shows that the peak position of the vibration band at approximately 600 cm−1 can be used as an indicator for the local Li+ content in the structure.
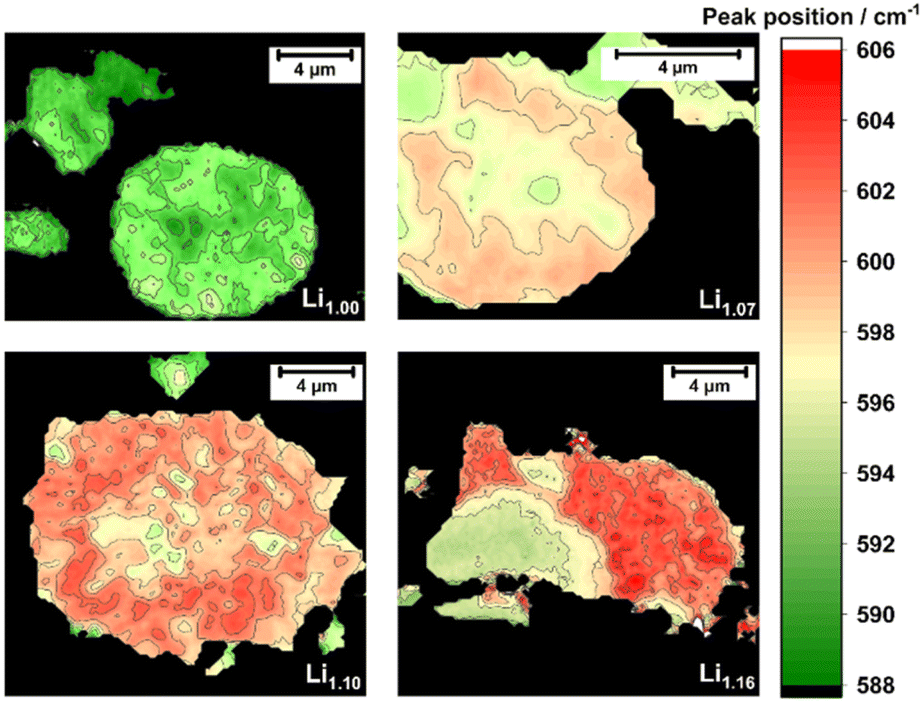 | ||
| Fig. 7 Fitted peak position of the A1g vibration band for different amounts of Li+ excess: Li1.00, Li1.07, Li1.10 and Li1.16. | ||
Comparing the Raman results with the color changes in the SEM images and EDX mappings, it can be assumed that the Mn-enriched areas overlap with the dark green areas and dark crystallites, whereas the Ni-rich ones overlap with the light green areas and the brighter particles in the SEM images. Together, they clearly indicate the beginning of phase separation into a stoichiometric layered Ni-enriched oxide and a Li–Mn-enriched layered oxide. Furthermore, a closer look at the light green spectrum of Li1.10 (Fig. 5l) shows that this already contains contributions of the dark green spectrum. This implies that the length-scale of phase separation is smaller than the lateral resolution of the Raman microscope, which is limited by the diffraction limitation of the used laser wavelength.
The selected particle of Li1.16 can be separated as well into two parts (Fig. 5p). The light green spectrum has two peaks with a Raman shift of 489 and 594 cm−1, but the latter peak is broader compared to the other samples. This is likely related to the higher Ni content of this particle (EDX, Fig. 5n) and indicates that the larger particles consist of a layered phase with no or only a slight Li+ excess. The spectrum of the orange area differs strongly from the others. Besides the maxima at 489, 594 and 604 cm−1, a further main peak with three local maxima at 544, 553 and 565 cm−1 is visible. Particularly, the vibration band at approx. 550 cm−1 indicates the presence of a LiNiO2 species or a comparable compound with slight incorporation of Mn. Further shoulders between 400 and 450 cm−1 as well as 498 cm−1 and the relatively large blue-shift of the A1g vibration band indicate a strong local increase of Li2MnO3 domains in this area. The multitude of new vibration bands suggest a significant change in the structure.
More differentiated clustering of the spectra in the orange area of Li1.16 (Fig. 5p) visualizes the observed phase separation in the microstructure in more detail (Fig. 8). For the other samples with lower Li+ excess a further similar separation into sub-clusters was not possible. In the Mn-enriched region of the Li1.16 particle, the intensity ratios of the peaks at approximately 488, 552 and 604 cm−1 differ strongly between the sub-clusters. The spectral overlap of both a Li-rich and a Ni-rich composition leads to the strong increase of intensity ratio between the peak at 489 cm−1 and approximately at 600 cm−1. The relative increase of the intensity at 488 cm−1 is explainable with the decrease of the band intensity at 604 cm−1, due to the splitting of the signal into two main peaks. Interestingly, the intensity of the peak at approximately 552 cm−1, which was already assigned to a Ni-rich layered compound, deviates strongly in the intensity depending on the location of the sub-cluster. The correlation of both SEM image and Raman mapping suggests a higher intensity of the peak at 552 cm−1 at the bright grain boundaries in the Mn-enriched area. The influence of different orientations of the crystallites on the intensity ratios of the bands due to the random orientation as shown by EBSD is very unlikely. Further interpretation of the mapping would need an even higher lateral resolution of the Raman microscope beyond the diffraction limit.
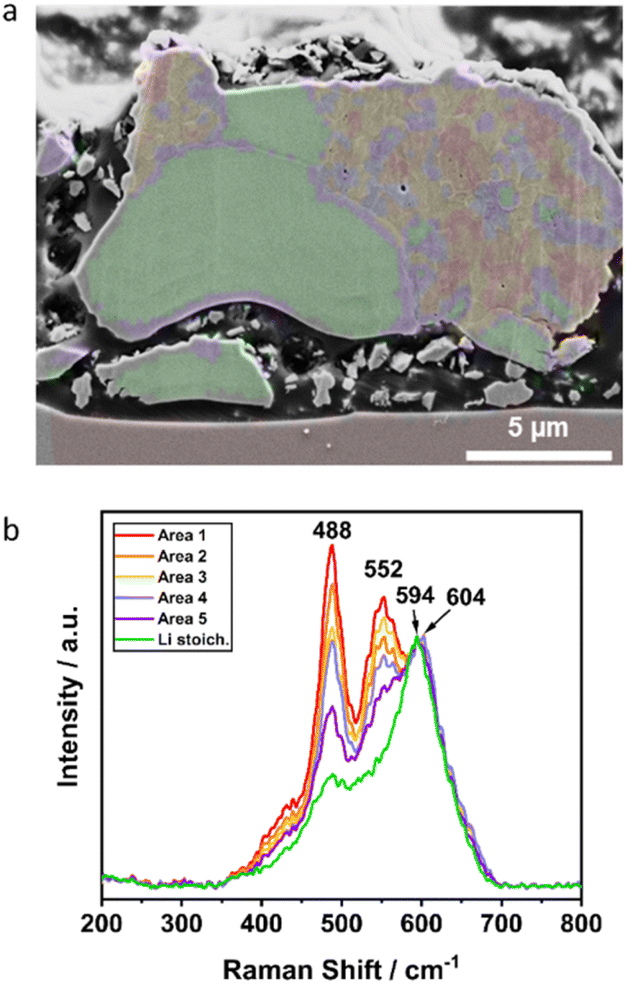 | ||
| Fig. 8 Detailed investigation of Li1.16: (a) correlation of SEM image with Raman mapping and (b) corresponding Raman spectra of the colored, clustered areas with similar Raman spectra. | ||
Overall, the specific combination of the three methods, SEM, EDX and Raman, provides a deep insight into the complex structural situation inside the spherical particles, helps to understand the cause of the broadening of the XRD reflections and to prove the phase separation with increasing amount of excess Li+ in the particle into a Ni-enriched and a Li–Mn-enriched layered compound, respectively. The phase separation is differently pronounced, while for Li1.00 only one phase was detected, for Li1.07 and Li1.10 local differences in the Mn/Ni ratio and the Li+ content in the structure appeared. For Li1.16 a fundamental rearrangement of the primary particles during the calcination process can be assumed. This might be supported by the larger amount of Li+ salts outside of the secondary particles, acting as a flux, most probably due to the limited access into the secondary particle structure. This leads to a separation into layered stoichiometric Ni-enriched particles and a Li–Mn-enriched area, with further phase separation on local scale into Ni-rich and Li–Mn-rich layered oxides. Furthermore, a faster growth of the Ni-enriched crystallites likely leads to a more pronounced phase separation in the spherical material due to the extraction and chemical binding of Ni-ions.
It can be concluded that Li1.07 has the best balance between structural incorporation of the excess Li+ and the phase separation. Compared to the other materials, the incorporation of the excess Li+ was more homogeneously distributed as shown in the Raman mappings (Fig. 5 and 6) and the Mn/Ni separation was reduced to a minimum (Fig. 5). Additionally, it was underlined that the interpretation of the powder diffraction data without analyzing the samples by further methods is not sufficient to distinguish between macroscopic segregation (mixture of particles with different compositions), phase separation in the microstructure or defects in the lattice.
Electrochemical behavior
The influence of the excess Li+ on the electrochemical behavior was investigated in a voltage range between 2.5 and 4.7 V to activate possible Li2MnO3 domains, which become electrochemically accessible at higher potentials (Fig. 9). All powders have a similar cycling characteristic with respect to their capacity loss over cycling. During the first few cycles, a fast capacity fade is observable, which stabilizes after approximately 10 cycles except for Li1.00 and Li1.16. In contrast to the cycling characteristics, the specific discharge capacity differs strongly. While Li1.07 and Li1.10 have initial discharge capacities of 173 and 171 mAh g−1, Li1.00 and Li1.16 have significantly lower capacities of 157 and 150 mAh g−1. Similar effects are observed in long-term cycling experiments of the better performing materials Li1.07 and Li1.10 (Fig. S8†). After a strong capacity fade in the beginning of the cycling experiments, both materials show stable cycling performance between cycles 50 and 200.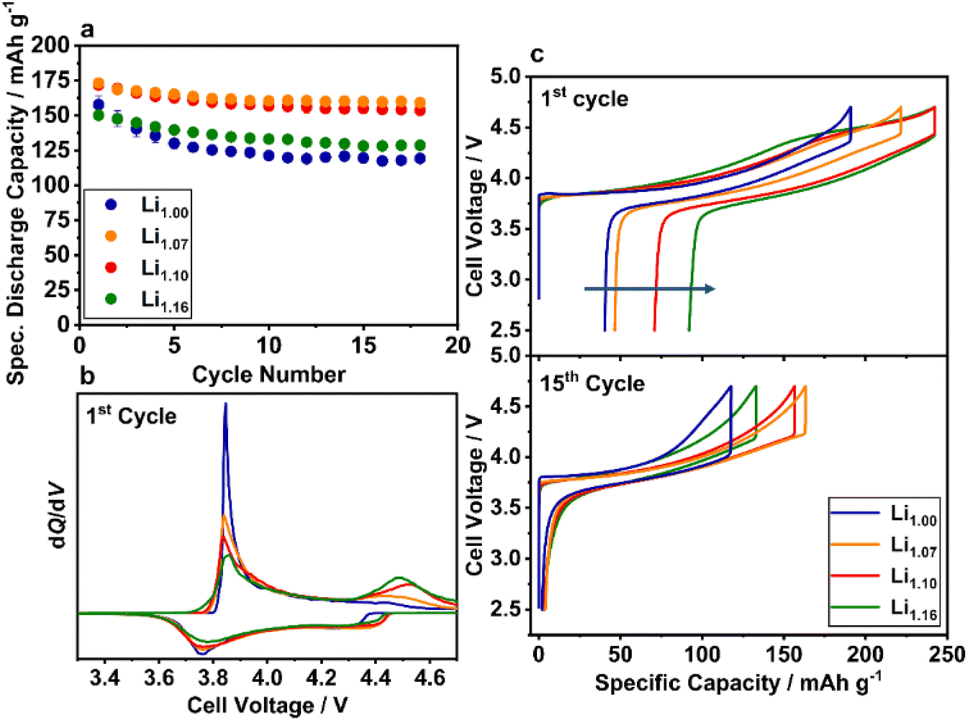 | ||
| Fig. 9 Electrochemical characterization of Li1.00 (blue), Li1.07 (orange), Li1.10 (red) and Li1.16 (green): (a) specific discharge capacities of the initial cycles (12 mA g−1), (b) dQ/dV plot and (c) voltage profiles of the 1st and 15th cycle. | ||
For a better understanding of the differences in the initial capacities, an in-depth analysis of the voltage curve is necessary (Fig. 9c). The blue curve of Li1.00 shows a smooth, for solid solutions typical, monotone progression after the voltage jump from the open circuit voltage (OCV) to an initial cell voltage of 3.84 V. A detailed mechanism and the involved Ni oxidation states have been suggested elsewhere.67,68 Specific plateaus, that would indicate phase transitions or electrochemical activation as in Li2MnO3-containing LRLO materials, are not present.45,69 The voltage profiles of the other electrodes show a slightly different behavior in the voltage region beyond 4.4 V. With higher amount of excess Li+, a plateau region is observable with increasing length, concomitant with decreasing charge capacity below 4.4 V. Furthermore, the first cycle irreversible capacity loss increases. A detailed analysis is presented in the ESI (Fig. S9†). The additional plateau region indicates the electrochemical activation of Li2MnO3 domains,70 which were identified during the structural analysis of the materials. Consequently, the initial voltage curves of Li1.07, Li1.10 and Li1.16 are most likely influenced by a cationic redox reaction in the lower voltage region (Ni-redox) and an anionic redox reaction at higher voltage (O-redox).71 Both reactions are visible in the corresponding dQ/dV plot as well (Fig. 9b). During initial delithiation the peak at 3.8 V can be assigned to the oxidation reaction of the TM and the peak at ≈4.5 V to the electrochemical activation of the Li2MnO3 domains.38 Furthermore, the intensity of the latter peak increases with higher Li/Mn ratios, which is in agreement with the systematical blue-shift of the A1g Raman vibration band and the other structural investigations, suggesting an increased number of Li2MnO3 domains. Nevertheless, compared to LRLO materials (Fig. 1, green line) with a strongly distinct plateau at ≈4.5 V,45,72–75,79 the plateau in the voltage profile of the presented powders is less pronounced, likely due to the higher Li/Mn ratio and very dense particle morphology (Li1.10 and Li1.16) of the investigated materials. Based on the SEM images, we additionally estimate a low specific surface area, which strongly influences the activation of the Li2MnO3 domains as well. Similar morphological influences were recently reported by the Gasteiger group for LRLO materials.76
At the beginning of lithiation in the 1st cycle, significant differences in the size of the voltage drop (IR-drop) can be observed in the order of Li1.07 ≈ Li1.10 < Li1.16 ≪ Li1.00. Particularly, the increased voltage drop of Li1.00 is likely ascribed to the strong Li+/Ni2+ disordering due to the honeycomb superstructure and the resulting lower Li+ diffusion kinetics. For Li1.16, most probably the macroscopic phase separation shown by SEM, EDX, EBSD and Raman limits the diffusion. During further lithiation, there is a pronounced peak at approximately 3.75 V, which is mainly attributed to the reduction reaction of the cationic redox system. Based on the microstructural and electrochemical findings, there are probably three main factors influencing the capacity induced by the excess Li+ in the structure: (a) Li+/Ni2+ disorder, (b) additional capacity from the oxygen redox and (c) structural inhomogeneity in the lattice. The lower performance of Li1.00 compared to the other investigated materials with higher Li/Mn ratios was already reported in the literature and ascribed to the high amount of Ni2+ ions in the Li+ layer and the local collapse of the structure during cycling, hindering the (de)lithiation process.38 The local collapse is likely the reason for the high voltage drop at the beginning of the electrochemical lithiation already after 15 cycles of Li1.00 (Fig. 9c). Bian et al. reported that the capacity fade of Li1.00 is independent of the high discharge voltage and as well observable at lower cut-off potentials.32 We observed similar results for Li1.00, but with a decreasing extent at lower cut-off voltages most probably due to less side-reactions like electrolyte decomposition or other parasitic side-reactions (Fig. S10†).77 Li1.07 and Li1.10 are most probably in an ideal compositional range, where the Li+/Ni2+ disorder is already reduced due to the higher amount of Ni3+ and the irreversible capacity loss, originating mainly from the oxygen release during the activation of the Li2MnO3 domains,70 is comparatively low. For Li1.16, the benefit of the excess Li+ is overcompensated likely by the phase segregation in the microstructure and the high irreversible capacity loss, which result in low discharge capacity.
The pronounced capacity loss during the first cycles is accompanied by an increase of the polarization mainly in the high voltage region, which is clearly indicated by the dQ/dV curves of the initial cycles (Fig. S11†). The increasing overpotential mainly indicates the formation and growth of a cathode electrolyte interface (CEI). In the beginning, the growing process is most probably very fast and slows down during cycling due to the self-passivation of the surface. This effect was also observed by Dupré et al. suggesting interfacial effects between the particle surface and the electrolyte as the main reason for this phenomenon.78 The choice of the electrolyte may influence the CEI formation. Consequently, different electrolytes were screened with respect to their influence on the cycling behavior of Li1.07 (Fig. 10). For all electrolytes, the principal characteristic of the cycling curve remains unaffected. Reducing the ethylene carbonate (EC) content increases the discharge capacity, but not the cycling stability of the material. However, significant stabilization can be observed for the vinylene carbonate (VC) containing electrolyte with a specific discharge capacity after the first 10 cycles of approximately 175 mAh g−1. Finally, it was shown that the Li1.07 material has a stable discharge capacity of 173 mAh g−1 (658 Wh kg−1) even after 40 cycles using an improved electrolyte composition.
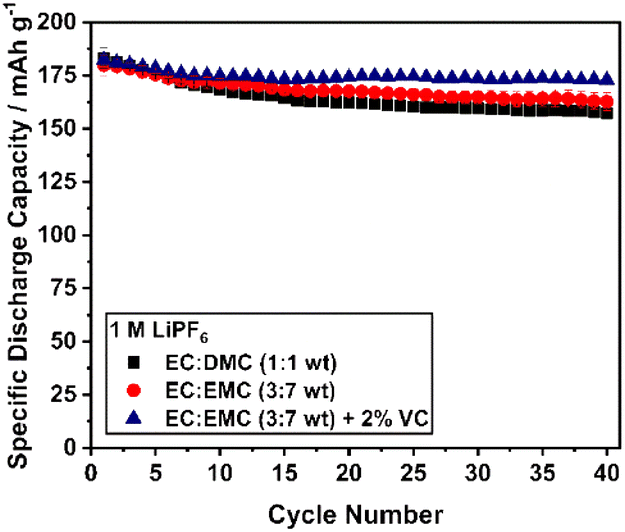 | ||
| Fig. 10 Cycling performance (12 mA g−1) of Li1.07 using different electrolytes (1M LiPF6): EC:DMC (1:1 by wt, black), EC:EMC (3:7 by wt, red) and EC:EMC (3:7 by wt) + 2 wt% VC (blue) at RT. | ||
Conclusions
In this work, different powders with various amounts of Li+ excess in the structure Li1+x(Mn0.5Ni0.5)1−xO2 (0 ≤ x ≤ 0.16) have been investigated with respect to microstructural changes induced by the additional Li+. Increasing the Li+ excess in the structure leads to a decrease of both lattice parameters and a broadening of the diffraction patterns. Furthermore, the intensity of superstructure reflections, indicating the presence of Li2MnO3 domains, increases, too. The study shows that the incorporation of a certain amount of excess Li+ helps to improve the structural and electrochemical properties, with lower Li+/Ni2+ disorder and anionic redox activity. Further addition of Li+ leads to electrochemical deactivation. The ideal composition in the investigated system was found for x = 0.07, with a stable discharge capacity of 173 mAh g−1 (658 Wh kg−1) after 40 cycles. The influence of excess lithium on microstructural features turned out to be very complex. XRD does not give a full view of the structural details and a misinterpretation of the pattern with its broad reflections as a single structure with high amounts of lattice defects is possible if no complementary analysis techniques are employed. Therefore, a powerful combination of SEM imaging (microstructure), EDX (elemental mapping), EBSD and Raman microscopy (structural information) was applied to identify the effect on the particle microstructure driven by excess Li+. While the stoichiometric material (x = 0) exhibits a homogeneous particle composition, a strong segregation was observable for x = 0.16. In the latter, the particle microstructure is dominated by two levels of segregation: (a) large homogeneous crystallites with slightly increased Ni-content and (b) areas composed of small Li–Mn-rich crystallites surrounded by Ni-rich layered compounds along the grain boundaries. Integrating these findings into the information obtained from XRD, ICP and cerimetry allows deriving a conclusive understanding of the Li+ excess impact on the secondary particle architecture. The results clearly show that Li+ excess can induce a complex macroscopic phase segregation on particle level. For the reported materials, we assume that the macroscopic phase separation is driven by a kinetically retarded access of the Li+ into the grain structure during calcination, where a part of the Li+ can remain unreacted for a certain time span and act as an intermediary fluxing agent. This effect is strongly pronounced for higher Li+ excess beyond x ≈ 0.10. In the frame of literature reported results, this study helps as well to interpret methodical differences of calcination procedures on the product quality. Overall, the presented combination of the three analyzing techniques (SEM, EDX, and Raman) will help in the future to generate a deeper understanding of battery materials and their structural and electrochemical behavior.Conflicts of interest
There are no conflicts to declare.Acknowledgements
This work was supported by the German Federal Ministry of Education and Research (BMBF) in the project ExcellBattMat (03XP0257A and 03XP0257C). The authors thank Wolfgang Weirather for his support during the synthesis process, Gisela Arnold for the ICP measurements, Ivan Trentin for providing the LiNiO2 reference material (all ZSW) and Patrick Trimby for support with EBSD pattern matching (Oxford Instruments).Notes and references
- J. Dunn, M. Slattery, A. Kendall, H. Ambrose and S. Shen, Environ. Sci. Technol., 2021, 55, 5189, DOI:10.1021/acs.est.0c07030.
- Z. Lu, D. D. MacNeil and J. R. Dahn, Electrochem. Solid-State Lett., 2001, 4, A200, DOI:10.1149/1.1413182.
- T. Ohzuku and Y. Makimura, Chem. Lett., 2001, 30, 744, DOI:10.1246/cl.2001.744.
- J. H. Yang, H. Kim and G. Ceder, Molecules, 2021, 26, 3173, DOI:10.3390/molecules26113173.
- T. Ohzuku and Y. Makimura, Chem. Lett., 2001, 30, 642, DOI:10.1246/cl.2001.642.
- L.-P. He, K. Li, Y. Zhang and J. Liu, ACS Appl. Mater. Interfaces, 2020, 12, 28253, DOI:10.1021/acsami.0c06824.
- B. E. Murdock, K. E. Toghill and N. Tapia-Ruiz, Adv. Energy Mater., 2021, 11, 2102028, DOI:10.1002/aenm.202102028.
- S. Lee and A. Manthiram, ACS Energy Lett., 2022, 7, 3058, DOI:10.1021/acsenergylett.2c01553.
- M. Greenwood, M. Wentker and J. Leker, J. Power Sources Adv., 2021, 9, 100055, DOI:10.1016/j.powera.2021.100055.
- E. McCalla, A. W. Rowe, R. Shunmugasundaram and J. R. Dahn, Chem. Mater., 2013, 25, 989, DOI:10.1149/2.047308jes.
- Q. Zhong, A. Bonakdarpour, M. Zhang, Y. Gao and J. R. Dahn, J. Electrochem. Soc., 1997, 144, 205, DOI:10.1149/1.1837386.
- K. Amine, H. Tukamoto, H. Yasuda and Y. Fujita, J. Power Sources, 1997, 68, 604, DOI:10.1016/S0378-7753(96)02590-6.
- E. Rossen, C. Jones and J. R. Dahn, Solid State Ionics, 1992, 57, 311, DOI:10.1016/0167-2738(92)90164-K.
- D. Caurant, N. Baffler, V. Bianchi, G. Grégoire and S. Bach, J. Mater. Chem., 1996, 6, 1149, 10.1039/JM9960601149.
- M. E. Spahr, P. Novák, B. Schnyder, O. Haas and R. Nesper, J. Electrochem. Soc., 1998, 145, 1113, DOI:10.1149/1.1838425.
- Y.-K. Sun, D.-J. Lee, Y. J. Lee, Z. Chen and S.-T. Myung, ACS Appl. Mater. Interfaces, 2013, 5, 11434, DOI:10.1021/am403684z.
- H. Yu and H. Zhou, J. Phys. Chem. Lett., 2013, 4, 1268, DOI:10.1021/jz400032v.
- T. Ohzuku, M. Nagayama, K. Tsuji and K. Ariyoshi, J. Mater. Chem., 2011, 21, 10179, 10.1039/c0jm04325g.
- Z. Lu, L. Y. Beaulieu, R. A. Donaberger, C. L. Thomas and J. R. Dahn, J. Electrochem. Soc., 2002, 149, A778, DOI:10.1149/1.1471541.
- H. Kobayashi, H. Sakaebe, H. Kageyama, K. Tatsumi, Y. Arachi and T. Kamiyama, J. Mater. Chem., 2003, 13, 590, 10.1039/B211558A.
- Y. Makimura and T. Ohzuku, J. Power Sources, 2003, 119–121, 156, DOI:10.1016/S0378-7753(03)00170-8.
- J. Bréger, N. Dupré, P. J. Chupas, P. L. Lee, T. Proffen, J. B. Parise and C. P. Grey, J. Am. Chem. Soc., 2005, 127, 7529, DOI:10.1021/ja050697u.
- A. van der Ven and G. Ceder, Electrochem. Commun., 2004, 6, 1045, DOI:10.1016/j.elecom.2004.07.018.
- Z. Hu, J. Zheng, C. Xin, G. Teng, Y. Zuo and F. Pan, J. Phys. Chem. C, 2018, 122, 4125, DOI:10.1021/acs.jpcc.7b10968.
- W.-S. Yoon, S. Iannopollo, C. P. Grey, D. Carlier, J. Gorman, J. Reed and G. Ceder, Electrochem. Solid-State Lett., 2004, 7, A167, DOI:10.1149/1.1737711.
- K. Kang, Y. S. Meng, J. Bréger, C. P. Grey and G. Ceder, Science, 2006, 311, 977, DOI:10.1126/science.1122152.
- H. Kobayashi, Y. Arachi, H. Kageyama, H. Sakaebe, K. Tatsumi, D. Mori, R. Kanno and T. Kamiyama, Solid State Ionics, 2004, 175, 221, DOI:10.1016/j.ssi.2003.12.027.
- N. Yabuuchi, Y.-C. Lu, A. N. Mansour, S. Chen and Y. Shao-Horn, J. Electrochem. Soc., 2010, 158, A192, DOI:10.1149/1.3526309.
- J. R. Croy, K. G. Gallagher, M. Balasubramanian, B. R. Long and M. M. Thackeray, J. Electrochem. Soc., 2014, 161, A318, DOI:10.1149/2.049403jes.
- S.-H. Kang, I. Belharouak, Y.-K. Sun and K. Amine, J. Power Sources, 2005, 146, 650, DOI:10.1016/j.jpowsour.2005.03.084.
- A. Abdel-Ghany, K. Zaghib, F. Gendron, A. Mauger and C. M. Julien, Electrochim. Acta, 2007, 52, 4092, DOI:10.1016/j.electacta.2006.11.044.
- X. Bian, R. Zhang and X. Yang, Inorg. Chem., 2020, 59, 17535, DOI:10.1021/acs.inorgchem.0c02766.
- B. Ammundsen and J. Paulsen, Adv. Mater., 2001, 13, 943, DOI:10.1002/1521-4095(200107)13:12/13<943::AID-ADMA943>3.0.CO;2-J.
- N. Phattharasupakun, M. M. E. Cormier, Y. Liu, C. Geng, E. Zsoldos, I. Hamam, A. Liu, M. B. Johnson, M. Sawangphruk and J. R. Dahn, J. Electrochem. Soc., 2021, 168, 110502, DOI:10.1149/1945-7111/ac3157.
- K. A. Kurilenko, O. A. Shlyakhtin, O. A. Brylev and O. A. Drozhzhin, Electrochim. Acta, 2015, 152, 255, DOI:10.1016/j.electacta.2014.11.045.
- T. Gao, G. Yang, B. Yang and Y. Dai, J. Alloys Compd., 2016, 680, 694, DOI:10.1016/j.jallcom.2016.04.187.
- E. McCalla, J. Li, A. W. Rowe and J. R. Dahn, J. Electrochem. Soc., 2014, 161, A606, DOI:10.1149/2.083404jes.
- S.-T. Myung, S. Komaba, K. Kurihara, K. Hosoya, N. Kumagai, Y.-K. Sun, I. Nakai, M. Yonemura and T. Kamiyama, Chem. Mater., 2006, 18, 1658, DOI:10.1021/cm052704j.
- S. Myung, S. Komaba and N. Kumagai, Solid State Ionics, 2004, 170, 139, DOI:10.1016/j.ssi.2003.09.006.
- L. Guo, X. Tan, D. Mao, T. Zhao, L. Song, Y. Liu, X. Kang, H. Wang, L. Sun and W. Chu, Electrochim. Acta, 2021, 370, 137808, DOI:10.1016/j.electacta.2021.137808.
- J. Bréger, Y. S. Meng, Y. Hinuma, S. Kumar, K. Kang, Y. Shao-Horn, G. Ceder and C. P. Grey, Chem. Mater., 2006, 18, 4768, DOI:10.1021/cm060886r.
- P. W. Stephens, J. Appl. Crystallogr., 1999, 32, 281, DOI:10.1107/S0021889898006001.
- T. Sata, Ceram. Int., 1998, 24, 53, DOI:10.1016/S0272-8842(96)00077-6.
- E. McCalla, G. H. Carey and J. R. Dahn, Solid State Ionics, 2012, 219, 11, DOI:10.1016/j.ssi.2012.05.007.
- F. Klein, J. Bansmann, Z. Jusys, C. Pfeifer, P. Scheitenberger, M. Mundszinger, D. Geiger, J. Biskupek, U. Kaiser, R. J. Behm, M. Lindén, M. Wohlfahrt-Mehrens and P. Axmann, ChemSusChem, 2022, 15, e202201061, DOI:10.1002/cssc.202201061.
- R. D. Shannon, Acta Crystallogr., Sect. A: Cryst. Phys., Diffr., Theor. Gen. Crystallogr., 1976, 32, 751, DOI:10.1107/S0567739476001551.
- J. Zheng, Y. Ye, T. Liu, Y. Xiao, C. Wang, F. Wang and F. Pan, Acc. Chem. Res., 2019, 52, 2201, DOI:10.1021/acs.accounts.9b00033.
- J. Bréger, M. Jiang, N. Dupré, Y. S. Meng, Y. Shao-Horn, G. Ceder and C. P. Grey, J. Solid State Chem., 2005, 178, 2575, DOI:10.1016/j.jssc.2005.05.027.
- K. Hirakawa, H. Kadowaki and K. Ubukoshi, J. Phys. Soc. Jpn., 1985, 54, 3526, DOI:10.1143/JPSJ.54.3526.
- X. Zhang, W. J. Jiang, A. Mauger, Qilu, F. Gendron and C. M. Julien, J. Power Sources, 2010, 195, 1292, DOI:10.1016/j.jpowsour.2009.09.029.
- Y. Hinuma, Y. S. Meng, K. Kang and G. Ceder, Chem. Mater., 2007, 19, 1790, DOI:10.1021/cm062903i.
- Y. Su, Q. Zhang, L. Chen, L. Bao, Y. Lu, S. Chen and F. Wu, J. Energy Chem., 2022, 65, 236, DOI:10.1016/j.jechem.2021.05.048.
- J. Wang, X. Lu, Y. Zhang, J. Zhou, J. Wang and S. Xu, J. Energy Chem., 2022, 65, 681, DOI:10.1016/j.jechem.2021.06.017.
- W.-S. Yoon, Y. Paik, X.-Q. Yang, M. Balasubramanian, J. McBreen and C. P. Grey, Electrochem. Solid-State Lett., 2002, 5, A263, DOI:10.1149/1.1513001.
- M. H. Rossouw and M. M. Thackeray, Mater. Res. Bull., 1991, 26, 463, DOI:10.1016/0025-5408(91)90186-P.
- T. L. Burnett and P. J. Withers, Nat. Mater., 2019, 18, 1041, DOI:10.1038/s41563-019-0402-8.
- H. Seiler, J. Appl. Phys., 1983, 54, R1–R18, DOI:10.1063/1.332840.
- C. Julien, Solid State Ionics, 2000, 136–137, 887, DOI:10.1016/S0167-2738(00)00503-8.
- R. Fitzgerald, K. Keil and K. F. Heinrich, Science, 1968, 159, 528, DOI:10.1126/science.159.3814.528.
- G. E. Lloyd, Mineral. Mag., 1987, 51, 3, DOI:10.1180/minmag.1987.051.359.02.
- P. Senthil Kumar, A. Sakunthala, M. Prabu, M. V. Reddy and R. Joshi, Solid State Ionics, 2014, 267, 1, DOI:10.1016/j.ssi.2014.09.002.
- E. Flores, P. Novák, U. Aschauer and E. J. Berg, Chem. Mater., 2020, 32, 186, DOI:10.1021/acs.chemmater.9b03202.
- M. Inaba, Y. Iriyama, Z. Ogumi, Y. Todzuka and A. Tasaka, J. Raman Spectrosc., 1997, 28, 613, DOI:10.1002/(SICI)1097-4555(199708)28:8<613::AID-JRS138>3.0.CO;2-T.
- C. M. Julien and M. Massot, Mater. Sci. Eng., B, 2003, 100, 69, DOI:10.1016/S0921-5107(03)00077-1.
- H. Koga, L. Croguennec, P. Mannessiez, M. Ménétrier, F. Weill, L. Bourgeois, M. Duttine, E. Suard and C. Delmas, J. Phys. Chem. C, 2012, 116, 13497, DOI:10.1021/jp301879x.
- P. Lanz, C. Villevieille and P. Novák, Electrochim. Acta, 2014, 130, 206, DOI:10.1016/j.electacta.2014.03.004.
- S. Venkatraman and A. Manthiram, Chem. Mater., 2003, 15, 5003, DOI:10.1021/cm034757b.
- Y. Arachi, H. Kobayashi, S. Emura, Y. Nakata, M. Tanaka, T. Asai, H. Sakebe, K. Tatsumi and H. Kageyama, Solid State Ionics, 2005, 176, 895, DOI:10.1016/j.ssi.2004.10.024.
- Z. Lu, Z. Chen and J. R. Dahn, Chem. Mater., 2003, 15, 3214, DOI:10.1021/cm030194s.
- N. Guerrini, L. Jin, J. G. Lozano, K. Luo, A. Sobkowiak, K. Tsuruta, F. Massel, L.-C. Duda, M. R. Roberts and P. G. Bruce, Chem. Mater., 2020, 32, 3733, DOI:10.1021/acs.chemmater.9b04459.
- R. A. House, G. J. Rees, M. A. Pérez-Osorio, J.-J. Marie, E. Boivin, A. W. Robertson, A. Nag, M. Garcia-Fernandez, K.-J. Zhou and P. G. Bruce, Nat. Energy, 2020, 5, 777, DOI:10.1038/s41560-020-00697-2.
- Z. He, Z. Wang, Z. Huang, H. Chen, X. Li and H. Guo, J. Mater. Chem. A, 2015, 3, 16817, 10.1039/C5TA04424C.
- S. Alagar, C. Karuppiah, R. Madhuvilakku, S. Piraman and C.-C. Yang, ACS Omega, 2019, 4, 20285, DOI:10.1021/acsomega.9b02766.
- S. Gao, Y. Zhang, H. Zhang, D. Song, X. Shi and L. Zhang, New J. Chem., 2017, 41, 10048, 10.1039/C7NJ01759F.
- X. Zhang, M. Lengyel and R. L. Axelbaum, AIChE J., 2014, 60, 443, DOI:10.1002/aic.14287.
- B. Strehle, J. Yoon, F. Friedrich and H. A. Gasteiger, J. Electrochem. Soc., 2022, 169, 60521, DOI:10.1149/1945-7111/ac766c.
- P. K. Nayak, J. Grinblat, M. Levi, Y. Wu, B. Powell and D. Aurbach, J. Electroanal. Chem., 2014, 733, 6, DOI:10.1016/j.jelechem.2014.09.005.
- N. Dupré, J.-F. Martin, J. Oliveri, P. Soudan, A. Yamada, R. Kanno and D. Guyomard, J. Power Sources, 2011, 196, 4791, DOI:10.1016/j.jpowsour.2010.07.049.
- F. Klein, C. Pfeifer, J. Bansmann, Z. Jusys, R. J. Behm, M. Wohlfahrt-Mehrens, M. Lindén and P. Axmann, J. Electrochem. Soc., 2022, 169, 120533, DOI:10.1149/1945-7111/acaa5c.
Footnotes |
| † Electronic supplementary information (ESI) available: Further SEM images, XRD overview and more detailed pattern, analysis of Li+/Ni2+ disorder, specific capacity analysis of the first cycle, EBSD data and further Raman evaluation. See DOI: https://doi.org/10.1039/d2ta05957f |
| ‡ Lattice parameters were approximately converted to the hexagonal lattice, using the formula of Ohzuku et al.18 |
| This journal is © The Royal Society of Chemistry 2023 |