 Open Access Article
Facile synthesis of functionalized porous carbon from bitumite mixed with waste powder char for excellent wastewater purification
Yufeng
Yin
 *a,
Yiting
Zhao
a and
Jing
Wang
b
aSchool of Chemical and Environmental Engineering, China University of Mining & Technology (Beijing), Beijing 100083, China. E-mail: yinyfchina@gmail.com
bDalian Institute of Chemical Physics, Chinese Academy of Sciences, Dalian 116023, Liaoning, China
First published on 13th April 2023
Abstract
Waste powder char (WPC) is harmful to the environment and abundant in the production process of the coal chemical industry, but produces relatively low heat energy and releases large amounts of coal ash if it is burned directly. To efficiently solve this issue and create high value materials, three-dimensional hierarchical porous carbons (HPCs) with abundant oxygen-containing groups were prepared from Yulin bitumite (YL) mixed with WPC by combined pyrolysis carbonization and steam activation. The effects of preparation parameters, including WPC doping amount, activation temperature, and activation time, on pore structure development and adsorption capacity of methylene blue from wastewater were explored in detail. The obtained HPCs are microporous structures with additional mesopores and their largest specific surface area (SSA) reached 1299.75 m2 g−1 (8-YLHPC-950–3). Furthermore, 8-YLHPC-900–3 presents a high oxygen content of 15.92 wt%. The SSA and total pore volume (1081.67 m2 g−1 and 0.685 cm3 g−1) of the HPC with 8 wt% WPC doping are larger than those without WPC doping (1155.36 m2 g−1 and 0.755 cm3 g−1). Moreover, these HPCs show superior adsorption of methylene blue in aqueous solution (301 mg g−1 for 8-YLHPC-900–3 compared with 198 mg g−1 for 0-YLHPC-900–3), especially when the HPC was prepared with a WPC doping amount of 8 wt%, activation temperature of 900 °C, steam flow of 0.8 mL g−1 h−1, and activation time of 3 h. These conditions give an optimal adsorption capacity of 301 mg g−1 methylene blue adsorption value (MBV). We introduce a value-added utilization approach for coal-based solid waste and a potential feedstock for adsorption material in the purification of wastewater. The results achieved in this study provide a green and environmentally friendly method for the preparation of HPCs from waste powder char that not only is an industrial reference for the removal of methylene blue from wastewater by HPCs but also contributes to sustainable development in the coal chemical industry.
Sustainability spotlightMethylene blue in wastewater is extremely difficult to biodegrade due to its stability and flexibility; this endangers biological safety and has become one of the most challenging environmental problems in the international community. We innovatively prepared oxygen-rich hierarchical porous adsorption materials from low-rank coal and waste powder char by a synergistic carbonization and mild activation method. These materials can not only effectively remove methylene blue from wastewater but also realize the high value-added utilization of coal-based solid waste and solve the problem of green and sustainable development in the coal chemical industry. This research contributes to water purification and safety and aligns with Goal 6: Clean Water and Sanitation of the UN SDGs. |
1. Introduction
Industrial development and human activities have resulted in increasingly severe water pollution, so the effective removal of methylene blue has attracted broad global attention.1,2 Methylene blue removal from textile industry wastewater is an urgent and serious problem. Synthetic methylene blue is difficult to biodegrade owing to its stronger stability and flexibility compared to natural dyes. Thus, effective methylene blue removal from wastewater has become one of the most challenging environmental issues for international society.3 In this respect, multiple methods, such as membrane separation,4 chemical reaction binding5 and adsorption,6 have been applied to the adsorption of methylene blue. The commonly used adsorbents are porous carbons (PCs), zeolite, carbon aerogels, MOFs, carbon nanotubes and graphene sheets.7,8 Among these, PCs have become one of the most competitive wastewater treatment materials because of their high efficiency, simple operation, low cost, and stable physicochemical properties.9,10 PCs are primarily prepared from biomass wastes, petroleum, coal, and their derived products through a template-based method, chemical activation or physical activation.11 While a variety of raw materials can be used, coal and its derivatives are still the main raw material for PCs due to their abundance, low cost, and high carbon content.Hierarchical porous carbon, which has various proportions of micropores, mesopores and macropores, can achieve admirable adsorption behavior based on its particular pore size distribution, developed porosity, and abundant functional groups, as adsorbate molecules can be transferred rapidly in the pore channels of HPCs.12 It is worth noting that micro/meso/macropores play different roles in the adsorption process. The micropores of HPCs mainly determine the adsorption capacity owing to their large proportion of the SSA and pore volume and can offer abundant adsorption sites for methylene blue molecules. Further, the mesopores are regarded as the transmission channel for molecules, while the effect of macropores is as a buffer which ensures that molecules can enter the pore channels quickly.13 Zhuang et al.14 adopted coal tar pitch as a precursor to prepare HPCs, which had excellent adsorption of methylene blue. Mbarki et al.15 prepared HPCs from corncobs by hydrothermal carbonization and CO2 activation; the specific surface area reached 1111 m2 g−1 and the methylene blue adsorption reached 561.5 mg g−1 at 25 °C. The surface of the HPC was found to be mainly basic, with a total amount of basic groups of 0.743 mmol g−1 compared to 0.550 mmol g−1 of acidic groups. The abundant functional groups are conducive to boosting the application of HPCs.16 Furthermore, chemical activation usually requires three to four times as many activators as the raw material, including KOH, ZnCI2 and NaOH, which are more expensive, corrosive to the equipment and produce more corrosive gases during activation processes.9,17 Simultaneously, the resulting porous carbon requires an additional pickling step to achieve neutrality. In contrast, steam activation is a green and sustainable preparation process that allows the large-scale industrial production of HPCs due to its low cost, simple operation and non-corrosive properties.18
Waste powder char (WPC) is a typical coal-based solid waste produced in large quantities by the coal chemical industry. WPC shows higher ash content and lower moisture content and volatile content than raw coal; it is a manual heat treatment by-product after high temperature carbonization. Currently, WPC is thrown away or directly buried, resulting in environmental pollution and the waste of coal resources. WPC exhibits low heat energy release and a high ignition point which makes it difficult to burn, although it can be recycled by combustion. However, WPC contains abundant carbon and oxygen contents which facilitate the preparation of HPCs for methylene blue removal from wastewater when mixed with bituminous coal. It is worth noting that this process could achieve the high value-added utilization of coal-based solid waste (WPC) and the environmentally friendly preparation of three-dimensional porous carbon. Coal is the primary energy resource in China and Yulin low metamorphism bitumite has abundant reserves, around 149 billion tons in Shaanxi, China. Although the energy density of low-rank bituminous coal is poor, its high reactivity and oxygen-containing functional groups have attracted it increased attention as a precursor for HPCs. However, in liquid-phase adsorption applications, HPCs with abundant oxygen-containing functional groups obtained from low-grade bituminous coal mixed with coal-based solid waste by synergistic pyrolytic carbonization and steam activation have rarely been reported.
In this study, WPC and YL were adopted as the raw materials to prepare three-dimensional HPCs by a typical two-step method for the purification of wastewater containing methylene blue. First, the raw material was pyrolysis carbonized in a tube furnace and then the obtained coal char was activated by steam. The effects of WPC doping ratio, activation temperature, and activation time on the pore structure and adsorption performance of HPCs were explored. In addition, a semi-quantitative analysis of the surface oxygen-containing functional groups of the precursors and HPC was discussed. Herein, coal-based solid waste is used to prepare a high value-added porous adsorption material for wastewater renovation, which is always attractive and significant. The results achieved in this study not only exhibit the industrial significance of HPCs for the removal of methylene blue from wastewater, but also helpfully improve the high value-added utilization of coal-based solid waste and bitumite.
2. Experimental
2.1 Materials
Yulin bitumite collected from Shaanxi, China and waste powder char provided by Shaanxi Coal and Chemical Industry Group Co. Ltd. were used as raw materials in this research. The proximate and ultimate analyses of YL and WPC are listed in Table 1. Reagent grade chemicals were used in all tests, as shown in Table 2. The purity of the chemicals was determined by gas chromatography (GC). Methylene blue (MB) was provided by Xilong Chemical Co. Ltd. Sodium thiosulfate, hydrochloric acid and starch were purchased from Tianjin Chemical Reagent Research Institute Co. Ltd.| Sample | Proximate analysis (wt%) | Ultimate analysis (wt%) | |||||||
|---|---|---|---|---|---|---|---|---|---|
| Mad | Ad | VMdaf | FCbdaf | Cdaf | Hdaf | Obdaf | Ndaf | Sdaf | |
| a A: ash, M: moisture, FC: fixed carbon, VM: volatile matter, ad: air dry basis, d: dry basis, daf: dry ash-free, b: by difference. | |||||||||
| YL | 6.49 | 2.51 | 29.75 | 68.48 | 75.04 | 4.76 | 18.21 | 1.28 | 0.71 |
| WPC | 5.18 | 7.78 | 8.50 | 84.38 | 78.26 | 1.74 | 19.25 | 0.64 | 0.11 |
| Component | CAS number | Supplier | Purity (mass fraction) | Analysis method |
|---|---|---|---|---|
| Methylene blue | 61-73-4 | Xilong Chemical Co. Ltd | 0.99 | GC |
| Sodium thiosulfate | 2319-84-8 | Tianjin Chemical Reagent Research Institute Co. Ltd | 0.99 | GC |
| Hydrochloric acid | 7647-01-0 | Tianjin Chemical Reagent Research Institute Co. Ltd | 0.37 | GC |
| Starch | 9005-84-9 | Tianjin Chemical Reagent Research Institute Co. Ltd | 0.99 | GC |
2.2 Preparation of HPCs
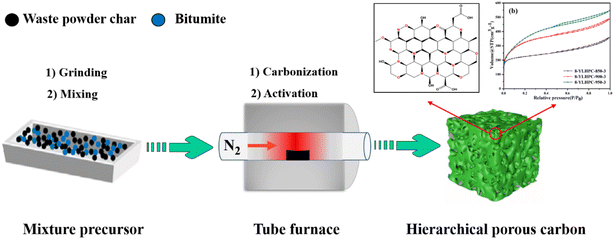
The HPCs were prepared by a representative two-stage process of carbonization and steam activation under N2 flow at a heating rate of 10 °C min−1. In step 1 (carbonization), the YL mixed with WPC was filled into a home-made mold and extruded into a cake block with a diameter of 25 mm and a thickness of 8 mm under a pressure of 200 MPa. After natural air drying, it was broken into granular material with particle sizes of 3–10 mm. Subsequently, the mixture was carbonized at 600 °C for 45 min in a horizontal tube furnace. The obtained char is denoted as x-YLChar, where x = 0, 4, 8, and 12 for WPC weight percentages of 0%, 4%, 8%, and 12%. In step 2 (steam activation), the x-YLChar was activated at different temperatures (850, 900 and 950 °C), and times (2, 3 and 4 h) with 0.8 mL g−1 h−1 steam flow. Then, the prepared hierarchical porous carbons samples were dried at 150 °C for 3 h in a vacuum drying oven. The HPCs were denoted as x-YLHPC-w–y (x = 0, 4, 8 and 12, referring to the weight percentages of WPC of 0%, 4%, 8% and 12%, respectively; w = 850, 900, and 950, referring to the activation temperatures of 850, 900, and 950 °C, respectively; y = 2, 3, and 4, referring to the activation times of 2, 3, and 4 h, respectively). A schematic illustration of the preparation process of HPCs is shown in Fig. 1 and all experiments were carried out in parallel.2.3 Material characterization
The ultimate analyses of YL, WPC, and HPC were characterized by an elemental analyzer (Vario EL III, German). All samples which need to be characterized were pulverized below 200 mesh and dried at 150 °C for 12 h. The microcrystalline structures were characterized by X-ray diffraction (XRD) measurements on a Bruker D8 Advance X-ray diffractometer using Cu Kα radiation (λ = 0.15418 nm) operating at 40 mA and 40 kV (10° min−1 from 10 to 90°). Raman analysis of the YL, 8-YLChar and HPC samples was carried out on a Bruker Senterra Raman spectrometer by 532 nm laser excitation using a microscope. The Raman spectra were obtained in the range of 1000–2000 cm−1 and all scans were performed three times. Field-emission scanning electron microscopy (FESEM) images were taken by a Merlin Zeiss at 5.0 kV to observe the microscopic appearance of the samples. The surface chemical properties of the samples were characterized qualitatively using a Nicolet Magna IR560 Fourier-transform infrared (FTIR) spectrometer. X-ray photoelectron spectroscopy (XPS) data were collected using a Thermo ESCALAB 250Xi spectrometer to analyze the surface oxygen-containing functional groups. N2 adsorption–desorption isotherms were measured at −196 °C with a Quantachrome Autosorb-iQ instrument. The SSAs were obtained by applying the Brunauer–Emmett–Teller (BET) method. Micropore surface area and micropore volume were calculated using the t-plot method. Total pore volume was determined at a relative pressure P/P0 of 0.99. The pore size distribution was calculated from N2 adsorption data using the density functional theory (DFT) model method. The concentrations of MB were measured by a UV-visible spectrophotometer at the maximum absorbance wavelength of 665 nm.2.4 Adsorption experiments
HPCs were selected as adsorbents to evaluate their adsorption performance for MB. 10 mg HPCs were added to 12 mL MB solution (C0 = 150 mg L−1) and the mixture was shaken at 30 °C and 200 rpm for 30 min. After the completion of adsorption, the MB concentration was determined by spectrophotometry at 665 nm (TU-1900 double beam UV-vis spectrophotometer). The methylene blue adsorption capacity MBV (mg g−1) was calculated based on the equationwhere C0 and C (mg L−1) are the methylene blue concentrations at the initial and final steps, respectively, V (L) is the volume of dye solution, and W (g) is the mass of HPCs.
3. Results and discussion
3.1 Morphology and microstructure characterization
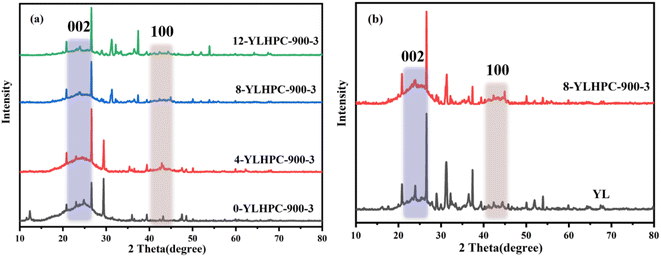
As shown in Table 1, WPC has relatively low moisture content, high ash content and fixed carbon content compared with YL. Note that the higher carbon content makes WPC suitable for the preparation of porous carbon according to the ultimate analysis.As a rapid and non-destructive technique, XRD is one of the most commonly used methods for revealing the microcrystalline structure of coal char and HPCs.19 As shown in Fig. 2, these spectra include two distinct peaks at 22° and 43° which are attributed to the interlayer reflections of the (002) and (100) planes, respectively.20 The (002) peaks of x-YLHPC-w–y in Fig. 2(a) became weak and faintly broadened, indicating the decrease of graphitization degree with the percentage of WPC increasing from 0 wt% to 12 wt%. Compared with that of YL, the (100) peak intensity of 8-YLHPC-900–3 at about 43° was significantly enhanced, as seen in Fig. 2(b), which demonstrates that 8-YLHPC-900–3 possesses amorphous character and consists of small areas of ordered graphene sheets after steam activation.
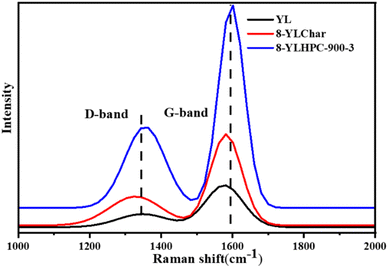
Raman spectroscopy was also used to measure the defective, disordered structure and crystallinity of the as-prepared samples. Thus, it was used to characterize the structural evolution of the 8-YLChar and 8-YLHPC-900–3 samples derived from YL and WPC under synergistic carbonization and steam activation to analyze the relationship between the amorphous carbon structure and graphitized carbon. Two characteristic peaks located at about 1342 cm−1 and 1579 cm−1 are identified in the Raman spectra (Fig. 3) and are attributed to the D-band (disordered or defective structure of carbon materials) and G-band (the sp2 carbon-bonded graphitic structure), respectively.21,22 The amorphous degree of carbon materials is reflected by the value of ID/IG (ID and IG are the intensities of the D- and G-bands, respectively). Here, the ID/IG values of YL and 8-YLChar are 0.42 and 0.62, respectively. A slight intensity ratio increase is observed with the use of carbonization which is related to the formation of polycyclic aromatic units via the condensation of the macromolecular network in the char. During this stage, the chemical bonds between the macromolecular compounds are broken to form micromolecules. These micromolecules deposit on the surface of the char, resulting in the formation of a defect structure. The ID/IG ratio increased to 0.98 after the activation of 8-YLChar. This indicates that the structure of 8-YLHPC-900–3 has more defects, likely because its crystalline structure is destroyed by severe steam activation at the temperature of 900 °C.
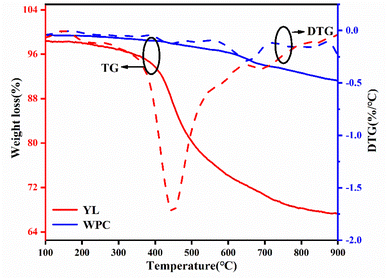
As illustrated in Fig. 4, the thermal stability of WPC is better than that of YL. Even at 900 °C, the mass loss of WPC is still less than 10%, because it is a carbonization product and many side and branched chains of polycyclic aromatic hydrocarbons have already been lost during this process. However, the mass loss of YL presents a big difference and could be divided into three stages. At the early stage of pyrolysis (<400 °C), the mass loss is mainly the gasification of free water and combined water and the decomposition of unstable organic small molecules to produce CO, CO2, CH4, etc. The main mass loss (about 30%) occurs at 400–700 °C. This stage is mainly the decomposition and integration of organic macromolecules, which produces large amounts of coal tar in addition to CO, CO2 and CH4. The third stage (>700 °C) has no obvious weight loss, indicating that the prepared porous carbon will show good thermal stability. Understanding the stability of the raw material provides a theoretical basis for the selection of the activation temperature.
0-YLChar and 8-YLChar were verified by FESEM to observe the microstructural differences of the samples after carbonization. According to the SEM graphs in Fig. 5(a) and (b), compared with the surface of 0-YLChar (Fig. 5(a)), the surface of 8-YLChar (Fig. 5(b)) is rougher and filled with many particles which are beneficial to the diffusion of the steam activator, thus promoting the development of a porous structure.23 This also could be proved by the N2 adsorption–desorption results of the x-YLHPC-900–3, as shown in Fig. 8(a). After steam activation, the surface of 8-YLHPC-900–3 presents a highly porous honeycomb structure with some irregular particles, seen in Fig. 5(c) and (d). 8-YLHPC-950–3, in Fig. 5(e) and (f), has a denser pore structure than 8-YLHPC-900–3 due to its complete activation at higher activation temperatures. Meanwhile, the prepared activated samples reveal a typical three-dimensional structure with, particularly in 8-YLHPC-950–3, a hierarchical porous structure with a pore size distribution made up of a combination of different pore types (macropores, mesopores and abundant micropores) after etching with an excess of steam. The three-dimensional hierarchical porous structure of the sample features a large number of active sites for subsequent adsorption. In addition, the prepared HPC shows well-developed porosity in its microcrystalline and amorphous structure. Overall, the FESEM results demonstrate the effectiveness of steam activation for pore structure development for the HPC from x-YLChar.
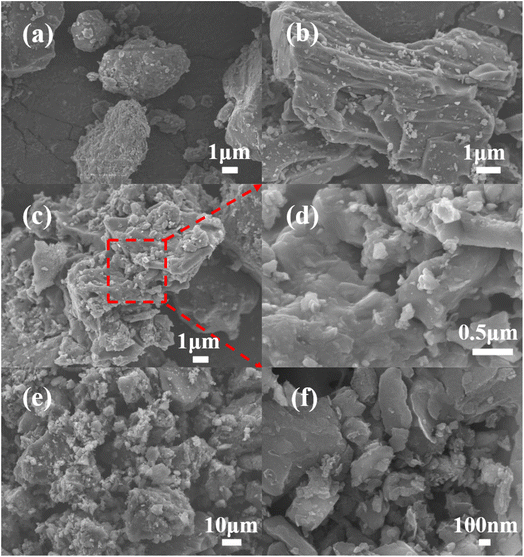 | ||
| Fig. 5 SEM images of (a) 0-YLChar, (b) 8-YLChar, (c and d) 8-YLHPC-900–3 and (e and f) 8-YLHPC-950–3. | ||
3.2 Surface chemistry analysis
Ultimate and XPS analysis results of YL and 8-YLHPC-900–3 are shown in Table 3. The oxygen content of YL exhibits an obvious decrease from 18.21 wt% to 11.03 wt% after carbonization and activation treatment, whereas the carbon content increased significantly, indicating the partial removal of oxygen-containing functional groups and an improvement of the properties of YL. Additionally, the atomic ratio of O/C was obviously reduced, illustrating that dehydration, decarboxylation, aromatization, and integration reactions occurred during the preparation of HPCs.| Sample | Ultimate analysis (wt%) | XPS analysisc (%) | ||||||||
|---|---|---|---|---|---|---|---|---|---|---|
| O/C | H/C | Cdaf | Hdaf | Odafa | Ndaf | Sdafb | C 1s | O 1s | N 1s | |
| a Calculated by difference. b Total sulfur in dried basis. c Atomic ratio. | ||||||||||
| YL | 0.243 | 0.063 | 75.04 | 4.76 | 18.21 | 1.28 | 0.71 | 81.00 | 17.68 | 1.33 |
| 8-YLHPC-900–3 | 0.135 | 0.071 | 81.57 | 5.78 | 11.03 | 0.96 | 0.66 | 83.74 | 15.92 | 0.33 |
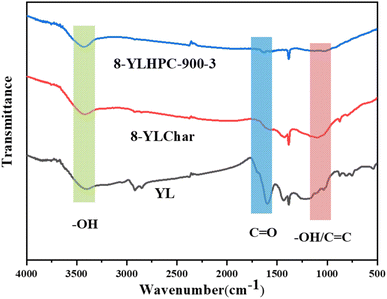
FTIR spectroscopy was employed to detect the surface chemical properties of YL, 8-YLChar and 8-YLHPC-900–3 derived from the different thermal conversion processes. As shown in Fig. 6, it is obvious that the oxygen-containing functional groups of 8-YLHPC-900–3 are different from those of YL and 8-YLChar based on the spectral patterns of 8-YLHPC-900–3, 8-YLChar and YL over the range of 4000–400 cm−1. In general, the side chains in YL are mainly composed of methoxyl, phenolic hydroxyl and aldehyde groups. 8-YLHPC-900–3 contains an abundance of oxygen-containing groups, such as phenolic hydroxyl, carboxyl, carbonyl, and aromatic ether groups, according to its FTIR spectrum (Fig. 6). In addition, condensation polymerization of small side chains and branched organic molecules also occurs to form the coal char polymer framework of HPC, which may be due to the synergistic carbonization and integrated activation reactions of YL and WPC. The carbon polymer framework of HPC is composed of dense aromatic hydrocarbons with many stable oxygen-containing functional groups. Based on Fig. 6, the functional groups of 8-YLHPC-900–3 are –OH at 3432 cm−1, –CH in arenes/epoxide at 3250–3000 cm−1, C![[double bond, length as m-dash]](https://www.rsc.org/images/entities/char_e001.gif) O at 1625 cm−1, –OH/C
O at 1625 cm−1, –OH/C![[double bond, length as m-dash]](https://www.rsc.org/images/entities/char_e001.gif) C in arenes at 1410 cm−1, and aryl ether at 1200−1005 cm−1.21 Compared with YL and 8-YLChar, the –COOH (1620 cm−1) and –OH (1350–1000 cm−1) contents of 8-YLHPC-900–3 are relatively low based on its weaker peak intensities; this is attributed to intramolecular and intermolecular decarboxylation, dehydration and aromatization during the preparation process.24,25 However, the intensities of the –OH (3600–3200 cm−1) peak and C–O (1300–1100 cm−1) of ether peak present a slight increase. This might be due to thermochemical reaction processes causing structural damage to the organic macromolecules of 8-YLHPC-900–3, thus generating new functional groups. Some scholars have reported that steam works not only as a dehydrating agent but also as an oxidizing agent during the activation process. Furthermore, these oxygen-containing species improve the wastewater purification performance of the HPCs via boosted wettability and the formation of chemisorption active sites.
C in arenes at 1410 cm−1, and aryl ether at 1200−1005 cm−1.21 Compared with YL and 8-YLChar, the –COOH (1620 cm−1) and –OH (1350–1000 cm−1) contents of 8-YLHPC-900–3 are relatively low based on its weaker peak intensities; this is attributed to intramolecular and intermolecular decarboxylation, dehydration and aromatization during the preparation process.24,25 However, the intensities of the –OH (3600–3200 cm−1) peak and C–O (1300–1100 cm−1) of ether peak present a slight increase. This might be due to thermochemical reaction processes causing structural damage to the organic macromolecules of 8-YLHPC-900–3, thus generating new functional groups. Some scholars have reported that steam works not only as a dehydrating agent but also as an oxidizing agent during the activation process. Furthermore, these oxygen-containing species improve the wastewater purification performance of the HPCs via boosted wettability and the formation of chemisorption active sites.
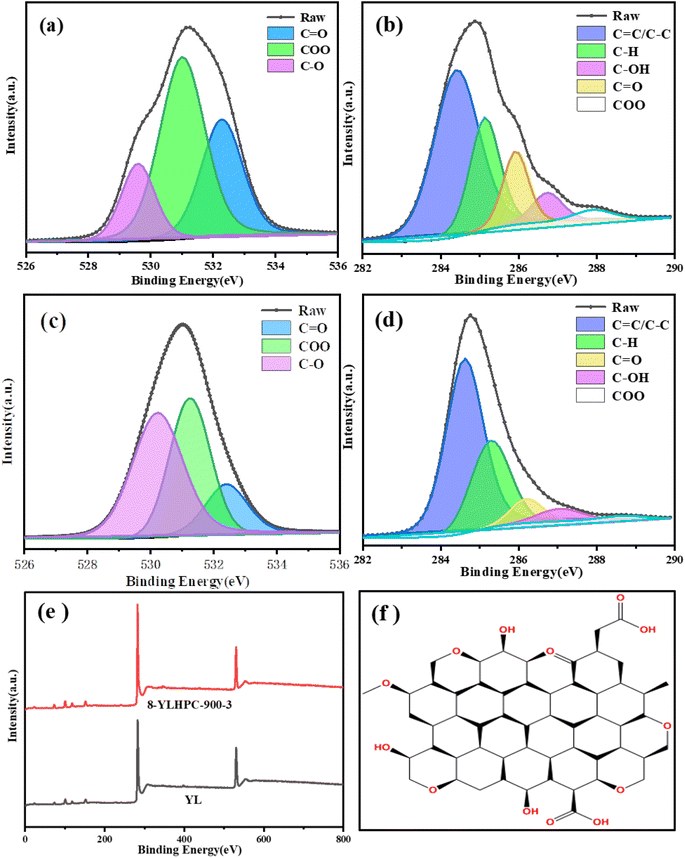
To further confirm the evolution of the surface composition and chemical state during the preparation process, semi-quantitative investigations of YL and 8-YLHPC-900–3 were carried out with an XPS analyzer.26,27 The high-resolution C 1s and O 1s peaks were curve-fitted using the XPSPeak software in accordance with relevant literature and the test results are similar to the FTIR results. As shown in Fig. 7 and Table 4, the contents of C![[double bond, length as m-dash]](https://www.rsc.org/images/entities/char_e001.gif) C/C–C and C
C/C–C and C![[double bond, length as m-dash]](https://www.rsc.org/images/entities/char_e001.gif) O increased from 53.40% to 60.27% and 16.81% to 46.87%, respectively, while the contents of C–OH and COO exhibited a significant decline. The C–OH and –COOH might be transformed to C
O increased from 53.40% to 60.27% and 16.81% to 46.87%, respectively, while the contents of C–OH and COO exhibited a significant decline. The C–OH and –COOH might be transformed to C![[double bond, length as m-dash]](https://www.rsc.org/images/entities/char_e001.gif) O and C
O and C![[double bond, length as m-dash]](https://www.rsc.org/images/entities/char_e001.gif) C/C–C, respectively, which agrees with the foregoing analysis of the FTIR spectra. This phenomenon may be caused by the condensation polymerization and aromatization of organic molecules at high temperatures, where some of the oxygen-containing functional groups are released as water, carbon dioxide, and small molecules of coal tar. Although the oxygen content of the prepared HPCs was reduced, the figure is still as high as 15.92%, as seen in the XPS analysis in Table 4. The obtained oxygen-rich hierarchical porous carbon should show superior performance in adsorption applications due to its high wettability and number of active sites. The presumed surface oxygen-containing functional groups of 8-YLHPC-900–3 are shown in Fig. 7(f), based on the ultimate analysis, FTIR and XPS characterization analysis results.
C/C–C, respectively, which agrees with the foregoing analysis of the FTIR spectra. This phenomenon may be caused by the condensation polymerization and aromatization of organic molecules at high temperatures, where some of the oxygen-containing functional groups are released as water, carbon dioxide, and small molecules of coal tar. Although the oxygen content of the prepared HPCs was reduced, the figure is still as high as 15.92%, as seen in the XPS analysis in Table 4. The obtained oxygen-rich hierarchical porous carbon should show superior performance in adsorption applications due to its high wettability and number of active sites. The presumed surface oxygen-containing functional groups of 8-YLHPC-900–3 are shown in Fig. 7(f), based on the ultimate analysis, FTIR and XPS characterization analysis results.
3.3 Textural properties and adsorption performance
The effects of WPC doping ratio, activation temperature, and activation time on the yield and porous structure of HPCs are shown in Table 5. The pore structures of x-YLHPC-w–y were investigated by N2 adsorption–desorption experiments, in accordance with previous reports.28,29 The adsorption performance was evaluated by MBV.| Sample | S BET (m2 g−1) | V t (cm3 g−1) | V micro (cm3 g−1) | V meso (cm3 g−1) | D ave (nm) | Yield (wt%) |
|---|---|---|---|---|---|---|
| a S BET: specific surface area from multiple BET method. b V t: total pore volume at P/P0 = 0.99. c V mic: t-method micropore surface area and micropore volume. d V mes: difference of Vt and Vmic. e D ave: average pore diameter. | ||||||
| 0-YLHPC-900–3 | 1081.67 | 0.685 | 0.148 | 0.452 | 2.47 | 25.2 |
| 4-YLHPC-900–3 | 1165.07 | 0.722 | 0.127 | 0.471 | 2.48 | 18.0 |
| 8-YLHPC-900–3 | 1155.36 | 0.755 | 0.077 | 0.620 | 2.61 | 15.7 |
| 12-YLHPC-900–3 | 1105.30 | 0.769 | 0.097 | 0.608 | 2.78 | 15.6 |
| 8-YLHPC-850–3 | 845.92 | 0.552 | 0.188 | 0.328 | 2.41 | 31.7 |
| 8-YLHPC-950–3 | 1299.75 | 0.853 | 0.210 | 0.643 | 2.86 | 5.9 |
| 8-YLHPC-900–2 | 926.56 | 0.564 | 0.189 | 0.315 | 2.44 | 28.7 |
| 8-YLHPC-900–4 | 916.71 | 0.676 | 0.047 | 0.637 | 2.95 | 10.7 |
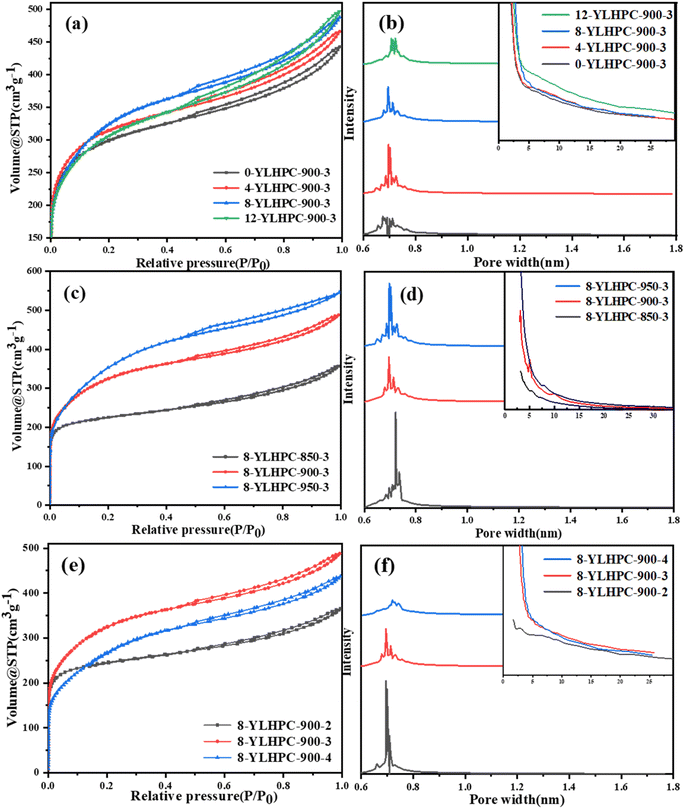 | ||
| Fig. 8 Nitrogen adsorption isotherms and pore size distribution patterns of x-YLHPC-w–y with different WPC doping ratios (a and b), activation temperatures (c and d) and activation times (e and f). | ||
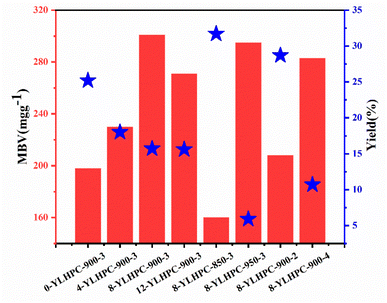
Porous carbon is limited by the diameter of adsorbate molecules when adsorbing substances. Studies have shown that the pore diameter of porous carbon should be 1.7 times the diameter of adsorbate molecules for effective adsorption.31,32 Generally, the MBV is used to reflect the development degree of pores with a diameter of 1.5–10 nm.20,33 As shown in Fig. 9, the MBVs of x-YLHPC-900–3 significantly differ at different WPC doping ratios. With the WPC doping ratios from 0 wt% to 12 wt%, the MBVs are 198, 230, 301 and 271 mg g−1, showing a trend of first increasing and then decreasing with the rise of WPC doping ratio. The trend shows that WPC doping is advantageous to achieving a more intense activation reaction due to the mixture containing more carbon matrix. However, excessive amounts of WPC lead to forming fewer initial micropores, which means obtaining fewer mesopores under the same activation reaction conditions. The adsorption performance is consistent with the nitrogen adsorption and desorption characterization results, demonstrating that an 8 wt% WPC doping ratio is optimal.
The MBVs of 8-YLHPC-w–3 prepared at different steam activation temperatures present significant differences, as seen in Fig. 9. The MBVs of 8-YLHPC-900–3 (301 mg g−1) and 8-YLHPC-950–3 (295 mg g−1) are significantly larger than that of 8-YLHPC-850–3 (160 mg g−1). This is because the pore structure development of 8-YLHPC-900–3 and 8-YLHPC-950–3 is excellent due to the more complete activation reaction between the mixture and steam, exhibiting a high adsorption performance of methylene blue. The MBV adsorption performances are similar to the nitrogen adsorption and desorption results, but excessive activation temperature decreases the yield (5.9% of 8-YLHPC-950–3) of HPCs.36 Therefore, the optimum activation temperature was selected to be 900 °C by considering the heating energy consumption and yield of HPCs.
The methylene blue adsorption behaviors of HPCs show a good positive correlation with SSA and total pore volume; that is, the MBVs (Fig. 9) increase with the rise of SSA and total pore volume, which are closely related to the activation time. However, an overlong activation time also leads to ablation and collapse of the hole wall, resulting in a poorer MBV (the MBV of 8-YLHPC-900–4 is less than that of 8-YLHPC-900–3). Normally, the adsorption performance of HPCs mainly depends on micropores and small size mesopores, due to their large proportion of pore volume and specific surface area. However, the channel effect of macropores and transitional role of mesopores allow the adsorbate molecules pass into the micropores, which can promote the adsorption performance of micropores and small mesopores. Sometimes mesopores can also absorb a certain amount of macromolecular organic substances in the liquid phase.37 Therefore, porous carbon with a wider distribution of micropores, mesopores and macropores prepared at a longer activation time shows better adsorption of methylene blue.
4. Conclusion
Three-dimensional structural HPCs with excellent methylene blue adsorption performance in aqueous solution were successfully prepared through a synergistic pyrolysis carbonization and steam activation reaction of bitumite mixed with waste powder char. The SSA and pore size distribution of HPCs can be efficiently controlled by different activation temperatures and times. The obtained HPCs present a better hierarchical pore structure and more excellent adsorption performance than materials prepared without WPC doping. 8-YLHPC-950–3 shows an excellent SSA and total pore volume up to 1299.75 m2 g−1 and 0.853 cm3 g−1, respectively. The obtained HPCs exhibit good adsorption performance and the highest MBV of 8-YLHPC-900–3 reaches 301 mg g−1. Meanwhile, the prepared HPCs possess abundant oxygen-containing functional groups and the highest oxygen content reached 15.92 wt%, according to the XPS analysis. Hence, this mild, sustainable and industrially available strategy not only prepares promising coal-based HPCs for adsorption materials with a better performance but also achieves the high value-added utilization of the coal-based solid waste. Future work will focus on the evolution mechanism of the oxygen-containing functional groups of HPCs during the preparation process by in situ characterization techniques.Author contributions
Yufeng Yin provided the idea of this work and designed relevant experiments, analyzed experiment results and composed manuscript. Yiting Zhao prepared and characterized the samples, and analyzed experiment results. Jing Wang offered great help during the process of experiment. All authors reviewed the manuscript.Conflicts of interest
There are no conflicts to declare.References
- A. Mianowski, M. Owczarek and A. Marecka, Surface Area of Activated Carbon Determined by the Iodine Adsorption Number, Energy Sources, Part A, 2007, 29(9), 839–850 CrossRef CAS.
- M. A. Islam, M. J. Ahmed, W. A. Khanday, M. Asif and B. H. Hameed, Mesoporous activated carbon prepared from NaOH activation of rattan (Lacosperma secundiflorum) hydrochar for methylene blue removal, Ecotoxicol. Environ. Saf., 2017, 138, 279–285 CrossRef CAS PubMed.
- X. Zhao, X. Han, Z. Li, H. Huang, D. Liu and C. Zhong, Enhanced removal of iodide from water induced by a metal-incorporated porous metal–organic framework, Appl. Surf. Sci., 2015, 351, 760–764 CrossRef CAS.
- Z. Wang, B. Shi and L. Jia, Preparation of polyethersulfone nanofiltration membrane by UV photo-grafting and separation for dye solutions, Desalin. Water Treat., 2017, 92, 27–37 CrossRef CAS.
- C. Piccirillo, S. Perni, J. Gil-Thomas, P. Prokopovich, M. Wilson, J. Pratten and I. P. Parkin, Antimicrobial activity of methylene blue and toluidine blue O covalently bound to a modified silicone polymer surface, J. Mater. Chem., 2009, 19(34), 6167 RSC.
- J. Yin, M. Pei, Y. He, Y. Du, W. Guo and L. Wang, Hydrothermal and activated synthesis of adsorbent montmorillonite supported porous carbon nanospheres for removal of methylene blue from waste water, RSC Adv., 2015, 5(109), 89839–89847 RSC.
- C. Du, Z. Zhang, G. Yu, H. Wu, H. Chen, L. Zhou, Y. Zhang, Y. Su, S. Tan, L. Yang, J. Song and S. Wang, A review of metal organic framework (MOFs)-based materials for antibiotics removal via adsorption and photocatalysis, Chemosphere, 2021, 272, 129501 CrossRef CAS PubMed.
- L. Li, T. Hu, H. Sun, J. Zhang and A. Wang, Pressure-Sensitive and Conductive Carbon Aerogels from Poplars Catkins for Selective Oil Absorption and Oil/Water Separation, ACS Appl. Mater. Interfaces, 2017, 9(21), 18001–18007 CrossRef CAS PubMed.
- Y. Yin, D. Liang, D. Liu and Q. Liu, Preparation and characterization of three-dimensional hierarchical porous carbon from low-rank coal by hydrothermal carbonization for efficient iodine removal, RSC Adv., 2022, 12(5), 3062–3072 RSC.
- Y. Yin, Q. Liu, J. Wang and Y. Zhao, Recent insights in synthesis and energy storage applications of porous carbon derived from biomass waste: A review, Int. J. Hydrogen Energy, 2022, 47(93), 39338–39363 CrossRef CAS.
- Y. Yin, Q. Liu, Y. Zhao, T. Chen, J. Wang, L. Gui and C. Lu, Recent Progress and Future Directions of Biomass-Derived Hierarchical Porous Carbon: Designing, Preparation, and Supercapacitor Applications, Energy Fuels, 2023, 37(5), 3523–3554 CrossRef CAS.
- S. Cheng, S. Zhao, H. Guo, B. Xing, Y. Liu, C. Zhang and M. Ma, High-efficiency removal of lead/cadmium from wastewater by MgO modified biochar derived from crofton weed, Bioresour. Technol., 2022, 343, 126081 CrossRef CAS PubMed.
- Z. Hao, J. Cao, Y. Dang, Y. Wu, X. Zhao and X. Wei, Three-Dimensional Hierarchical Porous Carbon with High Oxygen Content Derived from Organic Waste Liquid with Superior Electric Double Layer Performance, ACS Sustainable Chem. Eng., 2019, 7(4), 4037–4046 CrossRef CAS.
- Q. Zhuang, J. Cao, Y. Wu, M. Zhao, X. Zhao, Y. Zhao and H. Bai, Heteroatom nitrogen and oxygen co-doped three-dimensional honeycomb porous carbons for methylene blue efficient removal, Appl. Surf. Sci., 2021, 546, 149139 CrossRef CAS.
- F. Mbarki, T. Selmi, A. Kesraoui, M. Seffen, P. Gadonneix, A. Celzard and V. Fierro, Hydrothermal pre-treatment, an efficient tool to improve activated carbon performances, Ind. Crops Prod., 2019, 140, 111717 CrossRef CAS.
- S. Cheng, Y. Liu, B. Xing, X. Qin, C. Zhang and H. Xia, Lead and cadmium clean removal from wastewater by sustainable biochar derived from poplar saw dust, J. Cleaner Prod., 2021, 314, 128074 CrossRef CAS.
- Z. Hao, J. Cao, Y. Wu, X. Zhao, Q. Zhuang, X. Wang and X. Wei, Preparation of porous carbon sphere from waste sugar solution for electric double-layer capacitor, J. Power Sources, 2017, 361, 249–258 CrossRef CAS.
- Y. Kan, Q. Yue, B. Gao and Q. Li, Preparation of epoxy resin-based activated carbons from waste printed circuit boards by steam activation, Mater. Lett., 2015, 159, 443–446 CrossRef CAS.
- G. Zhu, X. Xing, J. Wang and X. Zhang, Effect of acid and hydrothermal treatments on the dye adsorption properties of biomass-derived activated carbon, J. Mater. Sci., 2017, 52(13), 7664–7676 CrossRef CAS.
- Z. Hao, J. Cao, X. Zhao, Y. Wu, J. Zhu, Y. Dang, Q. Zhuang and X. Wei, Preparation of porous carbon spheres from 2-keto-l-gulonic acid mother liquor by oxidation and activation for electric double-layer capacitor application, J. Colloid Interface Sci., 2018, 513, 20–27 CrossRef CAS PubMed.
- Y. Wu, J. Cao, X. Zhao, Z. Hao, Q. Zhuang, J. Zhu, X. Wang and X. Wei, Preparation of porous carbons by hydrothermal carbonization and KOH activation of lignite and their performance for electric double layer capacitor, Electrochim. Acta, 2017, 252, 397–407 CrossRef CAS.
- Y. Wu, J. Cao, Z. Zhou, X. Zhao, Q. Zhuang, Y. Wei, M. Zhao, Y. Zhao and H. Bai, Transforming waste sugar solution into N-doped hierarchical porous carbon for high performance supercapacitors in aqueous electrolytes and ionic liquid, Int. J. Hydrogen Energy, 2020, 45(56), 31367–31379 CrossRef CAS.
- K. Fu, Q. Yue, B. Gao, Y. Sun and L. Zhu, Preparation, characterization and application of lignin-based activated carbon from black liquor lignin by steam activation, Chem. Eng. J., 2013, 228, 1074–1082 CrossRef CAS.
- Z. Zhou, J. Cao, Y. Wu, Q. Zhuang, X. Zhao, Y. Wei and H. Bai, Waste sugar solution polymer-derived N-doped carbon spheres with an ultrahigh specific surface area for superior performance supercapacitors, Int. J. Hydrogen Energy, 2021, 46(44), 22735–22746 CrossRef CAS.
- D. Liang, Q. Xie, C. Wan, G. Li and J. Cao, Evolution of structural and surface chemistry during pyrolysis of Zhundong coal in an entrained-flow bed reactor, J. Anal. Appl. Pyrolysis, 2019, 140, 331–338 CrossRef CAS.
- Y. Wang, J. Xiao, H. Wang, T. C. Zhang and S. Yuan, Binary doping of nitrogen and phosphorus into porous carbon: A novel di-functional material for enhancing CO2 capture and super-capacitance, J. Mater. Sci. Technol., 2022, 99, 73–81 CrossRef.
- Y. Yuan, L. Huang, M. Yılmaz, T. C. Zhang, Y. Wang and S. Yuan, MgFe2O4-loaded N-doped biochar derived from waste cooked rice for efficient low-temperature desulfurization of H2S, Fuel, 2023, 339, 127385 CrossRef CAS.
- J. P. Marco-Lozar, J. Juan-Juan, F. Suárez-García, D. Cazorla-Amorós and A. Linares-Solano, MOF-5 and activated carbons as adsorbents for gas storage, Int. J. Hydrogen Energy, 2012, 37(3), 2370–2381 CrossRef CAS.
- M. Sevilla and R. Mokaya, Energy storage applications of activated carbons: supercapacitors and hydrogen storage, Energy Environ. Sci., 2014, 7(4), 1250–1280 RSC.
- W. Xiao, X. Jiang, X. Liu, W. Zhou, Z. N. Garba, I. Lawan, L. Wang and Z. Yuan, Adsorption of organic dyes from wastewater by metal-doped porous carbon materials, J. Cleaner Prod., 2021, 284, 124773 CrossRef CAS.
- Ö. Şahin, C. Saka, A. A. Ceyhan and O. Baytar, The pyrolysis process of biomass by two-stage chemical activation with different methodology and iodine adsorption, Energy Sources, Part A, 2016, 38(12), 1756–1762 CrossRef.
- C. Du, B. Liu, J. Hu and H. Li, Determination of iodine number of activated carbon by the method of ultraviolet–visible spectroscopy, Mater. Lett., 2021, 285, 129137 CrossRef CAS.
- Z. Ma, K. Zhang, Z. Zou and Q. Lü, High specific area activated carbon derived from chitosan hydrogel coated tea saponin: One-step preparation and efficient removal of methylene blue, J. Environ. Chem. Eng., 2021, 9(3), 105251 CrossRef CAS.
- G. Nazir, A. Rehman and S. Park, Self-activated, urea modified microporous carbon cryogels for high-performance CO2 capture and separation, Carbon, 2022, 192, 14–29 CrossRef CAS.
- L. Li, F. Sun, J. Gao, L. Wang, X. Pi and G. Zhao, Broadening the pore size of coal-based activated carbon via a washing-free chem-physical activation method for high-capacity dye adsorption, RSC Adv., 2018, 8(26), 14488–14499 RSC.
- H. Cui, J. Xu, J. Shi, S. You, C. Zhang, N. Yan, Y. Liu and G. Chen, Evaluation of different potassium salts as activators for hierarchically porous carbons and their applications in CO2 adsorption, J. Colloid Interface Sci., 2021, 583, 40–49 CrossRef CAS PubMed.
- H. Dong, M. Li, Y. Jin, Y. Wu, C. Huang and J. Yang, Preparation of Graphene-Like Porous Carbons With Enhanced Thermal Conductivities From Lignin Nano-particles by Combining Hydrothermal Carbonization and Pyrolysis, Front. Energy Res., 2020, 8, 148 CrossRef.
| This journal is © The Royal Society of Chemistry 2023 |

