 Open Access Article
Convenient hydrogenation of furfural to furfuryl alcohol in metal-catalyzed and organo-catalyzed environments†
Asanda C.
Matsheku
 a,
Munaka Christopher
Maumela
ab and
Banothile C. E.
Makhubela
 *a
*a
aResearch Centre for Synthesis and Catalysis, Department of Chemical Sciences, University of Johannesburg, Auckland Park, Kingsway Campus, 2006, South Africa. E-mail: ac.matsheku@gmail.com; bmakhubela@uj.ac.za; Tel: +27-11-559-3782
bResearch and Technology, Sasol, 1 Klasie Havenga Rd, Sasolburg 1947, South Africa. E-mail: chris.maumela@sasol.com
First published on 17th July 2023
Abstract
Palladium iminophosphorane (C1–C3) and pyridylimine (C4–C5) pincer complexes were evaluated for their activity in the conversion of furfural to furfuryl alcohol in the presence of triethylamine (Et3N) and formic acid (FA). A catalyst loading of 0.1 mol% Pd afforded conversions of >99% achieving TONs of up to 9996. Surprisingly, upon evaluating a control blank (no metal catalyst) the conversions remained at >99% under metal catalyst-free conditions. Various tertiary and secondary amines were also screened in place of Et3N and all proved efficient in furfural hydrogenation to furfural alcohol giving comparable conversions (>99%). Apart from furfural, metal catalyst-free hydrogenation was expanded to various other aldehydes all of which were converted to their corresponding alcohols in excellent yields of up to 100%. This work has led to a new discovery that would result in cost-effective metal catalyst-free processes for aldehyde hydrogenation.
Sustainability spotlightGlobal energy deficiencies and environmental pollution have encouraged the need to advance to new technologies that are cost-effective towards the preparation of biofuels. Biomass is a valuable source of renewable carbon, and it can be converted to fuels and useful chemicals. Lignocellulosic biomass is the most convenient alternative source because it is renewable, non-edible, and can be transformed into upgradable platform molecules such as furfural. We focus on the selective hydrogenation of furfural to furfuryl alcohol for its versatility in the production of biofuels. Considering that we are already running short of liquid fuels required to run the economy, we have successfully transformed furfural into furfuryl alcohol with a shift from metal-catalyzed hydrogenation to organo-facilitated hydrogenation (without the use of a metal catalyst) in 6 hours in alignment with the UN sustainable development goals: affordable and clean energy (SDG 7) and climate action (SDG 13). |
Introduction
Biomass is a valuable source of renewable carbon and it can be converted to fuels, useful chemicals and materials; however, the transformation methods that could unlock its full potential are not yet fully developed. This has encouraged researchers in academia and industry to explore ways to exploit biomass feedstock as a renewable alternative to produce value-added fuels and chemicals.1Furfural (FFR) is one of the large-volume furan-based organic chemicals produced from non-edible lignocellulosic biomass – where the pentosans found in hemicellulose are transformed into FFR.2,3 The global production of FFR is estimated to be around 370![[thin space (1/6-em)]](https://www.rsc.org/images/entities/char_2009.gif) 000 tonnes per annum and its market price is USD $2200 per ton.4,5 The largest FFR producer in the world is Central Romona located in the Dominican Republic while the second largest plant is owned by Illovo Sugar, in Sezela, Kwa-Zulu Natal, South Africa, and together they produce in excess of 50
000 tonnes per annum and its market price is USD $2200 per ton.4,5 The largest FFR producer in the world is Central Romona located in the Dominican Republic while the second largest plant is owned by Illovo Sugar, in Sezela, Kwa-Zulu Natal, South Africa, and together they produce in excess of 50![[thin space (1/6-em)]](https://www.rsc.org/images/entities/char_2009.gif) 000 Mt FFR per annum using bagasse as feedstock.6
000 Mt FFR per annum using bagasse as feedstock.6
Further chemical conversion of FFR can yield a variety of chemicals and fuels,7 such as FFR alcohol, 2-methylfuran, levulinic acid, furoic acid and 2-methyltetrahydrofuran and tetrahydrofuran.8 This is achieved mainly by selective catalytic hydrogenation, oxidation, hydrogenolysis and decarbonylation of FFR.9–13
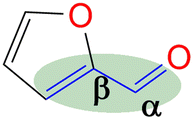
Since FFR is an α,β-unsaturated carbonyl compound, where the C![[double bond, length as m-dash]](https://www.rsc.org/images/entities/char_e001.gif) C is located inside the furan ring, it is a suitable molecule for selective reduction of the carbonyl group (C
C is located inside the furan ring, it is a suitable molecule for selective reduction of the carbonyl group (C![[double bond, length as m-dash]](https://www.rsc.org/images/entities/char_e001.gif) O), without saturating the C
O), without saturating the C![[double bond, length as m-dash]](https://www.rsc.org/images/entities/char_e001.gif) C olefinic groups, affording furfural alcohol (Fig. 1).14 Furfuryl alcohol (FFA) forms the primary chemical derived from the catalytic hydrogenation of FFR and its production has been estimated to take up to ∼65% of all FFR produced.15 It has important applications in the polymer industry which includes the production of rubbers, synthetic fibres, resins and agrochemicals. Moreover, it has been utilized in manufacturing fine chemicals, vitamin C, lubricants and lysine. FFA is also a chemical building block for drug synthesis and is used in the production of foundry sand binders.2,16
C olefinic groups, affording furfural alcohol (Fig. 1).14 Furfuryl alcohol (FFA) forms the primary chemical derived from the catalytic hydrogenation of FFR and its production has been estimated to take up to ∼65% of all FFR produced.15 It has important applications in the polymer industry which includes the production of rubbers, synthetic fibres, resins and agrochemicals. Moreover, it has been utilized in manufacturing fine chemicals, vitamin C, lubricants and lysine. FFA is also a chemical building block for drug synthesis and is used in the production of foundry sand binders.2,16
Selective reduction of carbonyl groups (such as the aldehyde in furfural) can be carried out catalytically or with stoichiometric amounts of reducing agents through transfer hydrogenation (TH). Such reducing agents, for example hydrides such as NaBH4, LiAlH4, and SiH4 are air and moisture sensitive and challenging to handle.17,18 In the past, there were studies on base-catalyzed reduction of carbonyl groups such as aldehydes because this would mean more sustainable metal catalyst-free reactions. However, these base-catalyzed reactions required harsh conditions (e.g. , 200 °C and >100 bar H2) and reagents such as potassium tert-butoxide which limited wide-spread application.19–21 As such, efforts focused on using inexpensive non-noble metal catalysts instead.
Several non-noble metal heterogeneous catalysts, including Cu/AC,22 Ni/C,23 RuNi/Fe2O4,24 and NiW/C25 MgO/Fe2O4 (ref. 26) have been used to convert FFR into a mixture of FFA, 2-methyl furan and tetrahydrofurfural alcohol. This multiple product formation requires unwanted additional separation steps to obtain pure FFA.27–30
The industrially used copper chromate catalyst is selective at converting FFR into FFA in the gaseous phase; however the use of environmentally toxic chromium is of concern,31,32 necessitating the development of efficient, non-toxic catalysts that function under mild conditions.
Common hydrogen donors such as isopropanol, ethanol, methanol and formic acid are widely used with metal catalysts in TH, specifically, ruthenium,33 iridium,34 platinum,35 palladium,36 iron,37 manganese38 and nickel39 homogeneous catalysts. The versatile tridentate architecture of pincer ligands has been identified as effective in altering and regulating metal complex characteristics across the periodic table.40–46
Initially, in this study, iminophosphorane and pyridylimine palladium(II) pincer complexes were used as homogeneous catalyst precursors for the selective hydrogenation of FFR to FFA. In the course of the study we discovered that this reaction proceeds without the metal catalyst – in the presence of in situ generated formate, produced from formic acid and the amine. Therefore, we have demonstrated a convenient method to selectively hydrogenate aldehydes to alcohols that moves from palladium homogeneous catalysts to organocatalysed formate hydrogenations.
Experimental details
Materials and methods
All experiments were conducted in air unless otherwise stated. The solvents used were of reagent grade and not distilled prior to use unless otherwise stated. All chemicals were purchased from Sigma Aldrich and used as received; however, the solvents were kept anhydrous in molecular sieves. These include 2,6-pyridinemethanol, triphenylphosphine, 4-(diphenylphosphine) carboxylic acid, sodium azide, 4-aminobenzoic acid, 2,6-(diformyl)pyridine, triethylamine and other chemicals used herein. PdCl2 was purchased from Heraeus South Africa and used as received. [PdCl2(MeCN)2] was synthesized according to literature procedures.471H NMR spectra were recorded on a Bruker-400 MHz spectrometer (1H at 500 MHz and 13C{1H} at 100 MHz). The chemical shift values were reported relative to the internal standard tetramethylsilane (δ 0.00). These were referenced to the residual proton and carbon signals at δ 7.24 and 77.0 ppm respectively of CDCl3. Similarly, for DMSO-d6, the reference for the residual proton and carbon signals were at δ 2.49 and 39.0 ppm respectively. Analytical thin layer chromatography (TLC) was performed using silica gel coated aluminium plates (0.2 mm). The developed plates were then analysed through visualization under UV light or iodine staining. Silica gel column chromatography was performed using silica gel 60 (70–230 mesh). FT-IR spectra (between 4000 and 600 cm−1) were recorded as ATR using a PerkinElmer BX (II) spectrometer. Elemental analyses were conducted using a Thermos Scientific Flash 2000 CNHSO analyser. ESI-MS was carried out at Stellenbosch University Central Analytical Services using a Waters Synapt G2 and melting points were determined using the Gallenkamp Digital Melting-Point Apparatus 5A 6797. XRD spectra were obtained from a Bruker APEX-II CCD diffractometer.The single crystal X-ray analysis
Single crystal X-ray diffraction data were obtained using a Bruker APEXII diffractometer with Mo Kα (λ = 0.71073 Å) radiation and at a detector to crystal distance of 4.00 cm. The initial cell matrix was obtained from three series of scans at different starting angles. Each series consisted of 12 frames collected at intervals of 0.5° in a 6° range, with an exposure time of about 10 s per frame. The reflections were successfully indexed using an automated indexing routine built in the APEXII program suite. The data were collected using the full sphere data collection routine to survey the reciprocal space to the extent of a full sphere, with a resolution of 0.75 Å. Data were obtained by collecting 2982 frames at intervals of 0.5° scans in ω and ϕ with an exposure time of 10 s per frame.48 The data integration and reduction were processed with SAINT software. A multi-scan absorption correction was applied to the collected reflections with SADABS using XPREP. Structures were solved by direct methods using the program SHELXS-97 and were refined on F2 by the full-matrix least-squares technique using the SHELXL-97 program package. All non-hydrogen atoms were refined with anisotropic displacement coefficients. All hydrogen atoms were included in the structure factor calculations at idealized positions and were allowed to ride on the neighbouring atoms with relative isotropic displacement coefficients.49 2,6-Pyridinedimethanol (2.40 g, 17.3 mmol) was added slowly to 20 mL of thionyl chloride (SOCl2) at 0 °C. The reaction mixture was stirred at room temperature for an hour and was then refluxed at 80 °C for 2 hours. The crude mixture was concentrated under vacuum and thereafter 20 mL of H2O was added slowly. The solution was filtered, and a saturated aqueous solution of sodium bicarbonate was added dropwise into the filtrate until there was no sign of bubbling to obtain a precipitate. The precipitate was isolated by filtration to afford 2,6-bis(chloromethyl)pyridine (1) as a white solid. Yield: 2.2 g, 92%. Melting point: 74–76 °C. 1H NMR (400 MHz, CDCl3, 25 °C): δ 4.81 (s, 4H, Hd), 7.58 (d, J = 7.8 Hz, 2H, Hb), 7.93 (t, J = 7.8 Hz, 1H, Ha).
 2,6-Bis(chloromethyl)pyridine (1) (1.00 g, 6.76 mmol) was dissolved in DMSO (20 mL) and NaN3 (0.878 g, 13.5 mmol) was added. This reaction mixture was then stirred at room temperature for 24 hours. The crude mixture was quenched with 20 mL of water followed by washing with diethyl ether (3 × 50 mL). The diethyl ether layer (150 mL) was then collected and washed with brine (2 × 100 mL). The organic layer was collected and dried with anhydrous magnesium sulfate for 30 minutes. After drying, MgSO4 was removed by filtration and the solvent was removed from the filtrate, using a rotary evaporator, to obtain (2) as a yellow oil, which was dried under vacuum for 2 hours. Yield: 0.912 g, 71%.511H NMR (400 MHz, CDCl3, 25 °C): δ 4.65 (s, 4H, Hd), 7.41 (d, J = 7.8 Hz, 2H, Hb), 7.73 (t, J = 7.6 Hz, 1H, Ha).
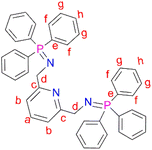 N,N′-(Pyridine-2,6-diylbis(methylene))bis(1,1,1-triphenyl-l5-phosphanimine) (L1) was prepared by adding triphenylphosphine (0.831 g, 3.17 mmol) to a solution of (2) (0.300 g, 1.58 mmol) in 30 mL diethylether into a Schlenk tube. The resultant solution was then stirred at room temperature, under N2 gas, for 16 hours, during which time a white precipitate formed. After 16 hours, a white solid was collected by vacuum filtration and dried under vacuum for 5 hours to afford ligand L1. Yield: 0.705 g, 68%.51 Melting point: 120–123 °C. 1H NMR (400 MHz, CDCl3, 25 °C): δ 4.38 (d, J = 12 Hz, 4Hd), 7.35 (td, J = 4–8 Hz, 12 Hg), 7.43 (td, J = 4 Hz, 6Hh), 7.59 (br t, J = 4–12 Hz, 1Ha), 7.63–7.67 (br t, J = 8 Hz, 12Hf), 7.70 (br d, J = 4 Hz, 2Hb). 13C{1H} NMR (101 MHz, CDCl3) δ 51.12 (Cd), 118.18 (Cb), 128.28 (Cg), 131.13 (Ch), 132.02 (Ce), 132.49 (Cf), 136.60 (Ca), 153.59 (Cc). 31P{1H} NMR (162 MHz, CDCl3) δ 12.39 (s). IR (cm−1): 1587 ν(C
![[double bond, length as m-dash]](https://www.rsc.org/images/entities/char_e001.gif) N), 1330 ν(P
N), 1330 ν(P![[double bond, length as m-dash]](https://www.rsc.org/images/entities/char_e001.gif) N), 1103 ν(C–N). Elemental analysis: calculated for C43H37N3P2 (%): C 78.52, H 5.44, N 5.67. Found: C 77.10, H 5.47, N 6.34. HR-ESI-MS(+): m/z = 657.1031 [M]+.
N), 1103 ν(C–N). Elemental analysis: calculated for C43H37N3P2 (%): C 78.52, H 5.44, N 5.67. Found: C 77.10, H 5.47, N 6.34. HR-ESI-MS(+): m/z = 657.1031 [M]+.
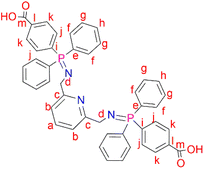 2,6-Bis(azidomethyl)pyridine (2) (0.200 g, 1.06 mmol) was added to a solution of 4-(diphenylphosphino) benzoic acid (0.647 g, 2.11 mmol) dissolved in dichloromethane (20 mL). The resulting solution was then refluxed at 40 °C for 24 hours, during which time a yellow precipitate formed. The yellow solid (L2) was obtained, following vacuum filtration of the suspended precipitate, and dried under vacuum for 2 hours. Yield: 0.708 g, 90%. Melting point: 209–212 °C. 1H NMR (400 MHz, D2O and NaOD, 25 °C): δ 7.55 (br d, J = 3.0 Hz, 4H, Hk), 7.42 (br s, 1H, Ha), 7.09 (br s, 4H, Hj), 7.00 (br m, 12H, Hg,h), 6.92 (br d, J = 6.0 Hz, 2H, Hb), 6.85 (br s, 8H, Hf), 3.49 (br s, 4H, Hd). 13C{1H} NMR (400 MHz, D2O and NaOD, 25 °C): δ 45.7 (Cd), 119.7 (Cb), 128.5–129.1 (Ck, Cg, Cj), 129.8 (Ch), 131.2–131.5 (Cf), 132.3 (Ce), 132.7 (Ca), 138.8 (Cl), 140.5 (Ci), 160.3 (Cc), 173.3 (Cm). 31P{1H} NMR (162 MHz, D2O and NaOD, 25 °C): δ 34.2. FT-IR (cm−1): 3454 ν(O–H), 1735 ν(C
![[double bond, length as m-dash]](https://www.rsc.org/images/entities/char_e001.gif) O), 1595 ν(C
O), 1595 ν(C![[double bond, length as m-dash]](https://www.rsc.org/images/entities/char_e001.gif) N), 1363 ν(P
N), 1363 ν(P![[double bond, length as m-dash]](https://www.rsc.org/images/entities/char_e001.gif) N), 1110 ν(C–N). Elemental analysis: calculated for C45 H37 N3 O4 P2 (%): C 72.48, H 5.00, N 5.63. Found: C 71.51H 5.23, N 5.35. HR-ESI-MS(+): (C45H37N3O4P2) m/z = 745.2189 [M]+.
N), 1110 ν(C–N). Elemental analysis: calculated for C45 H37 N3 O4 P2 (%): C 72.48, H 5.00, N 5.63. Found: C 71.51H 5.23, N 5.35. HR-ESI-MS(+): (C45H37N3O4P2) m/z = 745.2189 [M]+.
 A solution of p-aminobenzoic acid (6.0 g, 43.8 mmol) in 40 mL MeOH was cooled to 0 °C, and thionyl chloride (7.95 mL, 109 mmol) was added dropwise to the solution. The reaction solution was heated at reflux for 24 hours after which it was cooled to room temperature. The solvent was reduced under pressure to give a residue, to which NaHCO3 solution (100 mL) was added. The product was extracted using ethyl acetate (3 × 20 mL), and then the ethyl acetate layers were combined and dried over anhydrous magnesium sulfate. After purification using a gel silica-packed column eluting with n-hexane
![[thin space (1/6-em)]](https://www.rsc.org/images/entities/char_2009.gif) :
:![[thin space (1/6-em)]](https://www.rsc.org/images/entities/char_2009.gif) EtOAc, in a 1
EtOAc, in a 1![[thin space (1/6-em)]](https://www.rsc.org/images/entities/char_2009.gif) :
:![[thin space (1/6-em)]](https://www.rsc.org/images/entities/char_2009.gif) 1 ratio, para-amino benzoic acid methyl ester (3) was afforded as a white solid. Yield: 5.94 g, 89%. Melting point: 106–108 °C. 1H NMR (400 MHz, CDCl3, 25 °C): δ 7.82 (d, J = 8.8 Hz, 2H, Hd), 6.61 (d, J = 8.8 Hz, 2H, He), 4.06 (br s, 2H, Hg), 3.83 (s, 3H, Ha). 13C{1H} NMR (101 MHz, CDCl3, 25 °C): δ 167.1 (C), 150.8 (C), 131.6 (C), 119.7 (C), 113.7 (C), 51.6 (C). HR-ESI-MS(+): m/z = 150.0547 [M]+.
1 ratio, para-amino benzoic acid methyl ester (3) was afforded as a white solid. Yield: 5.94 g, 89%. Melting point: 106–108 °C. 1H NMR (400 MHz, CDCl3, 25 °C): δ 7.82 (d, J = 8.8 Hz, 2H, Hd), 6.61 (d, J = 8.8 Hz, 2H, He), 4.06 (br s, 2H, Hg), 3.83 (s, 3H, Ha). 13C{1H} NMR (101 MHz, CDCl3, 25 °C): δ 167.1 (C), 150.8 (C), 131.6 (C), 119.7 (C), 113.7 (C), 51.6 (C). HR-ESI-MS(+): m/z = 150.0547 [M]+.
 4-Dimethylaminopyridine (DMAP) (0.242 g, 1.98 mmol) and Et3N (2.76 mL, 19.8 mmol) were added to a solution of the starting material (3) (1.5 g, 9.92 mmol) in dry THF (10 mL) under N2. The solution was stirred for 1 hour and then cooled to 0 °C, after which chlorodiphenylphosphine (1.78 mL, 9.98 mmol) was added. The resultant solution was stirred further for 18 hours at room temperature. After 18 hours, the solvent was removed in vacuo and the crude product was dissolved in dry ethanol (15 mL). This resulted in the formation of a precipitate that was isolated by filtration and dried under vacuum, for 9 hours, to afford the phosphine (4) as a white solid. Yield: (3.0 g, 90%). Melting point: 87–89 °C. 1H NMR (400 MHz, CDCl3, 25 °C): δ 7.87 (d, J = 8.8 Hz, 2H, Hd), 7.46–7.39 (m, 4H, Hh), 7.37 (d, J = 2.8 Hz, 6H, Hh), 7.00 (d, J = 10.8 Hz, 2H, He), 4.70 (d, J = 7.5 Hz, 1H, Hg), 3.84 (s, 3H, Ha). (s). 13C{1H} NMR (101 MHz, CDCl3, 25 °C): δ 166.99 (C), 151.24 (C), 151.07 (C), 139.13 (C), 139.02 (C), 131.34 (C), 131.2 (2C), 131.08 (2C), 129.37 (2C), 128.66 (2C), 128, 59 (2C), 120.79 (C), 115.08 (C), 114.95 (C), 51.58 (C). 31P{1H} NMR (162 MHz, CDCl3, 25 °C): δ 28.39. FT-IR (cm−1): ν(N–H), 3264, ν(C
![[double bond, length as m-dash]](https://www.rsc.org/images/entities/char_e001.gif) O) 1681, ν(P–Ph) 1443, ν(P–N) 959. HR-ESI-MS(+): m/z = 336.1160 [M + H]+.
O) 1681, ν(P–Ph) 1443, ν(P–N) 959. HR-ESI-MS(+): m/z = 336.1160 [M + H]+.
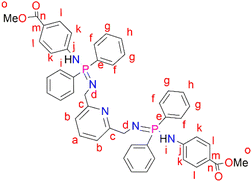 2,6-Bis(chloromethyl)pyridine (2) (0.112 g, 0.596 mmol) was dissolved in THF (20 mL) followed by the addition of (3) (0.400 g, 1.19 mmol) under nitrogen in a Schlenk tube. This reaction mixture was allowed to stir at room temperature for 48 hours. The resulting reaction mixture was filtered through alumina and the solvent was removed from the filtrate to isolate a pale-yellow solid, L3 (very sensitive to air and moisture) that was dried under vacuum for 8 hours. Yield: 0.122 g, 26%. 1H NMR (400 MHz, CDCl3, 25 °C): δ 7.91 (br t, J = 8 Hz, 8H, Hg), 7.81 (br d, J = 8 Hz, 1H, Ha), 7.66 (d, J = 4 Hz, 4H, Hl), 7.44 (br d, J = 4 Hz, 4H, Hh), 7.37 (br s, 8H, Hf), 6.93 (d, J = 4 Hz, 2H, Hb), 6.83 (d, J = 4 Hz, 4H, Hk), 4.39 (br s, 2H, Hi), 3.83 (s, 4H, Hd), 3.77 (s, 6H, Ho). 31P{1H} NMR (162 MHz, CDCl3, 25 °C): δ 7.80 (s). HR-ESI-MS(+): m/z = 804.2887 [M + H]+.
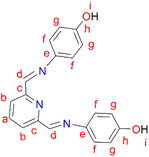 2,6-Diformylpyridine (0.100 g, 0.740 mmol) was dissolved in methanol and added to a stirring solution of 4-aminophenol (0.177 g, 0.163 mmol) in methanol, followed by the addition of 5–8 drops (0.4 mL) of acetic acid. The reaction solution was then refluxed at 45 °C for 16 hours, during which time a yellow precipitate formed. The yellow precipitate, L4, was collected by suction filtration and dried under vacuum for 6 hours. Yield: 0.226 g, 99%. Melting point: 137–140 °C. 1H NMR (500 MHz, DMSO-d6, 25 °C) δ: 6.82 (d, J = 10 Hz, 4H, Hg), 7.32 (d, J = 10 Hz, 4H, Hf), 8.03 (t, J = 5–10 Hz, 1H, Ha), 8.17 (d, J = 5 Hz, 2H, Hb), 8.66 (s, 2H, Hd), 9.66 (br s, 2H, Hi). 13C{1H} NMR (101 MHz, DMSO-d6, 25 °C) δ: 118.4 (Cg), 124.3 (Cb), 129.5 (Cf), 137.3 (Ca), 143.6 (Ce), 148.6 (Cc), 155.9 (Cd), 166.9 (Ch). FT-IR (cm−1): 3520 ν(OH), 1566 ν(C
![[double bond, length as m-dash]](https://www.rsc.org/images/entities/char_e001.gif) N), 1620 ν(C
N), 1620 ν(C![[double bond, length as m-dash]](https://www.rsc.org/images/entities/char_e001.gif) N). Elemental analysis: calculated for C19 H15 N3 O2 (%): C 71.91, H 4.76, N 13.24. Found: C 69.95, H 6.13, N 12.94. HR-ESI-MS(+): m/z = 320.1008 [M + H]+.
N). Elemental analysis: calculated for C19 H15 N3 O2 (%): C 71.91, H 4.76, N 13.24. Found: C 69.95, H 6.13, N 12.94. HR-ESI-MS(+): m/z = 320.1008 [M + H]+.
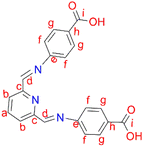 2,6-Diformylpyridine (0.100 g, 0.740 mmol) was added to stirring solution of 4-aminobenzoic acid (0.224 g, 0.163 mmol) in methanol and the same protocol as outlined for the synthesis of ligand L4 was followed. A white solid of ligand L5 was isolated after drying under vacuum for 8 hours. Yield: 0.249 g, 96%. Melting point: >300 °C. 1H NMR (400 MHz, D2O and NaOD, 25 °C) δ: 5.99 (br s, 2H, Hd), 6.59 (d, J = 10 Hz, 4H, Hf), 7.29 (d, J = 10 Hz, 2H, Hb), 7.51 (d, J = 5 Hz, 4H, Hg), 7.67 (t, J = 5–10 Hz, 1H, Ha). 13C{1H} NMR (400 MHz, D2O and NaOD, 25 °C): δ 114.9 (Cf), 119.6 (Cb), 126.0 (Ch), 130.8 (Cg), 138.4 (Ca), 149.7 (Cc), 161.2 (Cd), 175.5 (Ci). FT-IR (cm−1): 3096 ν(OH), 1680 ν(C
![[double bond, length as m-dash]](https://www.rsc.org/images/entities/char_e001.gif) O), 1598 ν(C
O), 1598 ν(C![[double bond, length as m-dash]](https://www.rsc.org/images/entities/char_e001.gif) N), 1572 ν(C
N), 1572 ν(C![[double bond, length as m-dash]](https://www.rsc.org/images/entities/char_e001.gif) N). Elemental analysis: calculated for C21 H15 N3 O4 (%): C 67.56, H 4.05, N 11.25. Found: C 67.42, H 4.13, N 11.32 HR-ESI-MS(+): m/z = 374.1138 [M]+.
N). Elemental analysis: calculated for C21 H15 N3 O4 (%): C 67.56, H 4.05, N 11.25. Found: C 67.42, H 4.13, N 11.32 HR-ESI-MS(+): m/z = 374.1138 [M]+.
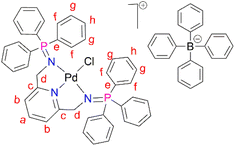 PdCl2(CNMe)2 (0.0788 g, 0.304 mmol) was added to a stirring solution of L1 (0.200 g, 0.304 mmol) in 20 mL of methanol. This yellow solution formed was then stirred, under nitrogen, at room temperature for 24 hours. After 24 hours, a green solution formed and the solvent was reduced to ∼5 mL before adding sodium tetraphenylborate (NaBPh4) (0.104 mg, 0.304 mmol) and stirring for a further 30 minutes, at room temperature. After 30 minutes, a pale green precipitate (C1) had formed, that was collected using suction filtration before drying under vacuum for 8 hours. Yield: (0.309 g, 91%). Melting point: decomposes without melting, onset occurs at 215 °C. 1H NMR (400 MHz, CD3CN, 25 °C) δ: 4.35 (d, J = 5 Hz, 4H, Hd), 6.82 (t, J = 5–10 Hz, 4H, Hl), 6.97 (t, J = 5–10 Hz, 8H, Hk), 7.06 (d, J = 5 Hz, 2H, Hb), 7.25 (br m, 8H, Hj), 7.54–7.58 (t d, J = 5 Hz, 12Hf), 7.66 (t d, J = 5 Hz, 6H, Hh), 7.72 (t, J = 8 Hz, 1H, Ha), 7.82–7.86 (br m, 12H, Hg). 13C{1H} NMR (101 MHz, CD3CN, 25 °C) δ: 62.5 (Cd), 119.6 (Cb), 123.2 (Cl), 126.9 (Ck), 127.3 (Cg), 128.1 (Ce), 130.0 (Ch), 134.3 (Cj), 135.2 (Cf), 137.2 (Ca), 139.9 (Ci), 165.2 (Cc). 31P{1H} NMR (162 MHz, CD3CN) δ: 35.49. FT-IR (cm−1): 1575 ν(C
![[double bond, length as m-dash]](https://www.rsc.org/images/entities/char_e001.gif) N), 1261 ν(P
N), 1261 ν(P![[double bond, length as m-dash]](https://www.rsc.org/images/entities/char_e001.gif) N), 1110 ν(C–N). Elemental analysis: calculated for C67H57 BClN3P2Pd (%): C 71.93 H, 5.14 N, 3.76. Found: C, 71.51 H, 5.03 N, 3.84. HR-ESI-MS(+): m/z = 798.1198 [M]+.
N), 1110 ν(C–N). Elemental analysis: calculated for C67H57 BClN3P2Pd (%): C 71.93 H, 5.14 N, 3.76. Found: C, 71.51 H, 5.03 N, 3.84. HR-ESI-MS(+): m/z = 798.1198 [M]+.
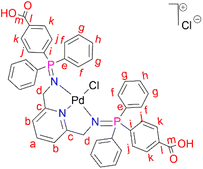 L2 (0.500 g, 0.670 mmol) was added to a Schlenk flask containing PdCl2(CNMe)2 (0.173 g, 0.670) in acetonitrile, followed by 5–10 drops (0.5 mL) of acetic acid. The resulting solution was then stirred, under nitrogen, at room temperature for 72 hours. Thereafter, the solvent was removed to isolate an orange-red solid that was desired under vacuum for 10 hours. Yield: 0.556 g, 90%). Melting point: 231–234 °C, melts with decomposition. 1H NMR (500 MHz, DMSO-d6, 25 °C) δ: 4.42 (br s, 4H, Hd), 7.33 (d, J = 10 Hz, 2H, Hb), 7.59 (m, 8H, Hg), 7.62 (br m, 4H, Hh), 7.80 (br m, 8H, Hf), 7.82 (br m, 12H, Hf), 7.88 (br t, J = 5–10 Hz, 1H, Ha), 8.07 (br d, J = 5 Hz, 4H, Hk). 13C{1H} NMR (101 MHz, DMSO-d6) δ: 62.4 (Cd), 119.1 (Cb), 125.4 (Cl), 126.2 (Ck), 129.4 (Cg), 131.8 (Ch), 133.5 (Cj), 134.1 (Cf), 135.5 (Ci), 139.4 (Ca), 163.3 (Cc), 167.2 (Cl). 31P{1H} NMR (162 MHz, DMSO-d6, 25 °C) δ: 34.64. FT-IR (cm−1): 3433 ν(O–H), 1712 ν(C
![[double bond, length as m-dash]](https://www.rsc.org/images/entities/char_e001.gif) O), 1581 ν(C
O), 1581 ν(C![[double bond, length as m-dash]](https://www.rsc.org/images/entities/char_e001.gif) N), 1242 ν(P
N), 1242 ν(P![[double bond, length as m-dash]](https://www.rsc.org/images/entities/char_e001.gif) N), 1103 ν(C–N). Elemental analysis: calculated for C45H37Cl2N3O4P2Pd (%): C, 58.55 H, 4.04 N, 4.55. Found: C, 59.24 H, 4.16 N, 3.99. HR-ESI-MS(+): m/z = 888.0969 [M]+.
N), 1103 ν(C–N). Elemental analysis: calculated for C45H37Cl2N3O4P2Pd (%): C, 58.55 H, 4.04 N, 4.55. Found: C, 59.24 H, 4.16 N, 3.99. HR-ESI-MS(+): m/z = 888.0969 [M]+.
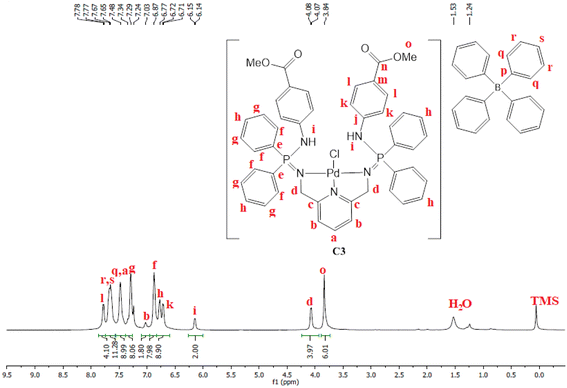
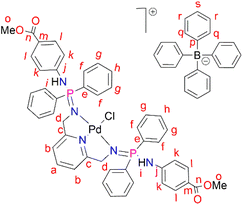 PdCl2(CNMe)2 (0.0722 g, 0.286 mmol) was added to a stirring solution of L3 (0.230 g, 0.286 mmol) containing 20 mL of methanol. The resulting solution was stirred for 24 hours at room temperature, under nitrogen. After 24 hours, the solvent was removed, using a rotary evaporator, and the resulting solid was re-dissolved in methanol (5 mL) followed by the addition of NaBPh4 (0.0979 g, 0.286 mmol). Thereafter, the solution was stirred at room temperature for 30 minutes, during which time a mustard solid (C3) formed. Complex C3 was isolated using suction filtration and dried under vacuum for 6 hours. Yield: 0.108 g, 30%). Melting point: 159–163 °C. 1H NMR (400 MHz, CDCl3, 25 °C) δ: 7.78 (d, J = 4 Hz, 4H, Hl), 7.67 (br s, 12H, Hr, Hs), 7.43 (br s, 9H, Ha, Hq), 7.29 (br m, 8H, Hg), 7.03 (br s, 2H, Hb) 6.87 (br s, 8H, Hf), 6.77 (br s, 4H, Hh), 6.72 (d, J = 4 Hz, 4H, Hk), 6.15 (br d, J = 4 Hz, 2H, Hi), 4.07 (br d, J = 4 Hz, 4H, Hd), 3.84 (br s, 6H, Ho). 13C{1H} NMR (101 MHz, CDCl3, 25 °C) δ: 52.0 (Cd), 60.5 (Co), 118.6 (Ck), 119.5 (Cb), 121.8 (Cs), 124.7 (Cm), 125.5 (Cr), 127.2 (Cr), 128.3 (Ce), 128.7 (Ch), 129.5 (Cg), 131.0 (Cl), 132.8 (Cf), 134.0 (Cq), 136.2 (Ca), 139.3 (Cp), 144.0 (Cj), 164.4 (Cc), 166.6 (Cn). 31P{1H} NMR (162 MHz, CDCl3, 25 °C) δ: 40.36 ppm. FT-IR (cm−1): 3459 ν(N–H), 1718 ν(C
![[double bond, length as m-dash]](https://www.rsc.org/images/entities/char_e001.gif) O), 1607 ν(C
O), 1607 ν(C![[double bond, length as m-dash]](https://www.rsc.org/images/entities/char_e001.gif) N), 1232 ν(P
N), 1232 ν(P![[double bond, length as m-dash]](https://www.rsc.org/images/entities/char_e001.gif) N), 1114 ν(C–N). Elemental analysis: calculated for C76 H70 BCl N5 O5 P2 Pd (%);: C 67.42, H 5.02, N 5.54. Found: C 66.35, H 4.69, N 5.19 HR-ESI-MS(+): m/z = 944.1520 [M]+
N), 1114 ν(C–N). Elemental analysis: calculated for C76 H70 BCl N5 O5 P2 Pd (%);: C 67.42, H 5.02, N 5.54. Found: C 66.35, H 4.69, N 5.19 HR-ESI-MS(+): m/z = 944.1520 [M]+
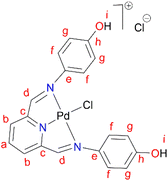 In a round bottom flask, PdCl2(CNMe)2 (0.0855 g, 0.329 mmol) was added to a stirring solution of L4 (0.100 g, 0.329 mmol) containing 20 mL of methanol. The resulting reaction solution was refluxed at 65 °C for 24 hours, during which time a red precipitate formed. The precipitate (C4) was isolated using suction filtration and washed with MeOH forming a greenish solid that was dried under vacuum for 6 hours. Yield: 0.112 g, 68.7%). Melting point: decomposes without melting, onset occurs at 291 °C. 1H NMR (500 MHz, DMSO-d6) δ: 6.83 (d, J = 5 Hz, 4H, Hg), 7.34 (br m, 4H, Hf), 8.17 (br s, 1H, Hb), 8.50 (br s, 2H, Hd), 8.66 (s, 1H, Ha), 9.68 (br s, 1H, Hi’), 10.18 (br s, 1H, Hi). 13C{1H} NMR (101 MHz, DMSO-d6) δ: 115.4 (Cg), 122.3 (Cf), 126.0 (Cb), 129.3 (Ca), 141.8 (Ce), 155.0 (Cc), 156.6 (Ch), 157.6 (Cd). FT-IR (cm−1): 3325 ν(OH), 3526 ν(OH), 1550 ν(C
![[double bond, length as m-dash]](https://www.rsc.org/images/entities/char_e001.gif) N), 1589 ν(C
N), 1589 ν(C![[double bond, length as m-dash]](https://www.rsc.org/images/entities/char_e001.gif) N). HR-ESI-MS(+): m/z = 499.0456 [M]+.
N). HR-ESI-MS(+): m/z = 499.0456 [M]+.
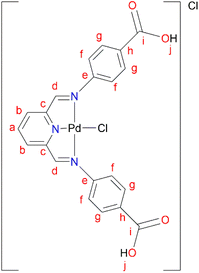 L5 (0.3300 g, 0.859 mmol) was added to a Schlenk flask containing PdCl2(CNMe)2 (0.223 g, 0.859 mmol) in MeOH, followed by 4–8 drops of acetic acid. The reaction mixture was allowed to stir at room temperature for 72 hours. A green precipitate was observed and isolated by vacuum filtration and then dried under vacuum for 8 hours, C5 (0.260 g, 55%). Melting point: 297 °C, onset decomposition. 1H NMR (500 MHz, DMSO-d6) δ 5.86 (br s, 3H, Ar–H), 6.53 (br s, 3H, Ar–H), 7.13 (br s, 1H, Ar–H) 7.31 (br s, 1H, Ar–H), 7.60 (br s, 3H, Ha,b), 8.00 (br s, 2H, Hd), 12.22 (br s, 2H, Hj). 13C{1H} NMR (101 MHz, DMSO-d6) δ 112.9 (Cf), 117.3 (Cb), 123.2 (Ca), 127.3 (Ch), 131.5 (Cg), 146.5 (Cc), 153.4 (Ce), 167.3 (Ci), 167.8 (Cd). FT-IR (cm−1): 3282 ν(OH), 1681 ν(C
![[double bond, length as m-dash]](https://www.rsc.org/images/entities/char_e001.gif) O), 1606 ν(C
O), 1606 ν(C![[double bond, length as m-dash]](https://www.rsc.org/images/entities/char_e001.gif) N), 1575 ν(C
N), 1575 ν(C![[double bond, length as m-dash]](https://www.rsc.org/images/entities/char_e001.gif) N).). HR-ESI-MS: m/z = 561.8280 [M + H]+.
N).). HR-ESI-MS: m/z = 561.8280 [M + H]+.
The general procedure for hydrogenation reactions
Substrate (furfural, 5 mmol), formic acid (5 mmol), catalyst (0.1–0.01 mol%), and base (Et3N, 5 mmol) were added to an autoclave reactor. The homogeneous mixture was heated to the desired temperature after purging five times with nitrogen gas. The mixture was then left to stir for the required amount of time. At the end of the reaction, the reactor vessel was cooled and the gas generated was released. All hydrogenation reactions were carried out in triplicate. The end-of-reaction contents (crude mixture) containing the product were analyzed by 1H NMR spectroscopy by sampling 0.1 mL, added to 0.4 mL of CDCl3 and 5 μL of DMF was used as an internal standard to determine the amount of product (furfuryl alcohol) formed, and confirmed by GC-MS. The calculations were conducted following literature protocols.16,25Results and discussion
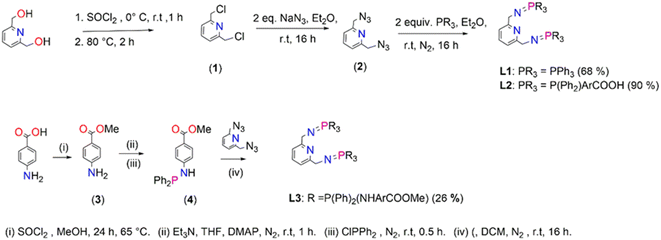
Ligands, L1–L3, were prepared following a modified literature protocol reported by Cheisson and Auffrant.51 The preparations are summarized in Scheme 1 which proceeded by first chlorinating 2,6-pyridinedimethanol to afford 2,6-bis(chloromethyl)pyridine (1), followed by a nucleophilic substitution reaction, with sodium azide as the nucleophile. This reaction led to isolation of 2,6-bis(azidomethyl)pyridine (2). The azide (2) was treated with various phosphines in a Staudinger reaction to afford ligands L1–L3 in moderate to excellent yields (68–90%). The preparation of L3 commenced by initially preparing 4-aminomethylbenzoate (3) by acid-catalyzed esterification of the carboxylic acid functional group in 4-aminobenzoic acid. Once (3) was obtained, 4-(diphenylphosphino) aminomethylbenzoate (4) was prepared by reacting (3) with chlorodiphenylphosphine at room temperature (Scheme 1). 4-(Diphenylphosphaneyl)aminomethylbenzoate (4) undergoes a facile Staudinger reaction to afford ligand L3. L3 turned out to be air- and moisture-sensitive, therefore prone to oxidation which may be due to the –NH spacer. L1 is stable but oxidizes when exposed to air/moisture for hours and L2 is very stable. L1 and L3 were isolated as white powders respectively, which are soluble in chlorinated organic solvents, THF, DMSO, DMF and acetonitrile. L2 was isolated as a pale-yellow solid that is very insoluble and requires deprotonation of the carboxylic groups by sodium hydroxide in water to encourage solubility. L3 is very air and moisture sensitive, and upon exposure changes colour from a white powder to yellow oil as a result of oxidation.
(1), (2) and L1 are known compounds.51,54(1) was confirmed by proton NMR, with four protons observed as a singlet at 4.81 ppm assigned to the chemically equivalent aliphatic protons –CH2's. The proton NMR for (2) reveals a singlet at 4.65 ppm (a shift from 4.81 ppm (1)) which integrates for four protons assigned to the chemically equivalent –CH2's and this agrees with that reported in the literature at 4.48 ppm (ESI-Fig. 1†). These protons (–CH2) appear as a doublet in the proton NMR spectrum of L1 seen at 4.38 ppm (ESI-Fig. 2†), in agreement with literature findings. Furthermore, the phosphorus NMR spectrum revealed a singlet at 12.4 ppm which is similar to literature reports at 9.9 ppm.51 The proton NMR spectrum of L2 revealed broadness in all expected characteristic peaks and this maybe due to the sodium counter ions as NMR could only be conducted upon deprotonation of the carboxylic –OH group using deuterated water and sodium hydroxide (ESI-Fig. 3†). The 13C NMR spectrum revealed all the expected signals (ESI-Fig. 4†). The phosphorus NMR signals resonate at 34.2 ppm. The FT-IR spectroscopy of L2 confirmed the expected characteristic vibrations; 3454 ν(O–H), 1735 ν(C![[double bond, length as m-dash]](https://www.rsc.org/images/entities/char_e001.gif) O), 1595 ν(C
O), 1595 ν(C![[double bond, length as m-dash]](https://www.rsc.org/images/entities/char_e001.gif) N), 1363 ν(P
N), 1363 ν(P![[double bond, length as m-dash]](https://www.rsc.org/images/entities/char_e001.gif) N), and 1110 ν(C–N) (ESI-Fig. 5†). The mass spectrum further confirms that L2 was isolated successfully by revealing the parent ion m/z = 745.2189 [M]+.
N), and 1110 ν(C–N) (ESI-Fig. 5†). The mass spectrum further confirms that L2 was isolated successfully by revealing the parent ion m/z = 745.2189 [M]+.
The proton NMR spectrum for (3) revealed a new singlet at 3.83 which corresponds to the successful formation of the methoxy group. The phosphorus NMR spectrum of (4) revealed a singlet that shows signals at 28.4 ppm (ESI-Fig. 6†). The formation of L3 was monitored by phosphorus NMR due to the air and moisture sensitivity nature which encouraged the one pot synthesis of L3 and its corresponding palladium complex C3. The phosphorus NMR spectrum of L3 depicted a singlet at 7.80 ppm (ESI-Fig. 7†).
Moreover, the Schiff-base ligands L4 and L5 were also prepared following a modified literature protocol by Cvijetic and co-workers (Fig. 2).55L4 is not new and the characterization is in agreement with the literature report by Vance et al.56 (ESI-Fig. 8 and 9†). The new L5 was isolated as a white solid only soluble upon deprotonation using aqueous NaOH. All the expected characteristic protons of L5 have been depicted in the proton NMR spectrum (ESI-Fig. 10†). FT-IR spectroscopy further confirmed the functional groups, with the carboxylic O–H stretching and C![[double bond, length as m-dash]](https://www.rsc.org/images/entities/char_e001.gif) O stretching vibrating at 3096 cm−1ν(O–H) and the carbonyl at 1680 ν(C
O stretching vibrating at 3096 cm−1ν(O–H) and the carbonyl at 1680 ν(C![[double bond, length as m-dash]](https://www.rsc.org/images/entities/char_e001.gif) O) cm−1, whereas the imine stretchings vibrated at 1598 cm−1ν(C
O) cm−1, whereas the imine stretchings vibrated at 1598 cm−1ν(C![[double bond, length as m-dash]](https://www.rsc.org/images/entities/char_e001.gif) N) and 1572 cm−1ν(C
N) and 1572 cm−1ν(C![[double bond, length as m-dash]](https://www.rsc.org/images/entities/char_e001.gif) N).
N).
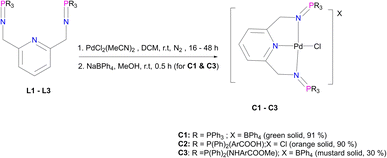
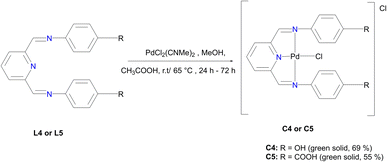
The corresponding palladium complexes (C1–C5) were also isolated. This was achieved by following the reaction conditions outlined in Fig. 3 and 4. The proton NMR spectrum of C1 revealed all the expected characteristic peaks, which include those of the counter ion –BPh4 signalling between 6.04 ppm and 7.28 ppm accounting for 20 protons (ESI-Fig. 11†). The phosphorus NMR spectrum depicted a singlet at 35.5 ppm which is a downfield shift from 9.9 ppm L1, which is an expected shift upon coordination with the palladium centre.57 The mass spectrum of C1 revealed m/z = 798.1198 [M]+.
C2 has different solubility from that of L2, which suggests that the coordination with the Pd centre improved the solubility. However, this difference in solubility also provides evidence that we have successfully isolated C2 with the proton NMR confirming all the characteristic signals (ESI-Fig. 12†). FT-IR spectroscopy revealed a shift from 1595 cm−1 (L2) to 1581 cm−1 (C2) for ν(C![[double bond, length as m-dash]](https://www.rsc.org/images/entities/char_e001.gif) N) and a shift from 1363 cm−1 (L2) to 1242 cm−1 (C2) for ν(P
N) and a shift from 1363 cm−1 (L2) to 1242 cm−1 (C2) for ν(P![[double bond, length as m-dash]](https://www.rsc.org/images/entities/char_e001.gif) N) as a result of π backdonation of electrons (metal-to-ligands). This is further supported by the mass spectrum which depicted the parent ion, m/z = 888.0969 [M]+ (ESI-Fig. 13†). The purity of C2 was also confirmed by the elemental analysis; % calculated = C 58.55 H 4.04 N 4.55, and % results = C 59.24 H 4.16 N 3.99.
N) as a result of π backdonation of electrons (metal-to-ligands). This is further supported by the mass spectrum which depicted the parent ion, m/z = 888.0969 [M]+ (ESI-Fig. 13†). The purity of C2 was also confirmed by the elemental analysis; % calculated = C 58.55 H 4.04 N 4.55, and % results = C 59.24 H 4.16 N 3.99.
Moreover, C3 was isolated as a peach solid which is soluble in chlorinated solvents, DMSO, DMF and THF. The isolation of C3 was further confirmed by proton NMR which depicted all the expected characteristic signal peaks (Fig. 5). The 13C NMR spectrum of C3 revealed the most deshielded carbon at 166.6 ppm which is assigned to the carbonyl quaternary carbon. The phosphorus NMR spectrum also revealed a shift from 7.80 ppm (L3) to 40.36 ppm (C3), which also confirms that the palladium centre has coordinated successfully. Furthermore, the mass spectrum depicted the parent ion m/z = 944.1520 [M]+.
C4 was isolated as a green solid, confirmed using the mass spectrum which depicted the parent ion m/z = 499.0456 [M]+. Upon coordination of the Pd centre to L4 the imine stretching frequency bands shifted from 1566 cm−1ν(C![[double bond, length as m-dash]](https://www.rsc.org/images/entities/char_e001.gif) N) and 1620 cm−1ν(C
N) and 1620 cm−1ν(C![[double bond, length as m-dash]](https://www.rsc.org/images/entities/char_e001.gif) N) to lower wavenumbers 1550 cm−1ν(C
N) to lower wavenumbers 1550 cm−1ν(C![[double bond, length as m-dash]](https://www.rsc.org/images/entities/char_e001.gif) N) and 1589 cm−1ν(C
N) and 1589 cm−1ν(C![[double bond, length as m-dash]](https://www.rsc.org/images/entities/char_e001.gif) N) thus confirming isolation of C4. This observation agrees with similar reports in the literature for Pd centres coordinated to Schiff base imines.58,59
N) thus confirming isolation of C4. This observation agrees with similar reports in the literature for Pd centres coordinated to Schiff base imines.58,59
C5 revealed the most deshielded broad proton signals at 12.22 ppm integration for two protons assigned to –O![[H with combining low line]](https://www.rsc.org/images/entities/i_char_0048_0332.gif) , a broad signal at 8.22 ppm assigned to the imine protons integrating for two protons, followed by the aromatic protons in the region 5.86 ppm to 7.84 ppm assigned to Ar–
, a broad signal at 8.22 ppm assigned to the imine protons integrating for two protons, followed by the aromatic protons in the region 5.86 ppm to 7.84 ppm assigned to Ar–![[H with combining low line]](https://www.rsc.org/images/entities/i_char_0048_0332.gif) integrating for 11 protons (ESI-Fig. 15†). The 13C NMR spectrum of C5 also revealed all the characteristic signals (ESI-Fig. 16†).
integrating for 11 protons (ESI-Fig. 15†). The 13C NMR spectrum of C5 also revealed all the characteristic signals (ESI-Fig. 16†).
The single crystal X-ray molecular structure of C1
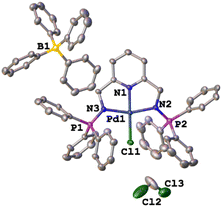
The green single crystals of the C1 complex were grown in DCM through slow evaporation of the complex to further confirm the structure of C1 with traces of the DCM solvent. The crystallographic data and molecular structure are given in ESI-Table 1† and Fig. 6. Complex C1 crystalized in a monoclinic system, space group P21/c. The bond distances and angles around the palladium centre show similarities to those reported in the literature for similar palladium complexes.59–62 The observed bond distances for C1 (Fig. 5) Pd(1)–N(1) 1.940, Pd(1)–N(2) 2.042(4), and Pd(1)–N(3) 2.044(4) are in agreement with those reported by Jerome et. al.63 for the Pd(II)–NNN pincer complex reporting Pd(1)–N(1) 2.028(3), Pd(1)–N(2) 1.920(3), and Pd(1)–N(3) 2.035(3). Similarly, the selected bond angle for C3 N(3)–Pd(1)–N(2) 161.5(15) is similar to that of N(1)–Pd(1)–N(3), 160.68(12) from the Pd(II)–NNN pincer complex.63Catalytic hydrogenation of furfural to furfuryl alcohol
The hydrogenation of FFR to FFA requires the presence of a pre-catalyst, base, hydrogen source (e.g. formic acid (FA)), solvent or solvent-free conditions, and heat (Fig. 7). This can be achieved successfully through the evaluation of optimum conditions which also include reaction time.The evaluation of optimum reaction conditions
The investigation of optimum conditions was conducted under solvent-free conditions. The effects of temperature (entry 1–8) using triethylamine as a base and FA as the hydrogen source were evaluated (Table 1). The conversions and amount of product formed increased significantly from 120–150 °C thus giving 63–98% for C1 and C2 respectively. While the conversions differ by ∼3%, the difference in the amount (in mmol) of FFA produced is negligible (Table 1, entries 7–10) as the amounts are more or less similar for temperatures 150 °C and 160 °C. Therefore, an optimum temperature of 150 °C with potential minimal energy saving compared to 160 °C was selected. When alcohols such as ethanol and isopropanol were utilized as hydrogen sources (Table 1, entries 11–14), ethanol showed some activity when C2 was used as a pre-catalyst, but isopropanol did not. Formic acid is the optimum hydrogen source with up to 98% conversions. It is speculated that the presence of the carboxylic acid group on C2 has some influence on these catalytic systems as observed in the reaction where ethanol was used as the hydrogen source giving 0.182 mmol furfuryl alcohol (18% conversion).| Entry | Cat. | H-source | Temp. (°C) | Conv. (%) | TON | TOF (h−1) | FFA (mmol) (yield%) | FF-formate (mmol) |
|---|---|---|---|---|---|---|---|---|
| a Reaction conditions: reactions were carried out in formic acid/ethanol/isopropanol (5 mmol) with 5 mmol of FFR, 5 mmol of base Et3N and 0.1 mol% Pd catalyst loading (C1/C2). The reaction was allowed to run for 5 hours at 120–160 °C. Thereafter, DMF was used as an internal standard, and TONs and mmol product were determined by 1H NMR spectroscopy. Products were confirmed by GC-MS (ESI-Fig. 19 and 20). | ||||||||
| 1 | C1 | FA | 120 | 68 | 680 | 136 | 3.391 (68) | 0.0324 |
| 2 | C2 | FA | 120 | 63 | 630 | 126 | 3.158 (63) | 0.0454 |
| 3 | C1 | FA | 130 | 90 | 900 | 180 | 4.358 (87) | 0.123 |
| 4 | C2 | FA | 130 | 85 | 850 | 170 | 4.144 (83) | 0.441 |
| 5 | C1 | FA | 140 | 84 | 840 | 168 | 3.858 (77) | 0.363 |
| 6 | C2 | FA | 140 | 88 | 880 | 176 | 4.335 (87) | 0.272 |
| 7 | C1 | FA | 150 | 96 | 960 | 192 | 4.715 (94) | 0.181 |
| 8 | C2 | FA | 150 | 96 | 960 | 192 | 4.759 (95) | 0.104 |
| 9 | C1 | FA | 160 | 99 | 990 | 198 | 4.896 (98) | 0.0778 |
| 10 | C2 | FA | 160 | 98 | 980 | 196 | 4.702 (94) | 0.194 |
| 11 | C1 | EtOH | 150 | — | — | — | — | — |
| 12 | C2 | EtOH | 150 | 18 | 180 | 36 | 0.182 (4) | — |
| 13 | C1 | iPrOH | 150 | — | — | — | — | — |
| 14 | C2 | iPrOH | 150 | — | — | — | — | — |
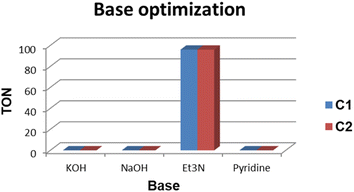
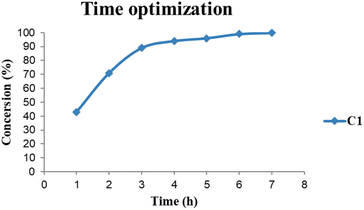
The base evaluation includes the use of triethylamine (Et3N), potassium hydroxide (KOH), sodium bicarbonate (NaHCO3) and pyridine (Fig. 8). Et3N was the only active base with 96% conversion in 5 hours for both C1 and C2 respectively. The selectivity favours the formation of FFA; however, there seem to be some traces of furfuryl formate. The effects of reaction time on FFA production using C1 were evaluated (Fig. 9). At 1 hour only 43% of FFR followed the exponential increase to 89% after 3 hours. The conversion of FFR gradually increased from 94–100% when reaction time was increased from 4–7 hours, with no significant difference between 6 hours and 7 hours. There were no traces of furfuryl formate produced at 6 hours (ESI-Fig. 17†). Therefore, the optimum reaction time was chosen at 6 hours with 100% conversions. Literature reports mostly use hydrogen gas (H2) as a hydrogen source and this often requires higher temperatures, a solvent and/or longer reaction times. Wang and colleagues used supported monometallic catalysts in the hydrogenation of FFR at temperatures ranging from 200–260 °C, at 30 bar H2 in isopropanol over 5 hours. They obtained up to 95% conversion and the reaction was unselective, producing five different products.25 Our research group has also explored H2 as a hydrogen source in furfural hydrogenation using Pd(II), Pt(II), and Ni(II) homogeneous and heterogeneous catalysts. In the presence of a solvent such as ethanol, 100% conversions were recorded in 24 hours producing FFA selectively.35,39,64 Herein, we report the use of moderate temperatures and shorter reaction times.
The effects of catalyst variation
The pre-catalyst variation revealed no significant difference in conversion with all the catalysts C1–C5 giving conversion of greater than 99% (TON ≈ 167) (Table 2, entry 1–5). No traces of furfuryl formate (FF-formate) were produced when C1 and C3–C5 were used respectively. The homogeneity of catalysts C1–C5 was evaluated using the mercury poisoning test. This was achieved by introducing 5 mg of mercury (Hg) into the catalytic systems. All catalysts revealed no change in conversions of FFR to FFA, maintaining >99% (ESI-Fig. 18†), thus confirming no leaching of the catalysts and suggesting that C1–C5 are homogeneous catalysts.| Entry | Cat. | Cat. mol% | Conv. (%) | TON | TOF (h−1) | FFA (mmol) (yield%) | FF-formate (mmol) |
|---|---|---|---|---|---|---|---|
| a Reaction conditions: Reactions were carried out in FA (5 mmol) with 5 mmol of FFR and 5 mmol of Et3N using pre-catalysts C1–C5 respectively. The reaction was allowed to run for 6 hours at 150 °C. DMF was used as an internal standard, and TONs and mmol product were determined by 1H NMR spectroscopy. b No metal-catalyst was used. c 2.5 mmol FA and 2.5 mmol Et3N. d 2.5 mmol FA and 0.007 mmol Et3N. e 2.5 mmol FA. f No FA. g No Et3N. | |||||||
| 1 | C1 | 0.1 | >99 | 1000 | 167 | 5.000 (100) | — |
| 2 | C2 | 0.1 | >99 | 999 | 166 | 4.996 (99) | 0.00227 |
| 3 | C3 | 0.1 | >99 | 1000 | 167 | 4.998 (>99) | — |
| 4 | C4 | 0.1 | >99 | 997 | 166 | 4.996 (>99) | — |
| 5 | C5 | 0.1 | >99 | 999 | 166 | 4.998 (>99) | — |
| 6 | C1 | 0.05 | >99 | 1999 | 333 | 4.997 (>99) | — |
| 7 | C1 | 0.025 | >99 | 4001 | 667 | 4.998 (>99) | — |
| 8 | C1 | 0.01 | >99 | 9996 | 1666 | 4.998 (>99) | — |
| 9b | — | >99 | 4.997 (>99) | — | |||
| 10b,c | — | — | 45 | 1.664 (33) | 0.5945 | ||
| 11b,d | — | — | 28 | 0.8490 (17) | 0.5650 | ||
| 12b,e | — | — | 27 | 1.254 (25) | 0.1292 | ||
| 13b,f | — | — | 0 | 0 | 0 | ||
| 14b,g | — | — | 0 | 0 | 0 | ||
We then went on to evaluate the catalyst loading using C1. Decreasing the catalyst loading from 0.1 mol% to 0.01 mol% did not affect the conversions as they remained greater than 99% (TON ≈ 9996); however the traces of furfuryl formate were no longer observed (Table 2, entry 6–8). Surprisingly, upon omitting the metal-catalyst the efficiency of the optimum conditions maintained a conversion of >99% with an FFA production of 4.997 mmol (Table 2, entry 9).
Upon using half the amount of FA and Et3N to 2.5 mmol respectively, the conversion decreased to 45% (Table 2, entry 10). Furthermore, lowering the amount of FA by half (2.5 mmol) and Et3N to 0.007 mmol the conversion significantly dropped to 28% (Table 2, entry 11). Lowering just the amount of FA by half (2.5 mmol) and maintaining Et3N at 5.0 mmol resulted in a conversion of 27% (Table 2, entry 12). Moreover, performing the reaction without FA resulted in no conversion (Table 2, entry 13). Subsequently, perfomung the reaction in the absence of Et3N resulted in no conversion (Table 2, entry 14). These observations suggest that formate mediated FFR hydrogenation to FFA is a stoichiometric reaction. Thus, the optimum conditions to convert FFR to FFA were 5.00 mmol each of FFR, FA and Et3N at 150 °C over 6 hours. This prompted us to use formate-facilitated conversion of FFR to FFA using different amines to generate formate from formic acid in situ. This was performed using a new birch reactor and a new stirrer bar.
Prior to this work, our research group studied several metal catalysts which include palladium, platinum, nickel, ruthenium and iridium (homogeneous and heterogenized homogeneous catalysts) which were found to be necessary for the hydrogenation of FFR. This includes the study by Oklu et al.34 where they used homogeneous iridium and ruthenium half–sandwich complexes as catalyst precursors under solvent-free conditions in the presence of Et3N and formic acid. The authors reported TONs of up to 2961. Recently, Anyomih et al.36 used a homogeneous palladium(II) pyrazolyl catalyst also under solvent-free conditions in the presence of Et3N and formic acid, to achieve up to 95% FFR conversions to FFA in 6 hours at 160 °C. In this study, we initially evaluated palladium catalysts in FFR hydrogenation, in efforts to improve efficiency. During this study we discovered that the control blank catalytic run (without the palladium catalysts) proceeded to give FFA under solvent-free conditions. As such, this article reports this new methodology – metal catalyst free FFR hydrogenation, with an expansion to other aldehydes.
The hydrogenation of furfural using various amines and formic acid
FFR can be converted to FFA in the presence of triethylamine (Et3N) and formic acid at 150 °C in 6 hours (Fig. 10). Various amines were also evaluated such as diethylamine, pyrrolidine, and N-N-dimethylethylamine (Table 3). This system responds optimally when these secondary and tertiary amines are used giving up to >99% conversions and a percentage yield of FFA. In this study, triethylamine has been chosen because it is most used in our laboratories and therefore always available for use.| Entry | Amine | Conv.% | mmol FFA |
|---|---|---|---|
| a Reaction conditions: reactions were carried out in formic acid (5 mmol) with 5 mmol of FFR and 5 mmol of amine. The reaction was allowed to run for 6 hours at 150 °C. DMF was used as an internal standard, and the mmol product was determined by 1H NMR spectroscopy. | |||
| 1 | Et3N | >99 | 4.997 |
| 2 | Et2NH | >99 | 4.999 |
| 3 | Pyrrolidine | >99 | 4.999 |
| 4 | N-N-Dimethylethylamine | >99 | 4.994 |
The organocatalyzed stoichiometric hydrogenation of various aldehydes
Using the optimum conditions, various aldehydes were screened for their ability to convert to their respective alcohols and formates (Table 4, entry 1–11). The conversion of benzaldehyde was achieved at 87% selectivity to benzyl alcohol and benzyl formate with yields of 80% and 7% respectively (Table 4, entry 1). Cinnamaldehyde as a substrate was only selective to cinnamyl alcohol with 69% conversion achieved (Table 4, entry 2). 4-Methylbenzaldehyde and 3-methylbenzaldehyde have methyl groups on the para and meta positions respectively affording conversions of 59% and 71% encouraged by the deactivating group's (CHO) preference for meta directors (Table 4, entries 3 and 4). When the bulkier para-substituted 4-tertbutylbenzaldehyde was utilized as a substrate, it exhibited a higher conversion of 72% specifically to 4-tertbutylbenzyl alcohol and 4-tertbutylbenzyl formate (Table 4, entry 5). The respective conversions of thiophene-2-carboxaldehyde and pyridine-2-carboxaldehyde obtained were 85% and 100% selective to only the corresponding alcohols (Table 4, entry 6 and 7). 4-Formylbenzoic acid as a substrate showed no activity, which may be due to the electron withdrawing group (carboxylic group) competing with the aldehyde (Table 4, entry 8).| Entry | Aldehyde | Conv. (%) | mmol product (yield%) | mmol formate (yield%) | |
|---|---|---|---|---|---|
| a Reaction conditions: reactions were carried out in formic acid (5 mmol) with 5 mmol aldehyde and 5 mmol of Et3N. The reaction was allowed to run for 6 hours at 150 °C. DMF was used as an internal standard, and the mmol product was determined by 1H NMR spectroscopy. GC-MS was also used to further confirm the products (ESI-Fig. 21−29). | |||||
| 1 |

|
86.9 | 3.994 (79.7)  |
0.359 (7.19)  |
|
| 2 |

|
69.4 | 3.472 (69.4)  |
— | |
| 3 |

|
59.5 | 1.265 (25.3)  |
2.252 (45.0)  |
|
| 4 |

|
71.1 | 1.302 (26.0)  |
2.252(45.1)  |
|
| 5 |

|
72.2 | 2.234 (44.7)  |
1.373 (27.5)  |
|
| 6 |

|
85.4 | 4.269 (85.4)  |
— | |
| 7 |

|
100 | 5.000 (100)  |
— | |
| 8 |

|
0 | — | — | |
| 9 |

|
79.8 | 3.99 (79.8)  |
— | |
| 10 |

|
89.0 | 3.49 (69.9)  |
0.9589 (19.2) | |
| 11 |

|
100 | 5.00 (100)  |
— | |
Linear substrates such as propionaldehyde, nonanal and 3-(methylthio)propionaldehyde were also evaluated and achieved good conversions of 80% (propanol), 89% (nonanol) and 100% (3-(methylthio)propanol) (Table 4, entry 9–11). The evaluation of various aldehydes was successful, affording the corresponding alcohols. However, upon attempts to use the optimum conditions on other carbonyl compounds such as ketones and carboxylic acids, no activity was observed.
Conclusions
The catalytic hydrogenation of furfural to furfuryl alcohol was investigated using iminophosphorane and pyridyl imine palladium pincer complexes (C1–C5). Furfural was converted to furfuryl alcohol in the presence of triethylamine (Et3N) and formic acid (FA) at 150 °C in 6 hours with a catalyst loading of 0.1 mol% obtaining conversions of >99%. However, by lowering the catalyst loading to 0.01 mol% all the pre-catalysts maintained the same conversions of >99%. Without the metal-catalyst, the optimum conditions retained the conversions of >99% with furfuryl alcohol. This observation led to a new procedure which encouraged the evaluation of an organocatalyzed variety of aldehydes to their respective alcohols which was successfully achieved under the stoichiometric solvent-free conditions.Author contributions
Asanda C. Matsheku: conceptualization, methodology, investigation, writing of the original draft and visualization. Munaka Christopher Maumela: co-supervision, conceptualization, validation, and writing-review and editing. Banothile C. E. Makhubela: supervision, conceptualization, methodology, writing—review and editing, project administration and validation. All authors have read and agreed to the published version of the manuscript.Conflicts of interest
The authors declare no conflict of interest.Acknowledgements
This research was funded by the National Research Foundation of South Africa (NRF) (Grant Numbers: 117989 and 131253). We also give our appreciation to the University of Johannesburg (UJ) Centre for Synthesis and Catalysis, UJ Faculty of Science Spectrum for the use of facilities.References
- J. J. Bozell and G. R. Petersen, Green Chem., 2010, 12, 539–554 RSC.
- A. Corma, S. Iborra and A. Velty, Chem. Rev., 2007, 107, 2411–2502 CrossRef CAS PubMed.
- F. W. Lichtenthaler, Carbohydr. Res., 1998, 313, 69–89 CrossRef CAS.
- W. L. Kubic, X. Yang, C. M. Moore and A. Sutton, Chemicals from Biomass: a Market Assessment of Bioproducts with Near-Term Potential, 2020 Search PubMed.
- M. J. Biddy, C. J. Scarlata and C. M. Kinchin, Chemicals from Biomass: A Market Assessment of Bioproducts with Near-Term Potential, 2016 Search PubMed.
- Large Scale Furfural Production (from Bagasse), https://dalinyebo.com/project/large-scale-furfural-production-from-bagasse/, accessed 31 August 2022 Search PubMed.
- X. Li, P. Jia and T. Wang, ACS Catal., 2016, 6, 7621–7640 CrossRef CAS.
- J. N. Chheda, G. W. Huber and J. A. Dumesic, Angew. Chem., Int. Ed., 2007, 46, 7164–7183 CrossRef CAS PubMed.
- K. Yan, G. Wu, T. La and C. Jarvis, Renew. Sustain. Energy Rev., 2014, 38, 663–676 CrossRef CAS.
- J. C. Serrano-Ruiz, R. Luque and A. Sepulveda-Escribano, Chem. Soc. Rev., 2011, 40, 5266–5281 RSC.
- J. Lee, Y. T. Kim and G. W. Huber, Green Chem., 2014, 16, 708–718 RSC.
- G. J. S. Dawes, E. L. Scott, J. Le Nôtre, J. P. M. Sanders and J. H. Bitter, Green Chem., 2015, 17, 3231–3250 RSC.
- M. J. Climent, A. Corma and S. Iborra, Green Chem., 2014, 16, 516–547 RSC.
- R. Rao, A. Dandekar, R. T. K. Baker and M. A. Vannice, J. Catal., 1997, 171, 406–419 CrossRef CAS.
- H. E. Hoydonckx, W. M. Van Rhijn, W. Van Rhijn, D. E. De Vos and P. A. Jacobs, in Ullmann's Encyclopedia of Industrial Chemistry, Wiley-VCH, Weinheim, 2007, p. 14356007 Search PubMed.
- Á. O. Driscoll, J. J. Leahy and T. Curtin, Catal. Today, 2017, 279, 194–201 CrossRef.
- C. M. Peeters and R. Deliever, J. Chem. Ed., 2009, 86, 87–90 CrossRef CAS.
- J. Magano and J. R. Dunetz, Org. Process Res. Dev., 2012, 16, 1156–1184 CrossRef CAS.
- A. Berkessel, T. J. S. Schubert and T. N. Müller, J. Am. Chem. Soc., 2002, 124, 8693–8698 CrossRef CAS PubMed.
- C. Walling and L. Bollyky, J. Am. Chem. Soc., 1964, 86, 3750–3752 CrossRef CAS.
- C. Walling and L. Bollyky, J. Am. Chem. Soc., 1961, 83, 2968–2969 CrossRef CAS.
- W. Gong, C. Chen, R. Fan, H. Zhang, G. Wang and H. Zhao, Fuel, 2018, 231, 165–171 CrossRef CAS.
- W. Ouyang, A. Yepez, A. A. Romero and R. Luque, Catal. Today, 2018, 308, 32–37 CrossRef CAS.
- B. Wang, C. Li, B. He, J. Qi and C. Liang, J. Energy Chem., 2017, 26, 799–807 CrossRef.
- Y. Wang, P. Prinsen, K. S. Triantafyllidis, S. A. Karakoulia, P. N. Trikalitis, A. Yepez, C. Len and R. Luque, ACS Sustain. Chem. Eng., 2018, 6, 9831–9844 CrossRef CAS.
- L. Grazia, A. Lolli, F. Folco, Y. Zhang, S. Albonetti and F. Cavani, Catal. Sci. Technol., 2016, 6, 4418–4427 RSC.
- S. Wang, V. Vorotnikov and D. G. Vlachos, Green Chem., 2014, 16, 736–747 RSC.
- S. Sitthisa, W. An and D. E. Resasco, J. Catal., 2011, 284, 90–101 CrossRef CAS.
- S. Sitthisa, T. Sooknoi, Y. Ma, P. B. Balbuena and D. E. Resasco, J. Catal., 2011, 277, 1–13 CrossRef CAS.
- R. Mariscal, P. Maireles-Torres, M. Ojeda, I. Sadaba and M. Lopez Granados, Energy Environ. Sci., 2016, 9, 1144–1189 RSC.
- G. Singh, L. Singh, J. Gahtori, R. Kumar, C. Samanta, R. Bal and A. Bordoloi, Mol. Catal., 2021, 500, 111339 CrossRef CAS.
- D. Liu, D. Zemlyanov, T. Wu, R. J. Lobo-Lapidus, J. A. Dumesic, J. T. Miller and C. L. Marshall, J. Catal., 2013, 299, 336–345 CrossRef CAS.
- J. M. Tukacs, M. Bohus, G. Dibó and L. T. Mika, RSC Adv., 2017, 7, 3331–3335 RSC.
- N. K. Oklu and B. C. E. Makhubela, New J. Chem., 2020, 44, 9382–9390 RSC.
- P. S. Moyo, L. C. Matsinha and B. C. E. Makhubela, J. Organomet. Chem., 2020, 922, 121362 CrossRef CAS.
- W. D. Anyomih, N. K. Oklu, E. Ocansey, K. K. Singh, J. Darkwa and B. C. E. Makhubela, Biomass Convers. Biorefin., 2022 DOI:10.1007/s13399-022-03449-2.
- N. Gorgas, B. Stöger, L. F. Veiros and K. Kirchner, ACS Catal., 2016, 6, 2664–2672 CrossRef CAS PubMed.
- A. Mukherjee and D. Milstein, ACS Catal., 2018, 8, 11435–11469 CrossRef CAS.
- M. Kalumpha, L. C. Matsinha and B. C. E. Makhubela, Catalysts, 2021, 11, 1–22 CrossRef.
- S. Murugesan and K. Kirchner, Dalton Trans., 2016, 45, 416–439 RSC.
- M. Albrecht and G. Van Koten, Angew. Chem, Int. Ed., 2001, 40, 3750–3781 CrossRef CAS.
- R. A. Gossage, L. A. Van De Kuil and G. Van Koten, Acc. Chem. Res., 1998, 31, 423–431 CrossRef CAS.
- M. E. van der Boom and D. Milstein, Chem. Rev., 2003, 103, 1759–1792 CrossRef CAS PubMed.
- J. T. Singleton, Tetrahedron, 2003, 59, 1837–1857 CrossRef CAS.
- L. C. Liang, Coord. Chem. Rev., 2006, 250, 1152–1177 CrossRef CAS.
- S. Ramírez-rave, D. Morales-morales and J. Grévy, Inorg. Chim. Acta., 2017, 462, 249–255 CrossRef.
- G. K. Anderson, M. Lin, A. Sen and E. Gretz, in Inorganic Syntheses, John Wiley & Sons, Inc., Hoboken, NJ, USA, 2007, pp. 60–63 Search PubMed.
- Bruker-AXS, SADABS, S. S. R. Manuals and M. U. Wisconsin, 2009 Search PubMed.
- G. Sheldrick and A. Shelxl, Sect. A Fundam. Crystallogr., 2008, 64, 112–122 CrossRef CAS.
- H. Su, C. Wu, J. Zhu, T. Miao, D. Wang, C. Xia, X. Zhao, Q. Gong, B. Song and H. Ai, Dalton Trans., 2012, 41, 14480–14483 RSC.
- T. Cheisson and A. Auffrant, Dalton Trans., 2014, 43, 13399–13409 RSC.
- K. C. Nicolaou, C. N. C. Boddy, H. Li, A. E. Koumbis, R. Hughes, S. Natarajan, N. F. Jain, J. M. Ramanjulu, S. Bräse and M. E. Solomon, Chem.–Eur. J., 1999, 5, 2602–2621 CrossRef CAS.
- K. C. Nicolaou, N. F. Jain, S. Natarajan, R. Hughes, M. E. Solomon, H. Li, J. M. Ramanjulu, M. Takayanagi, A. E. Koumbis and T. Bando, Angew. Chem., Int. Ed., 1998, 37, 2714–2716 CrossRef CAS PubMed.
- N. A. Bailey, D. E. Fenton, S. J. Kitchen, T. H. Lilley, M. G. Williams, P. A. Tasker, A. J. Leong and L. F. Lindoy, J. Chem. Soc., Dalt. Trans., 1991, 627–637 RSC.
- M. D. Milošević, A. D. Marinković, P. Petrović, A. Klaus, M. G. Nikolić, N. Prlainović and I. N. Cvijetić, Bioorg. Chem., 2020, 102, 104073 CrossRef PubMed.
- A. L. Vance, N. W. Alcock, J. A. Heppert and D. H. Busch, Inorg. Chem., 1998, 37, 6912–6920 CrossRef CAS.
- M. Abubekerov, S. I. Khan and P. L. Diaconescu, Organometallics, 2017, 36, 4394–4402 CrossRef CAS.
- A. C. Matsheku, R. Tia, M. C. Maumela and B. C. E. Makhubela, Catalysts, 2021, 11, 755 CrossRef CAS.
- A. C. Matsheku, M. C. Maumela and B. C. E. Makhubela, Polyhedron, 2021, 205, 115280 CrossRef CAS.
- V. Diez, V. Cuevas, G. Garcı, G. Aullo, J. P. H. Charmant, U. De Burgos and P. M. Ban, Inorg. Chem., 2007, 46, 2220–2222 CrossRef PubMed.
- R. Wang, J.-C. Xiao, B. Twamley and J. M. Shreeve, Org. Biomol. Chem., 2007, 5, 671 RSC.
- J. G. P. Delis, M. Rep, R. E. Rülke, P. W. N. M. van Leeuwen, K. Vrieze, J. Fraanje and K. Goubitz, Inorg. Chim. Acta., 1996, 250, 87–103 CrossRef CAS.
- P. Jerome, J. Haribabu, N. S. P. Bhuvanesh and R. Karvembu, ChemistrySelect, 2020, 5, 13591–13597 CrossRef CAS.
- P. S. Moyo, B. Vatsha, G. Mehlana, L. C. Matsinha and B. C. E. Makhubela, Dalton Trans., 2023, 52, 6300–6316 RSC.
Footnote |
| † Electronic supplementary information (ESI) available. CCDC 2092021. For ESI and crystallographic data in CIF or other electronic format see DOI: https://doi.org/10.1039/d3su00056g |
| This journal is © The Royal Society of Chemistry 2023 |

