 Open Access Article
Creative Commons Attribution 3.0 Unported Licence
Adsorption of sulfate ions from water by CaCl2-modified biochar derived from kelp†
Bingbing
Tian
,
Yalong
Song
,
Rubin
Wang
,
Yi
Wang
,
Tianyang
Wang
,
Jinhui
Chu
,
Zhu
Qiao
,
Min
Li
 *,
Jianjiang
Lu
 * and
Yanbin
Tong
Key Laboratory of Environmental Monitoring and Pollutant Control of Xinjiang Bingtuan, School of Chemistry and Chemical Engineering, Shihezi University, Shihezi, 832000, Xingjiang, China. E-mail: limin@shzu.edu.cn
First published on 14th April 2023
Abstract
In order to prevent the slow degradation of pristine water ecosystems caused by increasing SO42− in natural water bodies (lakes and rivers), innovative and cost-effective remediation techniques are urgently required. Using natural waste kelp trimmings as the carbon source, the CaCl2 activation-carbonation process generates an ecologically acceptable biomass carbon adsorbent. To adsorb SO42− from an aqueous solution, kelp-based activated carbon adsorption material (KPC) was created. According to FT-IR research, KPC has many active groups, namely OH and C–O, which further improve adsorption efficiency. The adsorbent had the following property characteristics: The TEM-EDS, XPS, and BET characterization studies were used to describe the adsorbent, and the findings showed that Ca2+ was present on the surface of the unactivated kelp-based activated carbon material (UKC). Compared to UKC, KPC has a porous structure and a greater specific surface area. KPC shows good affinity for SO42− with a maximum sulfate adsorption capacity of 866.98 mg g−1, which is much higher than that of other materials (such as grapefruit peel (35.21 mg g−1 adsorption) and coconut shell (4.90 mg g−1 adsorption)). Kinetic studies showed that the adsorption of sulfate ions from simulated water (SW) and Ulungu lake water (LW) followed quasi-secondary kinetics. Isotherm data analysis shows that the Langmuir isotherm model is compatible with SO42− in simulated water.
Sustainability spotlightThis work reported that natural waste kelp was used as a carbon source to prepare a biochar adsorbent and used for the treatment of SO42− in lakes and rivers to protect the aquatic ecosystem environment, meet the national sustainable development strategy, and respond economically, effectively and sustainably. TEM-EDS, XPS, and BET describe the adsorbent characteristics. According to the FT-IR study, KPC has many active groups, further improving adsorption efficiency. In addition, this work is consistent with the United Nations' goal of sustainable consumption and production of chemical products. |
1 Introduction
Sulfate (SO42−) is ubiquitous not only in heavy-metal polluted effluents but also in natural waters. High concentrations of SO42− can cause water mineralization, corrosion and scaling of steel pipes and equipment, damage to mammals, and the generation of poisonous and corrosive H2S in the sewer system.1–3 Therefore, many techniques have been applied to reduce and reclaim sulfate ions from wastewater, including adsorption, chemical coagulation, and ion exchange.4–8 Compared with other methods, adsorption is the most favorable of all contemporary environmental cleanup solutions since it is cost-effective, uses little energy, and is very simple to execute.9Many studies have shown that significant SSA,10 high pore capacity, and porous carbon can be prepared by pyrolysis and activation of biomass materials with a special plant structure.11–13 The biomass material precursors for porous carbon can save costs and alleviate the shortage of fossil fuels and environmental pollution. These precursors include the natural waste durian shell,14 spent mushroom substrate (SMS),15 hardwood and corn straw,16 litchi shell, mung bean flour,17 peanut shell,18 local forest (tree branches),19 and so on.20–24 In contrast, there are few reports on using marine organisms as porous carbon raw materials. Biochar prepared by using Laminaria japonica has functional characteristics, and can be directly used as carbon sources and applied in soil remediation in agricultural fields, as a catalyst,25 catalyst support,26 and biological adsorbent27 in the application of wastewater treatment, and also in lithium batteries and sensors.28 Kelp is one of the most common edible seaweeds, and is an excellent raw material for the preparation of porous carbon because of its low cost, vast source, rapid reproduction, high yield, high reproducibility, inherent richness in N, P, S and other multiple elements, and its biomass micro-pore channel structure. It should be highlighted that Laminaria japonica is grown worldwide, with China's output ranking first, but a significant portion remains mainly unused and will be discarded. As a result, using waste kelp trimmings to make high-performance porous carbon and develop new green energy would yield tremendous economic advantages while also ensuring global sustainability.
Due to the high oxygen-containing functional groups of kelp,29 kelp adsorption has been extensively documented to remove organic dyes and heavy metal ions from wastewater.30,31 However, many activated carbons are made in a time-consuming, multi-step, and ecologically unfriendly process. As activators, KOH, HCl, H2SO4, FeCl3, ZnCl2, and other chemicals are employed, and these chemicals are eliminated in the succeeding process, which can pollute the environment. As a result, a simple, green, and scalable method for preparing multistage porous biomass carbon employing kelp as the raw material and green chemical activators is urgently needed. Chemical activation of biomass waste with CaCl2 instead of NaOH/KOH/ZnCl2 is an effective method to prepare porous carbon for adsorption. However, studying porous carbon using the CaCl2 chemical activation method has not attracted much interest. Nevertheless, as far as recent studies have shown, calcium chloride-modified biomass carbon is widely used in supercapacitors due to the green color exhibited by the activator and the high pore-forming capacity.17 There is insufficient research on calcium chloride-modified biomass carbon adsorbent materials compared to that on other adsorbents for pollutants.
The base carbonaceous materials used in the study were wasted kelp. Although the World Health Organization (WHO) guideline for maximum permissible concentration (MPC) for sulfate in drinking water is 250 mg L−1, most previous studies5 on sulfate removal worked with initial sulfate concentrations that are less than the stated MPC. Also, in practice, real contaminated sources and wastewater contain sulfate concentrations that are often higher than the MPC. Therefore, in this study, a new carbon material of CaCl2 modified with natural waste kelp trimmings was prepared to improve the treatment of sulfate ion wastewater. In this study, the adsorption this study involved (1) characterization of KPC (kelp-based activated carbon adsorption material), UKC (kelp-based activated carbon material), used sample (US), pre-carbonized sample (PCS), and raw sample (RS) so that any changes in surface and chemical species could be recognized; (2) batch adsorption experiments to evaluate the absorption of SO42− by KPC, supported by adsorption kinetic and thermodynamic studies. Based on the analysis, our study also aims (3) to clarify if the adsorbent exhibits a broad prospect for application in water pollutant treatment.
2 Experimental section
2.1 Materials
The dried Laminaria japonica powder with a particle size of 200 mesh was obtained from Rongcheng Three Penguin E-Commerce Co., Ltd in Shandong Province (China). All other chemical reagents, including hydrochloric acid (37 wt%, HCl, analytical reagent grade) and calcium chloride (CaCl2, analytical reagent grade) were used without further purification. SO42− standard solution (1 mg mL−1) was purchased from Shenzhen Chengyuan Technology Co., Ltd (China), and barium chromate (BaCrO4, analytical reagent grade) was purchased from Guangfu Fine Chemical Research Institute, Tianjin, China, and were used without further purification. Deionized (DI) water was used throughout all experiments.2.2 Preparation of the adsorbent
In this paper, kelp powder was used as a precursor to prepare biomass activated carbon, including by pre-carbonization, activated carbonization, and post treatment. During the pre-carbonization process, kelp powder was dried at 105 °C for 2 hours, and then transferred to a crucible. Then, the crucible was covered, placed in a porcelain boat, and then placed in a muffle furnace for carbonization. After sealing the muffle furnace, a program must be set up to increase the temperature to the predetermined carbonization temperature (300 °C) at a rate of 11 °C min−1 at room temperature for 2 hours before it was taken out, and then cooled (cooling rate: 11 °C min−1) to room temperature.During the activation and carbonization process, the obtained carbide and activator calcium chloride solution (mass concentration 30%) are fully mixed in a 1![[thin space (1/6-em)]](https://www.rsc.org/images/entities/char_2009.gif) :
:![[thin space (1/6-em)]](https://www.rsc.org/images/entities/char_2009.gif) 3 mass ratio, and then placed in a tubular furnace under the protection of a nitrogen gas stream. This was activated for 2 hours, heated at 5 °C min−1, activated at 700 °C, naturally cooled to room temperature, and then removed. First, the activated carbon is washed six times by centrifugation with ethanol. Then the supernatant was poured out, centrifuged with deionized water 6 times, and centrifuged to neutral at 7000 rpm for 6 minutes. Finally, the activator is recovered and filtered, and the filter cake is dried to a constant mass at 105 °C and stored. The schematic diagram of preparing porous carbon from waste kelp excipients.
3 mass ratio, and then placed in a tubular furnace under the protection of a nitrogen gas stream. This was activated for 2 hours, heated at 5 °C min−1, activated at 700 °C, naturally cooled to room temperature, and then removed. First, the activated carbon is washed six times by centrifugation with ethanol. Then the supernatant was poured out, centrifuged with deionized water 6 times, and centrifuged to neutral at 7000 rpm for 6 minutes. Finally, the activator is recovered and filtered, and the filter cake is dried to a constant mass at 105 °C and stored. The schematic diagram of preparing porous carbon from waste kelp excipients.
2.3 Characterization
Morphology and particle size distributions of prepared samples were investigated by scanning electron microscopy (SEM) (JSM 7500F, Japan) and TEM-EDS (FEl Talos F200i). Carbon, hydrogen, nitrogen, and sulfur contents of the samples were determined using a CHN element analyzer (Elementar Vario EL) with a detection limit of 0.1%. In addition, the samples' Fourier transform infrared (FT-IR) spectra were recorded at room temperature according to the KBr.(Sigma-Aldrich ≥99%) pellet method (sample: KBr = 1![[thin space (1/6-em)]](https://www.rsc.org/images/entities/char_2009.gif) :
:![[thin space (1/6-em)]](https://www.rsc.org/images/entities/char_2009.gif) 100) on a PerkinElmer Spectrum 100 spectrophotometer in the 400–4000 cm−1 range with an average of 50 scans. The resolution was better than 4 cm−1. The Brunner–Emmett–Teller (BET) method determined the specific surface areas of adsorbents in an ASAP 2460 with N2 gas. The BJH (Barret–Joyner–Halenda) method obtained the pore radius distribution from the adsorption branch. The samples were evacuated overnight at 90°C. The zeta potential of the obtained suspension was determined using a Zeta potential analyzer (NanoPIUS-3). The elemental composition and the chemical bonding state on the sample surface were determined using X-ray photoelectron spectroscopy (XPS) (Thermo Scientific K-Alpha). A curve-fitting program (XPS-Avantage software) was used to fit the XPS results under Shirley's background. The crystallographic structures of the biochars were observed using X-ray diffraction (XRD, Bruker D8 Advance), and the samples were scanned from 5 to 90° with a scan speed of 10° min−1.
100) on a PerkinElmer Spectrum 100 spectrophotometer in the 400–4000 cm−1 range with an average of 50 scans. The resolution was better than 4 cm−1. The Brunner–Emmett–Teller (BET) method determined the specific surface areas of adsorbents in an ASAP 2460 with N2 gas. The BJH (Barret–Joyner–Halenda) method obtained the pore radius distribution from the adsorption branch. The samples were evacuated overnight at 90°C. The zeta potential of the obtained suspension was determined using a Zeta potential analyzer (NanoPIUS-3). The elemental composition and the chemical bonding state on the sample surface were determined using X-ray photoelectron spectroscopy (XPS) (Thermo Scientific K-Alpha). A curve-fitting program (XPS-Avantage software) was used to fit the XPS results under Shirley's background. The crystallographic structures of the biochars were observed using X-ray diffraction (XRD, Bruker D8 Advance), and the samples were scanned from 5 to 90° with a scan speed of 10° min−1.
2.4 Batch experiments
The adsorption experiment studied the removal of SO42− by porous carbon, under the condition that certain experimental conditions remain unchanged, and other experimental factors are carried out according to a low to high gradient for adsorption experiments. The design experiment is shown in Table 1.| Serial number | Investigating factors | Level |
|---|---|---|
| 1 | Dose/g | 0.1–0.5 |
| 2 | Concentration of SO42−/(g L−1) | 0.3–0.9 |
| 3 | pH | 5.0–9.0 |
| 4 | Adsorption time/min | 30–150 |
| 5 | T/°C | 25–50 |
| 6 | Rotating speed/rpm | 100–165 |
The removal efficiencies and the adsorption amount of sulfate on porous carbon were calculated according to the following eqn (1) and (2):
 | (1) |
 | (2) |
The test was conducted using the barium chromate photometric technique. 0.00 mL, 0.25 mL, 1.00 mL, 2.00 mL, 4.00 mL, 6.00 mL, 8.00 mL, and 10.00 mL of sulphate standard solution, made up to 50 mL with deionized water, were added to eight conical flasks. Each of the eight conical flasks received 1 mL of a 2.5 moL L−1 hydrochloric acid solution, which was added, heated, and then maintained at the boiling point for 20 minutes. Once the mixture has cooled a little, 1 + 1 ammonia and 2 drops of ammonia were added to give it a lemon yellow hue. After being progressively filtered using qualitative filter paper using a conical flask that had been well chilled, the filtrate was transferred to a 50 mL volumetric flask, where water was poured to scale. The spectrophotometer's wavelength was adjusted to 420 nm, and a standard curve was plotted after measuring the absorbance using a 10 mm cuvette. Using the aforementioned technique, the sulphate ion concentration of the water samples was also measured. Every time, 50 mL of the water sample to be analyzed was taken, its absorbance was determined using the aforementioned procedure, and its sulfate ion concentration was calculated using the standard curve.
2.5 Adsorption kinetics and thermodynamics studies
(1) Langmuir model
Under the assumption of the Langmuir isothermal adsorption model, the adsorption sites are uniformly distributed on the adsorbent surface, and the adsorbent and adsorbate have no interaction with each other, which is a single molecular layer adsorption. The nonlinear and linear expressions of the Langmuir isothermal model:32
 | (3) |
 | (4) |
The essential features of the Langmuir isothermal adsorption model will be described by the equilibrium constant (RL), which determines the affinity between the adsorbent and the adsorbate, expressed as eqn (5):
 | (5) |
(2) Freundlich isothermal adsorption model
Under the assumption of the Freundlich isothermal adsorption model, the adsorption sites are non-homogeneously distributed on the adsorbent surface, and the adsorbent and adsorbent belong to multilayer adsorption. The linear and nonlinear expressions of the Freundlich isothermal model as eqn (6) and (7):
 | (6) |
 | (7) |
(3) Langmuir–Freundlich model
 | (8) |
(4) The Temkin model has been applied in the following form:31
qe = a + b![[thin space (1/6-em)]](https://www.rsc.org/images/entities/char_2009.gif) ln(Ce) ln(Ce) | (9) |
(5) D–R model
ln![[thin space (1/6-em)]](https://www.rsc.org/images/entities/char_2009.gif) qe = ln qe = ln![[thin space (1/6-em)]](https://www.rsc.org/images/entities/char_2009.gif) qm − βε2 qm − βε2 | (10) |
![[thin space (1/6-em)]](https://www.rsc.org/images/entities/char_2009.gif) ln(1 + 1/Ce), where R is the molar constant of the ideal gas, 8.314 J (mol K)−1, and T is the absolute temperature (K).
ln(1 + 1/Ce), where R is the molar constant of the ideal gas, 8.314 J (mol K)−1, and T is the absolute temperature (K).
The average free energy of adsorption (4.88 kJ mol−1) can be calculated from the constant β of the D–R equation33 (kJ mol−1). The formula is shown in eqn (11).
 | (11) |
| Adsorbent | SO42−concentration (g L−1) | Time (min) | Same experimental conditions |
|---|---|---|---|
| KPC | 0.9 | 30, 60, 90, 120, 150, 180, 240, 300, 360, 420, 480, and 540 | pH = 8.0, 0.1 g, 1 h, 120 rpm |
After studying the effect of time on adsorption, kinetics is often used to evaluate the entire adsorption process. Kinetics can provide information such as the adsorption rate, which can give an idea of the time required for adsorption. In order to explore the adsorption mechanism in the adsorption process, the experimental kinetic data were fitted using pseudo-first order kinetics, pseudo-second order kinetics, the Elovich model, and the intraparticle diffusion (W–M) kinetic model, and each kinetic equation is shown in eqn (12–15), respectively.13
(1) Pseudo-first order kinetics
ln(qe − qt) = ln![[thin space (1/6-em)]](https://www.rsc.org/images/entities/char_2009.gif) qe − k1t qe − k1t | (12) |
(2) Pseudo-second order kinetics
 | (13) |
(3) Intraparticle diffusion (W–M) kinetic model
| qt = k3 × t1/2 + c | (14) |
(4) Elovich model
 | (15) |
| Adsorbent | T (K) | SO42−concentration (g L−1) | Same experimental conditions |
|---|---|---|---|
| KPC | 303.15, 313.15, and 323.15 | 0.3, 0.5, 0.7, 0.9, 1, 1.2, 1.4, 1.6, 1.8, 2.0, 2.3, 2.6, and 2.9 | pH = 8.0, 0.1 g, 1 h, 120 rpm |
The thermodynamic parameters of sulfate adsorption by KPC can be calculated according to eqn (16), (17), and (18).
ΔG° = −RT![[thin space (1/6-em)]](https://www.rsc.org/images/entities/char_2009.gif) ln ln![[thin space (1/6-em)]](https://www.rsc.org/images/entities/char_2009.gif) b b | (16) |
| ΔG° = ΔH° − TΔS° | (17) |
 | (18) |
3 Results and discussion
The SEM images of different materials at different magnifications are shown in Fig. 1. From Fig. 1a and k, it can be seen that the surface of the pyrolyzed biomass carbon materials (PCS and UKC) was rough and showed a large number of lamellar or reticulated structures compared to that of the original kelp powder (RS), which may be due to the collapse of the biocarbon structure during the release of a large amount of gas produced by the RS during the pyrolysis process.5 During the preparation of KPC, CaCl2 was loaded onto the kelp surface for modification. The pristine kelp surface is rough after high-temperature pyrolysis, thus forming a porous structure with a large surface area (Fig. 1f). A large number of folds on the surface of carbon fiber facilitates the bonding of calcium ions. It can be observed that the formed CaCl2 agglomerates are tightly attached to the surface of kelp carbon fibers in the form of solids (Fig. 1e and 2b). Moreover, the addition of CaCl2 did not disrupt the folded morphology and porous structure of UKC (Fig. 1b, h, j, d–f and i). The layered porous structure dramatically increases the adsorption sites of sulfate ions in water. At the same time, the formation of not only micro-nano channels on the biomass fibers but also the mutual formation of a macroporous structure, which facilitates the mass transfer of SO42− to KPC, further improves the adsorption performance of KPC. Specifically, it can be seen that both the KPC and UKC samples show irregular lumps and a compact network structure. After chemical activation by CaCl2, the carbon particles were oxidized and swollen to form a rough and fluffy structure.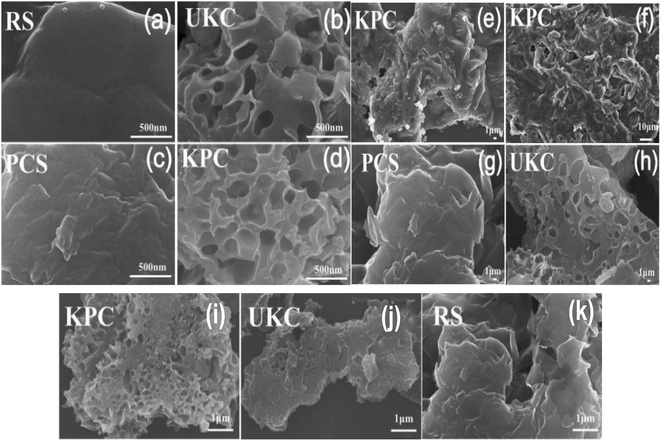 | ||
| Fig. 1 (c and g) SEM images of the PCS sample, (b, h and j) SEM images of the UKC sample, (d–f and i) SEM images of the KPC sample, (a and k) SEM images of the RS sample at different magnifications. | ||
To confirm the role of CaCl2 in this activation thermal cracking process, the same tests were performed on two blank samples of UKC. The internal structure of the CaCl2-activated samples can be further observed by using TEM-EDS images, as shown in Fig. 2. The material is peeled, curled, and stretched during the carbonization process as a disordered lamellar structure (e.g., Fig. 2a).The CaCl2 activation process causes the carbon particles to oxidize and swell, peel off from the carbon layer surface and fold and bend (as in Fig. 2b). Previous studies have pointed out that CaCl2 can react with C to form CaCO3 during the high-temperature carbonization process. After the process, the remaining CaCO3 in the material is washed away with acid and deionized water, and abundant micropores and mesopores emerge.35 In general, an increase in surface roughness leads to an increase in the specific surface area of the adsorbent, in theory increasing the adsorption efficiency. Therefore, this observation infers that hybrid biosorbents with a high specific surface area may be suitable for ion adsorption processes. In addition, ion exchange may be one of the adsorption mechanisms.
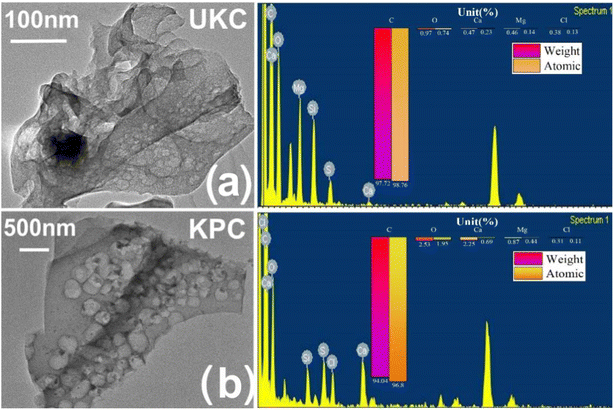 | ||
| Fig. 2 (a) TEM-EDS images of kelp biochar produced by direct pyrolysis; (b) TEM-EDS plots of kelp biochar produced by the activation method. | ||
FT-IR spectra were evaluated for raw kelp powder and pre-carbonized kelp powder, and activated-carbonized kelp powder in order to confirm the presence of various surface functional groups. The peaks close to 3100 and 3400 cm−1 resulting from activated biochars express O–H elongations in Fig. 3(RS) that represent phenols, alcohols, carboxyls, as well as the intrinsic moisture (including interlaminar –OH and interlaminar water molecules –OH) of the materials, and this is consistent with the article reported by Almeida and Liu.36,37 On the spectrum (PCS and KPC), peaks are found in this interval with intensity changes, signaling that the –OH group has changed after calcination. The peaks close to 2921 and 2926 cm−1 represent CH2 due to the long chains of the raw sample (RS). As the pyrolysis temperature increased, this peak in biochars eventually decreased.38 Carboxylic acid salts and the amide band have maxima at 1200−1 and 1850 cm−1. C–O bonds, which represent alcohols, esters, ethers, and phenols, had peaks ranging from 1029−1 to 1250 cm−1.
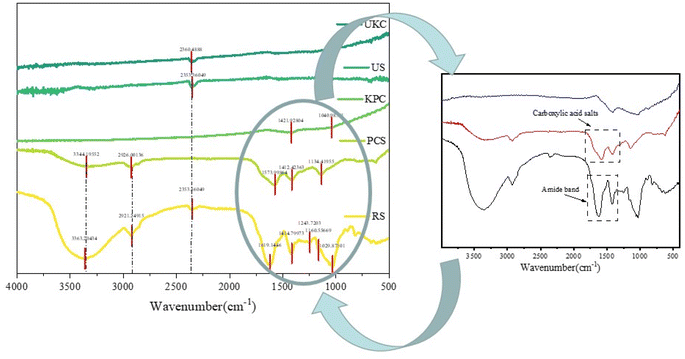 | ||
| Fig. 3 FT-IR spectra of the raw sample (RS), pre-carbonized sample (PCS) and kelp-based activated carbon adsorption material (KPC), unactivated kelp carbon material (UKC), and used sample (US). | ||
The number of oxygen-containing functional groups on the surface of biomass carbon materials changes with the pyrolysis temperature, and the number of surface functional groups changes with the pyrolysis temperature. Recent research has revealed that the carboxyl group in the oxygen-containing functional group is a critical element of biochar characterization.35 The cellulose in the biomass is transformed into carboxyl groups or esters, which are oxygen-containing functional groups on the surface, during the pyrolysis process. Since the carboxyl group is the active site for adsorbing contaminants, it is crucial to determine the adequate pyrolysis temperature for many oxygen-containing functional groups. The peaks of oxygen-containing functional groups of kelp adsorbing carbon materials strongly appear after pyrolysis, which may help to adsorb pollutants.
The crystal structures of the obtained sample were analyzed by XRD as shown in Fig. 4. After adding calcium chloride to PCS, the KPC sample showed a large number of sharp diffraction peaks, and it is worth mentioning that the diffraction angles 29.34°and 31.33°are consistent with the distinctive peaks of CaCl2. The information related to the carbon morphology in the material was characterized using XRD. All samples have the characteristic peak 2θ = 25°, representing the graphic stacking structure (002) surface. 2θ = 45° represents a disordered amorphous carbon stacking (100) surface.36 The peak intensity of KPC at low angles is higher than that of PCS, indicating a greater density of micropores and a disordered structure, which can provide more active sites for applying adsorbed pollutants. The XRD pattern shows that the material prepared in this experiment mainly contains a large amount of amorphous carbon. It can be observed from the figure that the (002) crystal plane diffraction peaks from PCS to KPC become weaker as the temperature increases, demonstrating an increase in the disorder of the carbon structure. The mixed precursor before the addition of CaCl2 to PCS has no apparent XRD diffraction peak crystalline structure because of the absence of highly dispersed and filled CaCl2 in the biological skeleton. During the thermal cracking and warming process, the high carbonization temperature leads to the collapse of the carbon layer. The biomass carbon with excess oxygen becomes CO2, which forms calcium carbonate and sodium chloride with calcium and sodium ions and simultaneously reacts with the carbon material to insert heteroatoms into the carbon layer, during which chemical activation and physical activation take place. The highly dispersed CaCl2 aggregates and precipitates to form the crystalline structure CaCl2 The honeycomb structure of carbon materials.
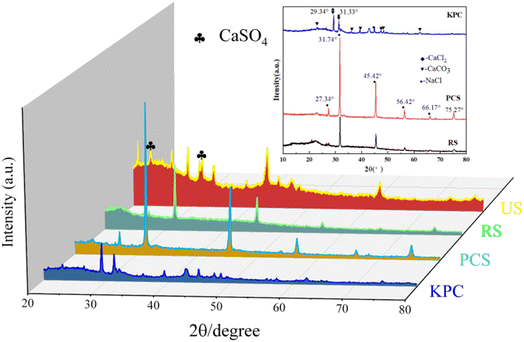 | ||
| Fig. 4 XRD patterns of the raw sample (RS), pre-carbonized sample (PCS), kelp-based activated carbon adsorption material (KPC), and used sample (US). | ||
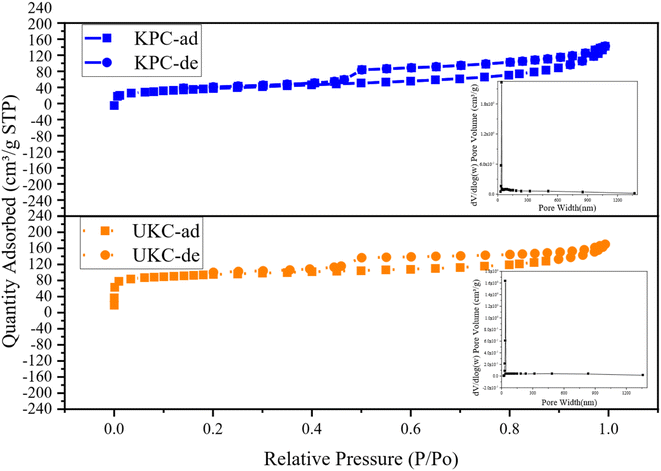
In order to gain insight into the porous structures of the samples, the N2 adsorption–desorption test was carried out with the isotherms and BJH pore size distribution curves shown in Fig. 5. The BET-specific surface areas (SSA) and porous structure parameters are summarized in Table 4. Based on the IUPAC classification, the isotherms of both UKC and KPC conform to a type IV isotherm for an H4 type hysteresis loop, representing a typical macroporous structure, with a SSA of only 254.675 m2 g−1. The specific surface area of KPC is smaller than that of UKC, whereas the total pore volume and average pore radius of KPC are higher than that of UKC. This result indicates that the increase of CaCl2 after pre-carbonation promotes the formation of a mesoporous structure. In addition, the pore structure of KPC may collapse and CaCl2 occupies the carbon layer exhibiting defects and inserts in the carbon layer, leading to the blockage of pores, which leads to the reduction of the surface area of KPC. These phenomena are consistent with the results observed by SEM and TEM-EDS. The pore sizes of the two samples were mainly concentrated in the range of 20–40 nm with large pore volumes, which is consistent with the results of N2 adsorption–desorption isotherm analysis. KPC and UKC exhibited significant capillary coalescence and hysteresis loops in the medium pressure 0.3 < P/P0 < 0.8 and high-pressure P/P0 > 0.9 ranges, strongly confirming that CaCl2 activates the carbon materials to build mesopores. Comparing the adsorption isotherms of these two samples, the samples KPC and UKC have similar adsorption capacities at low relative pressures, implying the presence of more micropores in these two materials. The above test results of these two samples further confirm that CaCl 2 is a very effective activation reagent for the preparation of multistage pore carbon materials in this experimental system, which can be influential for pore formation, especially mesopores and macropores. Therefore, it can be used as a green and novel porogenic agent.
| Parameter | Unit | RS | KPC | UKC | US |
|---|---|---|---|---|---|
| a Note: “—” represents ND. | |||||
| C | % | 3.12 | 57.28 | 60.29 | 56.82 |
| H | % | 5.04 | 1.38 | 1.32 | 1.44 |
| N | % | 2.32 | 2.27 | 3.09 | 2.14 |
| S | % | 1.23 | 0.13 | 0.10 | 2.81 |
| BET surface area | m2 g−1 | — | 254.675 | 305.8638 | — |
| Pore volume | cm2 g−1 | — | 0.281646 | 0.261817 | — |
| Average pore diameter | Nm | — | 44.236 | 34.240 | — |
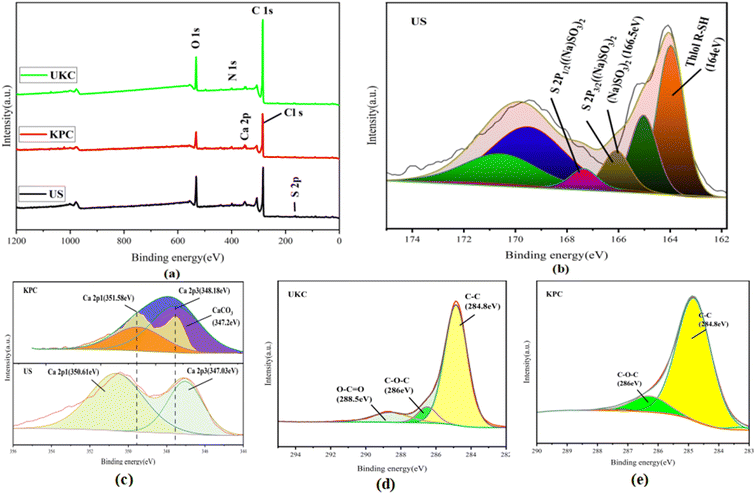
Based on comparison with UKC, Ca2+ was successfully loaded on the surface of KPC (Fig. 6a), which follows the analysis results of SEM/TEMEDS. The modified kelp showed a decrease in the proportion of C elements and an increase in the proportion of O elements on its surface, possibly due to the loading of calcium oxides on the KPC surface. The weak peak found at 162.79 eV (Fig. 6b) was assigned to the S 2p spectrum, which confirms the adsorption of SO42− on the KPC surface. Fig. 6c shows the Ca 2p orbital energy spectra of KPC, and three peaks were obtained after peak splitting, corresponding to Ca 2p1, Ca 2p3, and Ca CO3 electron orbitals, respectively. 0.97 eV and 1.15 eV, which are due to the loss of Ca electron density due to the binding of KPC with SO42−, in turn change the binding energy of Ca 2p1 and Ca 2p3. The elemental carbon content in the UKC sample reached 80.84%, indicating the high yield of porous carbon in kelp. Fig. 6a shows the characteristic peaks of C 1s, O 1s, N 1s, Ca 2p, and S 2p of the samples. The stronger peaks of C 1s and N 1s appear at 284.96 eV and 400.25 eV, respectively, and the weaker peak of O 1s appears at 532.41 eV. The results of the C1s splitting fit (Fig. 6d and e) show the results of the C 1s splitting for the three samples, where the signal peak at 284.8 eV corresponds to the C–C bond, the signal peak at 286 eV corresponds to the C–O–C bond, and the signal peak at 288.5 eV corresponds to the O–C![[double bond, length as m-dash]](https://www.rsc.org/images/entities/char_e001.gif) O bond. The signal peak at 532.5 eV corresponds to an alcohol, phenol, fatty ether, or another hydroxyl-containing compound (COH).39 These abundant functional groups can improve some properties of the material and increase the activity of KPC. The results of N elemental analysis of the KPC sample are shown in Table 5 above, with 2.27% for elemental analysis and 2.91% for XPS analysis. Such a high nitrogen content indicates that the one-step activation of CaCl2 for heteroatom doping of kelp is simple and effective. This result is consistent with preparing a nitrogen-doped carbon material with an interpenetrating network structure by one-step activation of CaCl2, as reported by Yang et al.32
O bond. The signal peak at 532.5 eV corresponds to an alcohol, phenol, fatty ether, or another hydroxyl-containing compound (COH).39 These abundant functional groups can improve some properties of the material and increase the activity of KPC. The results of N elemental analysis of the KPC sample are shown in Table 5 above, with 2.27% for elemental analysis and 2.91% for XPS analysis. Such a high nitrogen content indicates that the one-step activation of CaCl2 for heteroatom doping of kelp is simple and effective. This result is consistent with preparing a nitrogen-doped carbon material with an interpenetrating network structure by one-step activation of CaCl2, as reported by Yang et al.32
| Biochar UKC | Atomic (%) | ||||
|---|---|---|---|---|---|
| C | O | Ca | S | N | |
| 80.84 | 13.98 | 0.07 | 0.98 | 1.60 | |
| KPC | 60.56 | 11.76 | 2.16 | 1.28 | 2.91 |
| US | 68.33 | 20.36 | 2.70 | 1.59 | 4.01 |
3.2 Batch experiments
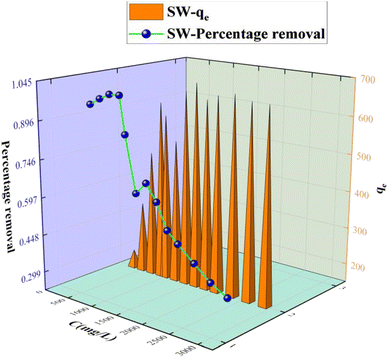
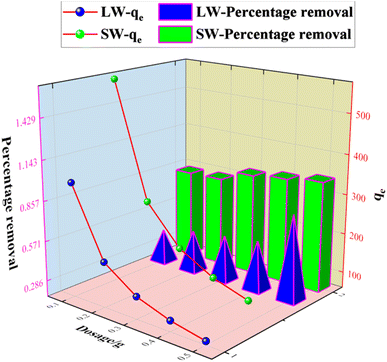
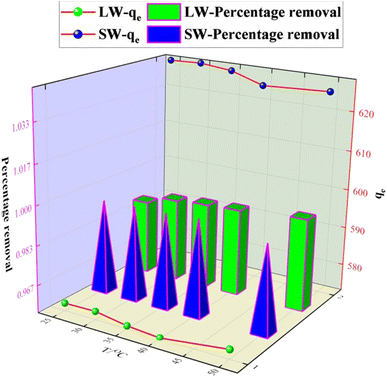
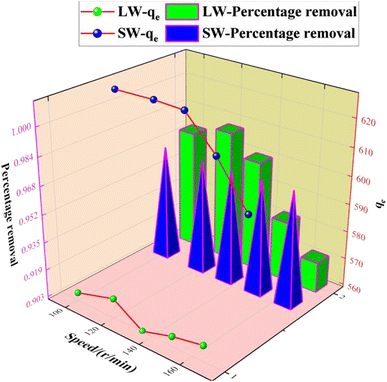
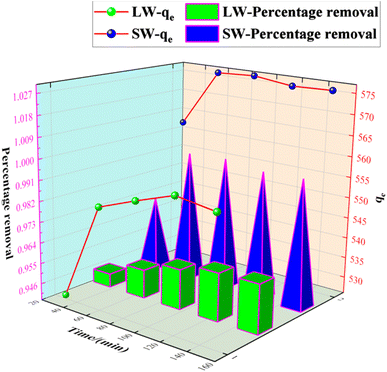
The experimental results of adsorption of SO42− in simulated water (SW) and lake water (LW). The adsorption experiment employed a variable-controlling approach to explore the factors that influenced the adsorption process, including pH, temperature, adsorbent dosage, and contact time.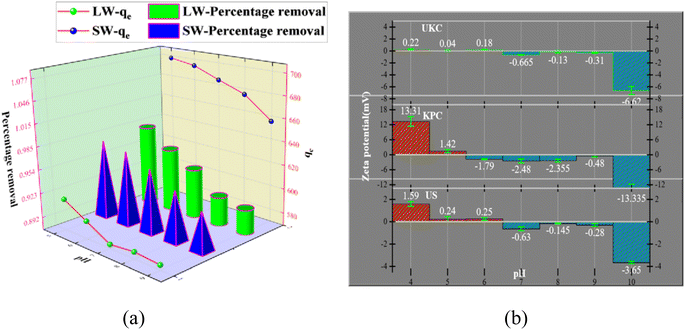 | ||
| Fig. 7 Effect of pH on SO42− adsorption and effect of pH (a) on the zeta potential of UKC, KPC, and US (b). | ||
The relevant literature shows that when pH < pHPZC, the charged surface is positively charged; when pH > pHPZC, the charged surface is negatively charged5 (Fig. 7b). So the reason is analyzed as follows: under acidic conditions, protonation makes the adsorbent surface positively charged, and the reaction follows CaCl2 + H2O + SO42− → CaSO4 + Cl− + OH−; thus electrostatic gravitational force and ion exchange make the sulfate ion adsorbed on the adsorbent surface while the solution is alkaline. In addition, the presence of a large number of hydroxide ions (OH−) in the solution at higher pH values, where OH− and SO42− compete together for the active adsorption sites on the KPC surface, also leads to a decrease in the adsorption capacity of KPC, which precisely explains the rapid decrease in SO42− adsorption with increasing pH.
As can be seen from Fig. 12, the adsorption rate of the adsorbent on sulfate increased rapidly in the first 90 min, and the rate of increase slowed down from 90 min to 150 min, and the adsorption amount and capacity remained the same after 90 min with further increase in time. This result is because, in the beginning, there are many adsorption sites on the KPC adsorbent, and the free sulfate ions can be adsorbed on the adsorbent quickly.34 However, with the increased adsorption time, the adsorption gradually reached equilibrium, possibly due to the saturation of SO42− adsorption after diffusion inside the particles.2 Therefore, 90 min can be selected as the adsorption equilibrium time, and the adsorption amount reached 557.88 mg g−1.
3.3 Equilibrium adsorption isotherms
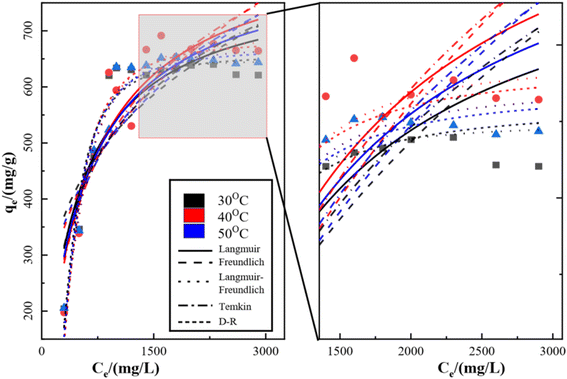
The isothermal adsorption model of SO42− on KPC was fitted using Langmuir, Freundlich, Langmuir–Freundlich, Temkin, and Dubinin–Radushkevich (D–R) equations, and the fitted curves and parameters are shown in Fig. 13, Table 6 respectively. From the above data results, it can be seen that the fitting effect of KPC isothermal adsorption is Langmuir–Freundlich equation > Langmuir equation > Freundlich equation > D–R equation > Temkin equation. Meanwhile, the correlation coefficient of the Langmuir model (R2 = 0.8696), compared to that of other adsorption models, shows that the KPC adsorption process is more inclined to Langmuir linear fit, indicating that the SO42−adsorption process by KPC is dominated by homogeneous adsorption of monomolecular layers and the presence of chemisorption. This result is consistent with reported studies on sulfate adsorption in zirconium oxide-modified biochar.| Temperature (K) | Langmuir equation | Freundlich equation | |||||
|---|---|---|---|---|---|---|---|
| q m (mg g−1) | K L (L mg−1) | R 2 | K F (L mg−1) | 1/n | R 2 | ||
| Non-linear | 303.15 | 793.95 | 0.00215 | 0.8118 | 71.38 | 0.29 | 0.6436 |
| 313.15 | 866.98 | 0.00169 | 0.8623 | 65.31 | 0.30 | 0.6807 | |
| 323.15 | 831.20 | 0.00186 | 0.8696 | 57.96 | 0.32 | 0.7241 | |
| T (K) | Langmuir–Freundlich equation | ||||
|---|---|---|---|---|---|
| q m (mg g−1) | KL-F (L mg−1) | R 2 | n | ||
| Non-linear | 303.15 | 647.75 | 4.37 | 0.9567 | 2.79 |
| 313.15 | 688.48 | 5.90 | 0.9424 | 2.33 | |
| 323.15 | 670.21 | 3.96 | 0.9691 | 2.40 | |
| T (K) | Temkin equation | D–R equation | ||||||
|---|---|---|---|---|---|---|---|---|
| a | b | R 2 | q m (mg g−1) | β | R 2 | E | ||
| Non-linear | 303.15 | −681.45 | 174.69 | 0.7278 | 655.77 | — | 0.9398 | 5.13 |
| 313.15 | −875.88 | 203.57 | 0.8182 | 680.76 | 0.021 | 0.9269 | 4.88 | |
| 323.15 | −789.37 | 190.30 | 0.8086 | 665.98 | 0.018 | 0.9513 | 5.27 | |
The theoretical maximum adsorption of KPC at 303.15 K, 313.15 K, and 323.15 K were 793.95 mg g−1, 866.98 mg g−1, and 831.20 mg g−1, respectively, as calculated by using the Langmuir equation, and compared with the experimentally derived 639.44 mg g−1, 691.39 mg g−1, and 647.44 mg g−1 from Table 6. At 303.15 K, the KPC adsorption process of SO42− was more consistent with the Langmuir fitting model. From Table 6, it can be seen that the RL value decreases with increasing initial concentration from eqn (5), and the RL value of the equilibrium constant is between 0 and 1, indicating that adsorption between the adsorbent and the adsorbate is easy. Furthermore, the average free energy of adsorption E for KPC at different temperatures is 5.13 kJ mol−1, 4.88 kJ mol−1, and 5.27 kJ mol−1, respectively, and therefore, is less than 8 kJ mol−1. This result means that the adsorption of SO42− from the solution by KPC is physical adsorption.
3.4 Adsorption kinetic study
The kinetic curves and fitted parameters of SO42− adsorption on lake water and simulated water are shown in Fig. 14 and Table 7, respectively. The amount of SO42− adsorbed by KPC on simulated water is shown. It is evident from the dotted line plot in Fig. 14 that the points of the pseudo-secondary dynamics are basically on the line, indicating that the pseudo-secondary dynamics are relatively well-fitted. From the fitted kinetic data in Table 7, it can be seen that the pseudo-secondary kinetic R2 values are significantly higher than the pseudo-first-order fitted values, which further indicates that the pseudo-secondary kinetic fits are better. Some similar studies were carried out by Gao et al.40, using sugarcane core cellulose-based sorbents to remove SO42− in water, which followed a pseudo-secondary kinetic model. Also, by comparing R2 it can be seen that the fitting effect is Pseudo-second order kinetics > Pseudo-first order kinetics > Elovich. In contrast, KPC reached equilibrium at about 180 min for SO42− adsorption in lake water and the adsorption data fit well with the quasi-secondary kinetic model. The theoretical adsorption amount obtained from the quasi-secondary kinetic regression equation is also very close to the experimentally measured adsorption amount, mainly chemisorption. This kinetic model is generally only suitable for describing the kinetic process at the initial adsorption stage. However, it cannot accurately describe the entire process of adsorption, so the SO42− adsorption by KPC is consistent with the quasi-secondary kinetic model.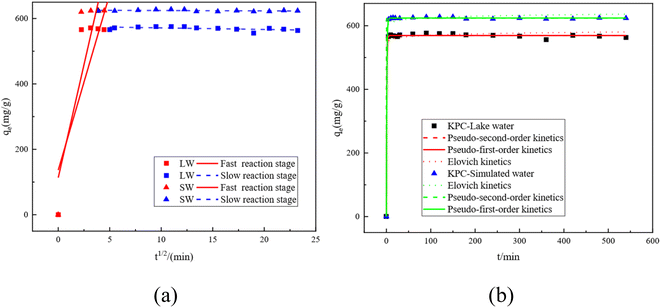 | ||
| Fig. 14 Fitting curves for the intraparticle diffusion equation of SO42−by KPC (a) and kinetic fitting curves (b). | ||
| Parameter | Kinetics | Kinetics | Fast reaction stage | Slow reaction stage | ||
|---|---|---|---|---|---|---|
| S W | Parameter 1 | q e = 624.10 mg g−1 | q e = 624.39 mg g−1 | a = 0.14 | C = 113.50 | C = 625.54 |
| Parameter 2 | K 1 = 1.0032 h−1 | K 2 = 0.06 g (mg h)−1 | — | K 3 = 138, 22 mg (g h1/2)−1 | K 3 = −0.11 mg (g h1/2)−1 | |
| R 2 | 0.99979 | 0.9998 | 0.9951 | 0.7837 | 0.0808 | |
| L W | Parameter 1 | q e = 569.23 mg g−1 | q e = 569.37 mg g−1 | a = 0.16 | C = 136.68 | C = 576.14 |
| Parameter 2 | K 1 = 1.06 h−1 | K 2 = 0.10 g (mg h)−1 | — | K 3 = 107.63 mg (g h1/2)−1 | K 3 = −0.48 mg (g h1/2)−1 | |
| R 2 | 0.9986 | 0.9987 | 0.9951 | 0.7099 | 0.2063 | |
Although the adsorption of SO42− in both simulated water and lake water is consistent with the pseudo-first order kinetics, the control step of the reaction rate remains unclear. Nevertheless, our data indicate that the solute diffusion process may control the sulfate adsorption from the surface of the particles to the interior of the particles in solution or by the solute diffusion process from the solution to the surface of the particles.41 To determine the actual control steps of the reaction, the experimental data were fitted with the intraparticle diffusion model, and the results are shown in Fig. 14b and Table 7, respectively.
The intra-particle diffusion model can reflect the adsorption mechanism in depth. Fig. 14a shows the kinetic intra-particle diffusion model of sulfate adsorption by KPC. The data show that the whole variation of SO42− adsorption by KPC on simulated water can be divided into two linear parts, indicating that the adsorption is divided into two steps.42,43 The first stage (t1/2 < 5.5) is the diffusion of sulfate from the solution phase to the outer surface of the adsorbent, which is a fast adsorption stage and, therefore, a rate control stage. The second stage is the equilibrium stage of sulfate adsorption.
The slope of the SO42− adsorption process in simulated water is the largest at t1/2 < 5, which indicates that the boundary diffusion process is fast and belongs to the fast reaction stage, where the intermolecular interaction forces are mainly electrostatic attraction, dispersion, and hydrogen bonding forces. These forces can make the reaction complete in a very short time. Then, the reaction enters the slow stage, mainly due to the decrease of SO42 concentration in the solution and the decrease of surface adsorption sites, leading to the decrease of the reaction rate in this stage.44,45 From the intraparticle diffusion model, if the line passes through the origin, then intraparticle diffusion is the only control step of the rate; if the line does not pass through the origin, then intraparticle diffusion is not the only control step. However, other processes combined with intraparticle diffusion can be responsible for controlling adsorption. Fig. 14a and Table 7 show that the straight line does not pass through the origin, so the adsorption rate of SO42− on lake water and simulated water may be controlled by both intraparticle diffusion and surface adsorption.
3.5 Thermodynamic study
The values of b can be obtained from the Langmuir constants KL and Qm obtained at different temperatures of 30 °C, 40 °C, and 50 °C. Then we find ΔG0 based on the linear relationship between nb and ΔG0, ΔH0 and ΔS0. These thermodynamic parameters can be obtained by fitting the linear relationship between ln![[thin space (1/6-em)]](https://www.rsc.org/images/entities/char_2009.gif) b and T−1. The results are listed in Table 8.
b and T−1. The results are listed in Table 8.
| T (K) | b | ΔG0 (kJ mol−1) | ΔH0 (kJ mol−1) | ΔS0(kJ (mol−1 K−1)) |
|---|---|---|---|---|
| 303.15 | 1.71 | −14.40 | 6.47 | 0.03 |
| 313.15 | 1.47 | −16.76 | 6.47 | 0.03 |
| 323.15 | 1.55 | −19.26 | 6.47 | 0.03 |
From the above data, it is clear that the enthalpy change ΔH0 > 0 is positive, indicating that the adsorption of SO42− by KPC is a heat absorption process. The ΔG0 of the adsorption reaction was negative in the temperature range of 303.15 K–323.15 K. Also, the value appeared to decrease with increasing temperature, indicating that the reaction proceeded spontaneously, which is consistent with the results of previous studies.46 The Gibbs free energy change ΔG0 between −20 and 0 kJ mol−1 is generally considered physical adsorption, and between −800 and 400 kJ mol−1 as chemisorption. However, from the adsorption mechanism, the whole system will be exothermic if the physical adsorption is a single adsorption process. The results indicate that physical adsorption is not the only adsorption mechanism in the adsorption process of SO42− by KPC, and there may be other adsorption mechanisms, such as ion exchange. All of them are negative, and the absolute values of ΔG0 increase with the increase in temperature, indicating that SO42− tends to be adsorbed from the solution to the surface of the adsorbent, and this process is spontaneous.47 ΔS0 is positive, and the disorder in the system increases, indicating that entropic push is the driving force for SO42− adsorption by KPC, and the disorder at the solid–liquid interface increases during adsorption.
3.6 Comparison of adsorption capacities
The adsorption capacities of several materials for sulfate ions are shown in Table 9. The SO42− adsorption capacity by KPC is better than that of any other materials. In addition, this biomass carbon material requires a shorter time to achieve effective sulfate removal.48 Therefore, KPC has the potential to be an efficient adsorbent for SO42− removal.| Raw materials | Maximum adsorption (mg g−1) | Reference |
|---|---|---|
| Coconut shell | 4.90 | 38 |
| Oxide-modified pomelo peel biochar (ZrBC) | 35.21 | 5 |
| PVP-AlNiMn nanocomposite | 65.36 | 39 |
| Fe-modified carbon residue (MCR) | 19.50 | 40 |
| Activated carbon prepared from a Ziziphus Spina-Christi lotus leaf | 9.30 | 41 |
| Aluminosilicate modified with uric acid (AA-US) | 11.00 | 42 |
| Ca-doped unmodified chitosan pellets | 46.60 | 43 |
| Barium geo-polymerized blast furnace slag (Ba–BFS-GP) | 16.40 | 44 |
| Pristine & polypyrrole modified UC | 44.70 | 45 |
| Polypyrrole-grafted granular activated carbon | 39.06 | 45 |
| Mg–Fe–CLDHs | 111.50 | 34 |
| Bagasse pith cellulose-based adsorbents (CC/QAC1:1) | 500.00 | 37 |
| KPC | 866.98 | Current study |
4 Conclusion
In this study, a new biological carbon material KPC was prepared by the chemical activation method with spent kelp as the raw material and calcium chloride as the activator, and it was used to remove sulfate ions from natural sulfate-rich water and simulated water. The results show that a part of the calcium functional group is loaded in carbon, and a part exists on the surface of KPC in the form of calcium ions. Through the study on the influence of the initial concentration of SO42−, pH, amount of adsorbent and contact time on the adsorption capacity of SO42− in a simulated water body and lake, the simulated water is more consistent with the Langmuir isothermal equation. The maximum adsorption capacity qmax was 866.98 mg g−1. The kinetic studies also show that the simulation and the lake adsorption process conform to the quasi–quadratic reaction model. In addition, the adsorbent also has a high specific surface area and total pore volume, and contains many effective functional groups, which also indicates that KPC has the potential to efficiently remove sulfate ions in wastewater pretreatment. Therefore, the adsorbents prepared based on natural wastes are expected to be used in other fields of wastewater treatment.Author contributions
Designed and performed the experiments and data analysis: Bingbing Tian. Revised the manuscript: Min Li; Jianjiang Lu; Yanbin Tong. Contributed data analysis and other support: Yalong Song; Rubin Wang; Tianyang Wang; Jinhui Chu; Zhu Qiao and Yi Wang. All authors have read and agreed to the published version of the manuscript.Conflicts of interest
There are no conflicts to declare.Acknowledgements
This work was supported by study of the effect of bifunctional surfactants on the structure and photocatalytic activity of BiVO4 (ZZZC202103).References
- E.-T. Tolonen, T. Hu, J. Ramo and U. Lassi, J. Environ. Manage., 2016, 181, 856–862 CrossRef CAS PubMed.
- Q. Li, Y. Li, X. Ma, Q. Du, K. Sui, D. Wang, C. Wang, H. Li and Y. Xia, Chem. Eng. J., 2017, 316, 623–630 CrossRef CAS.
- M. Li, C. Dai, B. Yang, Y. Qiao and Z. Zhu, J. Mater. Eng. Perform., 2017, 26, 764–772 CrossRef CAS.
- K. K. Kefeni, T. A. M. Msagati and B. B. Mamba, J. Clean. Prod., 2017, 151, 475–493 CrossRef CAS.
- H. Ao, W. Cao, Y. Hong, J. Wu and L. Wei, Sci. Total Environ., 2020, 708 Search PubMed.
- I. Kabdasli, A. Bilgin and O. Tunay, Environ. Technol., 2016, 37, 446–451 CrossRef CAS PubMed.
- V. K. Gupta, I. Ali, T. A. Saleh, A. Nayak and S. Agarwal, Rsc Adv., 2012, 2, 6380–6388 RSC.
- S. Hong, F. S. Cannon, P. Hou, T. Byrne and C. Nieto-Delgado, Carbon, 2014, 73, 51–60 CrossRef CAS.
- Q. Xu, W. Li, L. Ma, D. Cao, G. Owens and Z. Chen, Sci. Total Environ., 2020, 703 Search PubMed.
- S. Praveen, J. Jegan, T. B. Pushpa, R. Gokulan and L. Bulgariu, Biochar, 2022, 4 Search PubMed.
- T. Ennaert, J. Van Aelst, J. Dijkmans, R. De Clercq, W. Schutyser, M. Dusselier, D. Verboekend and B. F. Sels, Chem. Soc. Rev., 2016, 45, 584–611 RSC.
- A. Bhatnagar, M. Sillanpaa and A. Witek-Krowiak, Chem. Eng. J., 2015, 270, 244–271 CrossRef CAS.
- G. Ohemeng-Boahen, D. D. Sewu and S. H. Woo, Environ. Sci. Pollut. Res., 2019, 26, 33030–33042 CrossRef CAS PubMed.
- J. Yuan, Y. Zhu, J. Wang, Z. Liu, J. Wu, T. Zhang, P. Li and F. Qiu, J. Iran. Chem. Soc., 2022, 19, 435–445 CrossRef CAS.
- D. D. Sewu, P. Boakye, H. Jung and S. H. Woo, Bioresour. Technol., 2017, 244, 1142–1149 CrossRef CAS PubMed.
- H. Li, X. Ye, Z. Geng, H. Zhou, X. Guo, Y. Zhang, H. Zhao and G. Wang, J. Hazard. Mater., 2016, 304, 40–48 CrossRef CAS PubMed.
- G. Zhong, H. Xie, Z. Xu, S. Xu, S. Xu, Z. Cai, X. Fu, W. Liao and R. Miao, Chemistryselect, 2019, 4, 3432–3439 CrossRef CAS.
- S. Bai, T. Wang, Z. Tian, K. Cao and J. Li, Sci. Rep., 2020, 10 Search PubMed.
- N. Popa and M. Visa, Adv. Powder Technol., 2017, 28, 1866–1876 CrossRef CAS.
- P. Pengthamkeerati, T. Satapanajaru, N. Chatsatapattayakul, P. Chairattanamanokorn and N. Sananwai, Desalination, 2010, 261, 34–40 CrossRef CAS.
- P. K. Malik, Dyes Pigm., 2003, 56, 239–249 CrossRef CAS.
- M. M. Abd El- Latif and A. M. Ibrahim, Desalin. Water Treat., 2009 DOI:10.5004/dwt.2009.501.
- M. T. Yagub, T. K. Sen and H. M. Ang, Water Air Soil Pollut., 2012, 223, 5267–5282 CrossRef CAS.
- S. Li, J. Lyons-Hart, J. Banyasz and K. Shafer, Fuel, 2001, 80, 1809–1817 CrossRef CAS.
- S. Taghavi, O. Norouzi, A. Tavasoli, F. Di Maria, M. Signoretto, F. Menegazzo and A. Di Michele, Int. J. Hydrogen Energy, 2018, 43, 19918–19929 CrossRef CAS.
- Y. Zhou, L. Cai, J. Guo, Y. Wang, L. Ji and W. Song, Appl. Ecol. Environ. Res., 2018, 16, 5837–5847 CrossRef.
- Y. Wu, Z. Chen, Y. Liu, Y. Xu and Z. Liu, Fuel, 2018, 233, 574–581 CrossRef CAS.
- K. M. Kwon, I. G. Kim, K.-Y. Lee, H. Kim, M. S. Kim, W. I. Cho, J. Choi and I. W. Nah, J. Ind. Eng. Chem., 2019, 69, 39–47 CrossRef CAS.
- A. R. Lucaci, D. Bulgariu, M.-C. Popescu and L. Bulgariu, Water, 2020, 12 Search PubMed.
- E.-B. Son, K.-M. Poo, J.-S. Chang and K.-J. Chae, Sci. Total Environ., 2018, 615, 161–168 CrossRef CAS PubMed.
- X. Yao, L. Ji, J. Guo, S. Ge, W. Lu, Y. Chen, L. Cai, Y. Wang and W. Song, Bioresour. Technol., 2020, 318 Search PubMed.
- X. Yang, T. Kameda, Y. Saito, S. Kumagai and T. Yoshioka, Inorg. Chem. Commun., 2021, 132 Search PubMed.
- Y. Jiang, R. Huang, S. Jiang, Z. Qin and X. Yan, Int. J. Phytoremediation, 2018, 20, 378–383 CrossRef CAS PubMed.
- Z. Kowalczyk, J. Sentek, S. Jodzis, M. Muhler and O. Hinrichsen, J. Catal., 1997, 169, 407–414 CrossRef CAS.
- J. Liu, Y. Deng, X. Li and L. Wang, ACS Sustainable Chem. Eng., 2016, 4, 177–187 CrossRef CAS.
- A. D. S. V. D. Almeida, W. T. Vieira, M. D. Bispo, S. F. de Melo, T. L. da Silva, T. L. Balliano, M. G. Adeodato Vieira and J. I. Soletti, J. Environ. Chem., 2021, 9, 104891 CrossRef.
- J. Liu, X. Yue, Y. Yu and Y. Guo, Desalin. Water Treat., 2015, 56, 274–283 CrossRef CAS.
- K.-M. Poo, E.-B. Son, J.-S. Chan, X. Ren, Y.-J. Choi and K.-J. Chae, J. Environ. Manage., 2018, 206, 364–372 CrossRef CAS PubMed.
- S. Qu, J. Wan, C. Dai, T. Jin and F. Ma, J. Alloys Compd., 2018, 751, 107–116 CrossRef CAS.
- X. Gao, H. Zhang, K. Chen, J. Zhou and Q. Liu, Cellulose, 2018, 25, 2531–2545 CrossRef CAS.
- C. Natnasivayam and D. Sangeetha, Desalination, 2008, 219, 1–13 CrossRef.
- W. Xin, Y. Song, J. Peng, R. Liu and L. Han, ACS Sustainable Chem. Eng., 2017, 5, 2312–2319 CrossRef CAS.
- P. Kinnunen, H. Kyllonen, T. Kaartinen, J. Makinen, J. Heikkinen and V. Miettinen, Water Sci. Technol., 2018, 194–205, DOI:10.2166/wst.2018.102.
- M. Rahmati, G. Yeganeh and H. Esmaeili, Acta Chim. Slov., 2019, 66, 888–898 CrossRef CAS.
- A. V. Voronina, M. O. Bajtimirova and V. S. Semenishchev, J. Radioanal. Nucl. Chem., 2022, 331, 913–920 CrossRef CAS.
- M. Solgi, L. G. Tabil and L. D. Wilson, Materials, 2020, 13 Search PubMed.
- K. Zuo, J. Kim, A. Jain, T. Wang, R. Verduzco, M. Long and Q. Li, Environ. Sci. Technol., 2018, 52, 9486–9494 CrossRef CAS PubMed.
- S. Hong, F. S. Cannon, P. Hou, T. Byrne and C. Nieto-Delgado, Chemosphere, 2017, 184, 429–437 CrossRef CAS PubMed.
Footnote |
| † Electronic supplementary information (ESI) available. See DOI: https://doi.org/10.1039/d2su00136e |
| This journal is © The Royal Society of Chemistry 2023 |

