
 Open Access Article
 This Open Access Article is licensed under a
 Creative Commons Attribution 3.0 Unported Licence
Thickness dependence of telephone cord blister formation in solvent swollen films of polydimethylsiloxane†
James S.
Sharp
 * and
Nathaniel M.
Roberts
* and
Nathaniel M.
Roberts
School of Physics and Astronomy, University of Nottingham, University Park, Nottingham, NG7 2RD, UK. E-mail: james.sharp@nottingham.ac.uk; Tel: +44 (0)115 9515142
First published on 2nd October 2023
Abstract
The thickness dependence of telephone cord blister formation in thin films of solvent swollen polydimethylsiloxane (PDMS) was studied using a simple imaging setup. Chloroform was deposited on top of PDMS that had been spin coated on to glass slides coated with a thin wax layer. After an initial thickness dependent nucleation time, straight-sided blisters were observed to form on the films. These later developed into sinusoidal telephone cord blisters. Movies of the growing telephone cord blisters were recorded at 200 fps for PDMS films with thickness values in the range 38 < h ≤ 223 μm. Software written in Python was used to analyse the movies and to extract the thickness dependence of the width of the telephone cord blisters as well as the wavelength of the sinusoidal corrugations and the blister growth rates. Data were interpreted in the context of theories of buckling and dynamic fracture mechanics.
1 Introduction
The failure of coatings is a key challenge in the design and manufacture of thin film structures and devices. In particular, the build-up of stresses in thin films as a result of deposition processes1 or due to a mismatch in physical and/or chemical properties (e.g. thermal contraction,1 differential response to swelling solvent2–5) can lead to adhesive debonding or delamination. The subsequent failure of coatings is often driven by a buckling instability that causes the layers to deflect away from the supporting substrate. This occurs in cases where the in-plane strain energy (generated by e.g. thermal or solvent induced stresses) exceeds both the work of adhesion and the energy required to bend the film. While it is occasionally desirable to exploit the underlying physics to promote buckle formation and pattern a surface with periodic structures,6 more often than not the main objective is to produce flat, adhesively bonded layers with no defects.Telephone cord blisters represent an intrinsically interesting mode of film failure and a number of studies of the formation of these one-dimensional sinusoidal blisters have been performed.1,2,5,7–14 The onset of telephone cord blister formation is caused by the release of excess in-plane strain energy in the swollen films by buckling in one-dimension to form a straight-sided linear blister.7–9 This mode of buckling (referred to hereafter as primary buckling) relieves stress in the film in the direction perpendicular to the primary buckle. However, in the case where large biaxial in-plane strains are applied to the films, a significant component of stress remains un-relaxed in the direction parallel to the blister. These un-relaxed stresses can drive further (secondary) buckling, or wrinkling of the blistered film to create the sinusoidal structures that are characteristic of telephone cord blistering.7–9 The mechanisms associated with formation of telephone cord blisters have been discussed by numerous authors and the physics underlying the formation of the sinusoidal structures and their characteristic dimensions is well-developed.10,11
Solvent induced telephone cord blisters have received a considerable amount of interest.2,4,5 The volume changes that are generated by solvents during the swelling of polymers can be significant, with increases in linear dimensions that range up to 40–50% of the unswollen sample dimensions.15 As a result, solvent swelling is capable of producing the large biaxial stresses that generate telephone cord blisters when these films are confined. In particular, the work of Velankar and coworkers have recently considered the effects of solvent induced swelling on the formation of telephone cord blisters using a range of different solvents and substrate combinations.2,4
Few studies have measured and interpreted the effects of changing the sample thickness on parameters such as the width, wavelength and rate of elongation (growth rate) associated with the blisters. Notable exceptions include the work of Sun et al.9 and Xue et al.3 who performed measurements of the thickness dependence of the width of telephone cord and straight sided blisters in thermally deposited silicon nitride and titanium films respectively. However, no attempts were made by these authors to explain the observed thickness dependence. Yuan and coworkers5 also characterised ratios of the width and wavelength to the amplitude of blister formation via their thickness dependent Ω parameter. However, extracting the individual thickness dependence of these quantities from their data is not trivial. To the best of our knowledge, the thickness dependence of the growth rate of telephone cord blisters has not been studied either experimentally or theoretically.
In the present work, we describe an experimental study of the thickness dependence of telephone cord blister formation in solvent swollen thin films of PDMS that are supported on glass microscope slides. Swelling of the PDMS in chloroform, coupled with confinement of the films by the substrate, results in the generation of large in-plane stresses that drives blister formation. The use of a partially soluble, wax release layer lowers the work of adhesion between the PDMS and the glass and results in the formation of multiple telephone cord blisters on each sample. This allows for reliable measurements of key parameters such as the width, wavelength and blister growth rates to be obtained. Simple analyses based upon previously developed theories of buckling and dynamic fracture mechanics are shown to agree quantitatively with the data presented.
2 Experimental
2.1 Sample preparation
Films of a cross-linked polydimethylsiloxane elastomer (PDMS, Sylgard 184, Dow Corning) were prepared on Carnauba wax (Sigma Aldrich, Gillingham, UK) coated glass microscope slides by spin coating. Prior to deposition of the wax and PDMS, the glass slides were cleaned by sonication in a surfactant solution (2% Decon Neutracon), then deionised water and finally acetone (HPLC grade, Sigma Aldrich) for 15 minutes each. Following sonication, the slides were removed and dried using clean lens tissues. Carnauba wax was dissolved in chloroform (HPLC grade, Sigma Aldrich) at a concentration of 1 wt% by heating to 50 °C. The resulting solution was allowed to cool to room temperature and was immediately spin coated on to the clean glass slides at a speed of 3000 rpm using a home-built spin coater. This resulted in the formation of a uniform wax layer on the glass slides that was 8 ± 1 μm thick (as determined by weighing). Sylgard 184 was then mixed in a 10![[thin space (1/6-em)]](https://www.rsc.org/images/entities/char_2009.gif) :1 ratio of resin:crosslinker, allowed to de-gas at room temperature (typically 30 minutes) and then spin coated at a range of spin speeds between 1000 rpm and 5000 rpm. This created PDMS films with thickness values in the range 38 < h < 223 μm. All samples were annealed in air at 110 °C for 15 hours to perform cross-linking of the PDMS before being allowed to cool to room temperature.
:1 ratio of resin:crosslinker, allowed to de-gas at room temperature (typically 30 minutes) and then spin coated at a range of spin speeds between 1000 rpm and 5000 rpm. This created PDMS films with thickness values in the range 38 < h < 223 μm. All samples were annealed in air at 110 °C for 15 hours to perform cross-linking of the PDMS before being allowed to cool to room temperature.
2.2 Sample imaging and data analysis
The PDMS coated glass samples were placed inside a Petri dish and illuminated from below using a 400 mW collimated white light LED (Thor Labs, MCWHL5-C1, see Fig. 1(a)). The slides were quickly coated with a layer of chloroform using a glass pipette and the samples imaged from above using a Basler acA800-510uc camera and a UC series lens (Edmund Optics, UK) with a focal length of 25 mm. All measurements were performed at 20 °C. | ||
| Fig. 1 Experimental setup. Panel (a) shows a schematic diagram of the experiment. A PDMS coated glass slide is immersed in chloroform and imaged from above at 200 fps using a camera. Panel (b) shows examples of optical images of the large-slope folded structures that are formed during the swelling and delamination of PDMS. Images were collected from an oblique angle above the level of the glass substrate and were obtained by gently wicking solvent away from structures using a lens tissue. The diagram given as an inset shows the shape of the large-slope folded structures that arise during primary buckling. These structures buckle further to produce telephone cord blisters (secondary buckling). Panel (c) shows optical images of a growing telephone cord blister in a 79 ± 1 μm thick PDMS film at different times as viewed from above and while still submerged in chloroform. The scale bar shown in each of these images represents 1 mm. | ||
Movies of the samples were collected at 200 frames per second following the deposition of the chloroform. After a few seconds (dependent upon film thickness) a series of linear structures were observed to nucleate at multiple locations on the surface of the samples and to grow (see ESI,† movie1.avi). Nucleation was observed to occur preferentially near defects in the PDMS films (e.g. dust, scratches). However, as movie1.avi shows, blisters also nucleate in the absence of any observable defects.
In cases where the solvent was wicked away quickly using tissue paper, closer inspection revealed that the films had blistered away from the substrate to form large-slope folded structures similar to those shown in Fig. 1(b). These blisters were found to be straight immediately after their formation, but were observed to buckle to form sinusoidal telephone cord-like structures as they grew, in a manner that is consistent with previous reports of solvent swollen PDMS films.2
Fig. 1(c) shows an example of the growth of one of these telephone cord blisters at different times in its evolution while it is submerged in chloroform. The structures in Fig. 1(b) and (c) may at first appear to be quite different. However, the structures shown in Fig. 1(b) are observed from an oblique angle and at early times, following forced removal of solvent. In contrast, the structures in Fig. 1(c) are more mature, observed from directly above and are still immersed in solvent. In fact, the images taken from above are of the top of the ridge formed by the films during folding (see the diagram in the inset of Fig. 1(b)).
Isolated blisters were observed to grow at a constant speed and this growth speed was found to be thickness dependent. Growth at constant speed continued until neighbouring blisters impinged upon one another-either as a result of two blister crack tips colliding or when a crack tip approached a pre-existing telephone cord blister. These structures continued to grow until the entire surface of the sample was covered in a network of interconnecting telephone cord blisters. At this point in their evolution, lateral growth (widening) of the telephone cord blisters occurred, resulting in the complete delamination of the PDMS films from the glass substrate. This all happened before significant evaporation of the chloroform had taken place.
Movies of blister growth were analysed using custom software written in Python. Briefly, each frame was extracted from the movie, thresholded and analysed to determine the width of the blisters, w, the wavelength of the sinusoidal buckles, λ and the blister growth speed, v. This was done using multiple blisters on each sample (see Fig. 2). The average thickness of the samples was then determined by weighing a circle of known diameter that had been cut from each PDMS film in the same region where the telephone cord blisters had been imaged. These circular sections of film were cut by placing the sample on the turntable of a spincoater and gently scoring the film as it rotated. The resulting circles were then re-swollen in chloroform so that they could be removed from the glass substrate and allowed to de-swell before being weighed on an analytical balance (Fisherbrand, PS-200). The thickness was then calculated assuming a density of 1030 kg m−3 for PDMS.
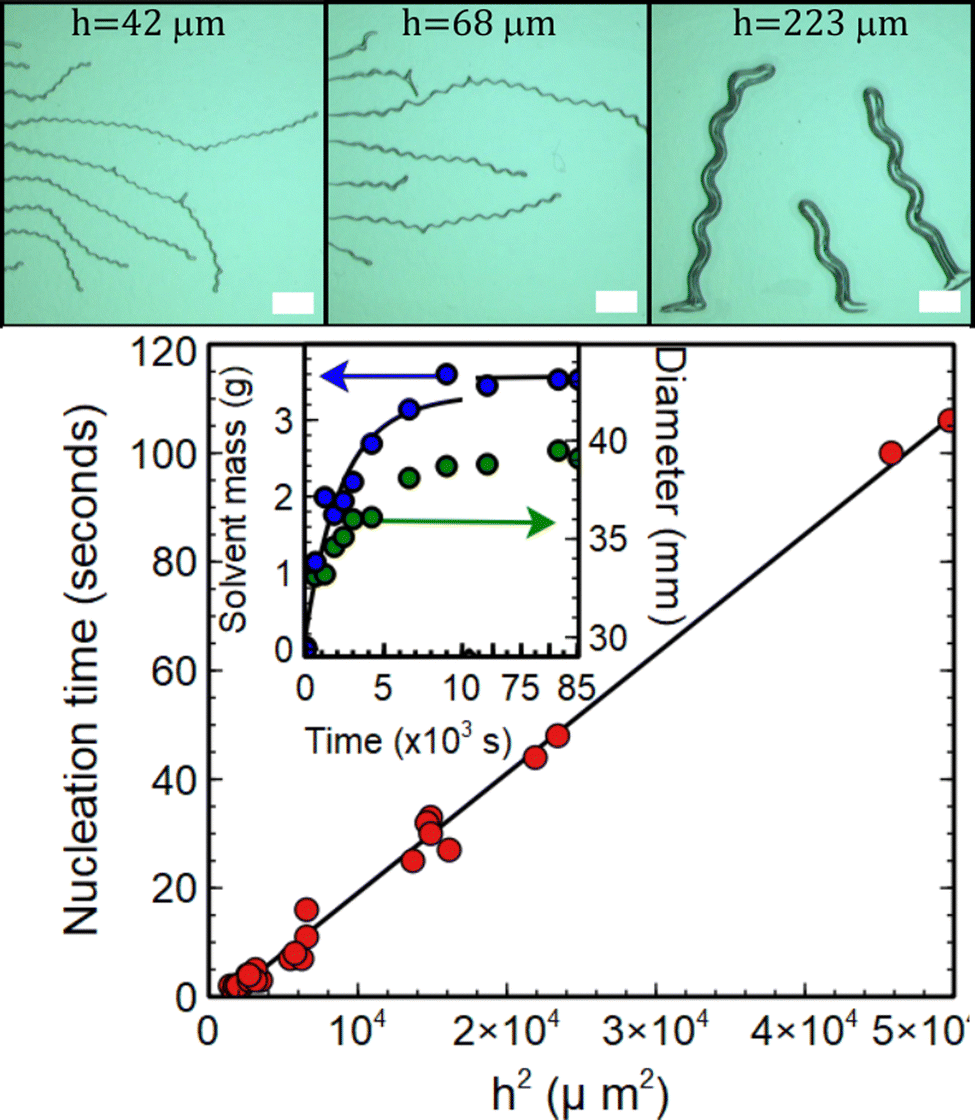 | ||
| Fig. 2 Images showing telephone cord blisters formed on 48 ± 1 μm, 62 ± 1 μm and 223 ± 1 μm thick PDMS films respectively during swelling with chloroform. The scale bar represents 2 mm in each image. The plot shows the time taken for blisters to nucleate on the samples as a function of the square of the unswollen PDMS film thickness, h. The slope of this line gives an estimate for the diffusion coefficient of chloroform in PDMS of (226 ± 5) × 10−12 m2 s−1. The plot given as an inset in the main panel shows the time dependence of the mass uptake, m(t) (blue circles), and diameter (green circles) of a PDMS disk with an initial diameter of 29.5 mm diameter and thickness of 2.5 mm as it swelled in chloroform. The solid line is a fit of the mass uptake data to eqn (1) and gives a value of the diffusion coefficient of chloroform in PDMS of (231 ± 8) × 10−12 m2 s−1. | ||
3 Results and discussion
Delamination of the PDMS reported here occurs as the result of swelling of the substrate confined films. Diffusion of chloroform into the PDMS caused the films to swell, build-up stored elastic energy and drive blister formation. Evidence for the diffusive nature of the onset of blister formation is provided in the main panel of Fig. 2, where the time taken for blisters to nucleate in the films is plotted against the square of the unswollen PDMS film thickness, h. The linear relationship between h2 and nucleation time observed in this figure is indicative of diffusive behaviour. Assuming one dimensional diffusion of solvent through the films, the time taken for the solvent to reach the substrate and cause blisters to nucleate, τnuc, will be related to the film thickness by the formula h2 = 2Dτnuc, where D is the diffusion coefficient. The slope of the plot in Fig. 2 gives a value of the diffusion coefficient of chloroform in PDMS of D = (226 ± 5) × 10−12 m2 s−1. This is consistent with the values obtained for the diffusion of solvents in PDMS.16 Time dependent studies of the swelling of PDMS in chloroform were also used to corroborate the above hypothesis. In this experiment a 29.5 mm diameter, 2.5 mm thick disk of PDMS was immersed in chloroform, removed at regular intervals and its mass, m(t), and linear dimensions (diameter) measured as a function of time, t. This thicker disk was used to avoid difficulties associated with the samples deswelling on the timescale of the mass and diameter measurements. The inset in Fig. 2 shows a plot of the time dependence of both the mass uptake and diameter of the disk. The solid line is a fit of the mass uptake data to the equation for diffusion into a uniform slab of material17 | (1) |
Chloroform has been shown to increase the linear dimensions of unsupported PDMS membranes by a factor, S ∼ 1.3915 and a film which is confined by a substrate is therefore expected to experience a linear compressive strain ε = (S − 1) ∼ 0.39. If the elastic energy stored per unit area associated with these in-plane stresses exceeds the work of adhesion between the film and the substrate, delamination and subsequent buckling of the films can occur. Measurements obtained from the diameter of a PDMS disk both before and after swelling shown in the inset of Fig. 2 give an experimental value for the equilibrium swelling ratio of the PDMS in chloroform studied of 1.33 ± 0.01. This is slightly lower than the value quoted by Lee and coworkers15 and will be used in what follows.
In the experiments reported here, the wax layer that was applied to the glass substrates prior to deposition of the PDMS was used to reduce the work of adhesion and promote the formation of telephone cord blisters. The carnuaba wax that was used is only weakly soluble in chloroform at room temperature and hence did not completely dissolve when the chloroform had diffused through the PDMS film. Dissolution of a near-interfacial wax layer is therefore believed to have reduced the work of adhesion between the film and the substrate. This is supported by the fact that PDMS films that had been spin coated directly on to glass substrates did not form telephone cord blisters as readily as the wax supported films when they were swollen in chloroform.
The combined effects of large swelling stresses and the reduction in the work of adhesion resulted in the formation of multiple telephone cord blisters on each sample (see Fig. 2). In the following sections, the thickness dependence of the physical dimensions and growth rates of these structures are presented and discussed in the context of modified theories of buckling and dynamic fracture mechanics respectively.
3.1 Primary buckling and blister width
Fig. 3 shows a plot of the blister width, w, as a function of the PDMS film thickness. This figure also contains an inset showing how the width was measured. In each case, a position at the midpoint between two turning points on the telephone cord structure was chosen to measure the width and this was repeated at multiple locations on each blister. This method of measuring the width is consistent with the approach used by Sun et al.9 who showed that width values obtained in this way were very similar to those obtained from straight sided blisters on the same samples. | ||
| Fig. 3 Thickness dependence of primary buckling (blister width, w) in solvent swollen PDMS films. Data are shown as a function of the unswollen thickness of the PDMS films. The dashed line is a fit to eqn (4). An optical image (top left) shows a representative location used to measure the width. The diagram shown as an inset indicates how the blister width and loop length, lloop are defined in reference to the large-slope folded structures that form during primary buckling. | ||
Interpretation of the thickness dependence of the blister width shown in Fig. 3 can be performed using a simple analysis that considers the balance of energies involved in the formation of the large-slope folded structures (see Fig. 1(b)). The following analysis proceeds in a similar manner to that adopted previously18–21 and shows that the relevant length scale for setting the width of the blisters is the elasto-capillary length, lEC.
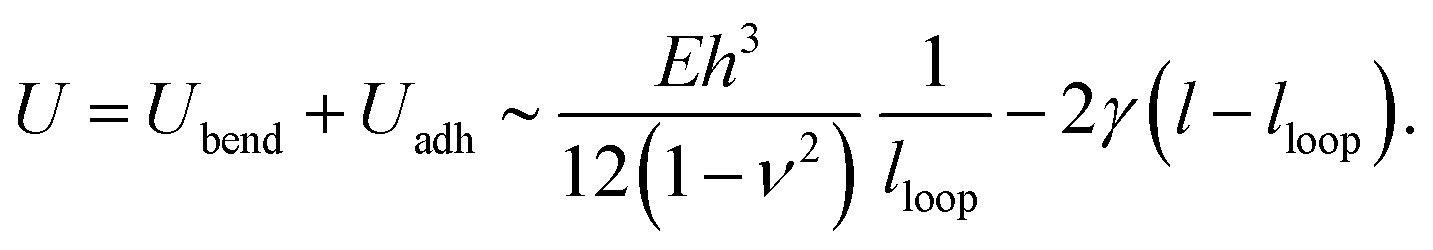
The formation of a large-slope fold with a total length, l, requires the bending of the film to create a loop size of size lloop (see inset in Fig. 3) and the self-adhesion of the remaining portions of the delaminated films. The energy per unit length associated with the bending of the delaminated film and formation of the loop can be written in the form Ubend = Bκ, where  is the bending modulus and κ is the curvature. In this case, the curvature of the film
 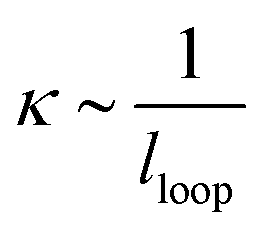 and
and
 | (2) |
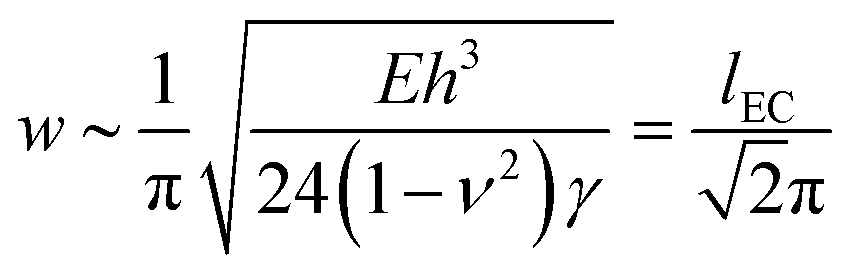
The energy of adhesion per unit length associated with the remaining part of the large-slope fold (i.e. the part which sticks to itself) is expected to scale as Uadh ∼ −2γ(l − lloop), where γ is the interfacial energy of PDMS. Combining the above two results gives an expression for the total energy of the large slope fold (per unit length) of
 | (3) |
Minimising the total energy with respect to lloop and noting that the width of the blister,  , gives the result that
 | (4) |
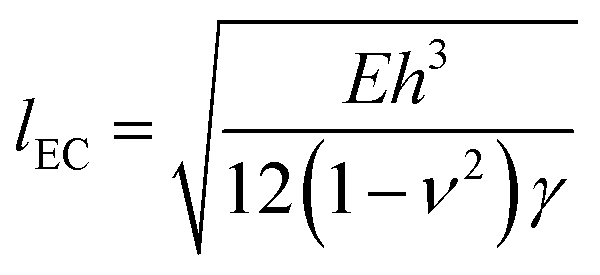 is the elasto-capillary length.18–20 In deriving this equation we note that the relevant thickness and Young's modulus values should be those of a solvent swollen PDMS film i.e. thickness ∼Sh and E = Eswollen. However, assuming that the theory of rubber elasticity holds for PDMS, the Young's modulus can be written in the form E = 3nkBT,22 where n is the number density of cross links, kB is Boltmann's constant and T is temperature (K). For a swollen film whose linear dimensions change by a factor of S, the distance between cross-links is expected to scale accordingly. The resulting number density of cross-links and hence the Young's modulus will therefore be reduced by a factor of ∼S3, resulting in a lack of dependence upon S in eqn (4). The values of E and h in eqn (4) are therefore simply the corresponding values for the unswollen PDMS film.
Fig. 3 shows a fit of the measured width data to a  power law as predicted by eqn (4) (dashed line). The fit yields a value of
  assuming that ν = 0.5. Estimates of the values of the Young's modulus E = 1.6 MPa23 and surface energy γ = 20 mJ m−224 for PDMS obtained from the literature give a corresponding value of the ratio
 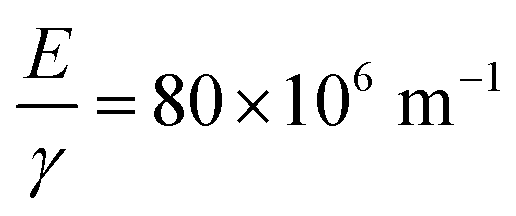 . Given the approximate nature of the simple scaling analysis used to derive eqn (4), the level of agreement between the literature values and the fit value would seem to be acceptable. Moreover, the fact that estimates of the Young's modulus and surface energy were used may also account for some of the discrepancy between the ratio,
  , obtained from literature values and that determined from the fit to the data in Fig. 3. Specifically, the use of the surface energy in place of the interfacial energy between PDMS and chloroform is potential source of error. Similarly, the use of the theory of rubber elasticity to estimate the Young's modulus of a thin solvent swollen PDMS film may also represent a poor approximation.
3.2 Secondary buckling and the telephone cord blister wavelength
The secondary buckling process that results in the formation of the sinusoidal undulations can be interpreted in terms of a competition between unrelaxed swelling stresses in the direction parallel to the large slope fold and bending stresses that are generated when the folded film deflects away from the straight-sided blister shape. This competition results in the folded films buckling with a characteristic wavelength, λ. The equation that describes the balance of forces in the folded film can be written in the form;13,14,25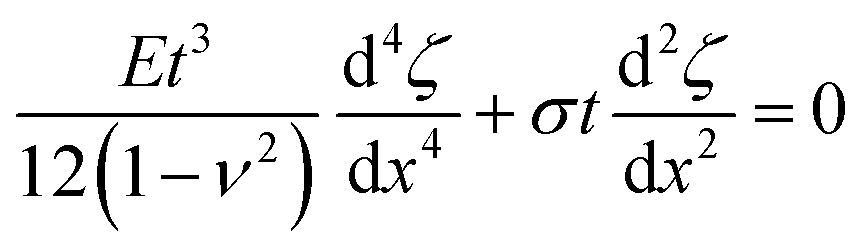 | (5) |
cos(qx) can be used to describe the deflection of the buckling structure. Combining these results with eqn (5) gives a non-trivial solution for the wavelength of the sinusoidal corrugations formed during secondary buckling,  , of
, of | (6) |
 | ||
| Fig. 4 Thickness dependence of secondary buckling (sinusoidal wavelength) in solvent swollen PDMS films. Data are shown as a function of the unswollen thickness of the PDMS films. The dashed line is a linear fit to the data with a slope of 9.7 ± 0.1. An optical image, given as an inset, shows how the wavelength, λ and amplitude of deflection, ζ, are defined. Similarly, the diagram shown as a separate inset defines the thickness of the large-slope folded structure used in eqn (6). | ||
Fig. 4 shows a plot of the measured wavelength of the telephone cord blister corrugations as a function of the film thickness. The data shows a linear relationship with a slope of 9.7 ± 0.1 in good agreement with the predictions of the simple buckling theory presented in eqn (6). The level of agreement is extremely encouraging and suggests that the theoretical approach applied here is valid, despite the simplified assumptions about the shape of the fold (i.e. a thin strip of uniform thickness 2Sh).
3.3 Blister growth speed
The final property of the growing telephone cord blisters to be considered is the thickness dependence of the speed of the crack tip responsible for extension of the blisters at the PDMS/wax interface. Measurements of the crack tip speed, v, were obtained by measuring the change in the total contour length of the telephone cord blisters as a function of time. Isolated blisters were observed to nucleate and grow with a constant speed (see inset in Fig. 5). In this context, an isolated blister is defined pragmatically as one which grows with a constant speed. In practice, isolated blisters corresponded to ones that were separated by a distance of more than 10w from their nearest neighbours. Changes in speed were observed to occur when two blisters approached. This resulted from the overlap of the neighbouring stress fields associated with the interfacial crack tips. The value of 10w cited as the condition for defining an isolated blister therefore provides a generous upper bound for the decay length associated with the stress fields near the growing crack tip. However, detailed information about the stress profile near the crack tips could not be obtained in these experiments. | ||
| Fig. 5 Thickness dependence of the speed of the growing blister crack tip (main panel). The inset shows examples of the time dependent length of blisters on PDMS films with unswollen thickness values of 56 μm (blue circles) and 126 μm (green circles) respectively. The image shown as an inset (bottom left) indicates the direction of growth and instantaneous speed of a growing blister. An additional image (bottom right) shows a chloroform swollen PDMS droplet supported on a wax coated glass substrate. The value obtained for the contact angle, θ, from this image was 15.3 ± 0.3°. This value was used to obtain an estimate of the work of adhesion Γ for the PDMS films (see text, eqn (10)). The solid line in the main panel is a fit to the form of eqn (9). Values of E = 1.6 MPa, Γ = 39 mJ m−2, a = 0.051 ± 0.001 J m−2 and b = (4.059 ± 0.001) × 10−12 J m−1 were used to generate the fit (see text). | ||
The main panel in Fig. 5 contains a plot of the growth speed of isolated blisters as a function of the unswollen thickness of the PDMS films. This plot shows that the telephone cord blisters extend and grow more slowly as the film thickness increases (see Fig. 5). A reduction in crack growth speed with increasing thickness is intuitive from the perspective of an energy balance approach. Increasing the thickness is expected to increase the bending energy of the films in a manner that is proportional to ∼h3, while the in-plane strain energy generated by the swelling stresses scales as ∼h and the work of adhesion is expected to be independent of film thickness.25 The stronger thickness dependence of the bending energy in the films makes it more difficult for the film to deflect in the region of the crack tip as the films get thicker. This results in a slower rate of crack propagation.
Similar arguments based upon energy release rates at the tip of the growing blister have been used to derive an expression for the speed of a crack tip growing in a film under plane-strain conditions.26 The crack propagation mechanism is assumed to be mode I in nature (i.e. simple crack opening) and the speed of crack growth, v, is given by;
 | (7) |
 | (8) |
 .26 Inserting these results into eqn (7) gives an expression for the blister crack tip speed of
 | (9) |
The solid line in Fig. 5 is a fit of the crack speed data to the form of eqn (9). When performing this fit only a and b were used as free parameters. The value of the Young's modulus was fixed at E = 1.6 MPa and an estimate for the value of Γ was determined experimentally from measurements of the contact angle of a chloroform swollen PDMS droplet on a wax coated glass slide. The work of adhesion for a small drop (of radius less than the capillary length of the fluid, lcap ∼ 1.4 mm for PDMS), having a surface tension, γ, and contact angle, θ, can be estimated according to;29
| Γ = γ(1 + cosθ) | (10) |
The inset in Fig. 5 shows an image of a chloroform swollen droplet of uncured PDMS supported on a carnauba wax coated glass slide. This image was collected using a L2004A1 contact angle goniometer (Ossila, UK) and a measured value of θ = 15.3 ± 0.3° was obtained. Assuming a surface tension similar to that of pure PDMS (γ = 20 mJ m−224) and using the value of θ obtained for the solvent swollen drop gives a value for the work of adhesion, Γ = 39.0 ± 0.1 mJ m−2 ≈ 2γ. Caution should be exercised at this point as the value obtained for Γ from an uncross-linked droplet is likely to differ from that of a cross-linked one as elastic forces at the contact line are expected to play a significant role.30 However, our chosen approach is used only for obtaining an order of magnitude estimate of the value of Γ. Performing equivalent contact angle measurements on solvent swollen cross-linked PDMS drops is very difficult given the propensity of PDMS to detach from the wax coated substrate in the presence of chloroform. Estimating Γ from the work of adhesion of PDMS with wax is also an oversimplified assumption as many dissipative processes are likely to be involved at the crack tip during blister propagation (including viscous dissipation within the wax layer and plasticisation of the PDMS network). Moreover, the swelling ratio of the constrained (bounded) and unconstrained (debonded) part of the PDMS layers are likely to be different. As a consequence, crack propagation could also be affected by localized differential swelling stresses at the crack tip.
The fit to the data in Fig. 5 shows that the functional form of eqn (9) provides a good description of the thickness dependence of the blister growth speed. In applying this equation to telephone cord blister formation we have made two key assumptions, namely that the PDMS films experience plane strain conditions and that the method of crack growth is purely mode I (i.e. crack opening). The assumption of plane strain requires that the PDMS films are confined in-plane during swelling and that the films are free to relax (or contain zero strain) out of the plane of the samples. This would seem to be a reasonable approximation for the PDMS films studied here, where only lateral confinement occurs. The assumption of pure mode I (opening) is perhaps less valid as Faou and coworkers8 have shown that the propagation of telephone cord blisters involves a combination of both mode I and mode II (in plane shear) deformations.
An additional assumption is that eqn (8) can be used to describe the behaviour of the critical stress intensity factor in interfacial cracks. This expression was developed for cracks propagating in uniform materials and is not strictly valid for the propagation of a crack tip at the interface between two different materials. However, the level of success of eqn (9) in reproducing the shape of the data in Fig. 5, would seem to suggest that this approach has some merit. This is supported by the fact that Suo and Hutchinson31 have demonstrated similarities in the thickness dependence of stress intensity factors of interfacial cracks and those that occur in uniform materials.
In summary, the work presented here has focussed on the effects of chloroform induced swelling and telephone cord blister formation in PDMS films. A single solvent (chloroform) with a well-defined swelling ratio was used to allow us to probe the thickness dependence of telephone cord blister formation in these samples. It is worth noting however that telephone cord blister formation can be observed in the same system using other solvents that generate large swelling ratios in the PDMS. These include (but are not limited to) solvents such as chlorobenzene (S = 1.22), heptane (S = 1.34) and toluene (S = 1.31).15 The relative solubility of the wax layer in these solvents influences the work of adhesion, Γ, and therefore the extent to which telephone cord blisters can be observed. The influence of changing solvents will be the subject of future studies.
4 Conclusion
The thickness dependence of telephone cord blister formation in solvent swollen films of PDMS was studied using video imaging. Measurements of the thickness dependence of the width, wavelength and growth speeds were obtained and compared to theories of thin film buckling, delamination and dynamic fracture mechanics respectively. Data for the width and wavelength were found to be in good agreement with previously developed theories of buckling in thin films. A modified theory of blister growth was also developed and shown to be in good agreement with the thickness dependence of the blister growth speed in PDMS films that had been swollen in chloroform.Author contributions
J. S. S. was involved in all aspects of the work, from acquisition of funding and conceptualisation of the project, through data collection and analysis to writing the article. N. M. R. was involved in data collection, analysis and writing the article.Conflicts of interest
There are no conflicts to declare.Acknowledgements
The authors gratefully acknowledge financial support from the Leverhulme Trust under research project grant RPG-2021-337. They would also like to thank Dr Michael Weir for providing access to the contact angle goniometer.Notes and references
- S.-J. Yu, S.-C. Li, Y. Ni and H. Zhou, Acta Mater., 2017, 127, 220–229 CrossRef CAS.
- S. S. Velankar and V. Lai, ACS Appl. Mater. Interfaces, 2012, 4, 24–29 CrossRef CAS PubMed.
- X. Xue, S. Wang, C. Zeng, L. Li and C. Li, Surf. Interface Anal., 2018, 50, 180–187 CrossRef CAS.
- D. Breid, V. Lai, A. T. Flowers, X. Guan, Q. Liu and S. S. Velankar, Langmuir, 2021, 37, 6985–6994 CrossRef CAS PubMed.
- B. Yuan, C. M. Harvey, K. Shen, R. Thomson, G. W. Critchlow, D. Rickerby, S. Yu and S. Wang, Compos. Struct., 2022, 280, 114909 CrossRef CAS.
- J. S. Sharp and R. A. L. Jones, Adv. Mater., 2002, 14, 799–802 CrossRef CAS.
- B. Audoly, Phys. Rev. Lett., 1999, 83, 4124–4127 CrossRef CAS.
- J.-Y. Fao, G. Parry, S. Grachev and E. Barthel, Phys. Rev. Lett., 2012, 108, 116102 CrossRef PubMed.
- Y.-D. Sun, Q.-X. Chen, Y.-F. Feng, J. Chen and S.-J. Yu, Surf. Rev. Lett., 2015, 22, 1550046 CrossRef CAS.
- Y. Ni, S. Yu, H. Jiang and L. He, Nat. Commun., 2017, 8, 14138 CrossRef CAS PubMed.
- B. Yuan, C. M. Harvey, R. C. Thomson, G. W. Critchlow, D. Rickerby and S. Wang, Compos. Struct., 2019, 225, 111108 CrossRef.
- G. Gioia and M. Ortiz, Acta Mater., 1998, 46, 169–175 CrossRef CAS.
- Q. Wang, C. Wang, Z. Wang, J. Zhang and D. He, Appl. Surf. Sci., 2008, 255, 1836–1840 CrossRef CAS.
- P. Cai, S. Yu, X. Xu, M. Chen, C. Sui and G.-X. Ye, Appl. Surf. Sci., 2009, 255, 8352–8358 CrossRef CAS.
- J. N. Lee, C. Park and G. M. Whitesides, Anal. Chem., 2003, 75, 6544–6554 CrossRef CAS PubMed.
- E. Favre, P. Schaetzel, Q. T. Nguygen, R. Clément and J. Néel, J. Membr. Sci., 1994, 92, 169–184 CrossRef CAS.
- J. Crank, The Mathematics of Diffusion, Oxford University Press, Oxford, 2nd edn, 1975 Search PubMed.
- C. Py, P. Reverdy, L. Doppler, J. Bico, B. Roman and C. N. Baroud, Phys. Rev. Lett., 2007, 98, 156103 CrossRef PubMed.
- B. Davidovitch and V. Démery, Eur. Phys. J. E: Soft Matter Biol. Phys., 2021, 44, 11 CrossRef CAS PubMed.
- A. E. Cohen and L. Mahadevan, Proc. Natl. Acad. Sci. U. S. A., 2003, 100, 12141–12146 CrossRef CAS PubMed.
- X. Yuan, B. Zhu and S. Wang, Int. J. Mech. Sci., 2022, 232, 107616 CrossRef.
- R. A. L. Jones, Soft Condensed Matter, Oxford University Press, Oxford, 1st edn, 2002 Search PubMed.
- I. Johnston, D. K. McCluskey, C. K. L. Tan and M. C. Tracey, J. Micromech. Microeng., 2014, 24, 035017 CrossRef CAS.
- S. Wu, in Polymer Handbook, ed. J. Brandrup, E. H. Immergut and E. A. Grulke, Wiley-Interscience, New Jersey, 4th edn, 1994, vol. 2, ch. VI, pp.521–542 Search PubMed.
- S. P. Timoshenko and J. M. Gere, Theory of Elastic Stability, Dover, Mineola, New York, 2nd edn, 2009 Search PubMed.
- L. B. Freund, Dynamic Fracture Mechanics, Cambridge University Press, Cambridge, 1st edn, 1990 Search PubMed.
- G. T. Hahn, R. G. Hoagland, A. R. Rosenfield and R. Sejnoha, Metall. Trans., 1974, 5, 475–482 CrossRef CAS.
- M. O. Lai and W. G. Ferguson, Eng. Fract. Mech., 1986, 23, 649–659 CrossRef.
- D. E. Packham, J. Membr. Sci., 1996, 16, 121–128 CAS.
- Y. Rao, S. Qiao, Z. Dai and N. Lu, J. Mech. Phys. Solids, 2021, 151, 104399 CrossRef.
- Z. Suo and J. W. Hutchinson, Int. J. Fract., 1990, 43, 1–18 CrossRef.
Footnote |
| † Electronic supplementary information (ESI) available. See DOI: https://doi.org/10.1039/d3sm01051a |
| This journal is © The Royal Society of Chemistry 2023 |