 Open Access Article
Creative Commons Attribution 3.0 Unported Licence
Effect of microstructure evolution on the mechanical behavior of magneto-active elastomers with different matrix stiffness
Mehran
Roghani
 *,
Dirk
Romeis
 and
Marina
Saphiannikova
Leibniz-Institut für Polymerforschung Dresden e.V., Hohe Strasse 6, 01069 Dresden, Germany. E-mail: Roghani@ipfdd.de
First published on 31st July 2023
Abstract
Evolution of microstructure in magneto-active elastomers (MAEs) which can be caused by an applied magnetic field is a fascinating phenomenon with a significant impact on the mechanical behavior of the composite. To gain insight into the underlying mechanisms of this phenomenon, it is essential to create a model that can appropriately describe the field induced change in the particle distribution and its mechanical implications. The magneto-mechanical coupling is driven by magnetic interactions between the particles in the applied field. These magnetic interactions can result in macroscopic deformation of the sample and also in rearrangement of the microstructure, i.e. the local positions of the particles. In the case of initially isotropic MAEs made with a sufficiently soft matrix, this leads to the formation of chains of magnetized particles, creating a significant increase in the mechanical moduli along the field direction. In this paper, we implement a transversely isotropic Neo–Hookean material model to account for such anisotropic elastic behavior. A dipolar mean field approach is used to describe magnetic interactions between the particles. A penalty term is introduced to compensate for the micro-mechanical elastic energy required to move the particles inside the cross-linked elastomer. The resulting model can predict the huge magneto-rheological effects observed in experiments, and improves our understanding of how microstructure evolution affects magnetically induced deformation and stiffness of MAEs.
1. Introduction
Magneto-active elastomers (MAEs) are composites made of a soft elastomeric matrix with magnetic micro-inclusions. These composites have been attracting a lot of attention due to their highly adaptive properties, which classifies them as smart materials.1–3 They are alternatively called magneto-rheological elastomers (MREs) or magneto-sensitive elastomers (MSEs) in the literature. MAEs can undergo noticeable deformation through the application of an external magnetic field.4,5 Additionally, their mechanical properties can be actively and controllably modified by the field.6–8 Different classes of MAEs can be manufactured with regard to the magnetic properties of the inclusions and curing procedure of the matrix. If magnetically hard (e.g. NdFB) inclusions are used, the resulting composite shows magnetic hysteresis.9–11 Magnetically soft inclusions (carbonyl iron) show negligible magnetic hysteresis, usually resulting in an MAE with reversible behavior under magnetic loadings.12–14 MAEs can also be manufactured in the presence of a (curing) magnetic field, which results in anisotropic composites with direction specific properties due to the formation of particle chains.15,16 Curing in the absence of a magnetic field results in isotropic samples.17 These features give MAEs customizable magneto-mechanic properties, which make them ideal for high-tech applications. Recent implementations include the use of MAEs in precision control and adaptive vibration dampening,18–23 soft robotics,24–27 medical28–31 and energy harvesting devices.32–34With the increasing implementation of MAEs in real-world devices, the demand for accurate models that describe their magneto-mechanical behavior is also growing. Macroscopic approaches often treat the material as a homogeneous magnetic medium and aim to predict the macroscopic behavior of samples with complex geometries.35–38 In contrast, microscopic and mesoscopic approaches attempt to model the effects of various microstructures that can result in non-isotropic behavior.39–41 However, it is difficult to simultaneously capture the coupling between micro and macro effects for a real MAE sample. This is due to the well known nature of magnetic short and long-range interactions, which require knowledge of the sample's configuration at both the micro and macro scales.42 In other words, the behavior of an MAE sample is strongly influenced by the sample's macroscopic shape and the arrangement of particles at the micro-scale. To address this challenge, multi-scale modeling approaches have been developed. These approaches involve defining local characteristics using microscopic models in order to evaluate the macroscopic shape. Representative volume element homogenization43 and two-scale finite element procedure (FE2)44 are examples of multi-scale approaches which have the downside of implementation complexity and high computational cost. Another multi-scale modeling approach is the unified theory developed by Ivaneyko et al.42 for MAEs. This method reduces the computational cost significantly by assuming dipolar interactions between particles, and has been shown to provide very good accuracy in comparison to full-field approaches.45 Recently, Romeis and Saphiannikova46 proposed a model for the effective magnetization behavior of MAEs, utilizing analytical homogenization based on dipole approximation. Chougale et al.47 implemented the mean field theory in an invariant based approach to create a constitutive model for anisotropic MAEs. For more details and comparisons between the different modeling strategies, readers can refer to a recent review by Nadzharyan et al.48
An intriguing yet understudied aspect of isotropic MAEs composed of a very soft elastomeric matrix and magnetically soft spherical micro-particles is the phenomenon where the particles rearrange into chain-like structures under a magnetic field.49–53 This rearrangement of particles can lead to significant changes in the elastic moduli of the material, often spanning several orders of magnitude and changing the isotropic properties to highly anisotropic ones.17,54 In terms of modeling, several papers have studied particle rearrangement at the micro-scale.55–60 However, particle rearrangement induces high deformations in the matrix and particles can come very close to each other, which poses challenges for direct solutions to fully coupled finite element problems.61
This paper proposes an effective model that accounts for microstructural evolution and the initial sample shape of MAEs. To do so, we modify a transversely isotropic Neo–Hooke model to better fit the emerging anisotropy of MAEs with an evolving microstructure. Magnetic interactions are modeled using dipolar mean field approximation. Additionally, a third energy term is introduced to account for the elastic energy penalty incurred by particle rearrangement. Finally, we minimize the total energy function to determine the magnetically induced deformation. More importantly, we analyze the magnetic field induced increase of the elastic properties, known as the magneto-rheological effect.
2. Theory
The behavior of an MAE specimen under the external magnetic field H0 is fundamentally driven by variations of the magnetic energy. It has been shown that this energy can be expressed by the following integral form over the volume of the sample VS:62,63 | (1) |
The relationship between M(r) and H(r) in a magnetizable particle can be described using a Langevin function to capture saturation magnetization behavior:64
 | (2) |
Since the elastomer is non-magnetic in nature, the integral in eqn (1) over the sample volume reduces to the volume occupied by magnetic particles, Vp. In the following, we make use of the so-called leading order approximation66 which assumes that the position-dependent magnetization vector can be approximated by a constant average magnetization throughout the sample, i.e.M(r) ≈ M. Similarly, the magnetic field vector is replaced by an average magnetic field, H(r) ≈ H. This assumption works very well with spheroidal sample shapes because they have the benefit of homogeneous induced magnetization in the entire sample. Therefore, we consider spheroidal MAE samples exclusively in this study. With the aforementioned approximation, the expression for magnetic energy per unit volume is derived from eqn (1):
 | (3) |
The magnetic field H is described by a superposition of the external magnetic field and the demagnetization field Hd (magnetic field induced by the spherical particles):
| H = H0 + Hd. | (4) |
 | (5) |
 | (6) |
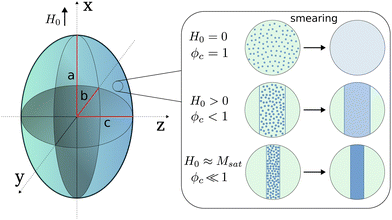
To calculate Gmicro, a model for the microstructure and its evolution during chain formation should first be established. Modern imaging techniques performed on MAEs (e.g. X-ray micro-computed tomography imaging69) show that if the composite is soft enough, an initially random distribution of micro-particles gives way to chains forming under an external magnetic field. A micro-scale model has been investigated in ref. 70, where the chains of micro-particles are smeared into columnar structures. This model, which was introduced for initially anisotropic MAEs, is extended here to take into account the field-induced rearrangement of particles. It operates by treating the isotropic sample as comprising a single phase with a volume fraction of particles ϕ. After applying a magnetic field, two distinct regions appear as shown in Fig. 1. One is the region densely packed with particles forming chains, which is considered as a column. The volumetric portion of these columns with respect to the total volume of the sample is ϕc. The other part is the region with a pure elastomer, which represents the area between the columns with no particles inside. As the external magnetic field increases and particles attract each other more, the volumetric portion of the column section decreases relative to the entire sample, causing an increase in the local volume fraction of particles ϕp. These volume fractions are linked as follows:
 | (7) |
Based on the mean field approximation, the aforementioned model allows us to estimate the microstructure factor. For columnar-like particle arrangements it takes the simple analytical form:46
 | (8) |
 | (9) |
In this study, spheroidal samples are undergoing uniaxial deformation, when a uniform external magnetic field is applied parallel to the axis of symmetry. Under such conditions, the spheroidal geometry is retained in good approximation, considering small deformations (<20%) of MAEs under moderate magnetic field loadings.71 Additionally, considering fmacro and fmicro as the scalar components of Gmacro and Gmicro along the symmetry axis of the spheroid, the magnetic energy given by eqn (3) takes a scalar form, simplifying the solution process.
To explain the anisotropic mechanical response of MAEs, an elastic model is necessary to capture the significant change in modulus along the direction of the magnetic field, which arises from the formation of chains by magnetized particles. In this work, we make the assumption of uniform deformations within a spheroid in its current configuration.72 Based on this assumption, we employ a modified Neo–Hookean material model to describe the elastic energy density of the system. This modified model is specifically designed to capture the emerging transversely isotropic behavior exhibited by the material:
 | (10) |
![[a with combining right harpoon above (vector)]](https://www.rsc.org/images/entities/b_i_char_0061_20d1.gif) 0·b·
0·b·![[a with combining right harpoon above (vector)]](https://www.rsc.org/images/entities/b_i_char_0061_20d1.gif) 0 denotes the pseudo invariant with a direction specified by the unit vector
0 denotes the pseudo invariant with a direction specified by the unit vector ![[a with combining right harpoon above (vector)]](https://www.rsc.org/images/entities/b_i_char_0061_20d1.gif) 0 = (1,0,0). This unit vector points to the direction of the magnetic field, along which the magnetized particle chains form. The dimensionless parameters ζ1 and ζ2 are used to introduce anisotropic (transversely isotropic) behavior into the elastic energy. These anisotropy parameters essentially define the material stiffness in two specified directions: perpendicular to the symmetry axis and along it. They are estimated from our simple microstructure model for different stages of restructuring.
0 = (1,0,0). This unit vector points to the direction of the magnetic field, along which the magnetized particle chains form. The dimensionless parameters ζ1 and ζ2 are used to introduce anisotropic (transversely isotropic) behavior into the elastic energy. These anisotropy parameters essentially define the material stiffness in two specified directions: perpendicular to the symmetry axis and along it. They are estimated from our simple microstructure model for different stages of restructuring.
In the case of uniaxial deformations, b is given as follows:
 | (11) |
 | (12) |
| λ1λ2λ3 = 1. | (13) |
 | (14) |
| Ω1ϕ1 + Ω2(1 − ϕ1) = 0, | (15) |
 | (16) |
According to the self-consistent effective medium theory above, the effective elastic modulus steeply changes when the volume fraction of inclusions gets near ϕ = 0.4. This phenomenon occurs due to one phase forming a percolation cluster, and the volume fraction corresponding to this behavior is referred to as the percolation threshold. However, in practice, the percolation threshold value for a given composite can vary considerably over a wide range of volume fractions and cannot be precisely known.73
To overcome this limitation, a modification is applied to the effective medium theory that lets us prescribe the percolation threshold value. This approach, introduced by Snarskii et al.,74 is formulated as:
 | (17) |
 | (18) |
Solving eqn (17) by taking into account eqn (16) and (18), we can evaluate the effective elastic modulus of the composite, Ge. Fig. 2 shows the behavior of this modified effective medium theory for two prescribed values of percolation threshold 0.3 and 0.7. Also, for each of these values, the effect of relative magnitudes of G1 and G2 on the effective elastic modulus of the composite is investigated. It is evident from Fig. 2 that the percolation threshold is shifted to the prescribed values, and when the relative magnitude G1/G2 is higher, the steep change of Ge that occurs when the inclusion volume fraction gets near pc is more pronounced.
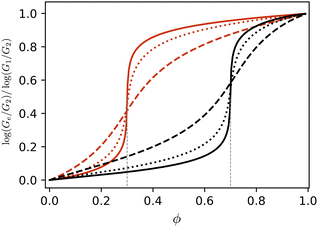 | ||
| Fig. 2 Behavior of the effective shear modulus for two values of percolation threshold 0.3 and 0.7, at different magnitudes of G1/G2 = 106 (solid), G1/G2 = 104 (dotted) and G1/G2 = 102 (dashed). | ||
The aforementioned method is used to compute the shear moduli of the initially isotropic sample, Giso, and of the columns Gc that form under a magnetic field, for a given ϕ and ϕp. In this case, one phase is assumed to be a soft elastomeric matrix, with the shear modulus Gm replacing G2 in eqn (16). The other phase can be considered as bulk iron, which typically has a shear modulus of approximately 80 GPa. Taking the modulus of bulk iron for the shear modulus G1 of the particle phase results in a very high effective elastic modulus value for the composite when the volume fraction is higher than the percolation threshold. However, such a high shear modulus is not observed in manufactured percolated composites, due to the presence of a thin layer made of polymer chains between the iron particles. This layer prevents direct contact between the particles, limiting the rise of the effective shear modulus to much lower values than that of bulk iron. In order to achieve a more realistic representation, we consider a phase consisting of tightly packed hard-core soft-shell particles75,76 instead of a pure iron phase. According to our estimation, the modulus of such phase for a rigid iron core and very thin polymer shell can be related to the matrix modulus as:
| G1 = Gm × 103. | (19) |
| EL = (1 − ϕc)Em + ϕcEc, | (20) |
 | (21) |
The elastic energy under uniaxial deformation along the field direction can be computed from eqn (10) with respect to the given values of the local volume fraction ϕp and the longitudinal stretch ratio λL. As described above, each value of ϕp leads to the evaluation of anisotropy parameters ζ1 and ζ2 for the corresponding state of microstructure. Naturally, the elastic energy reaches its minimum value when there is zero deformation, i.e., λL = 1 (as demonstrated in Appendix A, Fig. 11). Also, for local volume fractions above the percolation threshold, the energy increases significantly starting at moderate elongations. This is a consequence of the formation of pronounced chains that results in a large increase of the elastic modulus.
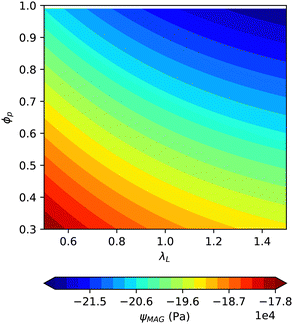
The magnetic energy can also be computed from eqn (3) with respect to given values of ϕp and λL. With eqn (9) in mind, the value of fmicro can be obtained for a known ϕp. Also, changes in the value of λL result in variations of the aspect ratios given by eqn (12), and hence affect fmacro according to eqn (6). The formation of chains from magnetized particles is highly favorable since it results in a decrease of magnetic energy. Moreover, the magnetic energy is lower for positive values of λL, indicating a preference for prolate shapes or elongation (as can be seen from the magnetic energy landscape in Appendix A, Fig. 12).
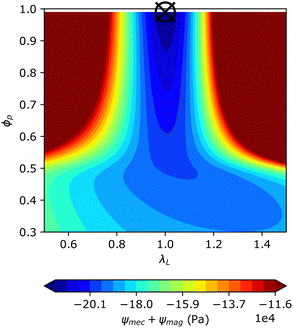
The magneto-mechanical coupling happens when these two energies are combined, as both are functions of ϕp and λL. From the resulting energy landscape shown in Fig. 3, it is observed that the minimum energy (indicated by the black cross in Fig. 3) lies at no deformation and maximum restructuring ϕp = 1. Changing the values of the external magnetic field H0 and matrix modulus Gm does not affect the position of this minimum. This implies that pronounced chains are always formed, regardless of the intensity of the applied magnetic field or the stiffness of the elastomer used. This is contrary to intuition and also to experimental findings reported in the literature.49,53
This discrepancy is originated in our simplified model, where the elastic energy only takes macro-scale deformations into account and thus neglects the elastic energy required to rearrange particles in the elastomeric matrix. For a realistic description, we need to add a microscopic mechanical energy function that characterizes changes in the state of the microstructure. As previously discussed, we quantify the microstructure state using the variable fmicro in eqn (9). Therefore, we will utilize this variable in the energy function to capture the changes in the microstructure state. Additionally, since the matrix stiffness affects particle rearrangement strongly, this energy should also depend on the initial stiffness of the composite, denoted by Giso. As the exact form of this function is unknown, it is reasonable to represent it in terms of a virial expansion. Therefore, we can express it as follows:
 | (22) |
| ψMAE = ψmec + ψmag + ψmic. | (23) |
3. Results and discussion
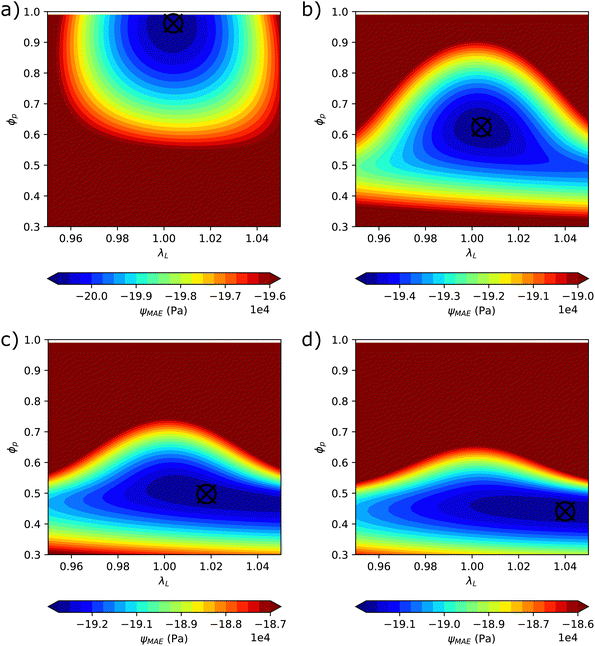
Based on eqn (23), the energy landscape of an initially spherical MAE sample is plotted in Fig. 4 for different values of matrix stiffness. The micro-mechanical constant is set to be km = 45 here to produce maximum microstructure evolution at saturating values of the magnetic field for the sample with the softest matrix. It is observed from the minima of the energy, that the model forecasts substantial microstructure evolution and nearly no deformation for the softest sample (Gm = 5 kPa). For a slightly stiffer sample (Gm = 10 kPa), microstructure evolution is half as pronounced compared to the softest case, but the deformation is still negligible. However, for higher values of elastomer modulus, the local volume fraction ϕp remains below pc. This makes the field induced stiffening to be weak and because deformation is not hindered anymore, the elongation of the sample becomes more prominent.As can be seen from Fig. 4, by minimizing the free energy for certain values of model parameters H0, pc, ϕ, km, γ0 and Gm, an equilibrium state can be found. This state which points to certain values of local volume fraction ϕp and stretch ratio λL in the direction of the magnetic field leads to the determination of the magneto-rheological behavior of the material. Having determined the value of ϕp we use it as a known parameter to calculate the second derivative of the free energy with respect to the stretch ratio in the direction of the magnetic field. The value of this derivative at λL, which is obtained through minimization in the previous step, corresponds to the elastic modulus along the magnetic field direction, denoted as EL. In the following, the effects of the model parameters on the magnetically induced deformation and magneto-rheological behavior will be described in detail.
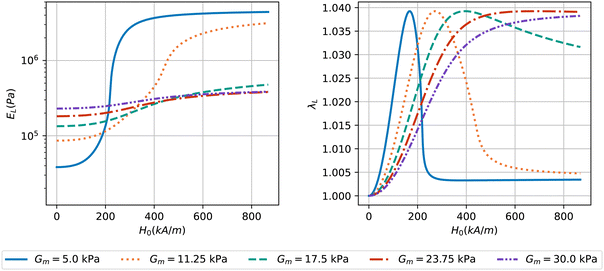
Fig. 5 shows the change of elastic modulus and elongation along the magnetic field for MAE samples with various values of matrix stiffness (Gm). A very low but experimentally achievable modulus for the matrix (Gm = 5 kPa) is chosen here such that the particles can rearrange by the magnetic interactions. The plot on the left demonstrates that the softest sample experiences an increase in elastic modulus of nearly two orders of magnitude (blue solid curve). This increase in modulus has a saturating behavior regarding the intensity of the external magnetic field. The highest value of matrix stiffness considered in this study is Gm = 30 kPa, which corresponds to a sample where the microstructure evolution is suppressed due to the relatively rigid matrix. It is observed that the magneto-rheological effect obtained for this sample (purple curve) is negligible compared to the softest case. In addition, the results for intermediate values of Gm show that as the matrix stiffness increases, the field induced changes in mechanical modulus become more gradual and saturate at higher intensities of the applied magnetic field.
An aspect of the magneto-rheological effect which is predicted by our model is the quadratic dependence of mechanical moduli on the field intensity at low magnetic fields, as reported in ref. 42 and 78. This is mostly visible in the initial slope of the blue solid curve on the left in Fig. 5. Also, our results for the field dependent mechanical moduli of MAEs are in qualitative agreement with the experiments conducted by Nanpo et al.49 The authors reduced the stiffness of the elastomeric matrix in their MAE samples by adding different weight fractions of plasticizer and observed that there is a direct relationship between the magneto-rheological effect and softening of the sample induced by the addition of plasticizer. A rheometer has been used to measure the magneto-mechanical properties of the MAE samples and a maximum difference between off-field and on-field moduli for the softest sample around two orders of magnitude is observed. It should be noted that the experimental approach employed in ref. 49 involves torsion to determine the mechanical properties of the material while the model here is based on uniaxial deformations, so our focus lies on the qualitative modeling of the significant stiffening phenomenon. It is important to acknowledge that various papers, employing different testing protocols and materials, have reported different magnitudes of field-induced stiffening in MAEs. These magnitudes range from below one order to as high as four orders, highlighting the variability in the observed effects across different experimental setups and material compositions.17,54,78 Despite the differences in specific magnitudes, our model aims to capture the underlying mechanisms that contribute to this pronounced stiffening behavior under the influence of a magnetic field and is tunable using a few model parameters.
On the right in Fig. 5 the correlation between the magnetic field intensity and stretch ratio of the sample along its symmetry axis λL(H0) is shown. For the softest sample, a peak in elongation of about 4% at relatively low fields is observed, but then the deformation decreases and stabilizes at low values. This behavior is due to the static nature of our model: each evaluation of the magneto-rheological properties at a certain H0 is performed for an MAE sample subjected to an instantaneously applied magnetic field. If the magnitude of the magnetic field is large enough, the microstructure evolves into strong chains immediately (as seen on the left of Fig. 5), making the sample very stiff and thus preventing elongation. This suggests that the rate of the applied magnetic field can affect the deformation of the sample, and future experiments could be designed to investigate this phenomenon. The peak of elongation happens at a larger intensity of the external magnetic field for a slightly stiffer sample, Gm = 11.25 kPa, and the saturated deformation at high fields is a little larger. For stiffer samples, the decrease in deformation at high magnetic fields disappears; instead, the elongation maintains its peak deformation at 4%, which is the same for all the values of matrix stiffness studied here.
In Fig. 6, the change in the local volume fraction ϕp with respect to the magnetic field is shown for the same model parameters as used in Fig. 5. It can be seen that for the two softest matrices, ϕp surpasses the percolation threshold as H0 increases and that is the reason behind the huge increase in sample stiffness and decrease of elongation. The results for the change of local volume fraction due to the applied magnetic field are omitted for the other cases shown further, since ϕp follows a similar trend of behavior as in Fig. 6.
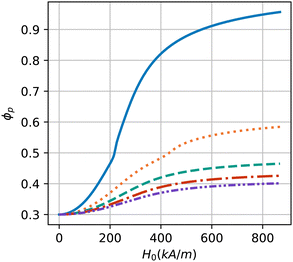 | ||
| Fig. 6 Local volume fraction ϕp of spherical samples with various values of matrix stiffness demonstrated in Fig. 5 depending on the field amplitude. Model parameters: pc = 0.5, ϕ = 0.3, km = 45. | ||
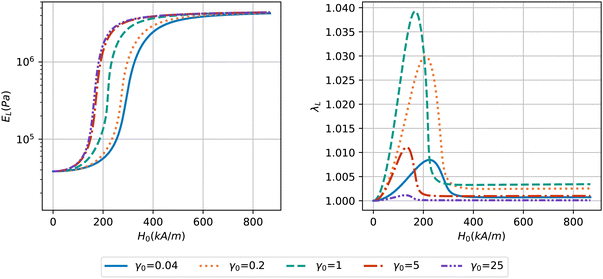
The effect of macroscopic shape on the magnetic behavior of MAEs is demonstrated in Fig. 7 by changing the initial aspect ratio of the sample γ0. With γ0 = 1 corresponding to a sphere, aspect ratios smaller than 1 correspond to oblate spheroids and aspect ratios larger than 1 correspond to prolate spheroids. From the left plot in Fig. 7 we see that the prolate samples stiffen at lower intensities of the magnetic field, while oblate samples stiffen at larger magnetic fields. Furthermore, it is worth noting that there appears to be a limit to the effect of shape on the stiffening of MAEs. Specifically, when the value of γ0 is below 0.2 or above 5, the observed behavior does not change significantly. The deformation of the samples confirms previous studies demonstrating maximum deformation for a spherical shape.47 As the aspect ratio decreases from 1, the peak deformation is decreased and happens at larger values of the magnetic field, see the right plot in Fig. 7. However, oblate samples experience larger deformation in comparison to their prolate counterparts because a huge field stiffening occurs at higher H0 values in this case and thus the magnetic interactions are strong enough to deform the sample. For the samples with γ0 > 1 we observe that the peak happens at lower values of H0 which is caused by the early onset of the stiffening.
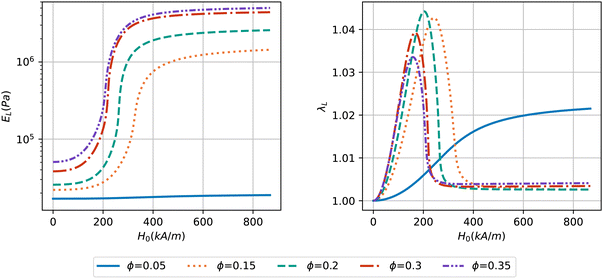
Fig. 8 shows the change of elastic modulus and elongation of an MAE sample under a magnetic field for various particle volume fractions ϕ. It is observed that the sample with a low volume fraction of ϕ = 0.05 experiences only a modest change in its elastic modulus under the influence of the magnetic field, see blue curve. This behavior can be attributed to the dilute distribution of the particles, where the local volume fraction ϕp can’t reach the percolation threshold value of pc = 0.5 even at large magnetic fields. Consequently, the field-induced deformation of this sample does not show a peak value, which is a result of the minimal change in modulus. Samples with higher particle volume fractions undergo a large increase in their modulus with the onset of the percolation happening at lower magnetic fields. Also for higher particle volume fractions the elastic modulus saturates at higher values. Additionally, increasing the particle volume fraction beyond ϕ = 0.3 does not significantly enhance the material's response to the magnetic field, consistent with experimental findings reported in the literature.78 From the right plot in Fig. 8, we see that the sample with ϕ = 0.2 has the largest peak deformation, while samples with higher volume fractions have lower peak values predicted at smaller field intensities because stiffening takes place at lower fields for them. For the case of ϕ = 0.15, although the stiffening occurs at larger magnetic fields, the deformation peak is not the highest one due to the lower volume fraction of particles that decreases the magnetic energy in the sample to deform it.
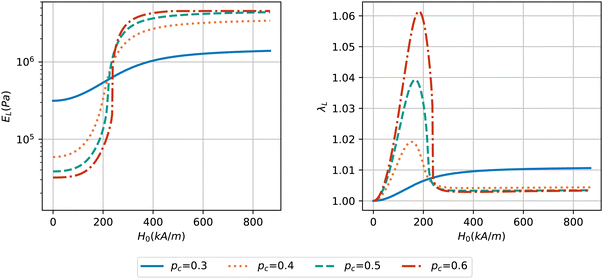
The correlation between magneto-rheological behavior and percolation threshold pc is demonstrated in Fig. 9. If we look at the change of elastic modulus in the left plot, it can be seen that for the lowest value of percolation threshold pc = 0.3 (blue solid curve in Fig. 9), the volume fraction of the sample ϕ = 0.3 is equal to pc at zero magnetic field. Subsequently, the sample has a very high modulus even in the absence of a magnetic field and undergoes only a small increase in its stiffness. For cases with higher values of pc, the behavior of elastic modulus does not differ much at both low and saturating magnetic fields. Also, only a small difference is observed for the intensity of the magnetic field at which the huge increase of the moduli happens for different pc values above 0.3. However, the right plot in Fig. 9 shows a noticeable difference between the elongation curves for different values of the percolation threshold. Except for the lowest value of pc which follows a monotonic deformation behavior, the other samples show a peak in deformation: all at the same intensity of the magnetic field but with different maximum values. Higher values of percolation threshold result in a larger maximum deformation in those cases.
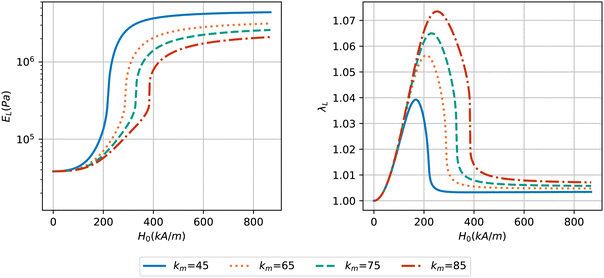
In Fig. 10, the effect of micro-mechanical constant km on the magneto-rheological behavior is investigated. As described earlier, selecting km = 45 ensures that the maximum microstructure evolution with ϕp close to 1 occurs at saturating magnetization for the lowest value of matrix stiffness considered here with Gm = 5 kPa. Consequently, smaller values of km are not reasonable since they result in strong chains forming immediately. The behavior at larger values of km can be explored, resulting in the following observations. As km increases, the maximum elastic modulus attained at saturating magnetic fields decreases, and the magnetic field intensity at which the modulus exhibits a sharp increase becomes higher. This indicates that higher values of km lead to a reduction in the overall stiffening effect and higher magnetic fields should be applied to observe significant modulus changes. The right plot in Fig. 10 reveals that with increasing km, the peak deformation shifts towards higher magnetic field intensities. The peak value of deformation also increases for larger km values, which correlates with the reduced stiffening at the same values of km.
4. Conclusions
In the present paper a model is proposed that takes into account the effects of particle arrangement, its evolution and the shape of the sample on the behavior of MAEs under magnetic loadings. With the help of the dipolar mean field approximation, the effects of the microstructure and macroscopic shape of the sample on the magnetic energy are accounted for. This is done by assuming that the position dependent magnetization field inside the ellipsoid can be replaced by an average magnetization. The relationship between the local magnetic field and magnetization in the inclusions follows a saturating behavior modeled by a Langevin function. For elastic energy, we implement a Neo–Hooke model which is extended by two variable anisotropy parameters to describe the rearrangement of the magnetized particles into columnar-like structures. The elastic modulus of the particle enriched column phase is estimated with the help of an effective medium theory with a modifiable percolation threshold. Another elastic energy term is added that takes into account the energy spent on rearranging the particles inside the elastic media on a micro-scale. To obtain the magnetic field induced change in elastic modulus and deformation of the samples, an iterative scheme is implemented to minimize the total magneto-mechanical energy in the sample.Our results predict a huge increase in the mechanical properties of MAEs (magneto-rheological effect) if they are made of a very soft elastomeric matrix. This effect can be as large as several orders of magnitude depending on the choice of initial parameters. The strength of the model presented in this study is that it captures the microstructure evolution and its effect on the mechanical properties with a small number of model parameters. These parameters can be modified to tune the model to the behavior of the specific materials used in the sample and experimental testing procedures.
It is important to note that the model is static in nature and thus we see a drop in elongation upon increasing the magnetic fields which is caused by the pronounced stiffening due to the formation of columnar-like structures in very soft MAEs. For such MAEs, we report here a curious interplay between microstructure evolution on a local scale and changes in the macroscopic shape. Which one of the two processes is dominant should be determined by their respective time rates. This prediction is an interesting aspect that may be tested experimentally to see if the rate of applying the magnetic field has an effect on the final deformation.
Author contributions
Mehran Roghani: conceptualization, methodology, formal analysis, investigation, writing – original draft, software, and visualization. Dirk Romeis: conceptualization, methodology, and writing – review & editing. Marina Saphiannikova: conceptualization, methodology, writing – review & editing, supervision, and funding acquisition.Conflicts of interest
There are no conflicts to declare.Appendix
A. Energy landscapes
The elastic (eqn 10) and magnetic (eqn 3) free energy densities are plotted in Fig. 11 and 12 as energy landscapes with respect to the local volume fraction of particles ϕp and the longitudinal aspect ratio λL.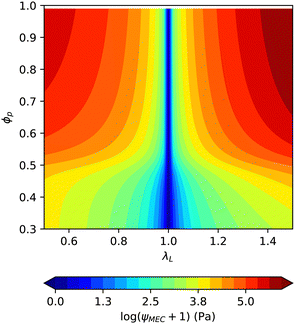 | ||
| Fig. 11 Elastic energy landscape of a spherical MAE sample with respect to deformation λL in the direction of the magnetic field and the local volume fraction ϕp (pc = 0.5, ϕ = 0.3, Gm = 5 kPa). | ||
Acknowledgements
We are grateful to Prof. Kostas Danas for useful discussions and valuable suggestions. Financial support from Deutsche Forschungsgemeinschaft (DFG, German Research Foundation) research project 380321452/GRK2430 (‘Interactive Fiber Rubber Composites’) is gratefully acknowledged.References
- Y. Li, J. Li, W. Li and H. Du, Smart Mater. Struct., 2014, 23, 123001 CrossRef.
- Ubaidillah, J. Sutrisno, A. Purwanto and S. A. Mazlan, Adv. Eng. Mater., 2015, 17, 563–597 CrossRef CAS.
- M. Shamonin and E. Y. Kramarenko, in Novel Magnetic Nanostructures, ed. N. Domracheva, M. Caporali and E. Rentschler, Elsevier, 2018, pp. 221–245 Search PubMed.
- D. V. Saveliev, I. A. Belyaeva, D. V. Chashin, L. Y. Fetisov, D. Romeis, W. Kettl, E. Y. Kramarenko, M. Saphiannikova, G. V. Stepanov and M. Shamonin, Materials, 2020, 13, 3297 CrossRef CAS PubMed.
- G. Glavan, I. A. Belyaeva, I. Drevenšek-Olenik and M. Shamonin, J. Magn. Magn. Mater., 2023, 579, 170826 CrossRef CAS.
- A. M. Menzel, Phys. Rep., 2015, 554, 1–45 CrossRef CAS.
- S. Odenbach, Arch. Appl. Mech., 2016, 86, 269–279 CrossRef.
- M. T. Lopez-Lopez, J. D. G. Durán, L. Y. Iskakova and A. Y. Zubarev, J. Nanofluids, 2016, 5, 479–495 CrossRef.
- S. Hermann, P. Butaud, G. Chevallier, J.-F. Manceau and C. Espanet, Smart Mater. Struct., 2020, 29, 105009 CrossRef CAS.
- D. Garcia-Gonzalez, T. Ter-Yesayants, M. A. Moreno-Mateos and M. L. Lopez-Donaire, Composites, Part B, 2023, 248, 110357 CrossRef CAS.
- H. Ye, Y. Li and T. Zhang, Soft Matter, 2021, 17, 3560–3568 RSC.
- M. A. Moreno, J. Gonzalez-Rico, M. L. Lopez-Donaire, A. Arias and D. Garcia-Gonzalez, Composites, Part B, 2021, 224, 109148 CrossRef CAS.
- D. Garcia-Gonzalez, M. A. Moreno, L. Valencia, A. Arias and D. Velasco, Composites, Part B, 2021, 215, 108796 CrossRef CAS.
- A. D. M. Charles, A. N. Rider, S. A. Brown and C. H. Wang, Composites, Part B, 2020, 196, 108091 CrossRef CAS.
- M. Asadi Khanouki, R. Sedaghati and M. Hemmatian, Composites, Part B, 2019, 176, 107311 CrossRef CAS.
- H. Vatandoost, M. Hemmatian, R. Sedaghati and S. Rakheja, Composites, Part B, 2020, 182, 107648 CrossRef CAS.
- A. Dargahi, R. Sedaghati and S. Rakheja, Composites, Part B, 2019, 159, 269–283 CrossRef CAS.
- S. Jin, J. Yang, S. Sun, L. Deng, Z. Chen, L. Gong, H. Du and W. Li, Journal of Infrastructure Intelligence and Resilience, 2023, 100039 CrossRef.
- D. Leng, Z. Zhu, K. Xu, Y. Li and G. Liu, Applied Ocean Research, 2021, 114, 102779 CrossRef.
- M. Zhu, J. Fu, W. Li, D. Xia, S. Qi and M. Yu, Mechanical Systems and Signal Processing, 2021, 159, 107843 CrossRef.
- A. K. Bastola and L. Li, Mater. Des., 2018, 157, 431–436 CrossRef.
- D. Leng, T. Wu, G. Liu, X. Wang and L. Sun, J. Intell. Mater. Syst. Struct., 2018, 29, 2236–2248 CrossRef.
- L. Zhao, M. Yu, J. Fu, M. Zhu and B. Li, Smart Mater. Struct., 2017, 26, 047001 CrossRef.
- M. Reiche, T. I. Becker, G. V. Stepanov and K. Zimmermann, Soft Robot., 2023 DOI:10.1089/soro.2022.0106.
- E. B. Joyee and Y. Pan, Soft Robot., 2019, 6, 333–345 CrossRef PubMed.
- J. Chavez, V. Böhm, T. I. Becker, S. Gast, I. Zeidis and K. Zimmermann, Actuators based on a controlled particle-matrix interaction in magnetic hybrid materials for applications in locomotion and manipulation systems, 2021.
- D. Merkulov, D. Pelevina, V. Turkov, A. Vinogradova and V. Naletova, Acta Astronaut., 2020, 181 Search PubMed.
- Y. Kim, E. Genevriere, P. Harker, J. Choe, M. Balicki, R. W. Regenhardt, J. E. Vranic, A. A. Dmytriw, A. B. Patel and X. Zhao, Sci. Robotics, 2022, 7, eabg9907 CrossRef PubMed.
- S. Jeon, A. K. Hoshiar, K. Kim, S. Lee, E. Kim, S. Lee, J.-Y. Kim, B. J. Nelson, H.-J. Cha, B.-J. Yi and H. Choi, Soft Robotics, 2019, 6, 54–68 CrossRef PubMed.
- C. Zhou, Y. Yang, J. Wang, Q. Wu, Z. Gu, Y. Zhou, X. Liu, Y. Yang, H. Tang, Q. Ling, L. Wang and J. Zang, Nat. Commun., 2021, 12, 5072 CrossRef CAS PubMed.
- Z. Yang, H. Yang, Y. Cao, Y. Cui and L. Zhang, Adv. Intelligent Systems, 2023, 2200416, DOI:10.1002/aisy.202200416.
- L. A. Makarova, Y. A. Alekhina, D. A. Isaev, M. F. Khairullin and N. S. Perov, J. Phys. D: Appl. Phys., 2020, 54, 015003 CrossRef.
- G. Sebald, M. Nakano, M. Lallart, T. Tian, G. Diguet and J.-Y. Cavaille, Sci. Technol. Adv. Mater., 2017, 18, 766–778 CrossRef CAS PubMed.
- G. Diguet, G. Sebald, M. Nakano, M. Lallart and J.-Y. Cavaillé, Smart Mater. Struct., 2020, 29, 075017 CrossRef CAS.
- T. G. Sano, M. Pezzulla and P. M. Reis, J. Mech. Phys. Solids, 2022, 160, 104739 CrossRef.
- D. Yan, A. Abbasi and P. M. Reis, Int. J. Solids Struct., 2022, 257, 111319 CrossRef.
- Z. Ren, W. Hu, X. Dong and M. Sitti, Nat. Commun., 2019, 10, 2703 CrossRef PubMed.
- W. Zhang, S. Ahmed, S. Masters, J. Hong, Z. Ounaies and M. Frecker, J. Intell. Mater. Syst. Struct., 2018, 29, 3983–4000 CrossRef.
- L. A. Makarova, D. A. Isaev, A. S. Omelyanchik, I. A. Alekhina, M. B. Isaenko, V. V. Rodionova, Y. L. Raikher and N. S. Perov, Polymers, 2022, 14, 153 CrossRef CAS PubMed.
- P. A. Sánchez, O. V. Stolbov, S. S. Kantorovich and Y. L. Raikher, Soft Matter, 2019, 15, 7145–7158 RSC.
- P. A. Sánchez, T. Gundermann, A. Dobroserdova, S. S. Kantorovich and S. Odenbach, Soft Matter, 2018, 14, 2170–2183 RSC.
- D. Ivaneyko, V. Toshchevikov, M. Saphiannikova and G. Heinrich, Soft Matter, 2014, 10, 2213–2225 RSC.
- D. Mukherjee and K. Danas, Int. J. Solids Struct., 2022, 257, 111513 CrossRef CAS.
- M.-A. Keip and M. Rambausek, Int. J. Numer. Meth. Eng., 2016, 107, 338–360 CrossRef.
- P. Metsch, D. Romeis, K. A. Kalina, A. Raßloff, M. Saphiannikova and M. Kästner, Materials, 2021, 14, 434 CrossRef CAS PubMed.
- D. Romeis and M. Saphiannikova, J. Magn. Magn. Mater., 2023, 565, 170197 CrossRef CAS.
- S. Chougale, D. Romeis and M. Saphiannikova, Materials, 2022, 15, 645 CrossRef CAS PubMed.
- T. A. Nadzharyan, M. Shamonin and E. Y. Kramarenko, Polymers, 2022, 14, 4096 CrossRef CAS PubMed.
- J. Nanpo, M. Kawai and T. Mitsumata, Chem. Lett., 2016, 45, 785–786 CrossRef CAS.
- T. Gundermann and S. Odenbach, Smart Mater. Struct., 2014, 23, 105013 CrossRef.
- M. Schümann and S. Odenbach, J. Magn. Magn. Mater., 2017, 441, 88–92 CrossRef.
- M. Watanabe, Y. Takeda, T. Maruyama, J. Ikeda, M. Kawai and T. Mitsumata, Int. J. Mol. Sci., 2019, 20, 2879 CrossRef CAS PubMed.
- M. Schümann, T. Gundermann and S. Odenbach, Arch. Appl. Mech., 2019, 89, 77–89 CrossRef.
- A. V. Chertovich, G. V. Stepanov, E. Y. Kramarenko and A. R. Khokhlov, Macromol. Mater. Eng., 2010, 295, 336–341 CrossRef CAS.
- L. Fischer and A. M. Menzel, J. Chem. Phys., 2019, 151, 114906 CrossRef PubMed.
- S. Feng, P.-a Yang, R. Li, X. Wang, X. Huang and M. Shou, Smart Mater. Struct., 2021, 30, 025022 CrossRef CAS.
- O. V. Stolbov and Y. L. Raikher, IEEE Magn. Lett., 2022, 13, 1–5 Search PubMed.
- A. A. Snarskii, M. Shamonin and P. Yuskevich, J. Magn. Magn. Mater., 2021, 517, 167392 CrossRef CAS.
- H. Huang, H. Li and X. Peng, ACS Appl. Polym. Mater., 2023, 3737–3748, DOI:10.1021/acsapm.3c00383.
- G. Pessot, M. Schümann, T. Gundermann, S. Odenbach, H. Löwen and A. M. Menzel, J. Phys.: Condens. Matter, 2018, 30, 125101 CrossRef PubMed.
- M. Puljiz, S. Huang, K. A. Kalina, J. Nowak, S. Odenbach, M. Kästner, G. K. Auernhammer and A. M. Menzel, Soft Matter, 2018, 14, 6809–6821 RSC.
- A. M. Biller, O. V. Stolbov and Y. L. Raikher, Phys. Rev. E: Stat., Nonlinear, Soft Matter Phys., 2015, 92 Search PubMed.
- D. Romeis, V. Toshchevikov and M. Saphiannikova, Soft Matter, 2016, 12, 9364–9376, 10.1039/c6sm01798c.
- P. Metsch, K. A. Kalina, J. Brummund and M. Kästner, Arch. Appl. Mech., 2019, 89, 47–62 CrossRef.
- D. Romeis and M. Saphiannikova, Polymers, 2021, 13 Search PubMed.
- D. Romeis, S. A. Kostrov, E. Y. Kramarenko, G. V. Stepanov, M. Shamonin and M. Saphiannikova, Soft Matter, 2020, 16 Search PubMed.
- D. Ivaneyko, V. Toshchevikov, M. Saphiannikova and G. Heinrich, Soft Matter, 2014, 10, 2213–2225 RSC.
- J. A. Osborn, Phys. Rev., 1945, 67, 351, DOI:10.1103/PhysRev.67.351.
- M. Zhu, S. Qi, Y. Xie, R. Li, X. Li, P. Yang, K. Bastola, M. Paudel, L. Li, T. Gundermann and S. Odenbach, Smart Mater. Struct., 2014, 23, 105013 CrossRef.
- S. Chougale, D. Romeis and M. Saphiannikova, Materials, 2022, 15, 645 CrossRef CAS PubMed.
- O. Stolbov and Y. Raikher, Polymers, 2020, 12, 2933, DOI:10.3390/polym12122933.
- V. Lefèvre, K. Danas and O. Lopez-Pamies, J. Mech. Phys. Solids, 2017, 107, 343–364, DOI:10.1016/j.jmps.2017.06.017.
- S. Torquato, Random Heterogeneous Materials - Microstructure and Macrostructure Properties, 2002, vol. 16 Search PubMed.
- A. A. Snarskii, M. Shamonin and P. Yuskevich, Materials, 2020, 13 Search PubMed.
- T. A. Vilgis, G. Heinrich and M. Klüppel, Reinforcement of polymer nano-composites: theory, experiments and applications, Cambridge University Press, 2009 Search PubMed.
- B. U. Felderhof and P. L. Iske, Phys. Rev. A, 1992, 45, 611–617 CrossRef CAS PubMed.
- C. Bellan and G. Bossis, Int. J. Mod. Phys. B, 2002, 16, 2447–2453, DOI:10.1142/s0217979202012499.
- A. Stoll, M. Mayer, G. J. Monkman and M. Shamonin, J. Appl. Polym. Sci., 2014, 131 Search PubMed.
| This journal is © The Royal Society of Chemistry 2023 |

