
 Open Access Article
 This Open Access Article is licensed under a Creative Commons Attribution-Non Commercial 3.0 Unported Licence
Motility-induced shear thickening in dense colloidal suspensions†
A. Gülce
Bayram
 a,
Fabian Jan
Schwarzendahl
b,
Hartmut
Löwen
b and
Luca
Biancofiore
*ac
a,
Fabian Jan
Schwarzendahl
b,
Hartmut
Löwen
b and
Luca
Biancofiore
*ac
aFluidFrame Lab, Department of Mechanical Engineering, Bilkent University, Çankaya, 06800 Ankara, Turkey. E-mail: gulce.bayram@bilkent.edu.tr; luca@bilkent.edu.tr
bInstitut für Theoretische Physik II: Weiche Materie, Heinrich-Heine-Universität Düsseldorf, 40225 Düsseldorf, Germany. E-mail: fabian.schwarzendahl@hhu.de; hlowen@hhu.de
cDepartment of Mechanical Engineering, Imperial College London, SW7 2AZ, UK
First published on 7th June 2023
Abstract
Phase transitions and collective dynamics of active colloidal suspensions are fascinating topics in soft matter physics, particularly for out-of-equilibrium systems, which can lead to rich rheological behaviours in the presence of steady shear flow. Here the role of self-propulsion in the rheological response of a dense colloidal suspension is investigated by using particle-resolved Brownian dynamics simulations. First, the combined effect of activity and shear in the solid on the disordering transition of the suspension is analyzed. While both self-propulsion and shear destroy order and melt the system if critical values are exceeded, self-propulsion largely lowers the stress barrier needed to be overcome during the transition. We further explore the rheological response of the active sheared system once a steady state is reached. While passive suspensions show a solid-like behaviour, turning on particle motility fluidises the system. At low self-propulsion, the active suspension behaves in the steady state as a shear-thinning fluid. Increasing the self-propulsion changes the behaviour of the liquid from shear-thinning to shear-thickening. We attribute this to clustering in the sheared suspensions induced by motility. This new phenomenon of motility-induced shear thickening (MIST) can be used to tailor the rheological response of colloidal suspensions.
1 Introduction
During the last decade, active matter has become a topic of intense research.1,2 In particular, active colloids have been investigated3 since they provide a well-controlled testing ground for out-of-equilibrium systems. Experimentally, one among many realizations of active particles is active Janus colloids,3 which can show fascinating phenomena such as motility-induced phase separation,4,5 vortex formation,6 clustering induced by hydrodynamic fluxes7 or wall accumulation.8–10 Dense suspensions of active particles have been realized and studied experimentally for Janus colloids,11 for vibrated active disks12,13 and theoretically.14–16 Active particles that are in a glassy state17 have given insights into random close packing18 and it has been shown that shearing an active glass former leads to ordering.19 However, the rheological properties of dense active colloids are largely unknown.On the side of biological microswimmers, such as bacteria or microalgae, it has been shown that the presence of a small fraction of active swimmers in a fluid medium can fundamentally change the fluid's rheological properties. It was found experimentally that pusher-type swimmers such as the bacterium Escherichia coli reduce the effective viscosity20–24 while puller-type swimmers such as the microalgae Chlamydomonas reinhardtii can increase the viscosity.25 This response to the swimming behavior has also been explained in theoretical and numerical studies.26–33 Further, the rheological properties of active fluids, that can model driven microtubules or active acting filaments, have been computed using field theoretical approaches.33–36
Here, we investigate the rheological properties of dense active colloids in two spatial dimensions using Brownian dynamics computer simulations. Note that colloidal particles in our model are different from biological microswimmers which typically use their limbs to swim via mechanical motion which gives rise to long-range hydrodynamic interactions. Colloidal particles are moving in a self-generated gradient and in many cases, their hydrodynamic interactions are much smaller.37 Investigating the strain–stress curves shows that activity reduces and even destroys the stress barrier that a shear flow has to overcome to fluidise the system. In the steady state, the system's shear stress reveals that particle motility fundamentally changes the rheological properties of the system: at none or low activity the system is shear thinning, for intermediate activities it becomes Newtonian and at very high activity it is shear thickening (Fig. 1). The shear thickening behaviour is induced by particle clusters that stem from the active motion of the particles. Therefore we refer to this new phenomenon as motility-induced shear thickening (MIST). In fact, MIST is somehow a consequence of motility-induced phase separation (MIPS)4,5 in the bulk which shows a pre-clustering in the one-fluid phase even before full phase separation is reached. These clusters are responsible for the shear-thickening under shear. The full rheological response is further well characterized using a Herschel–Bulkley model for the stress as a function of the shear rate, which shows the continuous transition from shear thinning to shear thickening as the activity is increased. Therefore the rheological behaviour can be tuned by activity.
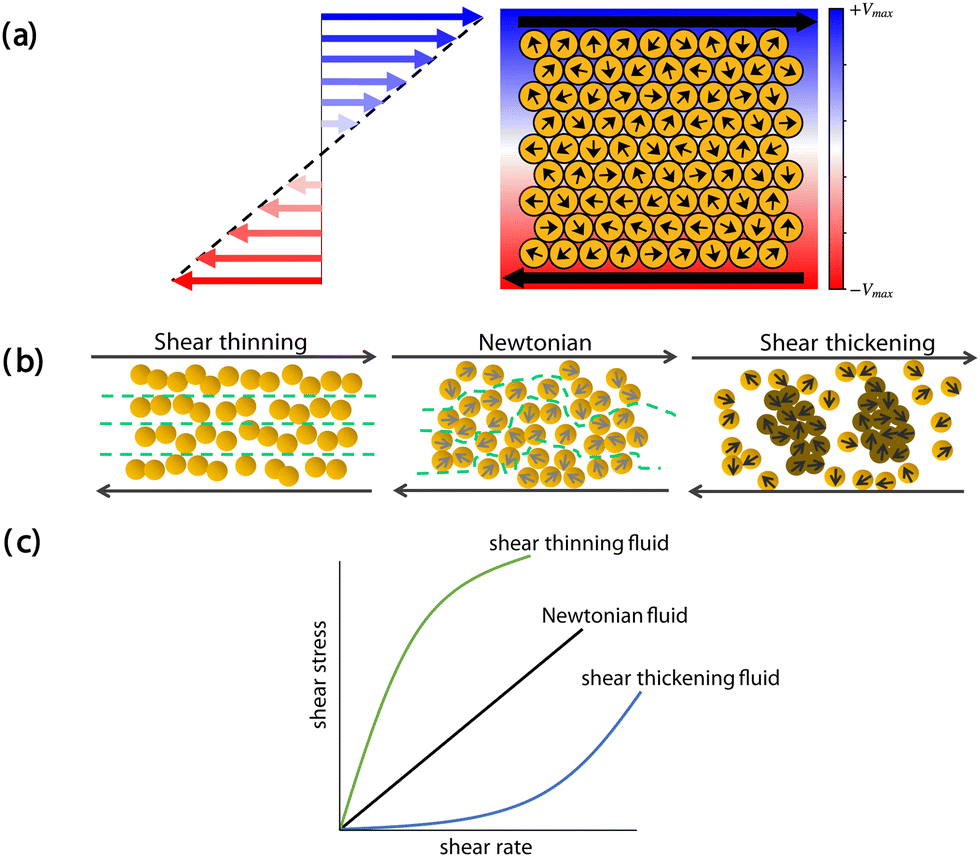 | ||
| Fig. 1 Schematic representations of (a) the sheared active colloidal suspensions (the colour bar represents the distribution of shear force throughout the computational box), (b) the expected particle arrangements in different fluids, (c) shear stress–shear rate curve for different fluids. | ||
2 Simulation method
We study a suspension of N self-propelled particles moving in two spatial dimensions under shear flow, Fig. 1(a). In Section 2.1, we introduce the model to be used for simulating this system, including the units and parameters used in it. We then describe in Section 2.2 the observables that we measure in our simulation in order to analyse the rheological response of the system for the different self-propulsion and shear forces.2.1 Model
In two spatial dimensions, the over-damped dynamics of the colloids are modeled by active Brownian particles in the presence of a steady shear rate![[small gamma, Greek, dot above]](https://www.rsc.org/images/entities/i_char_e0a2.gif) ,
, | (1) |
 | (2) |
The self-propulsion (or motility) has a constant magnitude of v0 in the direction of a unit vector ei = (cosθi(t),sinθi(t)) for particle i. The orientation angle θi changes diffusively through ηi, which is a Gaussian white noise with zero mean 〈ηi(t)〉 = 0 and variance 〈ηi(t)ηi(t′)〉 = 2Drδijδ(t − t′). The rotational diffusion coefficient Dr controls the strength of the rotational fluctuations. Additionally, the second term on the right-hand side of eqn (2) takes into account the effect of shear on the rotational motion of an isolated particle under shear flow.38 Hydrodynamic interactions between the colloids are neglected.
The colloidal particles interact via a repulsive Yukawa potential
 | (3) |
We perform steady shear simulations for different number densities ρN = N/Ω, the ratio of number of particles and the system area Ω = LxLy, with periodic boundary conditions, schematically shown in Fig. 1(a). The dimensions of the rectangular computational box are chosen as Lx,Ly = (120a,104a). Three different numbers of particles N = 14![[thin space (1/6-em)]](https://www.rsc.org/images/entities/char_2009.gif) 400, 10368 and 8448 are used in the simulations corresponding to three different reduced number densities of ρNa2 = 0.68, 0.83, 1.15. The bare potential strength is fixed to U0 = 800kBT and the simulations are started from a hexagonal crystal configuration of the particles. Further, a soft potential with the screening parameter λ = 3.5 is chosen. The time step for the evolution of the particle positions is Δt = 0.0001τ0, with the natural unit of time τ0 = a2/D0. The colloid–colloid pairwise interactions are cut off at an inter-particle distance of 2a and the rotational diffusion coefficient is Dr = 3.5τ0−1. After an initial relaxation time of t = 0.4τ0, shear is imposed.
400, 10368 and 8448 are used in the simulations corresponding to three different reduced number densities of ρNa2 = 0.68, 0.83, 1.15. The bare potential strength is fixed to U0 = 800kBT and the simulations are started from a hexagonal crystal configuration of the particles. Further, a soft potential with the screening parameter λ = 3.5 is chosen. The time step for the evolution of the particle positions is Δt = 0.0001τ0, with the natural unit of time τ0 = a2/D0. The colloid–colloid pairwise interactions are cut off at an inter-particle distance of 2a and the rotational diffusion coefficient is Dr = 3.5τ0−1. After an initial relaxation time of t = 0.4τ0, shear is imposed.
2.2 Measured quantities
The shear stress, which is the off-diagonal component of the stress tensor, is measured by | (4) |
(1) First, the imposed shear rate is given by the shear Peclet number, Pes = a2/D0, which measures the ratio of the shear force to thermal fluctuations.
(2) The second dimensionless number is the active Peclet number, Pea = v0a/D0, which measures the ratio between the self-propulsion force (or the motility strength) and thermal fluctuations.
The magnitudes of the dimensionless numbers considered here are Pea ∈ [0,150] for the active Peclet number and Pes ∈ [0,40] for the shear Peclet number.
The structural changes in the system are monitored by two-dimensional bond orientational order parameters,41
 | (5) |
 is the set of ν nearest neighbour particles of the ith particle and θij is the angle between the bond vector pointing from particle i to j and horizontal fixed axis. For ν = 6 the order parameter is the hexatic order parameter ψ6, which is close to zero in the disordered phase whereas it equals 1 in a perfect hexagonal crystal. Similarly, we also analyse the tetratic orientational order by using ψ4.
3 Results
3.1 Melting by the combined action of shear and activity
Our particular interest is the characterization of self-propelled particles in the dense regime, ρNa2 = 1.15. We first analyze the instantaneous shear–stress-relation, i.e. the relation between σxy and the imposed strain (γ =t), at a constant shear rate Pes = 20 for different self-propulsions. In parallel, we also monitor the bond-orientational order parameters of the system. We note that the results represented here show the system behaviour starting immediately from the time we impose the shearing force (t = 0.4τ0).
In the absence of particle motility (Pea = 0), the system starting out of the perfect hexagonal crystal stays in this solid-like phase during the relaxation, as documented in Fig. 2 snapshot(1). When shearing is turned on thereafter, shear stress starts building up to a peak value, i.e., point (2) in Fig. 2(a) which brings the system to the onset of melting. At this point, the system is not disordered yet and we discuss this structural transition in detail later on. Here, this nearly linear increase in the shear stress represents that the system response is nearly elastic at low strains. Further accumulation of the strain melts the crystal and, accordingly, causes a release of stress due to structural relaxation. This brings the system to a strain-independent plateau at higher strains. We can associate this best with the shear-induced disordering transition where the equilibrium melting transition is displaced by the imposed shear rate.42–44
 | ||
| Fig. 2 (Left) Snapshots of particle configurations for (1) solid-like, (2) cubic-like and (3) liquid-like phases of the passive system, in which the system conditions correspond to the numbered black dots in the plots: (a) the instantaneous shear stress (σxy) with respect to strain (γ = t) for passive (Pea = 0) and active systems (Pea > 0) at a constant shear rate Pes = 20. The corresponding structural changes throughout the bond orientational order parameters, ψ6 (b) and ψ4 (c). The black dotted-horizontal line defines the position of structural transition for the hexagonal configuration, ψ6 ≈ 0.45.14 The inset in (c) shows the representation of the zig-zag motion of a colloidal particle under shear. A colloidal particle follows a zig-zag-like trajectory (black dashed line) while moving to the right direction over the particle layer underneath due to the imposed shear. | ||
Moreover, the self-propulsion helps to cause a preliminary melting, which appears as a decrease in ψ6 during the relaxation of the system. This fastens the hexagonal-liquid transition and consequently decreases the stress barrier, which is defined by the shear stress peak. Much higher activities (Pea ≥ 30) melt the crystal entirely even before imposing the shear rate, thereby annihilating the stress barrier. After that, the colloidal suspension is disordered and its behaviour is liquid-like [in Fig. 2 snapshot(3)]. In the latter case, the equilibrium melting transition is significantly displaced by self-propulsion and melting is thus expected for the parameters used to define the colloidal interactions.14,45–47
Points (2) in Fig. 2(a) and (b) together reveal that the stress peak appears just before the drop of ψ6 below the structural transition, ψ6 = 0.45.14 In fact, the solid-to-liquid transition is not direct throughout this barrier but rather occurs via a structural rearrangement [Fig. 2 snapshot(2)]. The zigzag motion of the particles, which emerges by their alternating motion in one layer between filling the grooves of the next layer and hopping up from there,48,49 temporarily gives a rise in ψ4 [see Fig. 2(c)]. We might expect this increase of ψ4 at first sight when we look at the arrangement of particles in the snapshot (2). Additionally, even in the liquid regime below ψ6 < 0.45, where the shear melts the crystal as a whole, some ordered regions show up at times due to this zig-zag motion of the particles in subsequent layers [see the ESI,† Movie_Passive_Pes20.mp4]. This is similar to what was observed by Wu et al.50 in melting passive colloidal suspensions under shear. Although these ordered structures give rise to local increases in the hexagonal order parameter in the passive system below the structural transition line [see Fig. 2(b)], the self-propulsion destroys these local ordered structures, resulting in zero ψ6.
Furthermore, we see that the subsequent melting first starts with local disruptions of the ordered structures, similar to the so-called interstitial defects44 observed in purely shear-induced disordering. For the passive suspension at the shear rate Pes = 20, we see that the suspension is able to restore the defect at one region while creating another one at another region. Therefore, the defects are not able to grow and the system stays in a solid-like regime. On the other hand, in an active suspension the interstitial defects can grow and spread around the domain due to the effect of self-propulsion [see the comparison with the defects in the passive suspension using Voronoi diagrams in the ESI,† Fig. S1], resulting at the end in the enhanced melting of the system [see the ESI,† (i) Section 1.2 and (ii) Movie_Pea20_ interstitialdefects.mp4].
3.2 Motility-induced shear thickening (MIST) and shear thinning
We now consider the liquid regime and discuss the time-averaged shear stress![[small sigma, Greek, macron]](https://www.rsc.org/images/entities/i_char_e0d2.gif) xy with respect to the imposed shear rate [see in Fig. 3(a)], which yields the rheology of the active colloidal suspensions. Note that the shear stress data are time averaged over the steady state time frame corresponding to the strain-independent plateau of the stress and the minimum shear rate is Pes = 1 in Fig. 3(a).
xy with respect to the imposed shear rate [see in Fig. 3(a)], which yields the rheology of the active colloidal suspensions. Note that the shear stress data are time averaged over the steady state time frame corresponding to the strain-independent plateau of the stress and the minimum shear rate is Pes = 1 in Fig. 3(a).
 | ||
| Fig. 3 (Top) Snapshots of particle configurations: (1) solid-like, (2) shear-thinning, (3) Newtonian and (4) shear-thickening, where the particles are coloured with respect to their number of surrounding particles (Nsp). (a) Nondimensional shear stress xy – shear rate curves for Pes ≥ 1 at different self-propulsion forces. (b) Liquid-like regime shown in log–log scale where the Herschel–Bulkley model fitting has been applied is indicated by the fitting lines for different rheological behaviours with respect to the corresponding power indexes (n). The numbered black dots represent the conditions of the simulations where the snapshots are taken. The corresponding viscosity curves are shown in the ESI,† Section 1.4. | ||
We use the common Herschel–Bulkley model51 to quantify the possible non-Newtonian behaviour where σxy = σ0 + Kn with σ0 representing the yield stress. A shear thinning liquid is characterized by power indexes n < 1, while for a shear thickening liquid n > 1. As a special case, n = 1 represents the classical Newtonian liquid. In Fig. 3(b) we fit our stress–shear rate simulation data for different activities to this model. Thereby, we explore the effect of the self-propulsion on the rheological response of the system. Here, we analyse the active colloidal suspensions starting with Pea ≥ 40 where the suspension is entirely in a liquid phase with ψ6 = 0. For the passive and low activity (i.e., Pea = 10) cases, the suspension has still local crystals meaning that ![[small psi, Greek, macron]](https://www.rsc.org/images/entities/i_char_e0d9.gif) 6 cannot reach zero [see the ESI,† Section 1.3 and Fig. S2]. In these cases, we cannot apply the Herschel–Buckley model if 6 > 0 since the rheology of the suspension becomes more complex, allowing plateau or non-monotonic behaviour in the shear stress versus strain rate curve. Moreover we follow up the structural changes by the number of surrounding particles Nsp, which is the number of particles counted inside the surrounding circle with a radius rsurr/a = 3 for every particle individually [see the top snapshots in Fig. 3]. In this way, we better distinguish the occurrence of clustering and, accordingly, the onset of shear thickening in the system with increasing self-propulsion strength.
6 cannot reach zero [see the ESI,† Section 1.3 and Fig. S2]. In these cases, we cannot apply the Herschel–Buckley model if 6 > 0 since the rheology of the suspension becomes more complex, allowing plateau or non-monotonic behaviour in the shear stress versus strain rate curve. Moreover we follow up the structural changes by the number of surrounding particles Nsp, which is the number of particles counted inside the surrounding circle with a radius rsurr/a = 3 for every particle individually [see the top snapshots in Fig. 3]. In this way, we better distinguish the occurrence of clustering and, accordingly, the onset of shear thickening in the system with increasing self-propulsion strength.
The passive system, initially in the crystalline phase, does not melt at very low shear rates (Pes < 2.5) and shows solid-like behaviour [Fig. 3(1)] with non-zero yield stress 0a3/kBT ≈ 4, see Fig. 3(a). This is in line with what Chen and Zukoski demonstrated for passive ordered suspensions.48 Here, thermal fluctuations are responsible for the motion of colloids. At this solid regime, we see that turning on the activity diminishes the yield stress. In addition to weak activities, the hexagonal order in the system can be destroyed by more effective shearing, above the so-called critical shear rate.44,52 However, we note that in these weak activities, the phase transition of the suspension is not fully completed because shear can also induce ordering, which is known as a flow-induced crystallization phenomenon in colloidal suspensions.53,54 On the other hand, activities Pea > 30 eliminate the solid-like behaviour giving 0 = 0, since the hexatic-to-liquid transition is already reached by activity [see again in Fig. 2(b)]. Thereafter, the resulting melt starts behaving as a shear-thinning liquid which is a non-Newtonian behaviour characterized by the slopes lower than 1 (n < 1), see point (2) in Fig. 3(b). Here, the shear force has control over the motion of the particles and yields sliding layers of particles aligned in the direction of shear flow [snapshot 2 in Fig. 3]. Indeed, this layered flow, which is also discussed in Section 3.1, has been previously found as being intrinsic to the shear thinning behaviour of passive Brownian colloidal suspensions.48,55,56 Moreover, local ordered regions are temporarily observed as a result of the zig-zag motion of colloids, which is also a shear-induced ordering phenomenon seen in 2D shear-thinning colloidal suspensions.57 Although the shear thinning behaviour is relatively well understood in Brownian colloidal systems, the effect of self-propulsion has not been addressed. We observe that activities up to Pea ≈ 80 assist only the shear in melting the system, while the resulting melt maintains the same shear-thinning behaviour observed for passive suspensions [see the ESI,† Movie_shearthinning.mp4].
Interestingly, we find that increasing the self-propulsion force triggers the rheological response of the suspension and changes qualitatively the behaviour albeit in a smooth way. At moderate motilities, Pea ≈ 90, the fluid behaviour is not shear-thinning, but Newtonian, corresponding to the curves (3) with an exponent n = 1 in Fig. 3(a) and (b). In this regime, self-propulsion degrades the stability of layered flow and the suspension becomes completely disordered, see snapshot (3) in Fig. 3, [also see the ESI,† Movie_Newtonian.mp4]. Similar to the mechanism discussed in Section 3.1, some of the interstitial defects appeared in the shear-thinning liquid which spread with increasing self-propulsion, being responsible for the loss of thinning.
Above Pea ≈ 100, we observe that the self-propulsion starts dominating over shear and reveals structural heterogeneities in the system, leading to transient cluster formation as shown by the snapshot (4) in Fig. 3, [also see the ESI,† Movie_shearthickening.mp4]. In this case, the slope of shear stress–shear rate curves exceeds 1 [see (4) in Fig. 3(b)], meaning that the suspension changes crossover from Newtonian to shear thickening behaviour. Here, we also observe that the colloidal suspension starts showing clusters even before imposing a shear to the system, which is expected for active particles in this parameter regime58 [see the ESI,† at the beginning of Movie_shearthickening.mp4 in the absence of shear]. However, we found that these clusters enable the system to behave as a shear-thickening fluid when the system is forced to flow. Therefore, we refer to this behaviour as motility-induced shear thickening (MIST) in some analogy to motility-induced phase separation (MIPS). In fact, the cluster formation generating MIST is a precursor of MIPS, which has been seen starting at a critical self-propulsion of about Pea,cr ≈ 90. Additionally, especially for this behaviour, we observe visually that the number of surrounding particles Nsp remarkably differs from region to region in the system [see snapshot (4) in Fig. 3].
The shear thinning-to-thickening transition has been attained for years in passive colloidal suspensions with very high shear rates (Pes > 100), by underlining similar cluster formations in the shear-thickening fluid due to the hydrodynamic interactions and lubrication forces.49,59–61 In this study, instead, we could reach this transition by keeping the range of shear rate constant at relatively low values, while increasing the activity of colloids, with neglecting hydrodynamic interactions. In this work, the cluster formation is not triggered by shearing extremely the system, rather it is triggered by motility.
3.3 The effect of particle density
Next, we analysed the stress–shear rate curves for the suspensions with two lower particle densities, a semi-dilute suspension ρNa2 = 0.83, and a dilute suspension ρNa2 = 0.68, respectively, achieved by lowering the number of particles in the simulation box while keeping all other parameters the same. Obviously, lowering the density creates more disorder in general. Thus, the solid behaviour is found as limited to very small parameter ranges. Consequently, a dilute suspension shows lower yield stresses compared to the dense case at the same activities [see the ESI,† Section 1.5]. Accordingly, the system starts showing a shear thinning behaviour even with very low self-propulsion forces. Fig. 4 summarizes the trend of the power index n with increasing self-propulsion for all cases. Here, again, the exponents are obtained by fitting the shear stress/shear rate data to the power law model for these two other densities, as done for the dense system in Section 3.2. The red line in this figure, which corresponds to the dense suspension case, starts at Pea ≈ 30, since the system retains mostly solid-like behaviour below this value, followed by shear-induced disordering with increasing activity.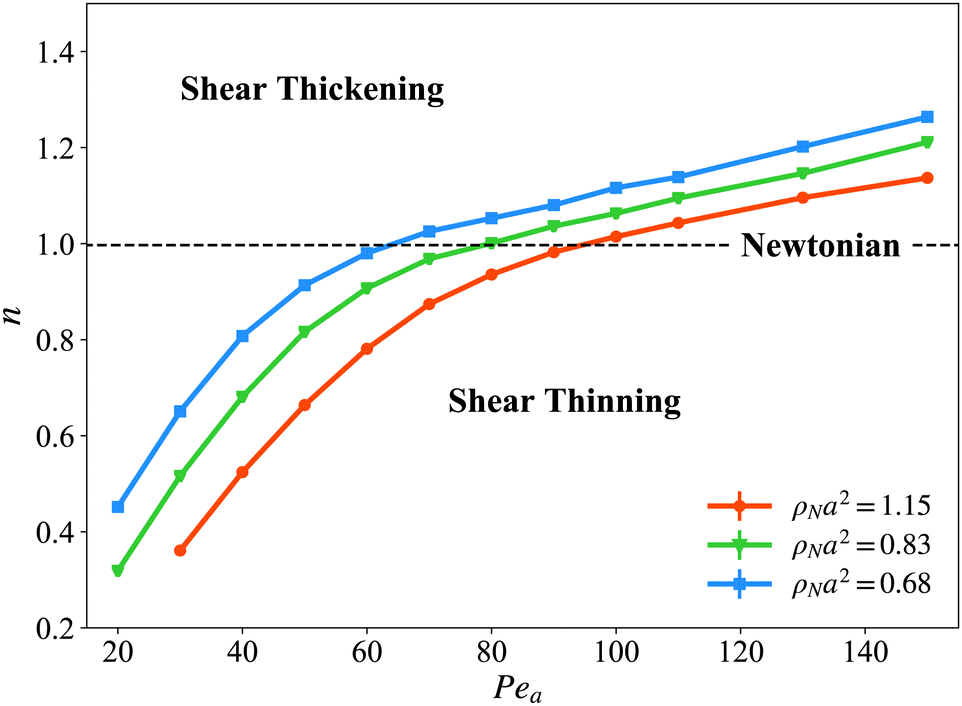 | ||
| Fig. 4 The power index n vs. the active Peclet number Pea for different particle densities. The horizontal dashed line corresponds to the Newtonian case with a slope of 1 on a log–log scale. | ||
Regarding the liquid-like regime, it is evident that the critical self-propulsion (Pea,cr) for the shear thinning to thickening transition shifts to lower activities with decreasing particle density. In other words, dilute suspensions can thicken easier than dense ones. The underlying reason for this effect can be intuitively related to clustering. Keeping the particles very close to each other, as in a dense system, obviously pronounces their collisions. Therefore, possible cluster formation becomes difficult in the system. Although some clusters are formed with these activities, they are not stable enough, such that they can be damaged by any strike from other particles around them. However, increasing the self-propulsion further promotes clustering and finally brings the system into a thickening regime. As we discussed previously, activity triggers the colloidal suspension to behave as a shear-thickening fluid. Conversely, active colloids in a dilute environment can constitute more stable clusters even with low self-propulsion due to fewer repulsive collisions coming from particles around the clusters, accordingly undergoing this thinning-to-thickening transition earlier [see Fig. 4].
This scenario is also confirmed by Fig. 5, where we report the standard deviation of the time averaged number of surrounding particles  (in which
  ) vs. the active Peclet number Pea for the three different densities. Here, to quantify the cluster formation in the liquid regime, we use Nsp since the parameters ψ4 and ψ6 are more connected to the ordered structures of the solid crystals. Typically there are more fluctuations in the surrounding particle density for dilute systems, also for weak self-propulsion forces. However, here the activity enhances dramatically (i) the local density inhomogeneities, as revealed by the strong increase of σ
![[N with combining macron]](https://www.rsc.org/images/entities/i_char_004e_0304.gif) sp with Pea, and (ii) the gap in σsp between dilute and dense systems. The motility-induced local density inhomogeneities correspond to pre-clustering which provides evidence that this is the underlying reason for the shear-thickening behaviour consistent with snapshot (4) in Fig. 3. Since this pre-clustering is more pronounced for dilute systems, the MIST transition occurs earlier in these systems confirming our previous intuitive explanation.
sp with Pea, and (ii) the gap in σsp between dilute and dense systems. The motility-induced local density inhomogeneities correspond to pre-clustering which provides evidence that this is the underlying reason for the shear-thickening behaviour consistent with snapshot (4) in Fig. 3. Since this pre-clustering is more pronounced for dilute systems, the MIST transition occurs earlier in these systems confirming our previous intuitive explanation.
 | ||
| Fig. 5 Standard deviation of the time averaged number of surrounding particles, σsp, vs. the active Peclet number Pea for different particle densities, ρNa2 = 1.15 (circle), ρNa2 = 0.83 (triangle) and ρNa2 = 0.68 (square) at Pes = 30. | ||
4 Conclusions
In this work, we have explored the effect of self-propulsion on the rheological response of the dense colloidal suspensions under steady shear by using Brownian dynamics simulations. First, the solid-to-liquid transition of the suspension was characterized, showing that activity helps to melt the systems, as shown before in literature.14,62 When melting, the self-propulsion of the colloids reduces the stress barrier that the system has to overcome in order to transition from the solid to the liquid state. Self-propulsion is not only responsible for assisting the shear in melting the colloidal suspension but also introduces a transition in the rheology of the melted suspension. Depending on the activity of colloids in the suspension, different fluid behaviours are found: shear thinning, Newtonian and shear-thickening. The underlying reason behind this response is a well-known dynamical mechanism of active colloidal particles: activity-induced clustering. When the self-propulsion is sufficiently strong to prevail against the shear, or even before shearing, a cluster formation is observed. The existence of these clusters creates additional resistance to flow when the suspension is exposed to shear, causing it to behave as a shear-thickening fluid. We referred to this as motility-induced shear-thickening in this article.The shear-thinning to thickening transition reported here is different from the transition observed in passive colloidal systems. Passive colloids tend to stick together by hydrodynamic and lubrication forces at high shear rates,60,63 while active colloids cluster due to their motility (akin to motility-induced phase separation). The simulations presented here were performed in the absence of hydrodynamic interactions. Including hydrodynamics and lubrication forces would be an interesting future avenue since hydrodynamics suppress the tendency for active particles to form clusters,64–66 while on the other hand, hydrodynamics lead to clusters of sheared passive colloids. Additionally, the rheological behaviour of the colloidal suspension at low activities is very promising and requires more detailed analyses with possibly using constitutive relationships more complex than Hershel–Buckley. Further, it would be interesting to test the response in a three-dimensional set-up or to include inertia to the active particles motion.67,68 Experimentally, the shear thinning to thickening transition could be tested using active colloids in a “washing-machine” set up.69 Finally, it would be interesting to extend our simulation to particles of more complex shape than spheres such as active polymers or active filaments,70,71 where new rheological behaviour due to active entanglements can be expected in dense solutions.
Conflicts of interest
There are no conflicts to declare.Acknowledgements
We thank Jürgen Horbach for helpful discussions. The work of A. G. B. was supported within the EU MSCA-ITN ActiveMatter (proposal no. 812780).Notes and references
- M. C. Marchetti, J.-F. Joanny, S. Ramaswamy, T. B. Liverpool, J. Prost, M. Rao and R. A. Simha, Rev. Mod. Phys., 2013, 85, 1143 CrossRef CAS.
- S. Ramaswamy, Annu. Rev. Condens. Matter Phys., 2010, 1, 323–345 CrossRef.
- C. Bechinger, R. Di Leonardo, H. Löwen, C. Reichhardt, G. Volpe and G. Volpe, Rev. Mod. Phys., 2016, 88, 045006 CrossRef.
- I. Buttinoni, J. Bialké, F. Kümmel, H. Löwen, C. Bechinger and T. Speck, Phys. Rev. Lett., 2013, 110, 238301 CrossRef PubMed.
- J. Palacci, S. Sacanna, A. P. Steinberg, D. J. Pine and P. M. Chaikin, Science, 2013, 339, 936–940 CrossRef CAS PubMed.
- A. Bricard, J.-B. Caussin, D. Das, C. Savoie, V. Chikkadi, K. Shitara, O. Chepizhko, F. Peruani, D. Saintillan and D. Bartolo, Nat. Commun., 2015, 6, 7470 CrossRef CAS PubMed.
- S. M. Mousavi, I. Kasianiuk, D. Kasyanyuk, S. K. Velu, A. Callegari, L. Biancofiore and G. Volpe, Soft Matter, 2019, 15, 5748–5759 RSC.
- N. Narinder, J. R. Gomez-Solano and C. Bechinger, New J. Phys., 2019, 21, 093058 CrossRef.
- G. Volpe, I. Buttinoni, D. Vogt, H.-J. Kümmerer and C. Bechinger, Soft Matter, 2011, 7, 8810–8815 RSC.
- C. Maggi, J. Simmchen, F. Saglimbeni, J. Katuri, M. Dipalo, F. De Angelis, S. Sanchez and R. Di Leonardo, Small, 2016, 12, 446–451 CrossRef CAS PubMed.
- N. Klongvessa, F. Ginot, C. Ybert, C. Cottin-Bizonne and M. Leocmach, Phys. Rev. E, 2019, 100, 062603 CrossRef PubMed.
- G. Briand, M. Schindler and O. Dauchot, Phys. Rev. Lett., 2018, 120, 208001 CrossRef CAS PubMed.
- G. Briand and O. Dauchot, Phys. Rev. Lett., 2016, 117, 098004 CrossRef CAS PubMed.
- J. Bialké, T. Speck and H. Löwen, Phys. Rev. Lett., 2012, 108, 168301 CrossRef PubMed.
- S. Henkes, Y. Fily and M. C. Marchetti, Phys. Rev. E: Stat., Nonlinear, Soft Matter Phys., 2011, 84, 040301 CrossRef PubMed.
- N. de Macedo Biniossek, H. Löwen, T. Voigtmann and F. Smallenburg, J. Phys.: Condens. Matter, 2018, 30, 074001 CrossRef CAS PubMed.
- L. M. C. Janssen, J. Phys.: Condens. Matter, 2019, 31, 503002 CrossRef CAS PubMed.
- R. Ni, M. A. C. Stuart and M. Dijkstra, Nat. Commun., 2013, 4, 2704 CrossRef PubMed.
- R. Mandal and P. Sollich, Proc. Natl. Acad. Sci. U. S. A., 2021, 118, e2101964118 CrossRef CAS PubMed.
- A. Sokolov and I. S. Aranson, Phys. Rev. Lett., 2009, 103, 148101 CrossRef PubMed.
- J. Gachelin, G. Mino, H. Berthet, A. Lindner, A. Rousselet and É. Clément, Phys. Rev. Lett., 2013, 110, 268103 CrossRef PubMed.
- H. M. López, J. Gachelin, C. Douarche, H. Auradou and E. Clément, Phys. Rev. Lett., 2015, 115, 028301 CrossRef PubMed.
- Z. Liu, K. Zhang and X. Cheng, Rheol. Acta, 2019, 58, 439–451 CrossRef CAS.
- V. A. Martinez, E. Clément, J. Arlt, C. Douarche, A. Dawson, J. Schwarz-Linek, A. K. Creppy, V. Škultéty, A. N. Morozov and H. Auradou, et al. , Proc. Natl. Acad. Sci. U. S. A., 2020, 117, 2326–2331 CrossRef CAS PubMed.
- S. Rafa, L. Jibuti and P. Peyla, Phys. Rev. Lett., 2010, 104, 098102 CrossRef PubMed.
- T. Ishikawa and T. Pedley, J. Fluid Mech., 2007, 588, 399–435 CrossRef.
- B. M. Haines, A. Sokolov, I. S. Aranson, L. Berlyand and D. A. Karpeev, Phys. Rev. E: Stat., Nonlinear, Soft Matter Phys., 2009, 80, 041922 CrossRef PubMed.
- D. Saintillan, Exp. Mech., 2010, 50, 1275–1281 CrossRef.
- S. D. Ryan, B. M. Haines, L. Berlyand, F. Ziebert and I. S. Aranson, Phys. Rev. E: Stat., Nonlinear, Soft Matter Phys., 2011, 83, 050904 CrossRef PubMed.
- M. Moradi and A. Najafi, EPL, 2015, 109, 24001 CrossRef.
- T. M. Bechtel and A. S. Khair, Rheol. Acta, 2017, 56, 149–160 CrossRef CAS.
- H. Hayano and A. Furukawa, Phys. Rev. Lett., 2022, 4, 043091 CAS.
- M. Cates, S. Fielding, D. Marenduzzo, E. Orlandini and J. Yeomans, Phys. Rev. Lett., 2008, 101, 068102 CrossRef CAS PubMed.
- Y. Hatwalne, S. Ramaswamy, M. Rao and R. A. Simha, Phys. Rev. Lett., 2004, 92, 118101 CrossRef PubMed.
- L. Giomi, T. B. Liverpool and M. C. Marchetti, Phys. Rev. E: Stat., Nonlinear, Soft Matter Phys., 2010, 81, 051908 CrossRef PubMed.
- A. Loisy, A. P. Thompson, J. Eggers and T. B. Liverpool, J. Chem. Phys., 2019, 150, 104902 CrossRef PubMed.
- B. Liebchen and H. Löwen, J. Chem. Phys., 2019, 150, 061102 CrossRef PubMed.
- J. K. Dhont, An Introduction to Dynamics of Colloids, Elsevier, 1996 Search PubMed.
- H. Löwen, J. Phys.: Condens. Matter, 1992, 4, 10105 CrossRef.
- H. Löwen and G. Szamel, J. Phys.: Condens. Matter, 1993, 5, 2295 CrossRef.
- P. J. Steinhardt, D. R. Nelson and M. Ronchetti, Phys. Rev. B: Condens. Matter Mater. Phys., 1983, 28, 784 CrossRef CAS.
- B. J. Ackerson and N. A. Clark, Phys. Rev. Lett., 1981, 46, 123 CrossRef CAS.
- P. Holmqvist, M. Lettinga, J. Buitenhuis and J. K. Dhont, Langmuir, 2005, 21, 10976–10982 CrossRef CAS PubMed.
- S. Butler and P. Harrowell, J. Chem. Phys., 1995, 103, 4653–4671 CrossRef CAS.
- J. U. Klamser, S. C. Kapfer and W. Krauth, Nat. Commun., 2018, 9, 5045 CrossRef PubMed.
- L. Berthier, Phys. Rev. Lett., 2014, 112, 220602 CrossRef PubMed.
- Y. Fily, S. Henkes and M. C. Marchetti, Soft Matter, 2014, 10, 2132–2140 RSC.
- L. Chen and C. Zukoski, Phys. Rev. Lett., 1990, 65, 44 CrossRef CAS PubMed.
- R. L. Hoffman, J. Rheol., 1998, 42, 111–123 CrossRef CAS.
- Y. L. Wu, D. Derks, A. van Blaaderen and A. Imhof, Proc. Natl. Acad. Sci. U. S. A., 2009, 106, 10564–10569 CrossRef CAS PubMed.
- P. Saramito, Complex fluids, Springer, 2016 Search PubMed.
- S. Butler and P. Harrowell, Phys. Rev. E: Stat., Nonlinear, Soft Matter Phys., 1995, 52, 6424 CrossRef CAS PubMed.
- L. T. Shereda, R. G. Larson and M. J. Solomon, Phys. Rev. Lett., 2010, 105, 228302 CrossRef PubMed.
- L. T. Shereda, R. G. Larson and M. J. Solomon, Korea Aust. Rheol. J., 2010, 22, 309–316 Search PubMed.
- L. Chen, B. Ackerson and C. Zukoski, J. Rheol., 1994, 38, 193–216 CrossRef CAS.
- G. Wilemski, J. Stat. Phys., 1991, 62, 1239–1253 CrossRef.
- B. J. Ackerson and P. Pusey, Phys. Rev. Lett., 1988, 61, 1033 CrossRef CAS PubMed.
- P. Digregorio, D. Levis, A. Suma, L. F. Cugliandolo, G. Gonnella and I. Pagonabarraga, Phys. Rev. Lett., 2018, 121, 098003 CrossRef CAS PubMed.
- G. Bossis and J. Brady, J. Chem. Phys., 1989, 91, 1866–1874 CrossRef CAS.
- E. Brown and H. M. Jaeger, Rep. Prog. Phys., 2014, 77, 046602 CrossRef PubMed.
- T. Lorenzo and L. Marco, J. Colloid Interface Sci., 2022, 624, 637–649 CrossRef CAS PubMed.
- S. Li, H. Jiang and Z. Hou, Soft Matter, 2015, 11, 5712–5718 RSC.
- N. J. Wagner and J. F. Brady, Phys. Today, 2009, 62, 27–32 CrossRef CAS.
- R. M. Navarro and S. M. Fielding, Soft Matter, 2015, 11, 7525–7546 RSC.
- M. Theers, E. Westphal, K. Qi, R. G. Winkler and G. Gompper, Soft Matter, 2018, 14, 8590–8603 RSC.
- R. Matas-Navarro, R. Golestanian, T. B. Liverpool and S. M. Fielding, Phys. Rev. E: Stat., Nonlinear, Soft Matter Phys., 2014, 90, 032304 CrossRef PubMed.
- C. G. Wagner, M. F. Hagan and A. Baskaran, Phys. Rev. E, 2019, 100, 042610 CrossRef CAS PubMed.
- H. Löwen, J. Chem. Phys., 2020, 152, 040901 CrossRef PubMed.
- I. Williams, E. C. Oğuz, H. Löwen, W. C. Poon and C. P. Royall, J. Chem. Phys., 2022, 156, 184902 CrossRef CAS PubMed.
- A. Kaiser, S. Babel, B. ten Hagen, C. von Ferber and H. Löwen, J. Chem. Phys., 2015, 142, 124905 CrossRef PubMed.
- R. G. Winkler and G. Gompper, J. Chem. Phys., 2020, 153, 040901 CrossRef CAS PubMed.
Footnote |
| † Electronic supplementary information (ESI) available: Movies of colloidal suspensions under shear flow. See DOI: https://doi.org/10.1039/d3sm00035d |
| This journal is © The Royal Society of Chemistry 2023 |