 Open Access Article
Structuration and deformation of colloidal hydrogels
S.
N'Mar
 *a,
L.
Pauchard
 a,
P.
Guenoun
 b,
J. P.
Renault
b and
F.
Giorgiutti-Dauphiné
 a
a
aUniversité Paris-Saclay, CNRS, FAST, 91405, Orsay, France. E-mail: souhaila.nmar@universite-paris-saclay.fr
bUniversité Paris Saclay, UMR CEA-CNRS NIMBE, Laboratoire LIONS, CEA Saclay, Saint-Aubin, France
First published on 11th April 2023
Abstract
The aim of the present paper is to determine the optimum conditions for the formation of homogeneous colloidal silica hydrogels by aggregation and drying processes, avoiding mechanical instabilities at the surface. Aggregation is controlled by adding monovalent salt to the silica nano-particle suspension while the drying of the sol is also modulated by changing the evaporation rate. A phase diagram reveals two regions in the parameter plane, ionic strength versus evaporation rate: a region where the drop undergoes an isotropic shrinkage and forms the required homogeneous gel and a region where mechanical instabilities appear due to the formation of a solid skin at the gel surface. The frontier between these two regions can be determined by equating the following two characteristic times: the gelation time and the time for skin formation. Permeability measurements of the final gel provide an estimate of the drying stress which is compared to the yield stress of the material. In accordance with the determined phase diagram, our study shows that instabilities appear when the drying stress is larger than the yield stress.
1 Introduction
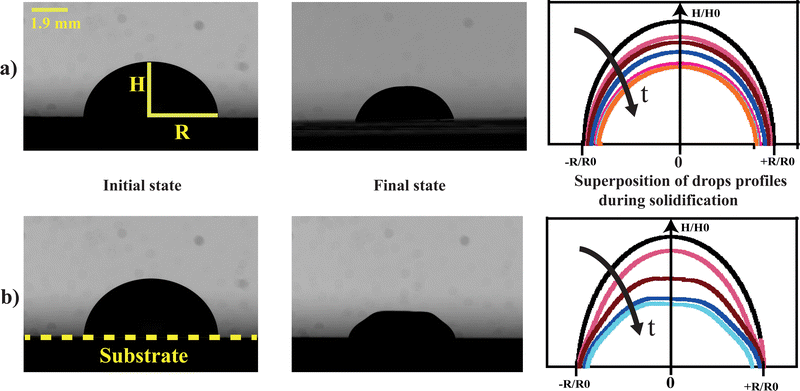
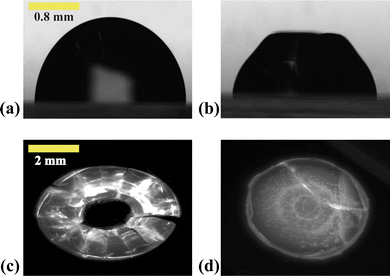
Hydrogels are three-dimensional elastic materials generally based on cross-linked polymers. They are characterized by strong porosity and thus constitute solvent reservoirs which can absorb or release solvent when they are subject to external stimuli. Due to these properties, these materials offer various potential applications which go from biomedical applications to water purification techniques.1 In particular, hydrogels are used in the field of super-absorbents and depollutants (by absorption of heavy metals or inorganic molecules).2 Biomedical applications of hydrogels are being studied for their potential use in drug release systems,3 or biomimetic fabrics.4 In order to be implemented in practice,5 these materials must have certain mechanical properties: they should deform reversibly and undergo different deformation cycles due to swelling or shrinking. Moreover, they should have a high resistance to cracking. The mechanical behavior of these soft materials is currently an important research area and several groups6–10 have proposed strategies to improve their mechanical properties; for example, reducing heterogeneities in the network in order to reduce nucleating centers for cracks or enhancing the energy dissipation during crack propagation.11,12 Most hydrogels are chemical hydrogels as they are formed through covalent bonding which implies sophisticated chemistry. Here we focus on silica nanoparticle hydrogels classified as physical gels which can undergo transition from a liquid to a gel phase when triggered by environmental changes such as pH, temperature, mixing of two components, or ionic concentration.13 Hereafter, we focus on physical hydrogels made exclusively of silica nanoparticles.14Our purpose is to precisely determine the conditions which make it possible to form a mechanically homogeneous silica colloidal hydrogels for potential future biomedical applications. During the formation of the gel from the liquid solution, two physical mechanisms are at work: drying and aggregation due to inter-particulate interaction processes. The aim is then to determine in which range of values of the physical parameters related to drying and aggregation, the bead of gel formed is homogeneous and does not present mechanical instabilities such as buckling or cracks. In the following we study the evolution of colloidal drops during the process of hydrogel formation under different drying conditions to determine where mechanical instabilities occur (Fig. 1).
We use silica nanoparticle gels that offer the possibility of tuning the mechanical properties of the final material by controlling the colloidal aggregation, i.e., the micro-structure. The gelation is achieved by modifying the colloidal interactions by screening electrostatic repulsions and making van der Waals forces dominant and/or by drying. The modification of the particle interactions results in a network and a gel. We consider a drop of nanoparticle suspension where a monovalent salt is added to screen the electrostatic interactions. The duration for the formation of the gel depends on the ionic strength. Depending on the value of two parameters, i.e., the drying rate and the ionic strength, two scenarios can occur: isotropic shrinkage of the drop to form a homogeneous gel which dries evenly without deforming (Fig. 1a) or the occurrence of mechanical instabilities due to the formation of a solid skin which leads to a more brittle and fragile gel which deforms during drying (Fig. 1b).
We first present rheological measurements to deduce the gelation time as a function of the ionic strength. Then for a fixed drying rate, we characterize the gel, at different ionic strengths, by permeability measurements. The values for the elastic modulus and the permeability are related to the colloidal aggregation which depends on the ionic strength and the micro-structure. Finally, we show conditions for the formation of a homogeneous gel, by comparing the yield stress of the material to the drying stress.
2 Materials and methods
2.1 Materials
Our experiments were performed with stable aqueous dispersions of Ludox TM50 (solid volume fraction ϕ of 0.30, particle diameter 2a = 22 ± 2 nm, polydispersity index 0.2 from Sigma-Aldrich). The pH is about 9.0 which ensures that the particle surface bears a high negative charge density with a zeta potential of about −38 mV.15 In the absence of evaporation, the electrostatic repulsion between the particles ensures the stability of the colloidal dispersion at those volume fractions.2.2 Preparation of the colloidal dispersions at various ionic strengths
In this work, a specific volume of a solution of NaCl in water is added to the colloidal dispersion. The resulting mixture exhibits a particle volume fraction of 15% while the final NaCl concentration ranges from 0.075 to 0.750 mol l−1.2.3 Oscillatory tests
An Anton Paar rheometer with a parallel plate geometry (PP, PP50/TG, with a diameter of the plate geometry equal to 50 mm and TG for TrueGap) is used to impose oscillatory deformations to a sample of hydrogel. The sample temperature was fixed at 20.00 ± 0.05 °C and a solvent trap is used to minimize evaporation and fixes a humidity close to 70%. The amplitude is fixed at 0.5% for staying in the linear regime and the frequency at 9.6 Hz for all measurements. The sample volume is 2 ml.2.4 Viscosity measurement
Shear viscosity is measured using a Low Shear Couette rheometer (Contraves LS30). The shear viscosity is measured at a constant shear rate (0.0219 s−1). The latter value is low enough to measure the true zero shear viscosity of the system. Measurements were carried out at high humidity of 70% to be in the same conditions as the oscillatory tests. The measured viscosities range between 4.1 × 10⁻³ and 1.9 × 10⁵ Pa s as a function of time. The filling volume is 1 ml. The inner cylinder of radius Ri = 5.5 mm (length = 8 mm, lower cone angle = 20°) is suspended concentrically in an external bob of radius Re = 6 mm.2.5 Drying drops: experimental setup
The drying geometry is that of a drop of a solution deposited on a hydrophobic substrate as depicted in Fig. 2. The substrate is a glass slide chemically treated by silanization leading to contact angles between 90° and 110°. We consider a drop with a constant initial volume, i.e., 30 μl, and a maximum radius of 2.46 mm. The evaporation speed, VE is governed by the relative humidity, RH, and temperature T. The drop is enclosed within a transparent tank to control the relative humidity, RH, which spans from 30% to 90% (saturated salts are used to reach very low RH).A light source is used for transmitted light observation. A telecentric lens mounted on a camera is used to provide perfectly straight light rays and give a well-defined image of the outline of the drop.
The images are then processed using a Python program which provides the volume and surface profile of the drop at each time. The Python program detects the contour of the drop by applying various filters. By assuming an axisymmetric drop and by using Guldin's theorem, the volume and the surface of the drop are deduced.
In our experiments, evaporation is limited by diffusion of water into air. Hence, the only length scale involved is the drop size, e.g. drop radius, which allows one to define a drying time as the ratio between the drop size and the evaporation rate, VE.
The evaporation rate was calculated during the Constant Rate Period (CRP)16 in the vicinity of t = 0 s using eqn (1):
 | (1) |
3 Results and discussion
3.1 Experimental determination of the gelation time
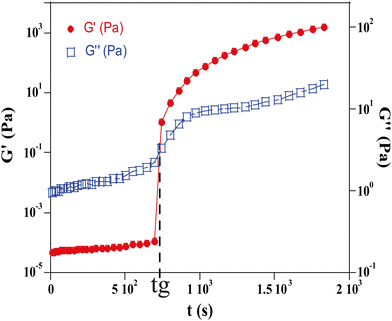
Gelation is a process during which a sol transforms into a gel. For gels of silica nanoparticles, the process is governed by the formation of aggregates that progressively grow to form a single interconnected network as described by percolation theory.16 The gelation time, tg, is the duration required to form this first infinite cluster. From a microscopic point of view, the gelation time depends on the potential barrier ΔH which results from the balance of electrostatic and van der Waals interactions. As the ionic strength increases, the potential barrier decreases and the probability of formation of clusters resulting from the collision of particles due to diffusion is higher which results in a smaller gelation time. The gelation time can be quantified using various methods. In the following, we report two different methods which provide consistent values.The gelation time was measured using two rheological methods. In the first method both the storage modulus G′ and the loss modulus G′′ were measured by oscillatory tests and the gelation time, tg, was defined as the crossing time where G′ is equal to G′′. The second method is a viscosity measurement in a Taylor–Couette geometry17 based on the divergence of the viscosity at the gel point.
The rheological measurements were carried out on volumes of about 2 ml for the oscillatory tests and 1 ml for the viscosity measurements.
Measurements were taken at a fixed frequency of 9.6 Hz and this value has been selected from a frequency sweep performed beforehand to ensure that the test is done in a frequency range where the values of G′ and G′′ remain constant. The crossing point of G′ and G′′ is assumed to occur at the sol–gel transition and is chosen as the measurement of the gelation time of the hydrogel (tg) (Fig. 4).
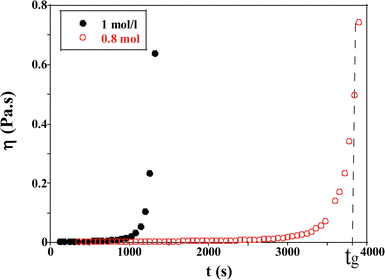 | ||
| Fig. 5 Evolution of the viscosity as a function of time for TM50 silica dispersion for two ionic strengths (I = 1 and 0.8 mol l−1) at a shear rate = 0.0219 s−1. | ||
When the sol is formed, the viscosity of the solution is close to that of water (η = 2.78 × 10⁻³ Pa s, T = 20 °C). Afterwards the viscosity increases with the formation of aggregates over time and diverges when a macroscopic network is formed. The gelation time tg is estimated to be 3900 s ± 60 s in Fig. 5, for an initial ionic strength I = 0.8 mol l−1.
| Initial ionic strength (mol l−1) | Gelation times (s) Low Shear | Anton Paar |
|---|---|---|
| 0.7 | 6000 | — |
| 0.8 | 3900 | — |
| 0.88 | 1920 | 2100 |
| 0.9 | 1800 | 1860 |
| 0.95 | 1560 | 1380 |
| 1 | 1200 | 900 |
| 1.5 | 120 | 180 |
The measurement of the gelation time as a function of ionic strength are reported in Fig. 6.
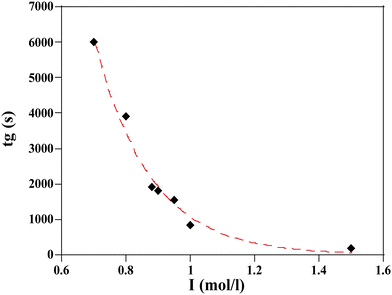 | ||
| Fig. 6 Resulting gelation time, tg, vs. ionic strength I for a given silica TM50 particle with volume fraction ϕ = 0.15 and different salt concentrations. tg are plotted from Table 1. The dashed line corresponds to a fit to a stretched exponential law (eqn (2)). | ||
A slight modification of I (from 1 to 0.88 mol l−1) implies a 50% reduction of the gelation time. At high I, the gelation process is almost instantaneous and arises before the particles have time to aggregate due to simple solvent evaporation.
For practical reasons we used a stretched exponential function to fit the data and the agreement between the fit and the data is remarkable.
 | (2) |
The fitting parameters, a, b, and c, in eqn (2) are respectively: 3.58.105; 0.69; 4.01.
It must be noted that a power law would be more consistent with current theory but the stretched exponential was clearly fitting our data with much better precision.
3.2 Phase diagram
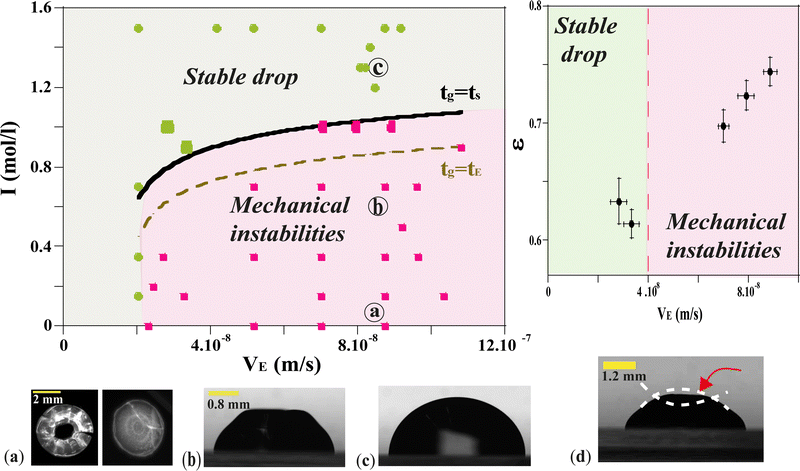
In the case of the drying of a colloidal drop, the evaporation has to be taken into account to evaluate the gelation kinetics. The evolution of drops of silica dispersion were studied for various ionic strengths and various drying kinetics. As a result, each drop evolution results in distinctive final drop morphology. The results are reported in the diagram in Fig. 7. Each symbol of the diagram corresponds to a final observed morphology of a single drop.Two main regions can be delimited:
– one region where the drops undergo only small deformations and dry homothetically while keeping their spherical shape;
– one region where the final drop morphologies are significantly different from those just after deposition: the drops initially dry homogeneously until deformations appear, apparently related to the formation of a skin at the surface of the drop.
At low relative humidity RH and small ionic strength I, drops exhibit large distortions at the final stage of the gelification. The corresponding region of the diagram is labeled as 'Mechanical instabilities' in Fig. 7. In particular, the drops may take the form of a ring with radial cracks (top view in Fig. 7a-left and Fig. 8c) or just cracks are observed (top view in Fig. 7,a-right and Fig. 8d). For the same relative humidity but larger ionic strength, no cracks are observed but a circular fold forms which results in a dip at the top of the drop (side view in Fig. 7b).
At large relative humidity RH and large ionic strength I, no distortion develops and the drops keep a spherical cap shape up to the final stage of the gelification (side view in Fig. 7c). The corresponding region of the diagram is labeled as ‘stable drop’. In the following part, the morphologies linked to different behaviors of the material are analyzed as a function of timescales.
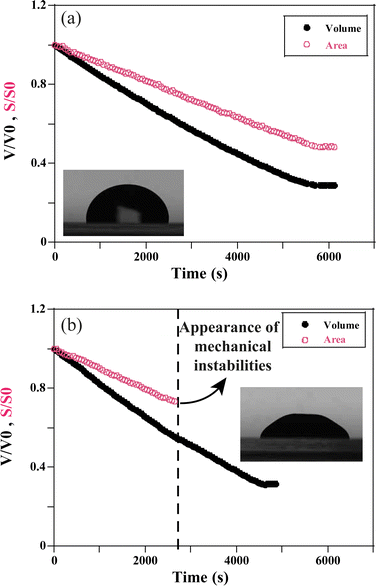
Whatever the situation, drops start to shrink progressively. The volume and the surface area of the drop keep decreasing as the solvent evaporates through the porous matrix, which progressively forms the gel phase (Fig. 3).
For VE < 2 × 10⁻⁸ m s−1, and whatever the ionic strength, the drop keeps its spherical shape with time and the drying looks homogeneous (Fig. 7c and 8a). This homogeneous drying is also observed for ionic strength, I, higher than 1 mol l−1 and VE > 2 × 10⁻⁸ m s−1. The shape of the drop suggests that the aggregation process is similar in the bulk and at the surface. Indeed, for high ionic strength the gelation process occurs faster than the drying process. As a result, the bulk of the drop solidifies rapidly, before any porous skin can form at the surface of evaporation. In the “stable region”, the gelation process is homogeneous and the volume decreases as well as the surface with time, such that the shape reaches a constant profile (Fig. 3a).
For VE > 2.04 × 10⁻⁸ m s−1 and I < 1 mol l−1, drops progressively lose their spherical cap shape as seen in Fig. 7b and 8b. The upper part of the drop is flattened. This mechanical instability (buckling instability) occurs when a porous solid skin is formed at the surface of the drop.18,19 The formation of the skin is due to the accumulation of particles at the periphery of the drop due to fast drying. This effect is encountered when evaporation overcomes diffusion. Indeed, if the drop evaporates slowly, diffusion across the drop can maintain a uniform distribution of particles. However, if evaporation is more rapid, particles are advected towards the drop surface and accumulate there, forming a porous skin.20 The upper part of the drop can then flatten and buckling instabilities take place21 (Fig. 7d). The inversion of curvature at the top of the drop can result in a ring-like shape (Fig. 7a). In addition, radial cracks can form at the periphery of the gel drop as a result of high drying stress build-up.22 Due to mechanical instabilities (Fig. 3b), the surface area stops decreasing due to the complex geometry of the drop (Fig. 7d), which buckles and dries in a non-axisymmetric way as the volume drop continues. The side view images do not allow for quantitative analysis of physical parameters such as the surface area (Fig. 3b). Analysis using a 3D scan would be required to obtain information about the evolution of the surface area.
In order to predict the onset of the instability that limits the two domains shown in Fig. 7, different characteristic times can be compared:
– the gelation time, tg, obtained from eqn (2);
– the drying time, tE, depending on the drop size and the evaporation rate as:
| tE = Rb/VE | (3) |
-the time, ts, corresponding to the formation of a gelled skin at the drop surface, that is when the particle volume fraction at the drop surface, ϕ, becomes equal to the particle volume fraction of the gel phase, ϕg23 (equal to 0.6). The expression for ts, is deduced from the conservation equation of the water fluxes at the drop/air interface:
| VE = Dc∇ϕ | (4) |
 | (5) |
 | (6) |
For silica gels, the evaluation of the time when a gelled skin forms is complex since gelation kinetics depends on particle volume fraction and on the ionic strength and this simple evaluation of the local concentrations may not be sufficient23 but we restrain to this approximate case.
Physically, we expect the following behaviors to occur:
If tg < tE, the gelation induced by the effect of ionic species is faster than the drying, gelation of the drop takes place before the end of drying and preservation of a spherical shape is expected.
Conversely, if tg > tE, the drying process is faster than the gelation, the accumulation of particles near the drop surface takes place leading to skin formation before the end of the gelation and buckling instability could take place. To test the validity of this assumption, we have plotted in Fig. 7 the points corresponding to the equality tg = tE using eqn (2) and (3). Clearly, the results plotted in Fig. 7 show that the equality of tg and tE does not correctly reflect the border between the two regions. Indeed, tE is too approximate to provide a correct comparison of time scales.
Another approach consists in assuming that the frontier between the two regions is defined as tg = ts using eqn (2) and (6). If tg < ts, the drop gels before a skin forms and the drop dries homogeneously and isotropically.
If tg > ts, a buckling instability takes place during drying.
Testing this equality requires to fit the unknown parameter Dc to the data. The best border fit of the experimental results and the model in Fig. 7 (solid lines) are obtained for Dc = 1.5 × 10⁻¹¹ ± 5.5 × 10⁻¹² m2 s−1 in agreement with previous studies on dispersions of silica nanoparticles.24 This value is close to the Stokes–Einstein diffusion coefficient for free silica particles of our size.
Another way to quantify the ‘stable’ and ‘unstable’ regions of the phase diagram (Fig. 7), is to calculate a relevant parameter: the deformation ε in the vicinity of the border (black curve) tg = ts which separates the two regions (Fig. 7-Right). Five deformations were measured at a given ionic strength equal to I = 1 mol l−1 (larger symbols on the phase diagram). The deformation ε is defined as:
 | (7) |
Results in Fig. 7 (top right) show that the deformation is much smaller in the stable compared to the unstable region and vary significantly across the theoretical curve tg = ts for an ionic strength equal to I = 1 mol l−1.
3.3 Yield stress
The drying of colloidal drops leads to the development of significant stresses within the material. During drying, the air–liquid interface curves into menisci joining the solid particles and exerts a compressive stress induced by capillary forces.25Darcy's law allows us to characterize the drying stresses in the material. This is defined in eqn (10) which shows that to calculate the drying stress within the material, it is necessary to carry out imbibition measurements to estimate the permeability. This is because the built-up stress in the system depends on its organisation as it results from the flow of solvent through the porous media.
To do so, we proceed to imbibition experiments. Rectangular samples of gel (20 × 12 × 2 mm) are formed by applying a thin layer of solution at different ionic strengths on a glass substrate and letting them dry in an enclosed box with a controlled relative humidity to impose an evaporation rate VE equal to 7.01 × 10⁻⁸ m s−1. The drying time (the time when the appearance of the sample changes from transparent to opaque white) of the samples depends on the height of the sample and varies between 1 to 4 days, depending on the added salt concentration.
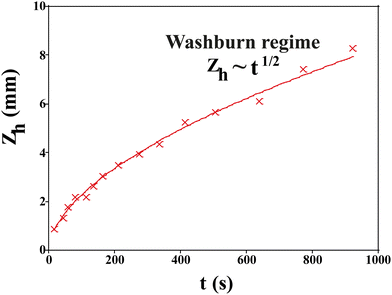
After they have dried completely, the samples are clamped vertically and their lower part dipped in a deionized water bath. We record images of the sample until the imbibition process is complete when all pores are saturated with water. The position of the propagation front zh(t) is recorded with time and fit to the Lucas–Washburn law as26 (Fig. 9):
 | (8) |
 , with reff, the mean effective pore radius and Tort, the tortuosity of channels can be calculated according to the theory RGPZ (Revil, Glover, Pezard et Zamora)27 and is equal to
  with ϕpore,eff, the effective porosity equal to ϕpore,tot − ϕpore,res; respectively the total porosity (from a completely saturated sample after imbibition) and the residual porosity (from an initial “dry” sample before imbibition). The effective porosity ϕpore,eff is evaluated from static transmission measurements.26
Knowing RW, one can deduce the effective radius reff and using Bear's law,26 the permeability K which is defined as:
 | (9) |
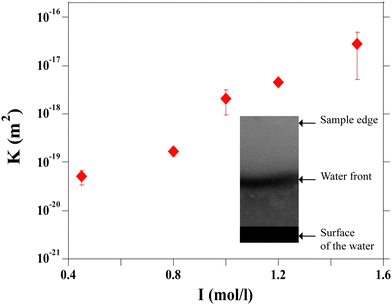
The values calculated as a function of I are reported in Fig. 10. The permeability has a strong nonlinear dependence on the salt concentration and increases with the ionic strength. This could be linked to the size of the aggregates. The structure of the gel is affected by the salt concentration and the addition of salt likely influences the intra-aggregates effects.28
 | (10) |
 , the estimated value for l is about 250 μm.
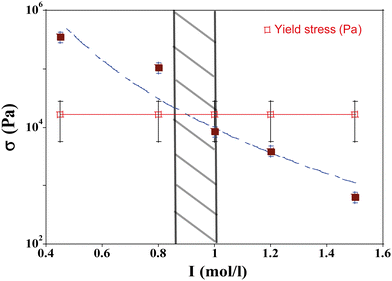
Thus when we increase I, at a constant evaporation rate (VE = 7.01 × 10⁻⁸ m s−1), we form a porous gel with higher permeability which implies that the stresses in the system are lower. This stress value should be compared with the limiting value given by the yield stress for a colloidal system, which is the maximum stress up to which a system behaves like a solid, that is when it can still withstand small stresses; if the material is subjected to stresses higher than this critical stress value, it deforms or breaks; this yield stress is given by the relationship29,30:
 | (11) |
 with
with  and
and ![[script L]](https://www.rsc.org/images/entities/char_e144.gif) 2 the zeta potential equal to 0.04 V for Ludox TM50. The second term in the expression of σy is negligible compared to the first one, making the dependence of the yield stress with the ionic strength very weak.
2 the zeta potential equal to 0.04 V for Ludox TM50. The second term in the expression of σy is negligible compared to the first one, making the dependence of the yield stress with the ionic strength very weak.
This value can be compared to rheological measurements using an amplitude sweep. The critical strain can be defined as the value below which the structure is preserved and above which the system is irreversibly changed or destroyed. Conventionally, this critical value corresponds to the value where G' deviates by 10% from its value at zero strain.30,32 We find σy ≈ 1.6 × 10⁴ Pa for [NaCl]f = 0.75 mol l−1 and σy ≈ 1.9 × 10⁴ Pa for [NaCl]f = 1 mol l−1. These values are close to the theoretical values deduced from eqn (11) and are slightly modified with the amount of salt.
We have plotted the drying stress and yield stress as a function of I in Fig. 11. For I smaller than 0.95 mol l−1, the stress in the material exceeds the yield stress; this region in the phase diagram corresponds to the area where mechanical instabilities (cracks) take place. The formation of wrinkles or the buckling mechanism observed in this case are the signature of a stress larger than the yield stress. For I higher than 0.95 mol l−1, the stress due to the flow of solvent in the porous media is lower than the yield stress and no instabilities are expected; this is in agreement with the phase diagram where for such parameter values, the drying is homogeneous. For this evaporation rate, the boundary between the unstable and stable regions is I = 0.95 mol l−1.
4 Conclusions
In this article, we have reported different rheological techniques for determining the gelation time of colloidal solutions (silica nanoparticle LUDOX TM50 + salt solutions at different ionic strength I). The gelation time is very sensitive to the ionic strength and the gelation time is faster when the ionic strength is higher. Moreover, experimental observations on surface instabilities during the drying of these colloidal dispersions have been reported. Two main regions have been identified: one, called a stable drop without the development of instabilities where the drop retains a spherical cap shape during drying. The other region, called “Mechanical instabilities”, with a large distortion of the colloidal drops during drying, linked to the development of an elastic skin on the surface. Imbibition dynamics were investigated to explore the structural properties of the gels. Permeability has a strong nonlinear dependence on salt concentration and increases with ionic strength. The permeability measurement provides us with an estimation of the drying stress determined using Darcy's law which is compared to the threshold stress. Instabilities form when stresses that develop in the material are greater than the intrinsic yield stress of the material. In particular, we show that we can make hydrogels beads which are homogeneous in their shape, volume and structure and whose mechanical properties are controlled. Our work deals with the construction of a phase diagram predictive of the dried drops shape as a function of the physicochemical properties of the drop components. The results bring insight into the phenomenon involved from the gelled external layer at the drop periphery to the final solid porous structure.Future work will focus on the fabrication of biohydrogels by incorporating bovine serum albumin (BSA) proteins into the hydrogel, which will strengthen the mechanical properties of the hydrogel and make it more resistant to stresses for biomedical applications. This system is considered a biodegradable and biocompatible material. In biomedical applications, silica particles are a promising delivery vehicle and adjuvant in oral vaccines by improving the immune response and stabilizing the protein in the system.33
Conflicts of interest
There are no conflicts to declare.Acknowledgements
We are grateful to J. Amarni, A. Aubertin, L. Auffray, C. Manquestand, and R. Pidoux for their contribution to the development of the experimental setup and for the technical support. We thank F. Boulogne for his help with the Python program used for the treatment of drops and L. Tuckerman for her kind proofreading. This work received an Investissements d'Avenir grant from LabEx PALM (ANR-10-LABX-0039-PALM) and benefited from meetings within the French working group GDR CNRS 2019 “Solliciter LA Matière Molle” (SLAMM). This work has also benefited from a French State grant ‘BOGUS’ ANR-19-CE06-0030-02.References
- V. K. Thakur and M. K. Thakur, Hydrogels: Recent Advances, Springer, 2018 Search PubMed.
- M. R. Guilherme, F. A. Aouada, A. R. Fajardo, A. F. Martins, A. T. Paulino, M. F. Davi, A. F. Rubira and E. C. Muniz, Eur. Polym. J., 2015, 72, 365–385 CrossRef CAS.
- P. Kesharwani, A. Bisht, A. Alexander, V. Dave and S. Sharma, J. Drug Delivery Sci. Technol., 2021, 66, 102914 CrossRef CAS.
- C. Y. Anthony, H. Chen, D. Chan, G. Agmon, L. M. Stapleton, A. M. Sevit, M. W. Tibbitt, J. D. Acosta, T. Zhang and P. W. Franzia, et al. , Proc. Natl. Acad. Sci. U. S. A., 2016, 113, 14255–14260 CrossRef PubMed.
- S. Mohapatra, M. Mirza, A. R. Hilles, F. Zakir, A. C. Gomes, M. J. Ansari, Z. Iqbal and S. Mahmood, et al. , Gels, 2021, 7, 207 CrossRef CAS PubMed.
- N. Maldonado and P. Amo-Ochoa, Nanomaterials, 2021, 11, 1865 CrossRef CAS PubMed.
- H. Khalesi, W. Lu, K. Nishinari and Y. Fang, Adv. Colloid Interface Sci., 2020, 285, 102278 CrossRef CAS PubMed.
- A. H. Williams, S. Roh, A. R. Jacob, S. D. Stoyanov, L. Hsiao and O. D. Velev, Nat. Commun., 2021, 12, 1–9 CrossRef PubMed.
- Á. Serrano-Aroca, Hydrogels. InTech, 2018, 91–120 Search PubMed.
- H. Dehne, F. Hecht and A. Bausch, Soft Matter, 2017, 13, 4786–4790 RSC.
- P. Bacchin, D. Brutin, A. Davaille, E. Di Giuseppe, X. D. Chen, I. Gergianakis, F. Giorgiutti-Dauphiné, L. Goehring, Y. Hallez and R. Heyd, et al. , Eur. Phys. J. E: Soft Matter Biol. Phys., 2018, 41, 1–34 CrossRef CAS PubMed.
- X. Zhao, Soft Matter, 2014, 10, 672–687 RSC.
- P. Hassan, G. Verma and R. Ganguly, Functional Materials: Preparation, Processing and Applications, Elsevier, London, UK, 2011, vol. 1 Search PubMed.
- M. Bustamante-Torres, D. Romero-Fierro, B. Arcentales-Vera, K. Palomino, H. Magaña and E. Bucio, Gels, 2021, 7, 182 CrossRef CAS PubMed.
- A. M. Renner, M. B. Schütz, D. Moog, T. Fischer and S. Mathur, ChemistrySelect, 2019, 4, 11959–11964 CrossRef CAS.
- C. J. Brinker and G. W. Scherer, Sol-gel science: the physics and chemistry of sol-gel processing, Academic press, 2013 Search PubMed.
- B. Saint-Michel, S. Manneville, S. Meeker, G. Ovarlez and H. Bodiguel, Phys. Fluids, 2019, 31, 103301 CrossRef CAS.
- L. Pauchard and C. Allain, Phys. Rev. E: Stat., Nonlinear, Soft Matter Phys., 2003, 68, 052801 CrossRef CAS PubMed.
- L. Pauchard and Y. Couder, EPL, 2004, 66, 667 CrossRef CAS.
- A. F. Routh and W. B. Russel, AIChE J., 1998, 44, 2088–2098 CrossRef CAS.
- L. Pauchard and C. Allain, EPL, 2003, 62, 897 CrossRef CAS.
- F. Giorgiutti-Dauphiné and L. Pauchard, Eur. Phys. J. E: Soft Matter Biol. Phys., 2014, 37, 1–7 CrossRef PubMed.
- L. Pauchard and C. Allain, C. R. Phys., 2003, 4, 231–239 CrossRef CAS.
- F. Boulogne, F. Giorgiutti-Dauphiné and L. Pauchard, Soft Matter, 2013, 9, 750–757 RSC.
- R. D. Deegan, O. Bakajin, T. F. Dupont, G. Huber, S. R. Nagel and T. A. Witten, Nature, 1997, 389, 827–829 CrossRef CAS.
- M. Léang, F. Ott, F. Giorgiutti-Dauphiné, L. Pauchard and L.-T. Lee, J. Colloid Interface Sci., 2020, 565, 474–482 CrossRef PubMed.
- Y. Bernabé and A. Revil, Geophys. Res. Lett., 1995, 22, 1529–1532 CrossRef.
- D. Scheepers, B. Chatillon, Z. Borneman and K. Nijmeijer, J. Membr. Sci., 2021, 617, 118619 CrossRef CAS.
- E.-J. Teh, Y.-K. Leong, Y. Liu, B. Ong, C. Berndt and S. Chen, Powder Technol., 2010, 198, 114–119 CrossRef CAS.
- E. Di Giuseppe, A. Davaille, E. Mittelstaedt and M. François, Rheol. Acta, 2012, 51, 451–465 CrossRef CAS.
- L. Goehring, W. J. Clegg and A. F. Routh, Phys. Rev. Lett., 2013, 110, 024301 CrossRef PubMed.
- P. Sollich, Phys. Rev. E: Stat. Phys., Plasmas, Fluids, Relat. Interdiscip. Top., 1998, 58, 738 CrossRef CAS.
- G. Navarro-Tovar, G. Palestino and S. Rosales-Mendoza, Expert Rev. Vaccines, 2016, 15, 1449–1462 CrossRef CAS PubMed.
| This journal is © The Royal Society of Chemistry 2023 |

