
 Open Access Article
 This Open Access Article is licensed under a Creative Commons Attribution-Non Commercial 3.0 Unported Licence
Highly active Pd–ZrO2 electrodes for hydrogen evolution reaction†
Simone
Minelli
a,
Sandra
Rondinini
 a,
Xiufang
He
a,
Alberto
Vertova
*ab,
Cristina
Lenardi
c,
Claudio
Piazzoni
c,
Silvia
Locarno
c and
Alessandro
Minguzzi
abd
a,
Xiufang
He
a,
Alberto
Vertova
*ab,
Cristina
Lenardi
c,
Claudio
Piazzoni
c,
Silvia
Locarno
c and
Alessandro
Minguzzi
abd
aDipartimento di Chimica, Università degli Studi di Milano, Via Golgi 19, 20133 Milano, Italy. E-mail: alberto.vertova@unimi.it
bINSTM Consorzio Interuniversitario Nazionale per la Scienza e Tecnologia dei Materiali, Via G. Giusti 9, 50121 Firenze, Italy
cCIMAINA, Dipartimento di Fisica “Aldo Pontremoli”, Università degli Studi di Milano, Via Celoria 16, 20133 Milano, Italy
dDipartimento di Energia, Politecnico di Milano, Via Lambruschini 4a, 20156 Milano, Italy
First published on 31st January 2023
Abstract
Here we discuss the use of a family of electrode materials, which exhibit specific electrocatalytic activity for hydrogen evolution reaction and hydrogen oxidation reaction. These composite materials show extended lifetime, also being very cheap in comparison with pure palladium. We specifically focus on composite electrodes formed by Pd and ZrO2, a ceramic oxide compatible with human tissues, whose role is to enhance the electroactivity of classic platinum group metals, thus significantly reducing the catalyst load. To carefully control the electrocatalyst composition and morphology, the electrodes are prepared by ion beam sputtering deposition onto fluorine-doped tin oxide supports, thus obtaining ordered layers of ceramic and electrocatalyst. The outcomes point to the synergistic effects between the precious metal catalyst and ceramic diluent not only in terms of the chemical stability of the layer but also of the electrochemical activity of the composite material.
1. Introduction
Quite recently, Vizza et al.1–5 developed a new class of bifunctional6–14 electrocatalysts for the production and usage of molecular hydrogen.15 The electrocatalytic activity stems from the strict interaction between the electroactive material (typically, platinum group metals, PGM) and specific ceramic supports based on the relevant lanthanide oxides. According to,1,2,4,5,9 the most active support is cerium oxide (CeO2), which dramatically enhances both the hydrogen oxidation reaction (HOR) and hydrogen evolution reaction (HER) at Pd@CeO2/C electrodes. Ceramic materials like CeO2![[thin space (1/6-em)]](https://www.rsc.org/images/entities/char_2009.gif) 10 and ZrO211,16 are added to increase the activity for HER/HOR owing to the specific reaction paths under acidic and alkaline conditions, as briefly summarized here below:
10 and ZrO211,16 are added to increase the activity for HER/HOR owing to the specific reaction paths under acidic and alkaline conditions, as briefly summarized here below:
Acid environment: Tafel–Volmer and Heyrovsky–Volmer paths
| Tafel: ½H2 + * = Hads |
| Volmer: Hads = * + H+ + e− |
| Heyrovsky: H2 + * = Hads + H+ + e− |
Alkaline conditions: Heyrovsky–Volmer path:
| Heyrovsky: H2 + OH− + * = Hads + H2O + e− |
| Volmer: Hads + OH− = * + H2O + e− |
Accordingly,14,17–19 in the case of an alkaline environment as described by DFT calculations20 and RDE measurements,21 the reaction mechanism can be considered as a Heyrovsky–Volmer mechanism.
Not only HER/HOR but also H2-UPD (under potential deposition) is slower in alkaline media22 than in acidic environments. The presence of Ni(OH)2 improves the H2-UPD23 and HER/HOR by lowering the energy barrier for the interfacial water network reorganization. In the present setup, the HER/HOR promotion stems from the specific interactions of Pd with the oxygen atoms of CeO2, thus affecting the hydrogen binding energy owing to the catalyst structure that consists of oxidized Pd atoms coordinated by four oxygen atoms in CeO2, as evidenced by X-ray absorption spectroscopy.1 The electrochemical activity of Pd@CeO2 composite powder is independent on the adopted synthetic route, as reported by Yu et al.9
Within this framework, we preliminarily investigated the environmental impact via LCA analysis of anion-exchange membrane fuel cells (AEMFC) in comparison with proton-exchange membrane fuel cells (PEMFC).24 As expected, the acid conditions had a higher environmental impact, bound to both Membrane Electrode Assembly (MEA) preparation and electrocatalyst for the oxygen reduction reaction (ORR). Nonetheless, the stability of the anion exchange polymer in alkaline media is still to be optimized, thus greatly affecting its long-term applications. Based on the encouraging results obtained for ceria, we have chosen to use another ceramic material, zirconia, widely used also in dentistry surgery for its mechanical and biocompatibility properties.25,26 Moreover, ZrO2 has also been widely used for a huge amount of hydrogenation reactions due to its hydrogen spillover effect.
The electrodes were obtained by co-deposition of palladium and zirconium on conductive support: fluorine-doped tin oxide, FTO, using the ion beam sputtering technique, a low-cost and scalable method to prepare catalyst coated membranes (CCM). FTO has been chosen as an inert electrochemical support useful for the characterization of the prepared composite materials for HER in alkali. Ex situ spectroscopic characterizations allow the determination of the chemical state of the metals after deposition and subsequent air exposure, as well as the chemical modification of the electrode materials after being used.
In the present contribution, we analyse the performances of Pd@ZrO2/FTO electrodes for comparing the ceria catalyst5,13 with the less expensive and more environmentally friendly zirconia25 and to underline the possibility of using ion beam sputtering deposition to prepare CCM and/or MEA for fuel cell devices.
2. Experimental section
2.1. Electrode preparation
The electrodes are prepared by Ion-Beam Sputtering Deposition (IBSD), a physical vapour deposition (PVD) technique that offers the chance to customize the properties of the material by depositing a thin film of a selected composition. By changing the deposition parameters (ion species, ion energy, ion incidence angle, collection angle), it is possible to control the properties of the growing film (e.g., mass density, optical properties, adhesion, structural properties, surface roughness, mechanical properties, electrical resistivity).27 Here, IBSD makes use of a specifically designed Pd/Zr composite target to get a uniform coating where the two elements are present in tailored percentages.The IBSD apparatus consists of a Kaufman ion beam source faced on a 100 dm3 vacuum chamber with a base pressure in the range of 10−4 Pa. Argon ions are used as primary particles for sample preparation. A composite target is fixed in front of the Ar+ beam at a 30 deg incidence angle. The target consists of 100 × 133 × 0.3 mm Zr foil and a Pd net made with a 0.2 mm diameter Pd wire (see Fig. 1A). The Pd net is fixed on top of the Zr foil through an aluminium frame with grooves of 0.6 mm width and 1 mm pitch. This design allows to easily vary the target composition, i.e., the relative amount of the two elements exposed to Ar+, by changing the texture of the Pd mesh. The thickness of the deposit is monitored online via a quartz microbalance, placed along with the samples within the rastered area (see Fig. 1B). To control the coating thickness, deposition time is the driving parameter. In the present work, we produced four kinds of samples with coating layers of thickness 25, 50, 100, and 200 nm, whose weights were 31.5, 62.6, 115.8, and 25.7 μg, respectively. 20 × 10 mm FTO substrates (Sigma-Aldrich fluorine doped tin oxide coated glass slide with surface resistivity ∼7 Ω sq.−1) were used as support material. Through simple masking, only half (∼10 × 10 mm) of their conductive surface was coated. The thickness of the deposit was then measured on an FTO support via stylus profilometry.
 | ||
| Fig. 1 (A) The target; (B) schematic drawing of the composite target: Zr foil (blue) fixed on the target holder through an aluminium frame (grey) that, in turn, hosts the Pd wire (black); (B) left up: detail of the frame with hooking grooves for the Pd wire (pitch 1 mm). | ||
2.2. Physical characterization
2.3. Electrochemical characterization
All the electrochemical characterisations are performed with a 3-electrode setup, using a platinum foil as the counter electrode (CE) and a saturated calomel electrode (SCE) with 0.5 M KNO3 double bridge as the reference electrode. The tests are performed in KOH (Sigma-Aldrich reagent grade pellets) aqueous solutions at two different concentrations, namely 0.1 and 1 M, carefully purged with N2 to remove O2 and CO2.| ERHE = ESCE + 0.244 + 0.059 × pH |
The tests were performed in aqueous 1 M KOH, at electrodes polarized at −0.275 V vs. RHE, in the 100 kHz to 0.01 Hz frequency range @10 mV amplitude.
3. Results and discussion
3.1. XPS
The XPS analysis provides detailed information about the elemental composition and the chemical state of the films in the first few Å close to the surface. As previously described, the deposition protocol allows for obtaining samples with selected composition and thickness. In order to determine if the elemental composition of the samples is compliant with the expected Pd/Zr ratio, namely about 1:1, for various deposit thicknesses, we performed systematic XPS measurements. We evaluated the amount of the detected elements: Pd, Zr, O, and C. In Fig. 2, the category plot shows the elemental composition (at%) of samples with increasing film thickness, namely 25, 50, 100, and 200 nm. The film stoichiometry shows rather homogeneous deposits. The ex situ analysis implies the presence of adventitious carbon and oxygen, which could be bonded to carbon or present in metal oxides. However, the major interest is given by the relative amount of the co-deposited species Pd and Zr. From the literature,29 the sputtering yield for Ar+ at 500 eV and 60 deg is 1.5 for Zr and 4.8 for Pd. The exposure of sputterable surfaces of the two metals, as designed for the home-made target (see previous section), should bring, according to the tabulated sputtering yields, to a Pd/Zr ratio of 0.8:1. The experimental results indicate that the content of Zr and Pd is almost constant (0.04 and 0.05 of relative standard deviation (RSD), respectively), without any dependence on the thickness of the deposits, and that the actual Pd/Zr ratio is 1.3:1 (see Table 1). Even if this value is slightly different from the expected one, it remains compliant with the elemental ratio required for producing samples suitable for the planned electrochemical experiment and confirms the appropriateness of the target design and setup. Fig. 3 shows the normalized XPS spectra of pristine samples at Pd 3d and Zr 3p edges (Fig. 3A) and O 1s edge (Fig. 3B) for the different thicknesses of the deposits.
 | ||
| Fig. 2 Elemental composition (at%) of the 4 thicknesses samples for the detected element, namely C, O, Pd, and Zr. | ||
| Sample thickness | Zr (at%) | Pd (at%) |
|---|---|---|
| 5 | 41 | 59 |
| 50 | 44 | 56 |
| 100 | 44 | 56 |
| 200 | 41 | 59 |
| Expected from sputtering yield tabulated data | 56 | 44 |
 | ||
| Fig. 3 Normalized XPS spectra of pristine samples at Pd 3d and Zr 3p edges (A) and O 1s edge (B). The thickness of the grown film is indicated. Metallic and oxide species resulting from fitting procedure of the normalized XPS spectra of the 50 nm sample at Pd 3d and Ze 3p edges (C). | ||
By looking at the Pd 3d5/2, the spectra show metallic palladium (Pd(0)) at 335.3 eV (spin orbit splitting ΔE = 5.3 eV) and palladium oxide (PdOx) in the region between 336.2 eV and 337.2 eV.30,31 The reduced amount of the oxide for the 200 nm thickness with respect to the other samples mirrors the slight decrease of the overall content of oxygen as evaluated in the elemental analysis. Nonetheless, Pd 50 nm presents a higher amount of Pd oxide, as evidenced by Fig. 3A. This could be strictly connected with the best electrocatalytic behaviour of 50 nm electrode for the HER, as described in the electrochemical part. The position of Zr 3p3/2 peak at 332.3 eV indicates the presence of zirconium oxide,32 whereas there is no evidence of metallic zirconium that should be placed at lower BE (329.70 eV).33 The full oxidation of Zr is also well established by Zr 3d spectra (not shown). The O 1s spectra show two main features, one peak at 529.4 eV and assigned to metallic oxides, with no possibility to distinguish between zirconium and palladium oxides, and the other broad band, around 531.0 eV, related to hydroxyl species and oxygen bonded to carbon. The huge tail at higher BE is due to the contribution of Pd 3p3/2 peak placed at 532.2 eV,34 for which the metallic and the oxide state are not distinguishable. In order to have a quantitative evaluation of the Pd oxide amount, the spectra have been fitted using Voigt line-shape for the metallic and oxide components. The quality of the fit has been evaluated with the residuals, namely, for fixed energy, the ratio between the difference of the calculated point and the experimental point and the square root of the experimental points, have been then analysed by applying the Abbe criterion.35 The result assesses no correlation among residuals as an indication of random noise, confirming the goodness of the fitting procedure.
In Fig. 3C, one of those fits is shown, namely that of the Pd 3d spectrum for the 50 nm deposit is shown, where the ochre pattern is related to the metallic component, while the green pattern to the oxide one. This is the sample exhibiting the higher oxidation (see Fig. 3A), whose amount can be evaluated at 40% of the total Pd content. For the other samples, palladium oxide has been estimated to be 25%, 20%, and 10% for the 25, 100, and 200 nm deposits, respectively.
3.2. Cyclic voltammetry (CV)
Fig. 4 and 5 show the CVs recorded in aqueous 0.1 M and 1 M KOH solutions, respectively, for different thicknesses of the active layer. While the good reproducibility between the peak potentials of the various deposits is evident, we observe a rather large variability in terms of current densities, which are a function of both the thickness and the roughness of the surface layer. CVs also evidence how the 50 nm shows the best electroactivity in terms of current densities for both HER, comparing the boxed cathodic current value in Fig. 4 and 5 (−7.4 × 10⁻⁴ A cm−2 and −1.2 × 10⁻³ A cm−2 for the 50 nm, respectively, at 0.05 V vs. RHE), and HOR, comparing the peaks between 0 and 0.2 V vs. RHE due to the oxidation of H2. These outcomes are not linked to the deposit roughness obtained by IBSD27 since the most intense reduction peak is exhibited by the 50 nm layer. Thicker deposits should exhibit larger active surface areas.28 Also, SEM analysis of pristine materials shows a higher roughness of 200 nm than 50 nm samples, see Fig. S1 in ESI;† while the FESEM images evidence the cross-sectional morphology of the samples, thus highlighting a strongly adherent Pd/Zr deposit onto the FTO support, see Fig. S2A and B in ESI.† | ||
| Fig. 4 Cyclic voltammetry in aqueous 0.1 M KOH for different thicknesses of the deposit. Scan rate: 20 mV s−1, electrode geometric area: 1 cm2. | ||
 | ||
| Fig. 5 Cyclic voltammetry in aqueous 1 M KOH for different thicknesses of the deposit. Scan rate: 20 mV s−1, electrode geometric area: 1 cm2. | ||
These observations highlight that the active surface of this composite material is related to the thickness of the deposit.
The key role of the electrolyte concentration is evidenced in Fig. 6, showing a larger HER current in 1 M KOH, paralleled by a larger HOR current. This behaviour is different from that observed for pure Pt,23 for which an increase in KOH concentration leads to a current reduction. On the contrary, as already evidenced by Vizza et al.5 for Ce oxide, the presence of an oxophilic compound leads to an increase in the HER and HOR current with the increase in KOH concentration due to the synergistic effect between CeO2 and Pd. This behaviour has also been evidenced for our composite electrodes formed by Pd with ZrO2 due to a similar synergistic interaction between the ceramic compound and the noble metal.
 | ||
| Fig. 6 Cyclic voltammetry in aqueous KOH solutions of Pd@ZrO2 50 nm layer deposited by IBS on FTO. Scan rate: 20 mV s−1, electrode geometric area: 1 cm2. | ||
In detail, the HER is characterized by a large and sharp peak current, paralleled by a large HOR signal in the reverse cycle, followed by a rather large plateau pertaining to the growth of the metal oxide, whose reduction is paralleled, in the reverse cycle, by a “bell-shaped” peak. These features are almost invariant with the layer thickness but for the current values, in line with the relevant surface areas.
3.3. Electrochemical impedance spectroscopy (EIS)
Fig. 7 shows the EIS spectra for the 25, 50, 100, and 200 nm deposits in 0.1 M and 1 M KOH, together with the equivalent circuit resulting from EIS analysis. Note that, even if equivalent circuits of Fig. 7, panels (B) and (E), have been used to fit the experimental data, in Nyquist plots, Rs has been set to zero for clarity. The constant phase element (CPE) has been used in the equivalent circuit to account for the intimate alternating presence of ZrO2 and Pd in this very flat layer, which can lead to sites with different activities. Moreover, the chemical interaction of Pd with H2 can also increase the inhomogeneity of the electrode surface area. We believe that the inhomogeneous double layer, shown by electrodes, is related not to the roughness of the interface but to the chemical surface composition of the electrode. We think that the alternation of Pd/PdO and ZrO2 on the electrode surface creates an inhomogeneous distribution of adsorbent species like OH* and H*; hence, the structure of the double layer behaves differently from a perfectly flat surface. This effect is also possible in the presence of Pd, which can absorb H2. | ||
| Fig. 7 EIS spectra for different thicknesses of Pd@ZrO2 layers supported on FTO. The applied potential for all EIS measurements is −0.275 V vs. RHE. The frequency range is 0.1 to 105 Hz. (A) in 0.1 M KOH; (D) in 1 M KOH. Dots = experimental data, lines = fitting results obtained with the reported equivalent circuit. Panels (B) and (E) equivalent circuits. Panels (C) and (F) magnification of EIS spectra in the 0–1 Z′ range. Frequency: 10000 Hz orange triangle, 1000 Hz light-blue square, 100 Hz yellow circle and 10 Hz green rhombus. | ||
Notably, due to the synergistic interaction between Pd/PdO and ZrO2, the ongoing reaction exhibits a similar path as in the acid environment,6 as previously reported.23 In addition, at the chosen working potential (−275 mV vs. RHE) the HER is largely prevalent with respect to H2-UPD, which results almost undetectable, and, thanks to the high planarity and the compactness of the layer on FTO, only one parallel RC is present; thus only one semicircle is visible in the EIS plots. In conclusion, EIS data are fitted using the simple equivalent circuit reported in Fig. 7, panels (B) and (E). In order to show that at high frequency the first semicircle connected to the H2-UPD is absent, the magnification of the Nyquist plots is added, as shown in Fig. 7: panels (C) and (F).
The data described in Fig. 8A and B, Rct and CPE capacitance values, respectively, were obtained using Zview® 4.0c fitting procedure, see Table 2. It is worth noting that the value of the CPE exponent is always around 0.8, with a small increase from 0.1 M to 1 M KOH; see Table 2, columns 4 and 7. Both these two parameters, CPE capacitance and CPE exponent, witnessed for a double layer not completely flat, for the reasons previously discussed, but almost stable, at least for the 50 nm sample.
 | ||
| Fig. 8 (A) Charge transfer resistances (Rct). (B) Constant phase element (CPE) for 25, 50, 100, and 200 nm thickness of Pd@ZrO2 layers sputtered onto FTO, in 0.1 M KOH (blue bar) and 1 M KOH (orange bar). These values are obtained from the fitting of EIS data presented in Fig. 7. The maximum iterations are 1000, type of fitting is complex, GDAE. Accuracy is 2. | ||
| Pd@ZrO2 thickness (nm) | 0.1 M KOH | 1 M KOH | ||||
|---|---|---|---|---|---|---|
| R ct (Ω) | CPE-T (S × sn) | Exp CPE | R ct (Ω) | CPE-T (S × sn) | Exp CPE | |
| 25 nm | 25.35 ± 0.15 | 1.40 × 10⁻⁴ ± 4.4 × 10⁻⁶ | 0.83 | 12.69 ± 0.03 | 1.4 × 10⁻⁴ ± 2.8 × 10⁻⁶ | 0.88 |
| 50 nm | 21.87 ± 0.08 | 2.1 × 10⁻⁴ ± 6.1 × 10⁻⁶ | 0.78 | 11.91 ± 0.04 | 2.3 × 10⁻⁴ ± 8.2 × 10⁻⁶ | 0.83 |
| 100 nm | 35.91 ± 0.18 | 2.1 × 10⁻⁴ ± 8.9 × 10⁻⁶ | 0.75 | 11.31 ± 0.05 | 2.8 × 10⁻⁴ ± 1.2 × 10⁻⁵ | 0.81 |
| 200 nm | 45.2 ± 0.18 | 1.2 × 10⁻⁴ ± 4.5 × 10⁻⁶ | 0.78 | 15.93 ± 0.06 | 2.4 × 10⁻⁴ ± 9.8 × 10⁻⁶ | 0.78 |
As expected from the CV results, in 0.1 M KOH, the 50 nm sample has the lowest Rct for HER and in 1 M KOH, all the Rct values further decrease (Fig. 8A), leading the 100 nm to be more similar to the 50 nm, as also evidenced with CVs measurements. These values are likely correlated to the modification of the surface since both 100 and 200 nm show a considerable increase in the CPE values in connection with their repeated use in 0.1 M and 1 M KOH, Fig. 8B. We can speculate that, at least initially (0.1 M KOH), the 50 nm has a much higher exposed surface area than the other samples; moreover, the very slight increase of its surface area (1 M KOH) witnessed for its strong electrochemical stability in comparison with the 100 and 200 nm samples. In summary, the 50 nm sample is more stable than the 100 and 200 nm samples, as denoted by both the low increase of the CPE term (see Fig. 8B) and SEM images (see ESI – Fig. S3†). On the contrary, 100 and 200 nm samples almost double their surface area, highlighted by the increase in CPE values (see Fig. 8B). In summary, the intimate mixing between Pd and ZrO2 leads to a synergistic effect evidenced by very low Rct values obtained by EIS measurements (see Fig. 9), as described by Vizza5 for Pd and CeO2 in the same alkaline environment, thus highlighting how a new oxophilic compound can be used to increase the electrocatalytic activity of Pd for ORR in alkali.
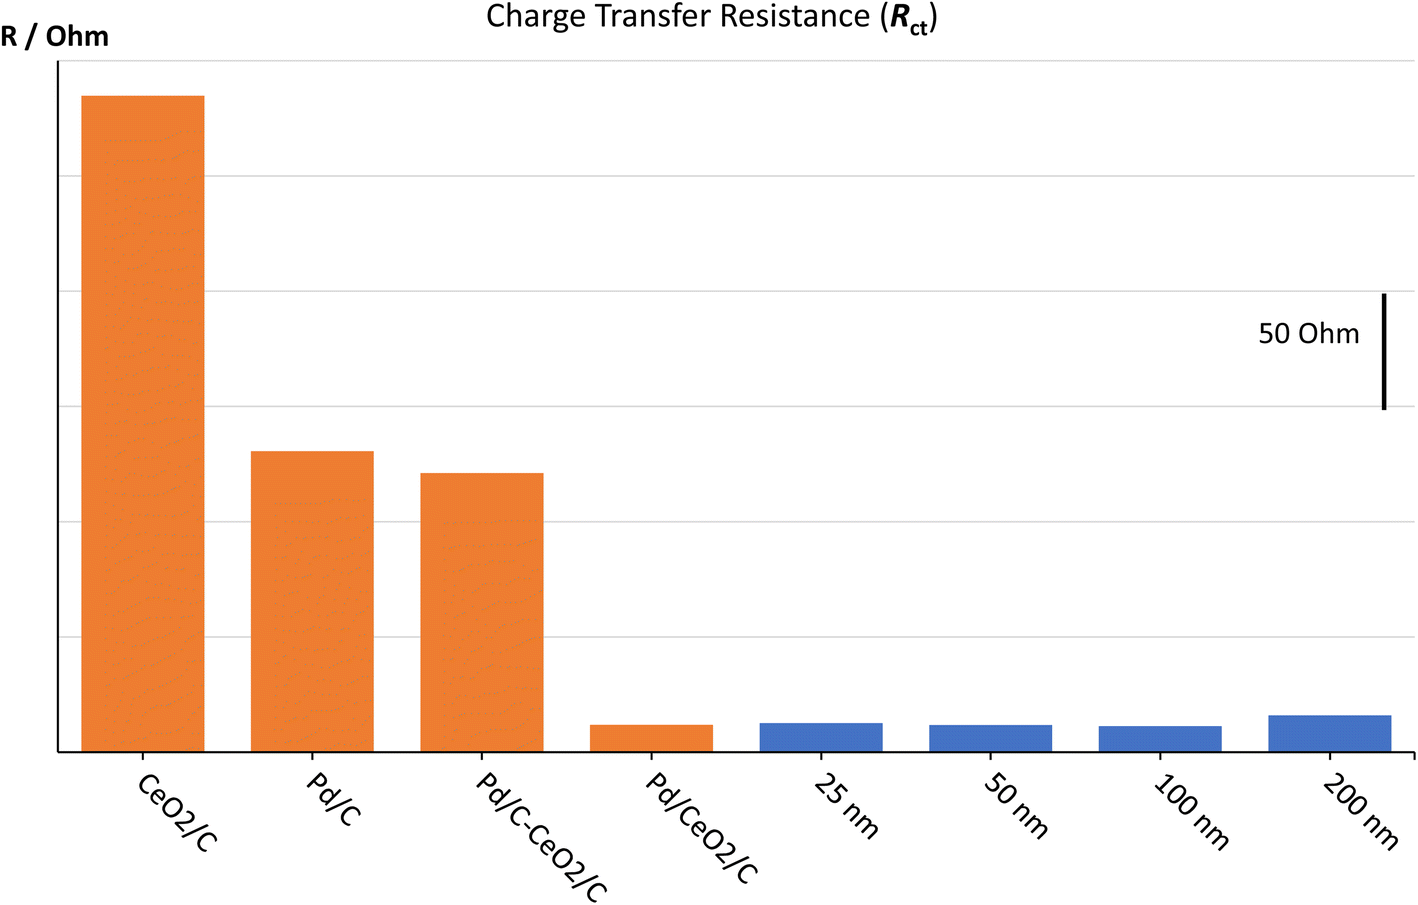 | ||
| Fig. 9 Charge transfer resistances of 4 different ceria-based composite materials (from Vizza et al.5 – orange bars) and 4 different thicknesses of Pd@ZrO2 (blue bars), in KOH 1 M at −275 mV vs. RHE. Pd/C–CeO2/C denote a mix of 2 co-deposited powders: Pd/C and CeO2/C. Pd/CeO2/C denote a co-synthesis of Pd and ceria oxide. | ||
Interestingly, the thickness of the Pd@ZrO2 layer seems to play a minor role in lowering the charge transfer resistance, pointing either to (i) significant differences between the various depositions (e.g., in connection with the surface roughness) or (ii) the key role of the balance between thickness and exposed surface area.
3.4. Stability test
The results of the CV and EIS tests highlight the better performance of the 50 nm Pd@ZrO2 deposit, in terms of both higher catalytic activity for HER and greater stability as checked via 5000 CV cycles in 0.1 M and 1 M KOH. SEM images of the 50 nm sample after 5000 CV cycles (see ESI – Fig. S3C†) evidence a greater stability of this Pd@ZrO2 thickness compared to the 200 nm (see ESI – Fig. S3D†), which presents a ruined surface due to the powder detachment only after 8 cycles (compare Fig. S3B and D in the ESI†).Fig. 10 compares the voltammetric behaviour of the 50 nm electrode before and after 5000 CV cycles in both 0.1 M (Fig. 10A) and 1 M KOH (Fig. 10B). Although the two curves are not perfectly overlapped, the key features are almost identical but for a larger H2 desorption peak at about 320 mV in the forward cycle in 0.1 M KOH and for an HER current increase in 1 M KOH. It is worthwhile to note the perfect overlapping of the Pd oxide reduction peaks28 at around 0.6 V, features that once again point to the stability of the active layer in both electrolytes.
 | ||
| Fig. 10 CV of a 50 nm Pd@ZrO2 electrode in 0.1 M KOH, (A), and 1 M KOH, (B), pre and post 5000 CV cycles. Scan rate: 20 mV s−1, electrode geometric area: 1 cm2. | ||
4. Conclusions
The preparation of Pd@ZrO2 composite electrode by means of IBS deposition for HER in an alkaline medium has been described and validated. The 50 nm composite material, the best electrode we have synthesized, shows a Pd loading of about 30 μg cm−2 with a mass activity of almost 40 mA mgPd−1 at 0.05 V vs. RHE. The electroactivity and stability of this novel electrocatalyst structure have been investigated by CV and EIS for different thicknesses: 25, 50, 100, and 200 nm. The IBS technique allows strict control of the layer composition and loading. The results point to an effective enhancement of the electroactivity, as evidenced by the drastic reduction of the charge transfer resistance, thus allowing the parallel reduction of catalyst load even at increasing current densities. It is evident that the 50 nm deposit has the best electrocatalytic activity and higher stability compared to 25, 100, and 200 nm, which is related both to the thickness and to the equilibrium of Pd(0) and Pd(II). It can be speculated that the surface ratio between Pd(0) and Pd(II) of the catalytic material is influenced by the interactions with the underlying states, and this interaction is strictly correlated with the thickness of the electrocatalytic materials as evidenced by the XPS measurements. As also described in a previous work,5 the higher ratio of Pd(II)/Pd(0) in the Pd/CeO2/C electrocatalytic material enhances the activity and stability toward HER. In the present work, we observed analogous interactions between Pd and zirconia; hence the best electrocatalytic activity observed for 50 nm thickness is correlated with the relevant Pd(II)/Pd(0) ratio.Author contributions
C. P., C. L., and S. L. conducted the electrode preparation and performed the physical characterizations. S. M., S. R., A. M., X. H., and A. V. conceived the idea and carried out all the electrochemical characterizations. All the authors discussed the final manuscript.Conflicts of interest
There are no conflicts to declare.Acknowledgements
We thankfully acknowledge the financial support of MIUR – PRIN 2017, Prot. 2017YH9MRK: “Novel Multilayered and Micro-Machined Electrode Nano-Architectures for Electrocatalytic Applications (Fuel Cells and Electrolyzers)”. This research is part of the project “One Health Action Hub: University Task Force for the resilience of territorial ecosystems”, supported by Università degli Studi di Milano – PSR 2021 – GSA – Linea 6. We gratefully thank also Piano di Sostegno alla Ricerca 2021 (Linea 2A) – Università degli Studi di Milano. A. M. acknowledges project PNRR – Partenariati estesi – NEST – Network 4 Energy Sustainable Transition – PE0000021 for partial funding.References
- M. Bellini, M. v. Pagliaro, A. Lenarda, P. Fornasiero, M. Marelli, C. Evangelisti, M. Innocenti, Q. Jia, S. Mukerjee, J. Jankovic, L. Wang, J. R. Varcoe, C. B. Krishnamurthy, I. Grinberg, E. Davydova, D. R. Dekel, H. A. Miller and F. Vizza, Palladium–Ceria Catalysts with Enhanced Alkaline Hydrogen Oxidation Activity for Anion Exchange Membrane Fuel Cells, ACS Appl. Energy Mater., 2019, 2, 4999–5008 CrossRef CAS.
- H. A. Miller and F. Vizza, Electrocatalysts and Mechanisms of Hydrogen Oxidation in Alkaline Media for Anion Exchange Membrane Fuel Cells, in Anion Exchange Membrane Fuel Cells, Lecture Notes in Energy, ed. L. An and T. Zhao, vol. 63, Springer, Cham, 2018, DOI:10.1007/978-3-319-71371-7_3.
- H. A. Miller, M. v. Pagliaro, M. Bellini, F. Bartoli, L. Wang, I. Salam, J. R. Varcoe and F. Vizza, Integration of a Pd-CeO2/C Anode with Pt and Pt-Free Cathode Catalysts in High Power Density Anion Exchange Membrane Fuel Cells, ACS Appl. Energy Mater., 2020, 3, 10209–10214 CrossRef CAS.
- T. J. Omasta, X. Peng, H. A. Miller, F. Vizza, L. Wang, J. R. Varcoe, D. R. Dekel and W. E. Mustain, Beyond 1.0 W cm−2 Performance without Platinum: The Beginning of a New Era in Anion Exchange Membrane Fuel Cells, J. Electrochem. Soc., 2018, 165, J3039–J3044 CrossRef CAS.
- T. Gao, J. Yang, M. Nishijima, H. A. Miller, F. Vizza, H. Gu, H. Chen, Y. Hu, Z. Jiang, L. Wang, L. Shuai, M. Qiu, C. Lei, A. Zhang, Y. Hou and Q. He, Evidence of the Strong Metal Support Interaction in a Palladium-Ceria Hybrid Electrocatalyst for Enhancement of the Hydrogen Evolution Reaction, J. Electrochem. Soc., 2018, 165, F1147–F1153 CrossRef CAS.
- Y. Jiang, J. Huang, B. Mao, T. An, J. Wang and M. Cao, Inside solid-liquid interfaces: understanding the influence of the electrical double layer on alkaline hydrogen evolution reaction, Appl. Catal., B, 2021, 293, 120220 CrossRef CAS.
- V. Men Truong, J. Richard Tolchard, J. Svendby, M. Manikandan, H. A. Miller, S. Sunde, H. Yang, D. R. Dekel and A. Oyarce Barnett, Platinum and Platinum Group Metal-Free Catalysts for Anion Exchange Membrane Fuel Cells, Energies, 2020, 13, 582 CrossRef.
- R. K. Singh, E. S. Davydova, J. Douglin, A. O. Godoy, H. Tan, M. Bellini, B. J. Allen, J. Jankovic, H. A. Miller, A. C. Alba-Rubio and D. R. Dekel, Synthesis of CeOx-Decorated Pd/C Catalysts by Controlled Surface Reactions for Hydrogen Oxidation in Anion Exchange Membrane Fuel Cells, Adv. Funct. Mater., 2020, 30, 2002087 CrossRef CAS.
- H. Yu, E. S. Davydova, U. Ash, H. A. Miller, L. Bonville, D. R. Dekel and R. Maric, Palladium-ceria nanocatalyst for hydrogen oxidation in alkaline media: optimization of the Pd–CeO2 interface, Nano Energy, 2019, 57, 820–826 CrossRef CAS.
- S. Sahoo, D. R. Dekel, R. Maric and S. P. Alpay, Atomistic Insights into the Hydrogen Oxidation Reaction of Palladium-Ceria Bifunctional Catalysts for Anion-Exchange Membrane Fuel Cells, ACS Catal., 2021, 11, 2561–2571 CrossRef CAS.
- M. Sabokkhiz, F. Fathirad and D. Afzali, PdZrO2/rGO-FTO as an effective modified anode and cathode toward methanol electro-oxidation and hydrogen evolution reactions, Nanotechnology, 2021, 32, 485402 CrossRef CAS PubMed.
- J. Wang, X. Xiao, Y. Liu, K. Pan, H. Pang and S. Wei, The application of CeO2-based materials in electrocatalysis, J. Mater. Chem. A, 2019, 7, 17675–17702 RSC.
- T. Tang, L. Ding, Z. Yao, H. Pan, J. Hu and L. Wan, Synergistic Electrocatalysts for Alkaline Hydrogen Oxidation and Evolution Reactions, Adv. Funct. Mater., 2022, 32, 2107479 CrossRef CAS.
- I. T. McCrum and M. T. M. Koper, The role of adsorbed hydroxide in hydrogen evolution reaction kinetics on modified platinum, Nat. Energy, 2020, 5, 891–899 CrossRef CAS.
- Z. Abdin, A. Zafaranloo, A. Rafiee, W. Mérida, W. Lipiński and K. R. Khalilpour, Hydrogen as an energy vector, Renewable Sustainable Energy Rev., 2020, 120, 109620 CrossRef CAS.
- S. Gennard, F. Corà and C. R. A. Catlow, Comparison of the Bulk and Surface Properties of Ceria and Zirconia by ab Initio Investigations, J. Phys. Chem. B, 1999, 103, 10158–10170 CrossRef CAS.
- W. Sheng, H. A. Gasteiger and Y. Shao-Horn, Hydrogen Oxidation and Evolution Reaction Kinetics on Platinum: Acid vs. Alkaline Electrolytes, J. Electrochem. Soc., 2010, 157, B1529 CrossRef CAS.
- Y. Zheng, Y. Jiao, A. Vasileff and S. Qiao, The Hydrogen Evolution Reaction in Alkaline Solution: From Theory, Single Crystal Models, to Practical Electrocatalysts, Angew. Chem., Int. Ed., 2018, 57, 7568–7579 CrossRef CAS PubMed.
- P. S. Lamoureux, A. R. Singh and K. Chan, pH Effects on Hydrogen Evolution and Oxidation over Pt(111): Insights from First-Principles, ACS Catal., 2019, 9, 6194–6201 CrossRef CAS.
- E. Skúlason, G. S. Karlberg, J. Rossmeisl, T. Bligaard, J. Greeley, H. Jónsson and J. K. Nørskov, Density functional theory calculations for the hydrogen evolution reaction in an electrochemical double layer on the Pt(111) electrode, Phys. Chem. Chem. Phys., 2007, 9, 3241–3250 RSC.
- T. J. Schmidt, P. N. Ross and N. M. Markovic, Temperature dependent surface electrochemistry on Pt single crystals in alkaline electrolytes, J. Electroanal. Chem., 2002, 524–525, 252–260 CrossRef CAS.
- K. J. P. Schouten, M. J. T. C. van der Niet and M. T. M. Koper, Impedance spectroscopy of H and OH adsorption on stepped single-crystal platinum electrodes in alkaline and acidic media, Phys. Chem. Chem. Phys., 2010, 12, 15217 RSC.
- I. Ledezma-Yanez, W. D. Z. Wallace, P. Sebastián-Pascual, V. Climent, J. M. Feliu and M. T. M. Koper, Interfacial water reorganization as a pH-dependent descriptor of the hydrogen evolution rate on platinum electrodes, Nat. Energy, 2017, 2, 17031 CrossRef CAS.
- S. Minelli, M. Civelli, S. Rondinini, A. Minguzzi and A. Vertova, AEMFC Exploiting a Pd/CeO2-Based Anode Compared to Classic PEMFC via LCA Analysis, Hydrogen, 2021, 2, 246–261 CrossRef CAS.
- S. M. Popescu, H. O. Manolea, O. A. Diaconu, V. Mercuţ, M. Scrieciu, I. T. Dascălu, M. J. Ţuculină, F. Obădan and F. D. Popescu, Zirconia Biocompatibility in Animal Studies – A Systematic Review, Defect Diffus. Forum, 2017, 376, 12–28 Search PubMed.
- B. Millán-Ramos, D. Morquecho-Marín, P. Silva-Bermudez, D. Ramírez-Ortega, O. Depablos-Rivera, J. García-López, M. Fernández-Lizárraga, J. Victoria-Hernández, D. Letzig, A. Almaguer-Flores and S. E. Rodil, Biocompatibility and electrochemical evaluation of ZrO2 thin films deposited by reactive magnetron sputtering on MgZnCa alloy, J. Magnesium Alloys, 2021, 9, 2019–2038 CrossRef.
- C. Bundesmann and H. Neumann, Tutorial: the systematics of ion beam sputtering for deposition of thin films with tailored properties, J. Appl. Phys., 2018, 124, 231102 CrossRef.
- M. Łukaszewski, Electrochemical Methods of Real Surface Area Determination of Noble Metal Electrodes – An Overview, Int. J. Electrochem. Sci., 2016, 4442–4469 CrossRef.
- R. Behrisch and W. Eckstein, Sputtering by Particle Bombardment, Springer, Berlin, Heidelberg, 2007, vol. 110 Search PubMed.
- M. C. Militello and S. J. Simko, Palladium Oxide (PdO) by XPS, Surf. Sci. Spectra, 1994, 3, 395–401 CrossRef CAS.
- K. S. Kim, A. F. Gossmann and N. Winograd, X-ray photoelectron spectroscopic studies of palladium oxides and the palladium-oxygen electrode, Anal. Chem., 1974, 46, 197–200 CrossRef CAS.
- D. D. Sarma and C. N. R. Rao, XPES studies of oxides of second- and third-row transition metals including rare earths, J. Electron Spectrosc. Relat. Phenom., 1980, 20, 25–45 CrossRef CAS.
- R. Nyholm and N. Martensson, Core level binding energies for the elements Zr-Te (Z=40-52), J. Phys. C: Solid State Phys., 1980, 13, L279–L284 CrossRef CAS.
- P. M. T. M. van Attekum and J. M. Trooster, Bulk- and surface-plasmon-loss intensities in photoelectron, Auger, and electron-energy-loss spectra of Mg metal, Phys. Rev. B: Condens. Matter Mater. Phys., 1979, 20, 2335–2340 CrossRef CAS.
- P. M. A. Sherwood, The use and misuse of curve fitting in the analysis of core X-ray photoelectron spectroscopic data, Surf. Interface Anal., 2019, 51, 589–610 CrossRef CAS.
Footnote |
| † Electronic supplementary information (ESI) available. See DOI: https://doi.org/10.1039/d3se00053b |
| This journal is © The Royal Society of Chemistry 2023 |