
 Open Access Article
 This Open Access Article is licensed under a Creative Commons Attribution-Non Commercial 3.0 Unported Licence
How can the European Ecodesign Directive guide the deployment of hydrogen-related products for mobility?†
Felipe
Campos-Carriedo
 ab,
Eleonora
Bargiacchi
*a,
Javier
Dufour
ab and
Diego
Iribarren
a
ab,
Eleonora
Bargiacchi
*a,
Javier
Dufour
ab and
Diego
Iribarren
a
aIMDEA Energy, Systems Analysis Unit, 28935, Móstoles, Spain. E-mail: eleonora.bargiacchi@imdea.org
bRey Juan Carlos University, Chemical and Environmental Engineering Group, 28933, Móstoles, Spain
First published on 24th February 2023
Abstract
Fuel cells and hydrogen products are expected to be increasingly deployed as European economies set course towards the energy transition. In order to actually contribute to the overall goal of sustainability, these products should be conceived as sustainable-by-design options and effective assessment tools are thus required to guide the design process. For the first time in the specific field of hydrogen-related products, this work tests and discusses the suitability of the instrument provided by the European Ecodesign Directive for such purposes: the EcoReport tool linked to the Methodology for Ecodesign of Energy-related Products. To that end, the propulsion systems of a fuel cell passenger car and a fuel cell heavy duty truck were assessed. First, two base cases defined according to current key performance indicators were implemented in the EcoReport tool to gain insights into ecodesign hotspots and gaps of the tool for its practical use to evaluate hydrogen-related products. Secondly, after adjusting the EcoReport tool according to the findings of the previous step, both cases were parametrised to estimate, under eco-efficiency and criticality aspects, up to which extent short-term technological targets could improve their performance. Overall, the EcoReport tool is concluded to be valuable for an early assessment and subsequent development of ecodesign measures for hydrogen-related products provided that it is upgraded in terms of direct data availability, updated criticality characterisation factors and impact assessment methods. By reaching the key performance indicators expected for 2030, the assessed products for mobility would arise as competitive road transport alternatives. Nevertheless, this performance is highly dependent on the production pathway of the hydrogen used as a fuel, which highlights the need for a holistic deployment of the hydrogen economy.
Introduction
The European Union (EU) has committed to reducing its overall greenhouse gas emissions by at least 55% in 2030, relative to 1990 levels.1 In order to achieve this goal, specific binding objectives have been set out for different sectors. These include ensuring zero tailpipe emissions from new passenger cars, increasing the renewable electricity fraction in the EU mix up to 40% and achieving an overall reduction of 36–39% in final and primary energy consumption through energy efficiency.2 This roadmap not only positions Europe as a world leader in the energy transition but also, in a subsidiary way, looks forward to reducing energy dependence. Energy imports reached over 60% of the continental final energy consumption in 2019, Russia being the top trading partner in crude oil, natural gas and solid fossil fuels.3 This fact places the EU in a position of weakness, especially in a context of geopolitical instability (Ukraine crisis) and raw material scarcity.4Such an energy transition will profoundly alter how the European countries generate, distribute, store, and consume energy. In this situation, the fuel cells and hydrogen (FCH) sector has been identified as one of its crucial enablers. Hydrogen arises as a versatile, clean and flexible product with the potential of fostering the integration of renewables into the European electricity mix (offering a path to store renewable electricity surplus), providing transportation with a fuel free of tailpipe carbon emissions, replacing natural gas for heating purposes and enlarging its contribution to industry feedstocks. It is estimated that the deployment of hydrogen could contribute to filling half of the gap between the reference technology scenario in 2050 (reductions considered mostly via state-of-the-art solutions with increased energy efficiency) and the Paris Agreement scenario (<2 °C rise in global surface temperature).5
Thus, Europe has established ambitious goals for the short, medium and long-term deployment of the FCH sector. It is foreseen that up to 2250 TW h of hydrogen could be generated internally by 2050, implying a rapid escalation of the water electrolysis installed capacity to 15–40 GW by 2030 (ref. 5) and enabling the production of renewable hydrogen at a cost lower than 3 € per kg.6 Regarding end users, in a 2050 ambitious scenario, fuel cell electric vehicles (FCEVs) could account for the largest share of the hydrogen demand (ca. 30%).5 It is envisaged that one out of 22 passenger vehicles, one out of 12 light commercial vehicles and 45![[thin space (1/6-em)]](https://www.rsc.org/images/entities/char_2009.gif) 000 heavy duty vehicles (trucks and buses) could be on the roads by 2030, adding up to a total FCEV fleet of over 4 million units.5 As the road transport sector is expected to play a key role in the energy transition and decarbonisation of European economies,7–9 the replacement of traditional propulsion systems by FCEVs has been estimated to be potentially responsible for over 40% of the carbon footprint reduction assignable to all hydrogen applications in 2050.5
000 heavy duty vehicles (trucks and buses) could be on the roads by 2030, adding up to a total FCEV fleet of over 4 million units.5 As the road transport sector is expected to play a key role in the energy transition and decarbonisation of European economies,7–9 the replacement of traditional propulsion systems by FCEVs has been estimated to be potentially responsible for over 40% of the carbon footprint reduction assignable to all hydrogen applications in 2050.5
Proton exchange membrane fuel cells (PEMFCs) have been used in various applications since the early 2000s, currently being the only fuel cell alternative proven to be effective and market-available for transport purposes. This is because PEMFCs present features which perfectly fit transport functional requirements, such as the employment of a solid electrolyte (avoiding the dependence on corrosive liquids and easing maintenance), a low working temperature and quick start-up times.10 However, the current market penetration of PEMFCs is limited due to issues that affect their performance and competitiveness: high cost, insufficient durability, and limited power density.11 In particular, the use of platinum in the PEMFC stack is linked to over 50% of the device manufacturing costs and presents relevant environmental and social impacts.12 It is expected that the upcoming generations of passenger FCEVs will limit platinum loading to 3–7 g (nowadays requiring around 3–6 times this value), thereby achieving similar levels to those presented by the catalytic converters of diesel vehicles.13
In order to achieve an effective deployment of FCH technologies according to the overall sustainability goal, a holistic approach needs to be followed from their early conception, thereby ensuring a suitable life-cycle economic, environmental and social performance. In other words, FCH products need to be sustainable-by-design options that avoid burden shifting across (and within) sustainability dimensions. From this perspective, ecodesign is a key methodology that promotes the integration of environmental aspects into all stages of the product development process. By balancing ecological and economic requirements,14 ecodesign strives for technically and economically feasible goods accountable for the lowest environmental impact throughout the entire product life cycle. However, the literature exploring the nexus between FCH technologies and ecodesign is very scarce. Dumortier and Haussener15 presented in 2015 two design guidelines to reduce the environmental impact of photo-electrochemical water splitting devices for hydrogen production, with a focus on the most suitable combination of components at the system level. More recently, Ansaloni et al.16 made use of the Ecodesign Strategy Wheel to specifically address state-of-the-art hydrogen-based fuel passenger ships and scenarios developed in the e-SHyIPS project.17
In fact, the EU counts on a robust legal framework to support the ecodesign of energy-related products and progressively withdraw detrimental alternatives from the market: the Ecodesign Directive 2009/125/EC.18 A product group must meet specific pre-requisites to be targeted by the Ecodesign Directive. In particular, it must have a significant environmental impact (generally, an annual energy consumption higher than 1 EJ), high potential for affordable environmental improvement, and market relevance (more than 200000 units per year sold and traded).18 However, the unexplored application of this normative framework to emerging technologies that are expected to reach such figures in the short-to-medium term (e.g. FCH ones) could entail a change of the paradigm in the scope of the directive, shifting from promoting replacement to preventing the penetration of alternatives that do not comply with certain sustainability standards.
On the other hand, ‘electric batteries’ is one of the product groups undergoing the ecodesign process.19 Although the directive specifically states that the modes of transport should not be considered eligible for ecodesign measures under this regulation, the fact that the European Commission elaborated a working plan to include products with the potential of being used as vehicle propellers, but that may be used in other applications, sets a precedent to address goods of similar functional nature such as PEMFCs for mobility.
Fig. 1 shows the procedure endorsed for the implementation of ecodesign measures.20 Since FCH products are being promoted as key vectors for the energy transition and pivotal documents such as the European Hydrogen Strategy21 forecast an important penetration into the road transport market, this work focuses on the second step of the process (i.e. preparatory study) to explore – for the first time – the suitability of the EU ecodesign framework to address FCH products. In particular, the EcoReport tool linked to the Methodology for Ecodesign of Energy-related Products (MEErP) to carry out environmental and economic assessment in preparatory studies within the context of the directive is discussed through the case of PEMFCs for mobility to fill the identified gaps on (i) testing the practicality of the tool when applied to FCH products, and (ii) evaluating how the establishment of ecodesign measures aligned with projected key performance indicators (KPIs) could improve their profile.
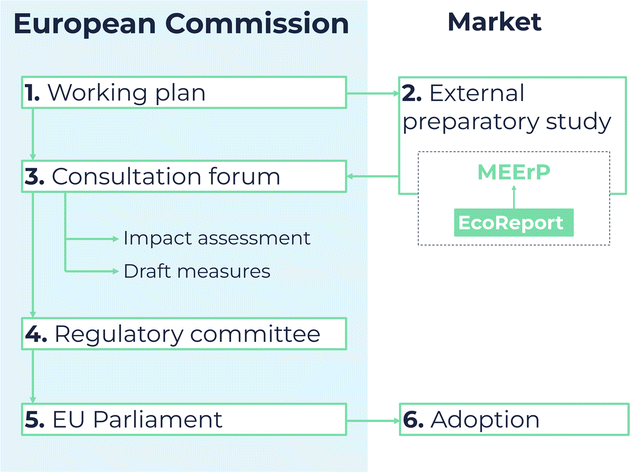 | ||
| Fig. 1 Overview of the ecodesign process according to directive 2009/125/EC. | ||
Methodology
As a preparatory study according to the European Ecodesign Directive, this work was conducted following the guidelines of the MEErP.22,23 This methodology was launched in 2011 in the context of the EU Ecodesign Directive, as a revision and extension of the Methodology for Ecodesign of Energy-using Products (MEEuP). It provides practitioners with the EcoReport tool: a static, simplified life-cycle assessment spreadsheet containing a limited database of materials and their unit contributions to several pre-defined environmental impact categories. The tool is available for public download in ref. 24. The EcoReport tool also considers economic and criticality assessment, even though it does not provide a library of default data to that end. Suggestions on broadening the scope of the MEErP and updating the resource efficiency indicators provided by the EcoReport have been made in previous studies.25,26Within the overall goal of answering the general question posed in the title of this work, a methodological framework making use of the EcoReport tool was developed to address two specific research questions: (i) is the EcoReport tool a practical instrument to assess FCH products for ecodesign purposes? and (ii) can the implementation of ecodesign measures improve the performance of PEMFC technologies and turn hydrogen into a competitive alternative for road transport? The following sections explain how each of these questions was approached from a methodological perspective.
EcoReport-based assessment of base cases
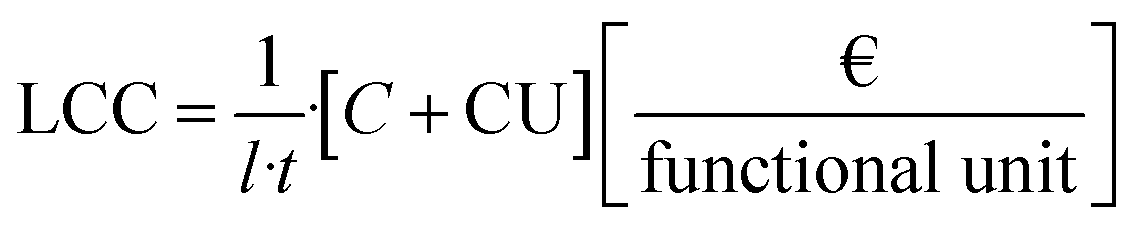
In order to discuss the suitability of the EcoReport tool when applied to FCH products for mobility and identify ecodesign hotspots, two base cases of PEMFC systems were built using 2020 as the base year. Thus, two sizes of PEMFC stacks were considered, corresponding to those typically involved in (i) a large fuel cell passenger car and (ii) a fuel cell heavy duty truck. The definition of such devices was based on the eGHOST project27 and current KPIs,6 scaled linearly to a fuel cell power of 114 kW (Toyota Mirai as a reference for a fuel cell passenger car available in the market30) and 190 kW (Hyundai Xcient as a reference for a heavy duty fuel cell truck available in the market28,29). Since the system boundaries were set to account for both the storage and the energy delivery functionalities, the hydrogen tank, the balance of plant (BoP) and the auxiliary battery were also included in the analysis. The features of the hydrogen tanks were retrieved from ref. 28 for the car, and calculated from ref. 30 for the truck. The auxiliary battery was modelled from ref. 19 and scaled linearly to the capacity of the auxiliary battery used by the two case studies (1.6 and 72.3 kW h, respectively). The BoP was retrieved from ref. 31 and scaled linearly to each stack power. It includes the air (filtration and compression), water (humidifiers for cathode air and anode hydrogen), thermal (radiators and coolant pump) and fuel (hydrogen recirculation blower and ejectors) management systems.As specified by default in the EcoReport tool, the scope of the analysis consisted of the life-cycle phases of materials production, components manufacturing, distribution, use, and end of life (EoL). Each of these phases corresponds to a specific section in the tool (the use phase section is further divided into a direct impact and an indirect impact compartment). The assessed indicators – reported per unit of propulsion system – were the global warming impact potential (GWP, in kg CO2-eq.) for the environmental dimension, the life cycle cost without externalities (LCC, in €) within the economic dimension, and the critical raw material (CRM) content in kg Sb-eq. The criticality assessment was conducted considering as critical materials those included in the 2020 list defined by the European Commission.32
The inputs for the materials production section were given by the bill of materials (BoM) of each of the base cases. The list of materials included by default in the EcoReport tool was found to cover only three out of the 11 materials contained in the PEMFC stack and the hydrogen tank. The data inventories of the other materials (cf.Table 1) were built by modelling their unit production in SimaPro software33 coupled with the ecoinvent database.34 The characterisation factors stated in the MEErP were used when generating the carbon footprint results. The auxiliary battery (with extended lifetime and reduced material usage ecodesign measures implemented35) and BoP impacts were directly retrieved from ref. 19 and 31.
| Extra materials and components | Platinum | Carbon black particles | PFSA | Thermoactive glue | Carbon fibre | Silicone | Balance of plant | Auxiliary battery19 | |
|---|---|---|---|---|---|---|---|---|---|
| a Carbon footprints per kg of material (platinum, carbon black particles, PFSA, glue, carbon fibre, and silicone) or per kg of component (BoP and auxiliary battery). | |||||||||
| Carbon footprinta [kg CO2-eq.] | 70122.35 |
1.84 | 959.00 | 3.39 | 85.85 | 2.93 | 7.03 | 13.26 | |
| End-of-life scenarios | Re-use | 0% | 0% | 0% | 0% | 98% | 0% | 100% | 1% |
| Recycling | 75% | 0% | 0% | 0% | 0% | 0% | 0% | 0% | |
| Heat recovery | 0% | 0% | 0% | 0% | 0% | 0% | 0% | 9% | |
| Incineration | 0% | 0% | 50% | 100% | 0% | 100% | 0% | 23% | |
| Landfilling | 25% | 100% | 50% | 0% | 2% | 0% | 0% | 67% | |
The components manufacturing stage was left as defined by default in the EcoReport tool, whereas the packaged volume of the systems to be input in the distribution phase section was assumed to be 0.5 m3. In the use phase indirect impact section, a steady carbon footprint of 3.384 kg CO2-eq. kg−1 H2 was associated with the hydrogen fuel impact. This value corresponds to the threshold set by the European Renewable Energy Directive (RED II) for a fuel to be considered renewable (70% well-to-wheel impact reduction with respect to a conventional fuel),36 calculated with the same characterisation factors included in the EcoReport tool. It was implemented as a consumable defined as an extra material. The durability, annual mileage of the systems and hydrogen consumption were retrieved from current KPIs (originally, in hours, kilometres per year and kilogrammes of H2 per kilometre) and combined to obtain the durability and the consumption measured in the units required by the tool (years and kilogrammes of H2 per year). In this calculation, an average driving cycle of 34.1 km h−1 for the car19 (urban and extra-urban use) and 50 km h−1 for the truck6 (long-distance freight transportation) was assumed. The default use phase direct impact section was kept since the only relevant environmental impacts are those related to maintenance (the tool quantifies the requirement of spare parts as 1% of the total mass of each product system).
Regarding the EoL phase, the lifetime of the cells in the stack was assumed to be the limiting factor for the durability of the full product system (i.e. the system lasts until the cells reach the end of their operational life37,38). The expected larger lifetime of the tank and the BoP39 was taken into account in their specific EoL scenarios, setting a re-use rate of 100% for the materials included in these components. Concerning the auxiliary batteries, the EoL scenarios from ref. 19 were assumed without considering replacements (as they present higher durability than the stack cells). The implementation of the EoL scenarios in the model also required the modification of the original EcoReport spreadsheet because only one EoL option was allowed for every extra material. A maximum of 25% of the mass of the system was considered to be available from secondary markets, acknowledging the projected increase in the market size of these technologies. An overview of the extra attributes corresponding to this part of the tool is also provided in Table 1.
In the economic section, the capital expenditure (CAPEX) was defined by adding the current CAPEX KPI (stack, BoP, and tank) and the auxiliary battery acquisition cost in ref. 19. The items related to the operational expenditure (OPEX) included the hydrogen delivered price and the maintenance costs according to the KPIs for 2020, the discount rate (4%, as suggested by default in the MEErP), and the escalation rate. The latter was defined as the relative variation in the fuel worth between the end of the operational life of the FCH system and the time the product was released to the market.
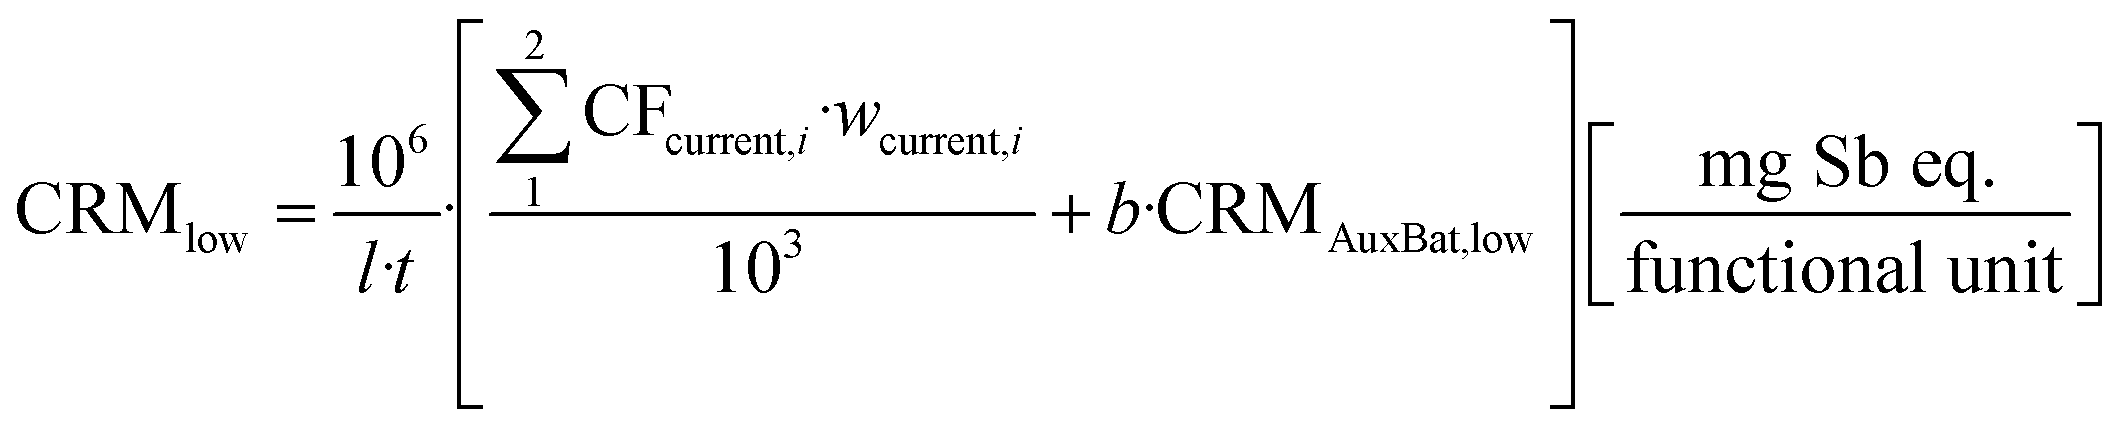
Updated criticality characterisation factors were calculated to align the EcoReport tool with the last update of the CRM list.32 This was conducted following the semi-quantitative numerical formulation proposed by the MEErP22 (only materials in the BoMs identified as critical in the list are assigned a characterisation factor), leading to the following results measured in kg Sb-eq. per kg of CRM: 17.5 for platinum and 5.37 × 10⁻³ for natural graphite. The CRM indicator of the auxiliary batteries19 was also re-calculated according to the most recent list, involving the following critical materials: cobalt (5.03 × 10⁻² kg Sb-eq. kg−1), natural graphite (5.37 × 10⁻³ kg Sb-eq. kg−1), and lithium (2.07 × 10⁻¹ kg Sb-eq. kg−1). This led to a CRM indicator of 6.13 × 10⁻² and 3.24 kg Sb-eq. per battery system for the car and truck base cases, respectively.
ESI I and II† (Inputs and Extra Materials tabs) show how the aforementioned data were implemented in the EcoReport spreadsheet for each of the base cases.
Parametric EcoReport-based assessment
In order to evaluate how the progressive implementation of technologically feasible ecodesign measures could improve the performance of FCH products for mobility given the emerging nature of the devices under evaluation, it was needed to provide the EcoReport tool with parametric attributes rather than assessing a finite number of static base cases and improved alternatives (which would be common in ecodesign preparatory studies for more mature technologies). Such a parametrisation was enabled by complementing the EcoReport spreadsheet with a MATLAB® algorithm. Nevertheless, it should be noted that a full prospective life cycle assessment is out of the scope of the present work, acknowledging that both the characterisation factors and the background data were defined in the tool for a single reference year. In other words, the extension of this work to a full prospective life cycle assessment would require not only the use of a complete set of prospective foreground data but also further efforts in aspects such as prospective background data availability.40Table 2 presents the techno-economic definition of the two case studies, which comprises some fixed specifications from the base cases as well as the set of parameters introduced in the analysis.| Fuel cell car | Fuel cell truck | |||
|---|---|---|---|---|
| PEMFC stack | Power [kW] | 114 | 190 | |
| Bill of materials | Platinum [g/stack] | Parameter (mPt) | Parameter (mPt) | |
| Carbon black particles [kg/stack] | 1.41 | 2.34 | ||
| Perfluorosulfonic acid (PFSA) [kg/stack] | 0.41 | 0.68 | ||
| Polyethylene terephthalate (PET) [kg/stack] | 13.49 | 22.48 | ||
| Thermoactive glue [kg/stack] | 3.37 | 5.62 | ||
| Gas diffusion layer [kg/stack] | 2.10 | 3.50 | ||
| Stainless steel [kg/stack] | 51.35 | 85.59 | ||
| Silicone [kg/stack] | 11.88 | 19.79 | ||
| Glass-reinforced thermoplastic [kg/stack] | 3.80 | 3.80 | ||
| Copper [kg/stack] | 2.26 | 3.76 | ||
| Steel [kg/stack] | 8.72 | 14.54 | ||
| Hydrogen tank | Capacity [kg H2] | 5 | 32.09 | |
| Weight [kg] | 82.5 | 175 | ||
| Auxiliary battery | Capacity [kW h] | 1.6 | 72.3 | |
| Weight [kg] | 33.60 | 278.62 | ||
| Balance of plant | Weight [kg] | 78.38 | 130.63 | |
| CAPEX (including externalities linked to the production phase) [€ per system] | Parameter (C) | Parameter (C) | ||
| System durability [km] | Parameter (t) | Parameter (t) | ||
| Annual mileage [km] | 14000 |
Parameter (m) | ||
| Hydrogen consumption [kg H2 km−1] | Parameter (Ḣ) | Parameter (Ḣ) | ||
| Hydrogen delivered price [€ per kg H2] | Parameter (O) | Parameter (O) | ||
| Maintenance cost [€ per km] | Parameter (n) | Parameter (n) | ||
The domain for those parameters was defined according to the KPIs that the Strategic Research and Innovation Agenda of the Clean Hydrogen Partnership6 sets for PEMFC technologies until 2030, disregarding further improvement from then on. These KPIs were therefore adopted as technologically feasible targets that ecodesign measures could foster. In order to enable continuity in the assessment, regressions on the intermediate milestones were calculated. Preferably, a linear model was implemented. Only when the correlation coefficient in the linear regression resulted lower than 0.95, an inverse linear model was considered. When the latter did not meet the correlation requirement either, an exponential model was applied (Table 3). The choice of these regression models was based on a trial and error approach that led to the conclusion that they were the ones that suitably fitted the tendency of the data.
| Parameter (symbol) [unit] | FCEV | 2012 | 2017 | 2020 | 2024 | 2030 | Regression |
|---|---|---|---|---|---|---|---|
| a Hours were converted into the operational lifetime distance using average drive cycles of 34.1 km h−1 for the car19 and 50 km h−1 for the truck.6 | |||||||
| Platinum loading (mPt) [g] | Car | — | 45.6 | 19.38 | 9.12 | 5.7 | Inverse linear |
| Truck | — | — | 76 | 66.5 | 57 | Linear | |
| CAPEX (C) [€ per system] | Car | 73030.4 |
17030.4 |
9870.4 | 8210.4 | 6550.4 | Inverse linear |
| Truck | 51023.3 |
43064.3 |
35105.3 |
Exponential | |||
| System durabilitya (t) [km] | Car | 85250 |
136400 |
170500 |
204600 |
238700 |
Linear |
| Truck | — | — | 750000 |
1000000 |
1500000 |
Linear | |
| Annual mileage (m) [km] | Car | — | — | — | — | — | |
| Truck | — | — | 50000 |
— | 100000 |
Linear | |
| Hydrogen consumption (Ḣ) [kg H2 per km] | Car | — | 0.012 | 0.0115 | 0.011 | 0.01 | Linear |
| Truck | — | — | 0.062 | 0.056 | 0.050 | Linear | |
| Delivered hydrogen price (O) [€ per kg H2] | Car | 13 | 12 | 11 | 9 | 6 | Linear |
| Truck | 13 | 12 | 11 | 9 | 6 | Linear | |
| Maintenance cost (n) [€ per km] | Car | — | 0.04 | 0.03 | 0.02 | 0.01 | Linear |
| Truck | — | — | 0.3 | 0.2 | 0.1 | Inverse linear | |
Parametric results from the adjusted EcoReport tool were transposed to the functional unit most commonly used in life cycle assessment of transport systems:41 passenger-kilometre (p km) for the passenger car case study and tonne-kilometre (t km) for the truck case study. An average car occupancy rate of 1.62 passengers and an average truck carried load of 15.96 tonnes were considered. These assumptions were based on ecoinvent database guidelines for passenger cars and trucks over 32 tonnes of gross combined weight in the European territory.34 Taking into account the time horizon of the parametric study, the economic indicator (LCC) of this section also accounted for externalities.42
Eqn (1), (2) and (3) show the expressions used to conduct the required calculations. In them, l refers indistinctly to passengers (for the car case) or cargo (for the truck case, in tonnes):
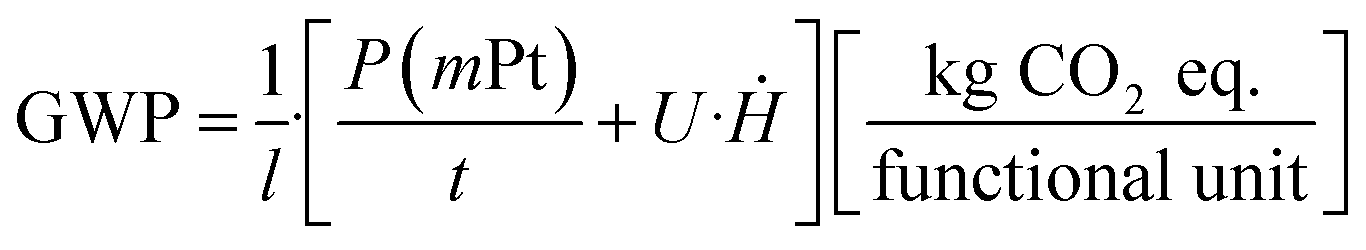 | (1) |
 | (2) |
| CU = PWF·(CUext + m·O·Ḣ + m·n)[€] | (3) |
The overall CRM indicator was reported per functional unit as a range according to eqn (4) and (5), this time not only including the materials labelled as critical in the 2020 EU CRM list, but also those that could become critical in the near future if a full deployment of FCH technologies took place.13 The lower edge refers to the current European list (CRMlow) and the upper edge refers to the supplementary acknowledgement of those materials foreseen as critical in the short term (CRMhigh). An additional characterisation factor (CF) for copper (8.90 × 10⁻⁴ kg Sb-eq. per kg of potential CRM) was therefore defined. The same procedure was applied to auxiliary batteries, identifying potential CRMs from ref. 19 (nickel and manganese). This led to an upper edge criticality (CRMAuxBat,high) of 8.00 × 10⁻² and 4.60 kg Sb-eq. per battery system for the car and truck case studies, respectively.
 | (4) |
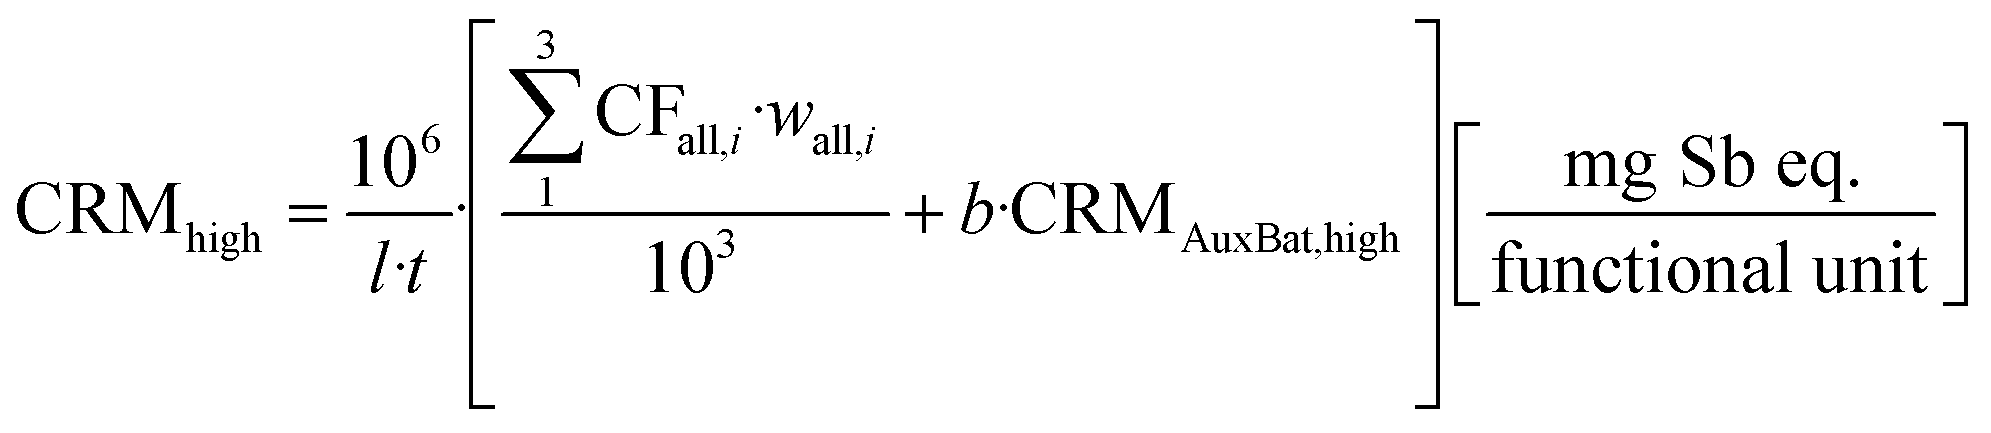 | (5) |
Eco-efficiency assessment
The term eco-efficiency (EE) was defined in 1992 by the World Business Council for Sustainable Development as the achievement of delivering “competitively priced goods and services that satisfy human needs and bring quality of life, while progressively reducing ecological impacts and resource intensity throughout the life-cycle to a level at least in line with the Earth's estimated carrying capacity”.45 In 1996, the BASF petrochemical corporation presented a method for quantifying EE based on the environmental and economic life-cycle impacts of a product or process.46 This approach led later to an international standard on EE assessment (ISO 14045:2012).47 Valente et al.48 explored the possibilities of using the standardised EE concept as a partial indicator of the sustainability of FCH systems, overcoming the lack of EE analyses in this field. They proposed eqn (6), also adopted in this study, to quantify EE: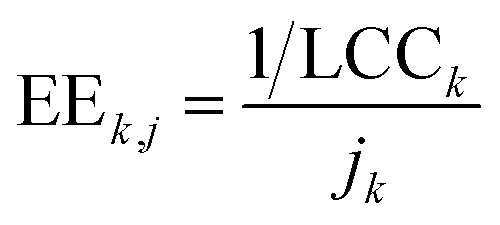 | (6) |
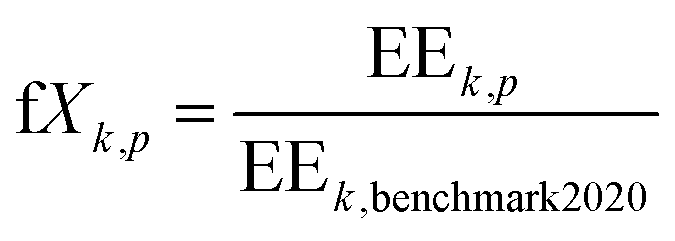
With the aim of providing a clearer insight into the EE performance of each PEMFC product system k according to their progress in the period 2020–2030, the factor-X (fX) calculation was also conducted. As expressed in eqn (7), this was carried out by quantifying throughout the modelling period the ratio of the EE score in the year p to the EE score of the benchmark corresponding with the year 2020 under the RED II threshold scenario (base cases defined in the first step of the methodological framework). Hence, an fX > 1 corresponds to an improved EE performance with respect to the benchmark: the higher the fX result, the higher the EE gain.
 | (7) |
Fig. 2 presents an overview of the methodology followed to develop the parametric EcoReport-based assessment described in this section. Furthermore, in order to identify the life-cycle stages arising as EE hotspots, an impact contribution analysis was performed for the years 2020, 2025 and 2030 according to the inverse of the EE results. In this way, a straightforward identification of critical life-cycle stages was facilitated since a higher contribution directly corresponds to a more detrimental role in EE terms. Additionally, a continuous one-at-a-time (OAT) sensitivity analysis was carried out for the durability, hydrogen consumption, CAPEX and platinum loading parameters in order to identify those with a major influence on the fX results (thus indicating where to focus ecodesign efforts).
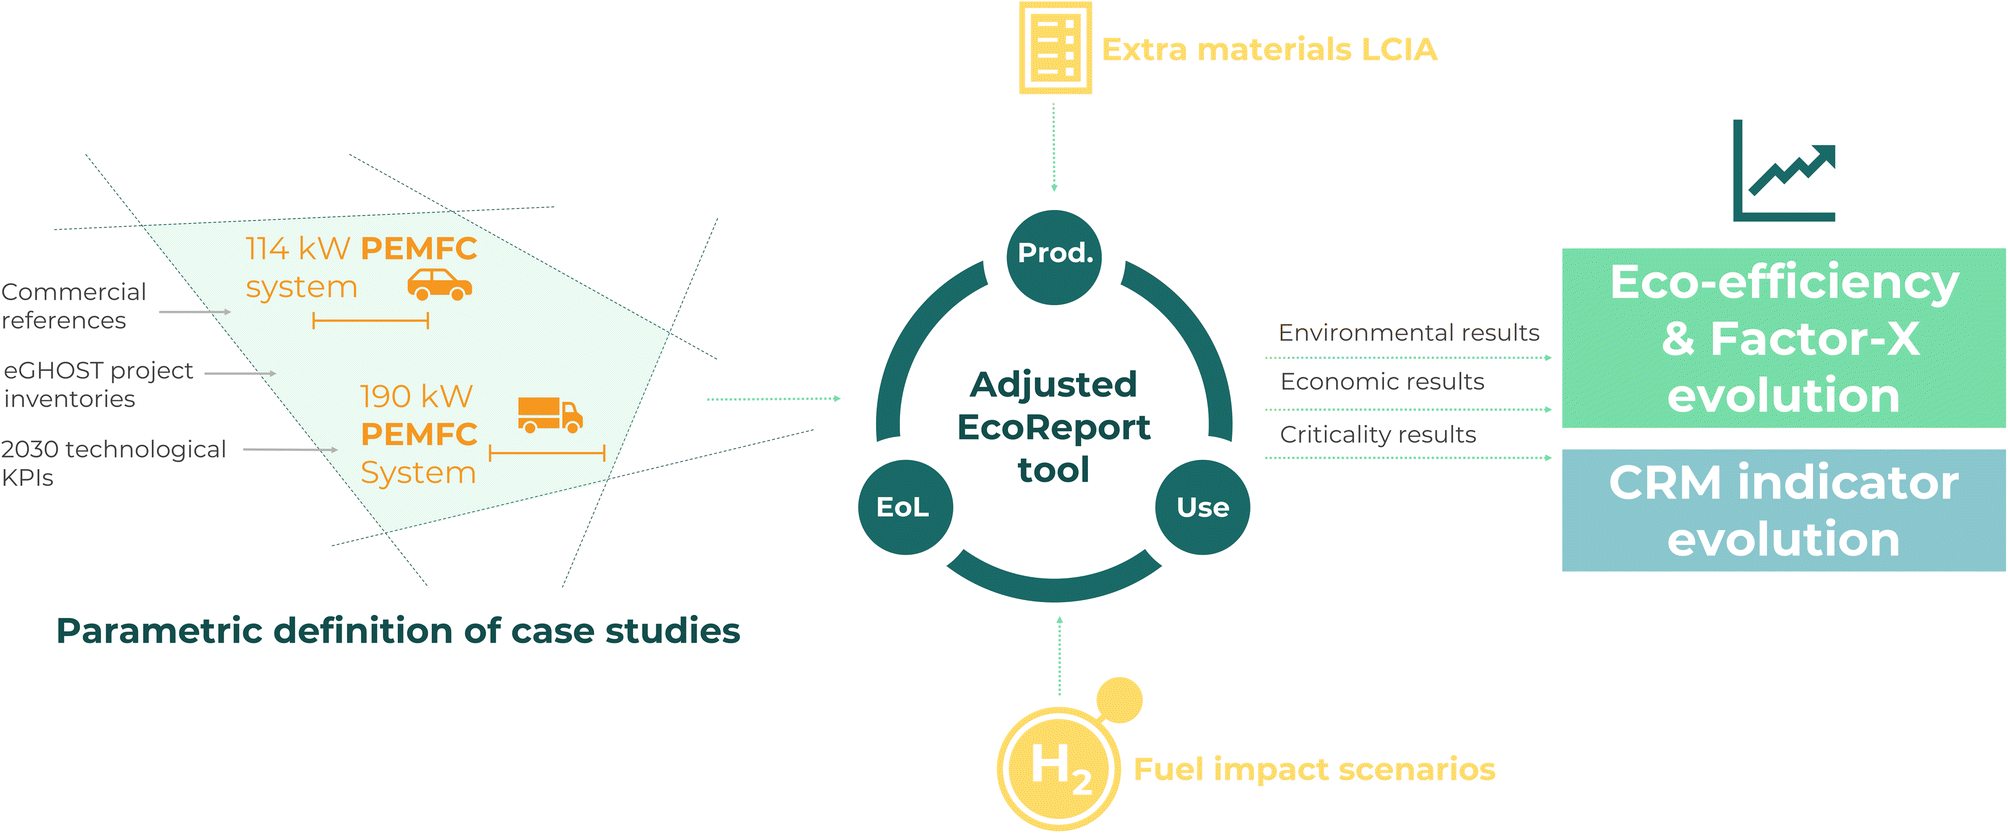 | ||
| Fig. 2 Methodological overview of the parametric EcoReport-based assessment (KPIs, LCIA, Prod., EoL and CRM stand for key performance indicators, life cycle impact assessment, production, end of life and critical raw materials, respectively). | ||
In order to contextualise the FCEV results with those for products with similar functionalities (i.e. mobility) and already underway in the ecodesign process, the aforementioned calculations were also performed using the outputs of the ecodesign preparatory study for batteries in ref. 19. The addressed battery electric vehicle (BEV) case studies correspond to the passenger car with large battery capacity and the full electric truck, both with extended lifetime and low-impact materials ecodesign measures implemented.35 Correction factors for the electricity mix employed for recharging (2010–2020 European average originally, transposed to the 2020–2030 period) and weight differences (the battery electric truck was considered to carry 2.33 t less than the fuel cell truck due to the weight difference between the two propulsion systems) were applied.
Results and discussion
EcoReport-based assessment results of the two base cases
The two EcoReport spreadsheets with the complete data and results for the fuel cell car and truck base case studies are provided as ESI I and II, respectively.† A summary of the life-cycle results generated by the EcoReport tool for the two base cases is reported in Table 4.| Environmental indicator | Materials production | Manufacturing | Distribution | Use | End-of-life | Total | |
|---|---|---|---|---|---|---|---|
| Carbon footprint [kg CO2-eq] | Car | 10236 |
93 | 47 | 6738.31 | −1571 | 15542 |
| Truck | 26658 |
149 | 47 | 157622.58 |
−3480 | 180996 |
|
| Economic indicator | CAPEX | OPEX | Total | |
|---|---|---|---|---|
| Life cycle cost [€] | Car | 9870.40 | 12758.96 |
22629.36 |
| Truck | 51023.30 |
258919.77 |
309943.07 |
|
| Criticality indicator | Critical raw material content [kg Sb-eq.] | Car | 0.41 |
| Truck | 4.58 |
Regarding the environmental dimension, materials production and the use phase (mainly hydrogen consumption) were found to account for the highest contribution to the carbon footprint indicator. Within the materials production phase (cf. “Raw” tab in ESI I & II†), the hydrogen tank made of carbon fibre arose as the main contributor among the four components of the product systems (stack, BoP, tank, and auxiliary battery) in the two base cases. Focusing on the stack, the platinum loading was identified as the main impact driver for the two baseline vehicles. Platinum loading was also found to be the most detrimental factor in terms of criticality despite its low mass share.
The economic dimension presents a similar behaviour to the environmental one. In the case of the fuel cell car, expenses are distributed between CAPEX and OPEX, with OPEX accounting for a higher contribution to the LCC indicator. Regarding the fuel cell truck, the operational expenditure (mainly related to hydrogen consumption) clearly dominates the economic indicator, which is motivated by the high mileage associated with this base case. For the two case studies, the CAPEX value was inserted in the tool aggregating the costs of the stack, BoP, tank and auxiliary battery. No contribution analysis was therefore enabled. In this regard, other studies addressing manufacturing cost analysis found that the fuel cell system (stack and BoP) would account for around half of the overall capital expenditure49 and, within this system, the platinum embodied in the stack cells would be responsible for approximately a quarter of the production cost.12
As detailed in the methodological section, only three out of the 11 materials implemented in the BoM section of the EcoReport tool were available by default. The modelling of the remaining ones required a separate life cycle assessment for the unitary production of each of them, with the additional effort of creating a non-standard assessment method to apply the characterisation factors stated by the MEErP. The hydrogen fuel also required an external evaluation as the tool does not provide any similar consumables. Finally, in order to be able to define different EoL scenarios for each of the modelled extra materials, the structure of the EcoReport spreadsheet required an adjustment since, by default, only one EoL scenario can be conceived for the whole set of extra materials. Hence, the actual practicality of the EcoReport tool as an ecodesign instrument useful for FCH technologies requires its upgrade to provide FCH-relevant inventories of materials and consumables as well as updated impact assessment methods.
Parametric EcoReport-based assessment results
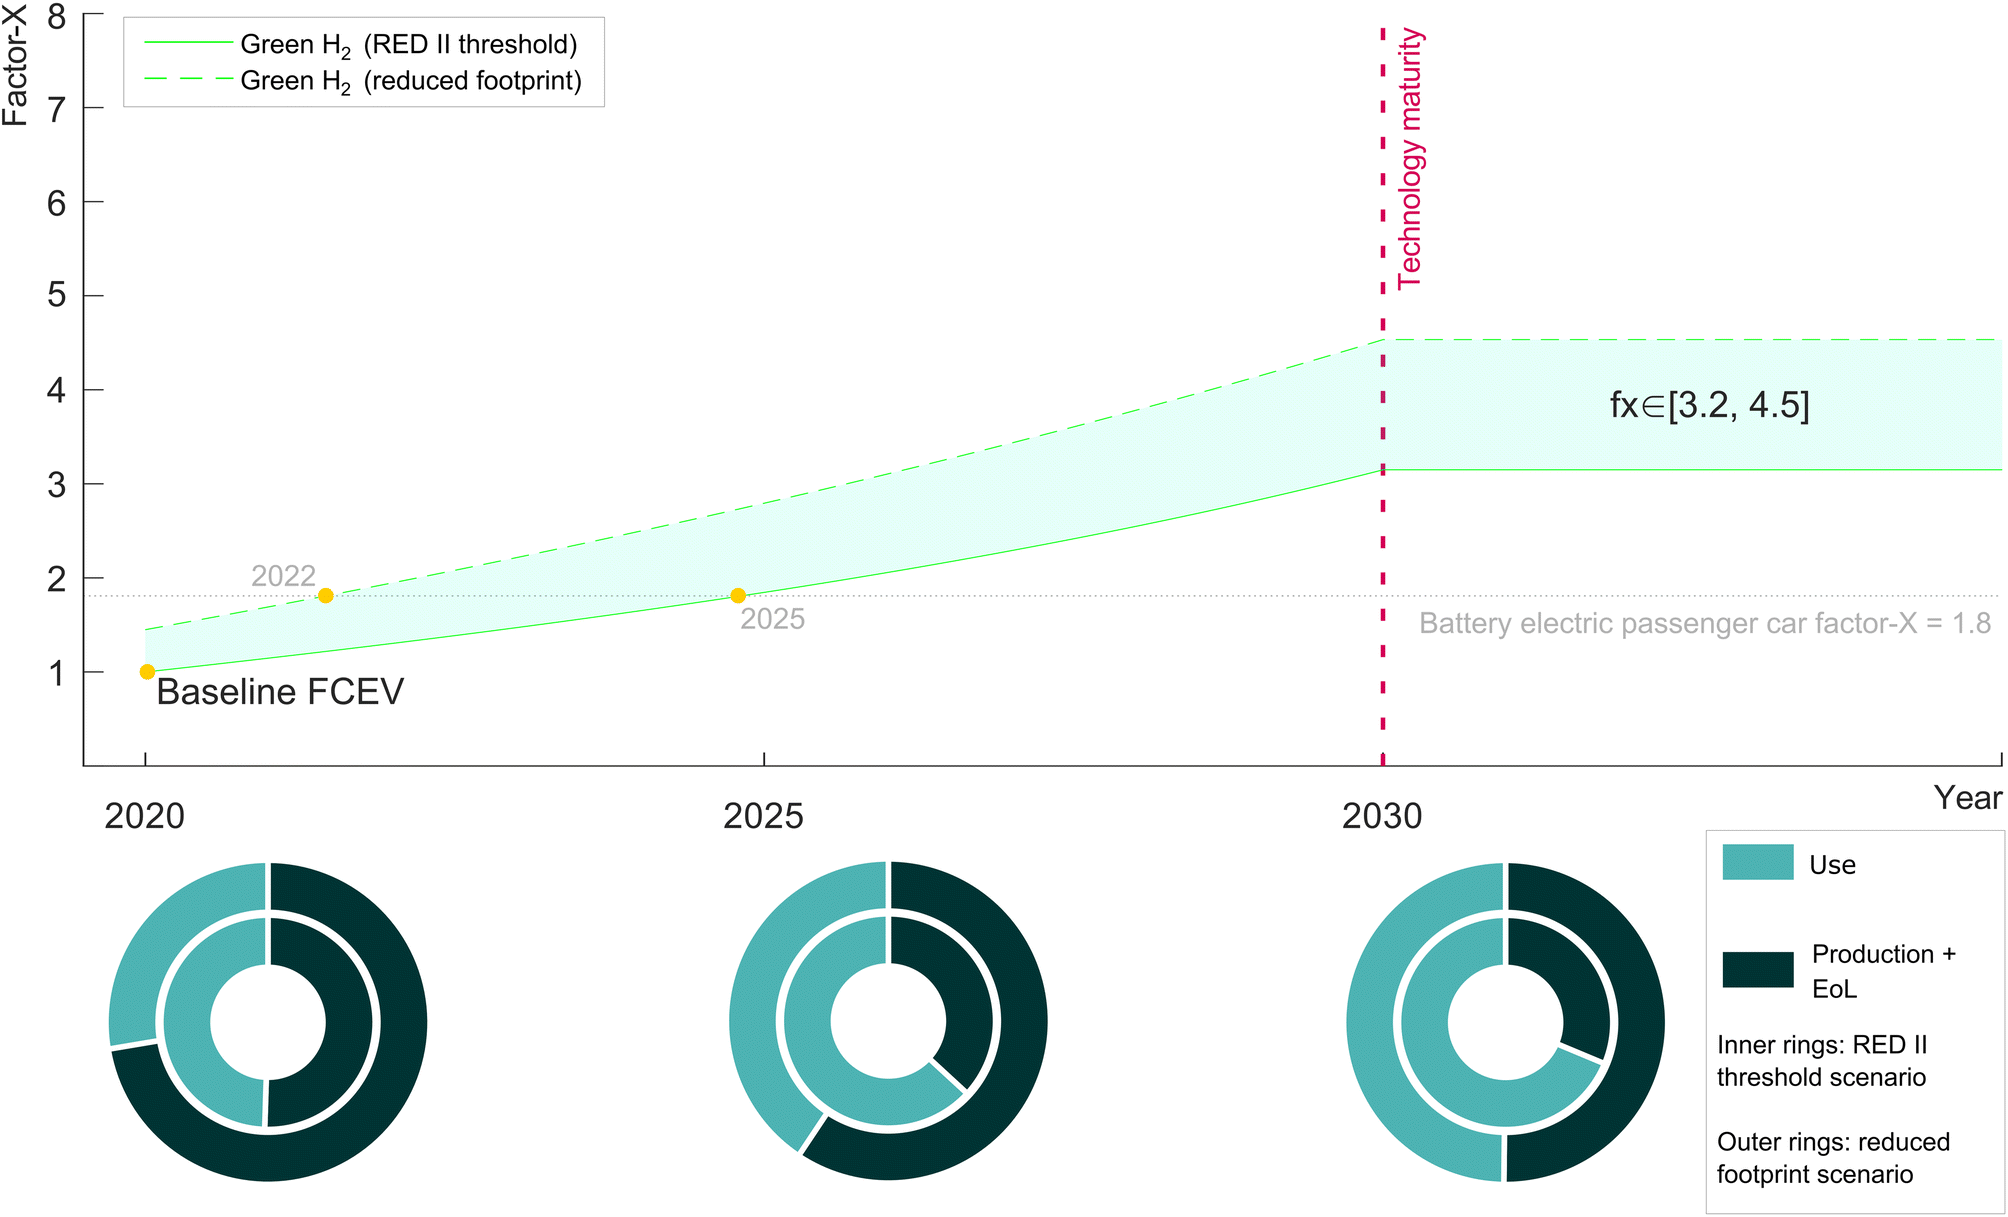 | ||
| Fig. 3 Fuel cell passenger car factor-X evolution and impact contribution by the life-cycle phase. | ||
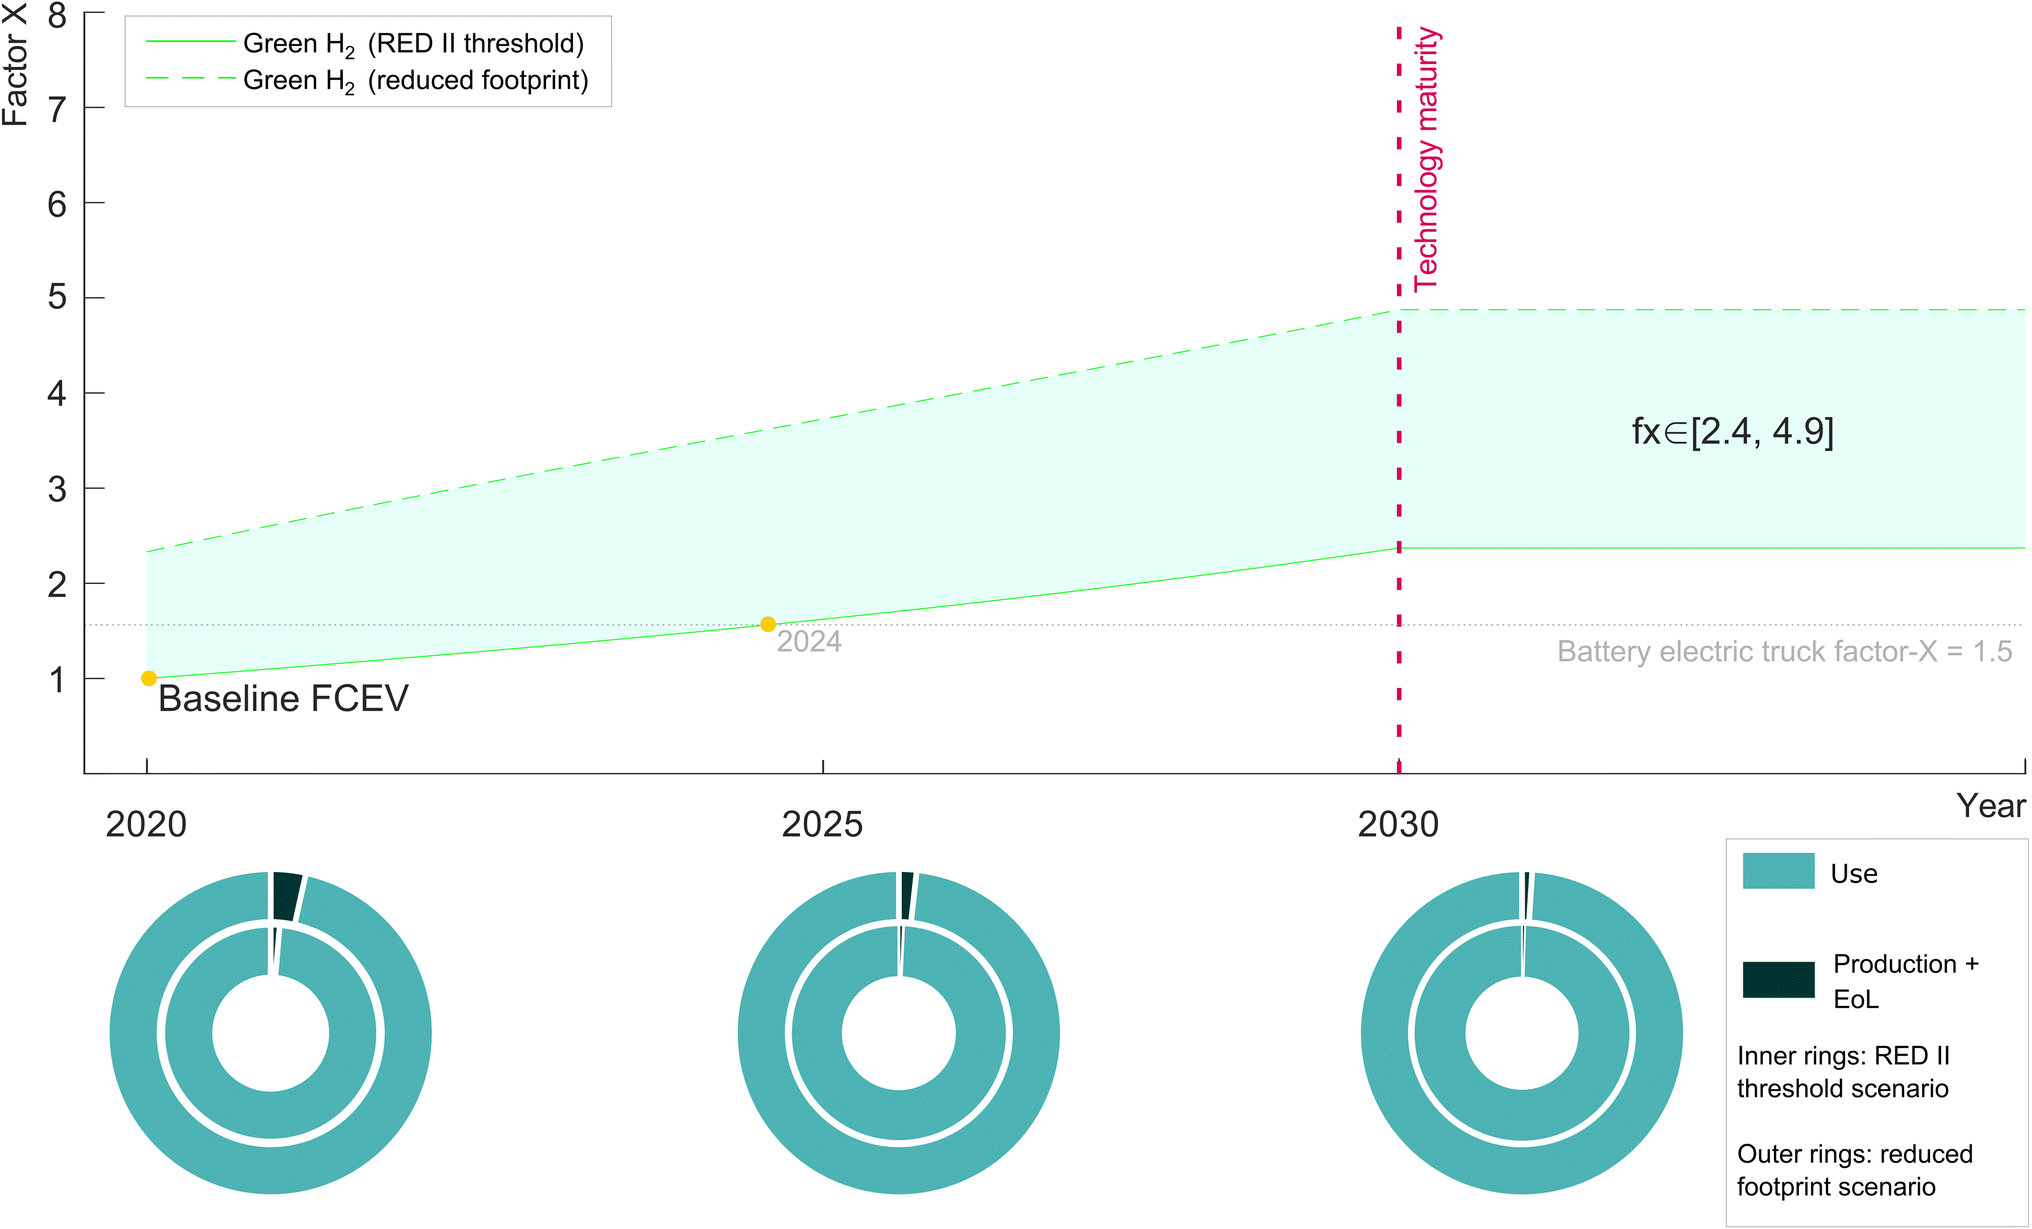 | ||
| Fig. 4 Fuel cell truck factor-X evolution and impact contribution by the life-cycle phase. | ||
In the case of the passenger car, the improvement in the assessed parameters according to the KPIs for 2030 could enhance the eco-efficiency performance by an fX of 3.2 (under the RED II threshold scenario) or 4.5 (under the reduced hydrogen carbon footprint scenario). For contextualisation purposes, the EE performance of the fuel cell passenger car would overtake that of the battery electric car (whose fX result is also referenced to the FCEV base case) early in the modelling period under the reduced hydrogen carbon footprint scenario, or in 2025 under the RED II threshold one. Regarding the impact contribution per life-cycle stage, the trend in the influence of the production phase (including EoL avoided impacts) is to gradually decrease due to the projected higher durability, and thus larger overall hydrogen consumption, of a vehicle throughout its life cycle. This fact would lead to an impact contribution of this stage between 33.1% (RED II threshold scenario) and 52.2% (reduced hydrogen carbon footprint scenario) in 2030.
In the case of the fuel cell truck, current (base-case) technologies could already overtake the fX score of the battery electric truck (whose result is also referenced to the FCEV base case) under the reduced hydrogen carbon footprint scenario. However, this would happen in 2024 under the RED II threshold scenario. In other words, the performance of the fuel cell vehicle was found to be highly dependent on the hydrogen carbon footprint, in agreement with previous studies.50 This is associated with the use phase of the truck accounting for the only significant impact contribution from the beginning of the modelling period (>95% in 2020 and near 100% in 2030 for both fuel scenarios), which is at the same time motivated by the much higher overall mileage attributable to the truck than to the passenger car.
Furthermore, Fig. 5 presents the results of the OAT sensitivity analysis to the key parameters considered in the assessment (durability, hydrogen consumption, CAPEX, and platinum loading). In order to enable a uniform comparison between parameters with growing and decreasing desirable trends, the parameters “hydrogen consumption”, “CAPEX” and “platinum loading” were evaluated according to their inverse. The variability of each parameter was considered without exceeding its KPI for 2030 (upper limit).
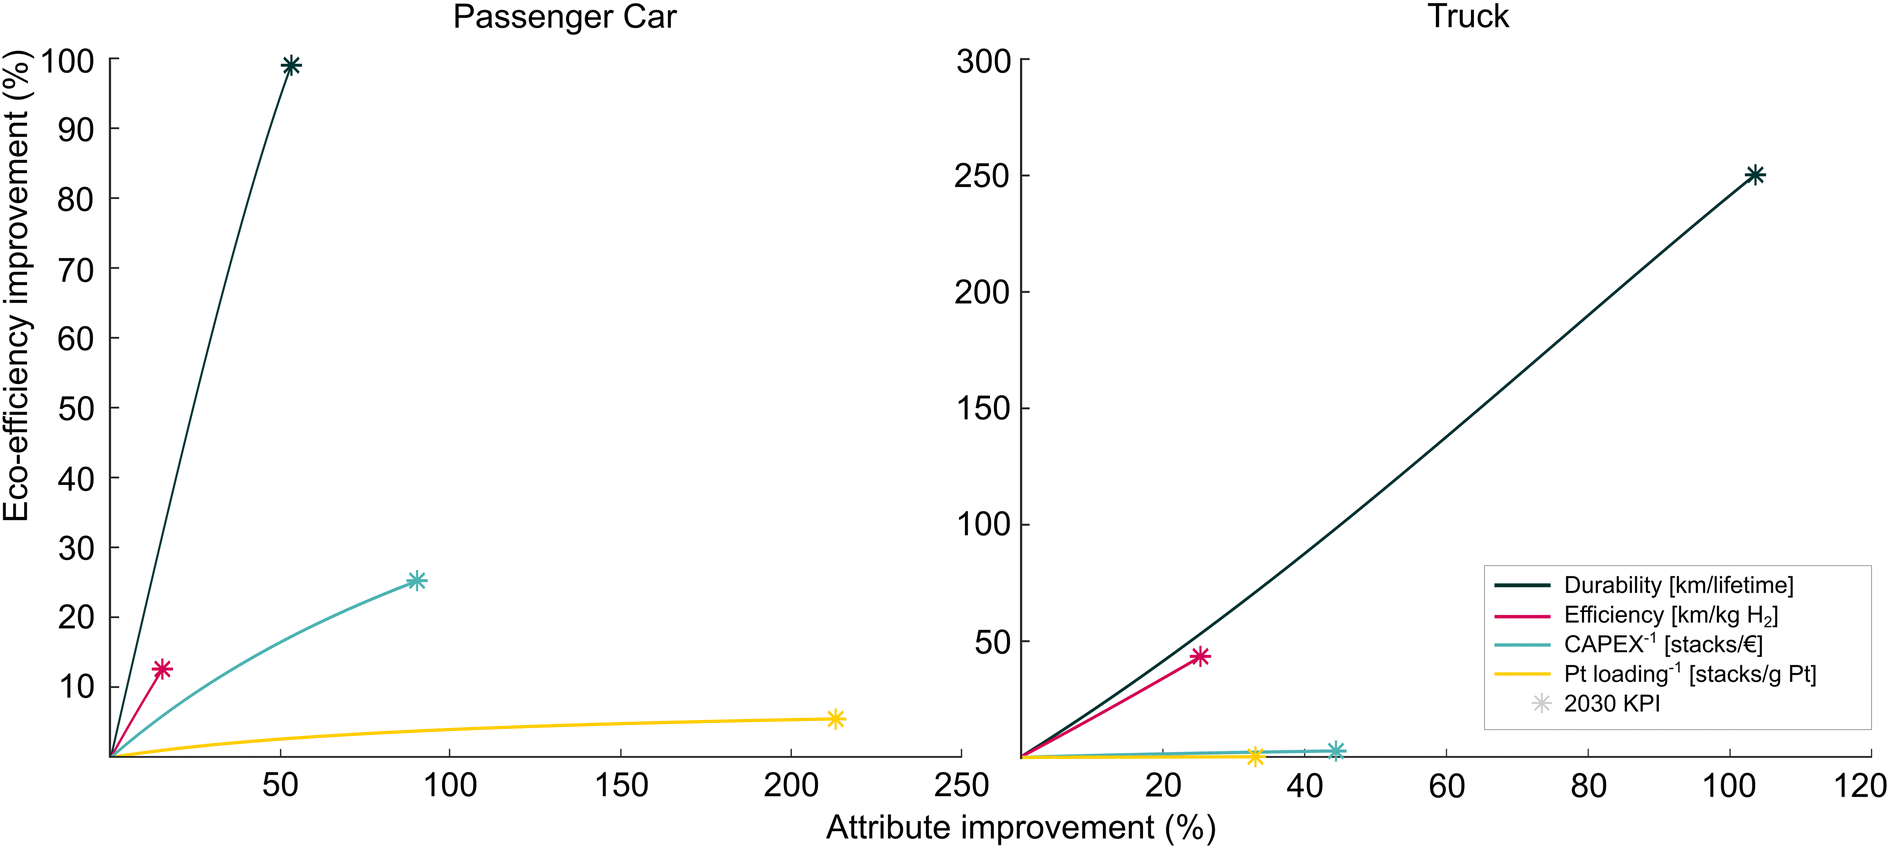 | ||
| Fig. 5 Eco-efficiency sensitivity analysis for the two case studies. | ||
For both the car and the truck, the overall behaviour of the sensitivity analysis curves shows some similarities. In both cases, the ranking of parameters, from most to least relevant was found as: durability, consumption inverse (i.e. efficiency), CAPEX inverse (i.e. product systems per invested €), and platinum loading inverse. This shows the much higher relevance of targeting attributes that affect the impacts of the use phase of the technologies (durability and hydrogen consumption). This finding is even more pronounced for the fuel cell truck since eco-efficiency gains due to CAPEX and platinum loading progressions are almost negligible (below 3% and 0.3%, respectively), in contrast to gains up to 25.7% and 5.4% in the case of the fuel cell car.
Criticality assessment results
Fig. 6 shows the CRM indicator results for the two case studies. The base-case fuel cell car presents a CRM result of 1.44–1.52 mg Sb-eq. per functional unit (p km). Reaching the KPIs for the year 2030 would lead to a CRM reduction of around 60% (0.57–0.67 mg Sb-eq. per functional unit). For contextualisation purposes, the battery electric car (with ecodesign measures already implemented) would involve a considerably higher CRM indicator: 8.91–12.97 mg Sb-eq. (p km)−1. The fuel cell stack was found to play the leading role in terms of criticality at the start of the modelling period, with its relative contribution decreasing from 72.1–66.6% in 2020 to 46.4–40.3% in 2030. This is due to the progressive reduction in the platinum loading of the stack and the need to replace the auxiliary battery.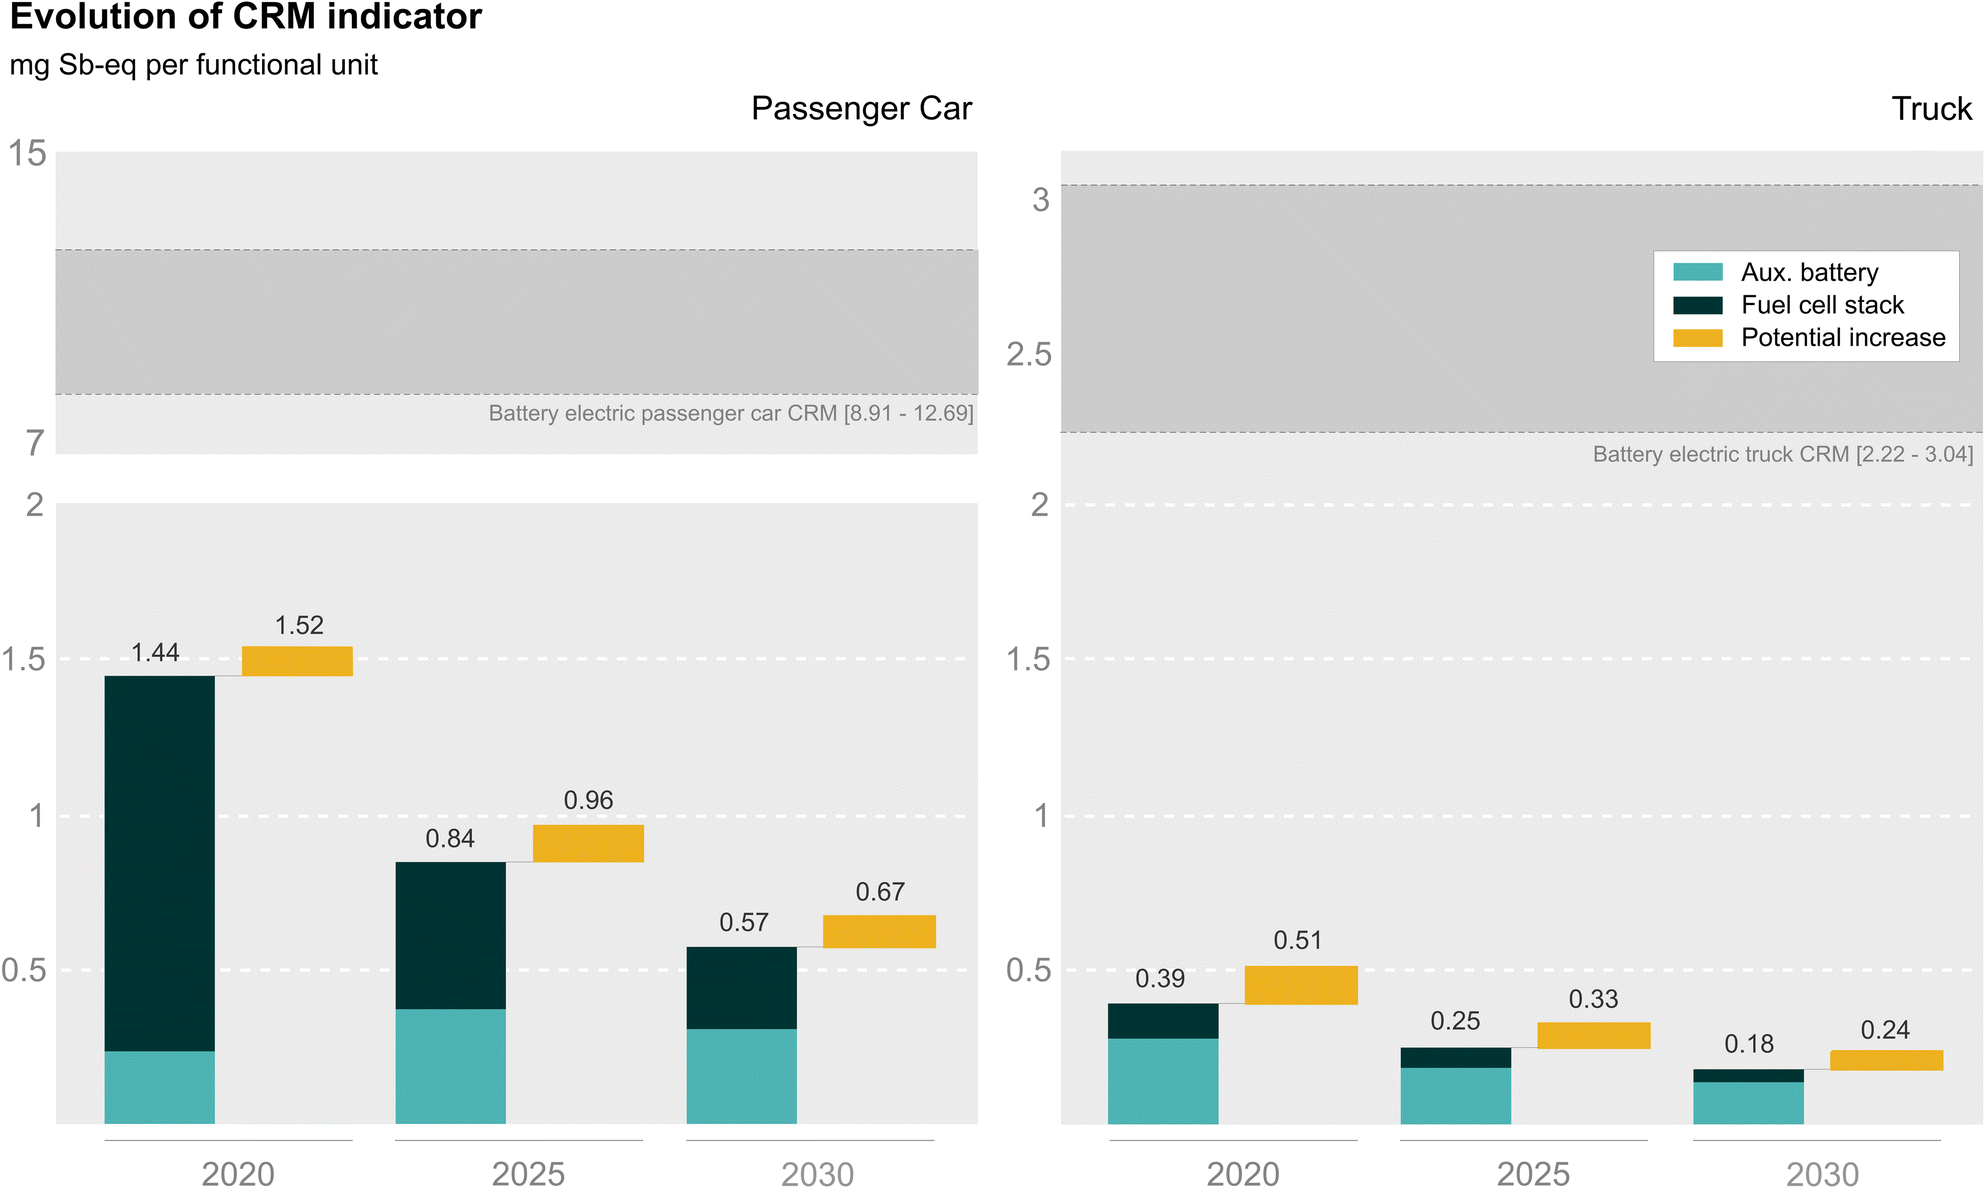 | ||
| Fig. 6 Critical Raw Material (CRM) indicator evolution for the two case studies, according to the 2020 CRM list and its potential extension. | ||
The CRM result for the base-case fuel cell truck is 0.39–0.51 mg Sb-eq. per functional unit (t km). A reduction of around 53% (0.18–0.24 mg Sb-eq. per functional unit) was found when reaching the KPIs for 2030. When contextualised with the battery electric truck, the latter would be associated with a higher CRM indicator: 2.22–3.04 mg Sb-eq. (t km)−1. When compared to the case study of the fuel cell car, the case of the fuel cell truck shows higher contributions of the auxiliary battery throughout the modelling period (70.9–77.5% contribution in 2020, and 76.4–82.1% in 2030). The reason behind this disparity in the contribution analysis was found to be the larger difference in the sizes of the auxiliary batteries of the two case studies (1.6 kW h in the car and 72.2 kW h in the truck) than in the sizes of the fuel cell stacks (114 kW in the car and 190 kW in the truck).
Finally, it should be noted that the consideration of not only critical materials but also potentially critical ones was found to increase noticeably the results of the criticality assessment, affecting mainly the battery electric devices of the systems. The increase estimated in the case of the fuel cell car ranges from 6% to 18%, while it is above 42% for the battery electric car. The variation is higher in the case of the fuel cell truck (+30% in 2020 and +33% in 2030) because its CRM result is more conditioned by the contribution of the auxiliary battery. The battery electric truck shows a CRM indicator increase of 37%, in line with the aforementioned trend.
Conclusions
For the first time, the life-cycle performance of two FCH products for mobility was assessed by using the EcoReport tool provided within the methodological framework of the European Ecodesign Directive. A parametric adjustment of the tool ultimately enabled the evaluation of up to which extent the expected progression of technology attributes potentially targeted by ecodesign measures could improve the eco-efficiency of the two FCH products under analysis (a fuel cell passenger car and a fuel cell truck).The EcoReport tool was concluded to have the potential of being an appropriate instrument for the identification of the key aspects of FCH technologies on which ecodesign measures could focus. However, it should be upgraded to provide FCH-relevant inventories of materials and consumables as well as updated impact assessment methods. In particular, it is necessary to implement key FCH-related materials not yet included in the default database of the EcoReport tool (e.g. platinum, carbon fibre, and ionomers). Moreover, the characterisation factors employed in the tool calculation method, including those for the criticality assessment approach, need to be revised and updated. While the latter is expected in the course of planned MEErP revisions, the development of an FCH-specific database is deemed a critically underdeveloped topic. This upgrade is imperative to respect the original purpose of the EcoReport tool, conceived to carry out a practical assessment of energy-related products without deep knowledge of life cycle assessment. It is concluded that such a tool upgrade would make the European Ecodesign Directive an effective and powerful enabler of sustainable-by-design FCH products for mobility.
The results from the parametric EcoReport-based assessment show that achieving the selected KPIs for the year 2030 could improve the eco-efficiency performance of the fuel cell passenger car by 3.1–4.5, and by 2.4–4.9 in the case of the fuel cell truck. The width of these intervals corresponds to the relevance associated with the carbon footprint of the hydrogen used throughout the operational lifetime of the vehicles, set at 3.384 kg CO2-eq. kg−1 H2 in a conservative scenario (RED II threshold) and at 1.692 kg CO2-eq. kg−1 H2 in a more optimistic one. These improvements would position PEMFC systems as competitive alternatives in mobility applications when contextualised with other coexisting options currently underway in the European ecodesign process, such as battery electric vehicles. Beyond the goal and scope of this work and the underlying European Ecodesign Directive, further benchmarking studies could appropriately complement the reported findings on the suitability of alternative mobility options.
The eco-efficiency results of the FCH products show a high dependence on parameters closely linked to the use phase impacts of the vehicles. This finding highlights the need to support hydrogen deployment from a holistic perspective that ensures the parallel development of both hydrogen-production and hydrogen-use technologies, in line with the ambition of the European eGHOST project under which this work was conducted. As regards material criticality, the platinum loading in the fuel cell stack arises as the main hotspot in the PEMFC systems, while auxiliary batteries also show a relevant contribution.
Overall, the results of this study show a promising performance of FCH mobility solutions under the principles of the European Ecodesign Directive. However, some practicality issues were found when applying the EcoReport tool to FCH products. Coming back to the title of this article, the European Ecodesign Directive could guide the deployment of hydrogen-related products for mobility by (i) upgrading the EcoReport tool in terms of FCH-relevant materials inventories and assessment methods to ease the performance of ecodesign preparatory studies, and (ii) setting ecodesign requirements aligned with KPI targets for FCH technologies, especially those driving the use phase impacts. Future work in this direction is encouraged.
Author contributions
Felipe Campos-Carriedo: conceptualisation, methodology, software, formal analysis, investigation, writing – original draft preparation, and visualisation. Eleonora Bargiacchi: conceptualisation, methodology, software, investigation, writing – review and editing, supervision, and project administration. Javier Dufour: writing – review and editing, supervision, project administration, and funding acquisition. Diego Iribarren: conceptualisation, methodology, writing – review and editing, supervision, project administration, and funding acquisition.Conflicts of interest
No conflicts of interest to declare.Abbreviations
| BEV | Battery electric vehicle |
| BoM | Bill of materials |
| BoP | Balance of plant |
| CAPEX | Capital expenditure |
| CRM | Critical raw material |
| EE | Eco-efficiency |
| EoL | End of life |
| EU | European Union |
| FCEV | Fuel cell electric vehicle |
| FCH | Fuel cells and hydrogen |
| fX | Factor-X |
| GWP | Global warming impact potential |
| KPI | Key performance indicator |
| LCC | Life cycle cost |
| MEErP | Methodology for Ecodesign of Energy-Related Products |
| MEEuP | Methodology for Ecodesign of Energy-using Products |
| OPEX | Operational expenditure |
| OAT | One-at-a-time |
| PEMFC | Proton exchange membrane fuel cell |
| PFSA | Perfluorosulfonic acid |
| RED II | European Renewable Energy Directive |
Acknowledgements
This work has been carried out within the framework of the project eGHOST. This project has received funding from the Fuel Cells and Hydrogen 2 Joint Undertaking (now Clean Hydrogen Partnership) under Grant Agreement No. 101007166. This Joint Undertaking receives support from the European Union’s Horizon 2020 Research and Innovation programme, Hydrogen Europe and Hydrogen Europe Research. The contents of this document are provided “AS IS”. It reflects only the authors' view and the Joint Undertaking is not responsible for any use that may be made of the information it contains.References
- European Commission, 2030 climate & energy framework, https://ec.europa.eu/clima/eu-action/climate-strategies-targets/2030-climate-energy-framework_en, accessed 1 March 2022.
- European Commission, Communication from the Commission to the European Parliament, the Council, the European Economic and Social Committee and the Committee of the Regions ‘Fit for 55’: delivering the EU's 2030 Climate Target on the way to climate neutrality COM/2021/550 final, p. 2021 Search PubMed.
- Eurostat, Energy imports dependency, https://ec.europa.eu/eurostat/databrowser/view/NRG_IND_ID__custom_938402/bookmark/table?lang=en,en%26bookmarkId=f1ab4519-82df-4a89-a329-1b8d0a5925f7, accessed 1 March 2022.
- T. Bros and J.-A. Vinois, High energy prices - Russia fight back?https://institutdelors.eu/wp-content/uploads/2021/11/PP272_High-energy-prices_Vinois-Bros.pdf, 2021.
- Fuel Cells and Hydrogen Joint Undertaking, Hydrogen Roadmap Europe, 2019.
- Clean Hydrogen Joint Undertaking, Strategic Research and Innovation Agenda 2021–2027, 2022 Search PubMed.
- Statistical Office of the European Union, Energy, transport and environment statistics: 2020 edition, 2020, https://ec.europa.eu/eurostat/documents/3217494/11478276/KS-DK-20-001-EN-N.pdf/06ddaf8d-1745-76b5-838e-013524781340?t=1605526083000 Search PubMed.
- European Environment Agency, National emissions reported to the UNFCCC and to the EU Greenhouse Gas Monitoring Mechanism, https://www.eea.europa.eu/data-and-maps/data/national-emissions-reported-to-the-unfccc-and-to-the-eu-greenhouse-gas-monitoring-mechanism-17, accessed 2 March 2022.
- European Environment Agency, Energy statistics - Energy balances, https://www.eea.europa.eu/data-and-maps/data/external/energy-statistics-supply-transformation-and-consumption, accessed 2 March 2022 Search PubMed.
- P. Sharma and O. P. Pandey, PEM Fuel Cells, 2022, 1–24 Search PubMed.
- P. Plötz, Nat. Electron., 2022, 5(1), 8–10 CrossRef.
- E. Bargiacchi, F. Carriedo-Campos, G. Puig-Samper, D. Iribarren, J. Dufour, J. Cren, E. Cor, E. Monnier, R. Stropnik, A. Lotrič, M. Sekavčnik and M. Mori, Deliverable 2.3 eGHOST Project: Definition and evaluation of base case studies, 2021 Search PubMed.
- S. Bobba, S. Carrara, J. Huisman, F. Mathieux and C. Pavel, Critical Raw Materials for Strategic Technologies and Sectors in the EU - a Foresight Study, 2020.
- UNEP, Cleaner production: a guide to information sources, 2001.
- M. Dumortier and S. Haussener, Energy Environ. Sci., 2015, 8, 3069–3082 RSC.
- G. M. M. Ansaloni, A. Bionda and M. Rossi, in 2022 7th International Conference on Smart and Sustainable Technologies (SpliTech), IEEE, 2022, pp. 1–6 Search PubMed.
- e-SHyIPS|On the wave of hydrogen, https://e-shyips.com/, accessed 18 January 2023.
- European Parliament and Council, Directive 2009/125/EC of the European Parliament and of the Council of 21 October 2009 establishing a framework for the setting of ecodesign requirements for energy-related products, https://eur-lex.europa.eu/legal-content/EN/TXT/?uri=CELEX:32009L0125, accessed 24 February 2022 Search PubMed.
- V. Maagøe, Ecodesign preparatory Study for Batteries, VITO, Fraunhofer Institute, https://ecodesignbatteries.eu/welcome.html, accessed 28 February 2022 Search PubMed.
- A. M. Bundgaard, M. A. Mosgaard and A. Remmen, J. Cleaner Prod., 2017, 144, 358–374 CrossRef.
- European Commission, A hydrogen strategy for a climate-neutral Europe, 2020, https://ec.europa.eu/commission/presscorner/api/files/attachment/865942/EU_Hydrogen_Strategy.pdf.pdf Search PubMed.
- R. Kemna, MEErP 2011- Methodology report. Part 1: Methods, 2011.
- R. Kemna, MEErP 2011 - Methodology Report. Part 2: Environmental policies & data, 2011.
- DocsRoom: EcoReport - European Commission, https://ec.europa.eu/docsroom/documents/11845/attachments/1/translations, accessed 28 February 2022.
- A. M. Bundgaard, M. A. Mosgaard and A. Remmen, J. Cleaner Prod., 2017, 144, 358–374 CrossRef.
- M. Wesnæs, P. S. Hansen and A. Gydesen, Initial analysis of EcoReport Tool - Suggestions for improvement of EcoReport tool, based on practical experience, as well as analysis of the advantages and disadvantages of implementing elements from the Product Environmental Footprint (PEF) method, 2019, https://findresearcher.sdu.dk/ws/portalfiles/portal/179262984/Wesnaes_Skov_Hansen_and_Gydesen_2019_Initial_Analysis_of_EcoReport_Tool.pdf Search PubMed.
- eGHOST Project, https://eghost.eu/.
- M. Kane, Toyota Mirai Fuel Cell Sedan specs, 2019, https://insideevs.com/news/323973/toyota-mirai-fuel-cell-sedan-priced-at-57500-specs-videos/ Search PubMed.
- World's first fuel cell HD Truck, https://fuelcellsworks.com/news/worlds-first-fuel-cell-heavy-duty-truck-hyundai-xcient-fuel-cell-heads-to-europe-for-commercial-use/.
- J. J. Gangloff, J. Kast, G. Morrison and J. Marcinkoski, J. Electrochem. Energy Convers. Storage, 2017, 14, 8 Search PubMed.
- S. Evangelisti, C. Tagliaferri, D. J. L. Brett and P. Lettieri, J. Cleaner Prod., 2017, 142, 4339–4355 CrossRef CAS.
- European Commission, Study on the EU's list of Critical Raw Materials - Final Report,2020, 2020, https://op.europa.eu/en/publication-detail/-/publication/c0d5292a-ee54-11ea-991b-01aa75ed71a1/language-en Search PubMed.
- G. Wernet, C. Bauer, B. Steubing, J. Reinhard, E. Moreno-Ruiz and B. Weidema, Introduction to LCA with SimaPro, PRé Sustainability B.V., Amersfoort, 2016 Search PubMed.
- G. Wernet, C. Bauer, B. Steubing, J. Reinhard, E. Moreno-Ruiz and B. Weidema, Int. J. Life Cycle Assess., 2016, 21(9), 1218–1230 CrossRef.
- T. Hettesheimer, A. Thielmann, C. Neef and A. Durand, Preparatory Study on Ecodesign and Energy Labelling of Batteries under FWC ENER/C3/2015-619-Lot 1 Task 6 Report, 2019, https://ecodesignbatteries.eu/sites/ecodesignbatteries.eu/files/attachments/2019_08_27_ED_Battery_Task6.pdf Search PubMed.
- European Commission, Proposal for a DIRECTIVE OF THE EUROPEAN PARLIAMENT AND OF THECOUNCIL amending Directive (EU) 2018/2001 of the European Parliament and of the Council, Regulation (EU) 2018/1999 of the European Parliament and of the Council and Directive 98/70/EC of the European Parliament and of the Council as regards the promotion of energy from renewable sources, and repealing Council Directive (EU) 2015/652, 2021 Search PubMed.
- D. Pont, Fuel cells safe Handling and use of perfluorosulfonic acid products, 2009.
- L. Duclos, L. Svecova, V. Laforest, G. Mandil and P. X. Thivel, Hydrometallurgy, 2016, 160, 79–89 CrossRef CAS.
- K. Bareiß, C. de la Rua, M. Möckl and T. Hamacher, Appl. Energy, 2019, 237, 862–872 CrossRef.
- R. Sacchi, T. Terlouw, K. Siala, A. Dirnaichner, C. Bauer, B. Cox, C. Mutel, V. Daioglou and G. Luderer, Renewable Sustainable Energy Rev., 2022, 160, 112311 CrossRef.
- G. Wernet, C. Bauer, B. Steubing, J. Reinhard, E. Moreno-Ruiz and B. Weidema, The ecoinvent database version 3 (part I): overview and methodology, 2016 Search PubMed.
- W. Krewitt, Energy Policy, 2002, 30, 839–848 CrossRef.
- A. Valente, D. Iribarren and J. Dufour, J. Cleaner Prod., 2017, 149, 762–772 CrossRef CAS.
- A. Valente, D. Iribarren and J. Dufour, From hydrogen producers to retailers in Japan: a combinatorial carbon footprint assessment, 2019.
- S. Schmidheiny, Changing Course - A Global Business Perspective on Development and the Environment, MIT Press, 1992 Search PubMed.
- P. Saling, A. Kicherer, B. Dittrich-Krämer, R. Wittlinger, W. Zombik, I. Schmidt, W. Schrott and S. Schmidt, Int. J. Life Cycle Assess., 2002, 7(4), 203–218 CrossRef.
- ISO, ISO 14045:2012 - Environmental management - Eco-efficiency assessment of product systems - Principles, requirements and guidelines, 2012.
- A. Valente, D. Iribarren, J. L. Gálvez-Martos and J. Dufour, Sci. Total Environ., 2019, 650, 1465–1475 CrossRef CAS PubMed.
- Y. Yang, PEM Fuel Cell System Manufacturing Cost Analysis for Automotive Applications, 2015, https://www.austinpowereng.com/Fuel%20cell/AustinPowerCostAnalysisFCS2015.pdf.
- A. Valente, D. Iribarren, D. Candelaresi, G. Spazzafumo and J. Dufour, Int. J. Hydrogen Energy, 2020, 45, 25758–25765 CrossRef CAS.
Footnote |
| † Electronic supplementary information (ESI) available. See DOI: https://doi.org/10.1039/d2se01486f |
| This journal is © The Royal Society of Chemistry 2023 |