 Open Access Article
Functionalized metal–organic frameworks based on multi-catalyst ordered assembly for electrochemical stripping chemiluminescent immunoassay†
Xu
Liang
,
Yuecong
Hu
,
Xinhe
Zheng
,
Yi
Shao
,
Yutong
Hua
,
Junjie
Liu
,
Zhiwei
Zhu
 and
Yuanhua
Shao
 *
*
Beijing National Laboratory for Molecular Sciences, College of Chemistry and Molecular Engineering, Peking University, Beijing 100871, China. E-mail: yhshao@pku.edu.cn
First published on 17th August 2023
Abstract
The catalytic efficiency of catalysts may be greatly improved by their ordered assembly. To verify this assumption, metal–organic frameworks (MOFs) were selected as the model. In this work, three catalysts of the luminol–hydrogen peroxide (H2O2) system were employed for the construction of gold nanoparticle functionalized Cu–hemin MOFs (Au@MOFs), which were later used as labels for the electrochemical stripping chemiluminescent (ESCL) detection of cardiac troponin I (cTnI). Au@MOFs, with a three-dimensional flower spherical structure, good conductivity, open active centers and catalytic sites, could greatly accelerate the decomposition of H2O2, enhancing the electrochemiluminescent (ECL) signal of the luminol–H2O2 system significantly. Further combined with the electrochemical stripping of copper ions, the ESCL process with three-component synergistic amplification could be realized. Based on the excellent catalytic performance of Au@MOFs, a “sandwich-type” ESCL immunosensor was developed for the determination of cTnI. The constructed ESCL sensor exhibited good stability and repeatability with a low limit of detection down to 0.78 fg mL−1, and had been successfully used for the detection of human serum samples with satisfactory results.
1. Introduction
Metal–organic frameworks (MOFs), an emerging class of microporous crystalline materials assembled from metal nodes and organic bridging ligands,1 usually possess several outstanding properties, such as a large specific surface area, adjustable size and structure, high porosity, and easy functionalization,2–5 showing great potential in gas adsorption and separation,6 heterogeneous catalysis,7 chemical sensors,8 energy storage,9 and drug transportation.10 In recent years, the study of functionalized MOF composites has attracted much attention.11–13 By loading guest molecules or functional groups into MOFs, MOF composites could acquire some new properties while maintaining their intrinsic structural characteristics, thereby broadening the potential applications of MOFs. For example, the one-step fabrication of tris(bipyridine)ruthenium(II)-functionalized MOFs using the electrochemical assisted self-assembly technique was proposed by Qin and co-workers for the sensitive determination of heart-type fatty acid binding protein.14 Zhang et al. developed an ultrasensitive electrochemiluminescent (ECL) sensor to detect the activity of protein kinase using zirconium-based MOFs as labels.15 Therefore, the selection of appropriate functional or structural units, including metal centers, organic ligands and guest molecules, is of great significance for the synthesis of functionalized MOF composites.Luminol and its derivatives are widely used in ECL immunoassays due to their low excitation potential.16–18 Hydrogen peroxide (H2O2) is usually used as the co-reactant for luminol to further reduce its excitation potential and increase its ECL intensity. However, under neutral conditions, the reaction rate of the luminol–H2O2 system is slow, and only a quite low ECL signal can be generated, which is unfavorable to the requirement of common highly sensitive ECL analysis and detection. To date, several reports have confirmed that the ECL signal of the luminol–H2O2 system can be effectively amplified by catalysts, such as metal ions,19 porphyrins and their derivatives,20,21 metal nanoparticles and clusters,22,23 quantum dots,24 carbon nanomaterials,20,22,25,26etc. Therefore, how to make full use of the existing catalytic system and construct a more efficient catalytic mechanism is of great significance to improve the ECL efficiency of the luminol–H2O2 system. One possible solution is to select suitable catalysts as structural units for the construction of functionalized MOF composites, further amplifying the ECL signal through the synergistic effect.
Hemin is an iron porphyrin derivative with two carboxyl functional groups, and also an efficient catalyst for the luminol–H2O2 system,21,27,28 which makes it a suitable candidate to construct functionalized MOFs as an organic bridging ligand. In fact, Hemin ligands have already been reported for the synthesis of MOFs. For instance, Cu–hemin-MOFs/BN composites were applied to activate persulfate for the degradation of bisphenol A by Ke and co-workers.29 Choi et al. developed an electrochemical biosensor containing the Co–hemin MOF/chitosan composite and cellobiose dehydrogenase for lactose detection.30 Chen and co-workers combined a colorimetric and fluorescence strategy for glutathione determination using o-phenylenediamine as the substrate and Cu–hemin MOFs as the catalyst.31 Mi et al. proposed a double amplification strategy based on G-quadruplex DNAzyme functionalized Zn–Hemin MOFs, resulting in a 100-fold enhancement of the chemiluminescent intensity of the luminol–H2O2 system.32 However, to date, the similar strategy of applying metal–hemin MOFs and their functionalized MOFs to ECL has not been reported yet.
Electrochemical stripping chemiluminescence (ESCL), first reported by Zhang and co-workers,33,34 refers to a detection technique that combines both stripping voltammetry (SV) and chemiluminescence. Compared with single SV or the ECL detection method, ESCL shows extremely high sensitivity, exhibiting great potential in the detection of ultra-trace proteins. For example, Dong et al. first established an ESCL biosensor along with a copper-stained reaction to generate copper particles in situ, the later stripped copper ions (Cu2+) further amplified the ECL signal of the luminol–H2O2 system and lowered the detection limit of the sensor by more than 20 times.35 Shi et al. employed DNA duplex as the template for the electrodeposition of copper nanoclusters in situ, which were then used as labels to construct an ESCL aptamer sensor for the sensitive detection of carcinoembryonic antigen with a low limit of detection down to 67 ag mL−1.36 Nevertheless, there have been still few reports of ESCL methods,35–37 so it is necessary to explore and develop new systems to further broaden the scope of ESCL applications.
In this work, efficient catalysts of the luminol–H2O2 system, including Cu2+, Hemin, and gold nanoparticles (AuNPs), were selected as metal centers, organic ligands, and guest molecules, respectively, for the construction of AuNP functionalized Cu–hemin MOFs (Au@MOFs). The amplification mechanism of the ECL signal of the luminol–H2O2 system was explored using Au@MOFs as the catalytic amplification interface. It was found that Cu2+ could gradually strip from the electrode surface under the applied potential, and synergistically accelerate the ECL reaction with Hemin and AuNPs in the Au@MOFs, resulting in a triple amplified ESCL process. On this basis, an ESCL immunosensor was constructed with Au@MOFs as labels for the sensitive detection of cardiac troponin I (cTnI), which has been considered as the “gold standard” for the diagnosis of acute myocardial infarction (AMI). The developed ESCL sensor has a wide linear range and low detection limit, and has been successfully applied to the detection of clinical samples.
2. Experimental
2.1 Apparatus
Scanning electron microscopy (SEM) images and energy dispersive X-ray spectra (EDAX) were taken from an S-4800 field emission scanning electron microscope equipped with an APOLLO XP X-ray energy dispersive spectrometer (Hitachi, Japan). Ultraviolet-visible (UV-vis) absorption spectra were obtained from a U-4100 spectrophotometer (Hitachi, Japan). X-ray diffraction (XRD) spectra were taken from an X-Pert3 Powder X-ray diffractometer (PANalytical, Netherlands). Fourier transform infrared (FT-IR) spectra were obtained using a Nicolet iS50 spectrometer (Thermo Fisher Scientific Inc., USA). X-ray photoelectron spectra (XPS) were obtained by an Axis Supra spectrometer (Kratos Analytical Ltd., Japan), with the binding energy calibrated with the C1s peak at 284.8 eV. All the electrochemical experiments, including cyclic voltammetry (CV) and electrochemical impedance spectroscopy (EIS), were conducted at a CHI 660e electrochemical workstation (Shanghai Chenhua Instruments, Co., China). ECL signals were recorded by an MPI-EII ECL analyzer (Xi'an Remax Electronic Science & Technology Co., Ltd. China). A conventional three-electrode system was applied, with a glassy carbon electrode (GCE) of diameter of 3 mm as the working electrode, platinum wire as the counter electrode, Ag/AgCl (3 M KCl) as the reference electrode, respectively.2.2 Chemicals and reagents
Copper chloride dihydrate (CuCl2·2H2O, ≥99%), zinc nitrate hexahydrate (Zn(NO3)2·6H2O, ≥99%), trisodium citrate dihydrate (Na3Cit·2H2O, ≥99%), and sulfuric acid (H2SO4, 95–98%) were purchased from Xilong Scientific Co., Ltd. (Guangdong, China). Heme chloride (Hemin, 98%) was bought from Macklin Biochemical Co., Ltd. (Shanghai, China). Potassium dihydrogen phosphate (KH2PO4, ≥99.5%), sodium phosphate dibasic dodecahydrate (Na2HPO4·12H2O, ≥99%), sodium hydroxide (NaOH, ≥96%), and hydrogen peroxide (H2O2, ≥30%) were obtained from Tongguang Fine Chemical Company (Beijing, China). Chloroauric acid (HAuCl4, ≥99.95%), luminol (≥97%), and bovine serum albumin (BSA, ≥98%) were purchased from Sigma-Aldrich (USA). Potassium ferricyanide (K3[Fe(CN)6], ≥99.5%) and potassium hexacyanoferrate trihydrate (K4[Fe(CN)6]·3H2O, ≥99.5%) were bought from Sinopharm Chemical Reagent Co., Ltd (Shanghai, China). Phosphate buffer solution PBS1 (0.1 M, pH = 7.4) was prepared for electrochemical measurements, and PBS2 (0.01 M, pH = 7.4) as washing and dispersing buffer for immunoassay. cTnI was purchased from HyTest Biotechnology Co., Ltd. (Shanghai, China). Monoclonal antibody against cTnI (anti-cTnI) and clinical serum samples were provided by the First Affiliated Hospital of Nanjing Medical University. All the chemical reagents were of analytical grade or better. Ultrapure water (Millipore, ≥18 MΩ cm) was used for the preparation of all aqueous solutions.2.3 Preparation of Cu–hemin MOFs
Cu–hemin MOFs were first prepared according to a previous report with a slight modification (Scheme S1†).38 Typically, 1.6 mg (2.5 μmol) of Hemin powder and 42.6 mg (0.25 mmol) of CuCl2·2H2O were mixed in 5.0 mL of 0.1 M PBS (pH = 7.0) and stirred for 2 h at room temperature. A gray-blue precipitate gradually appeared, indicating the formation of Cu–hemin MOFs. The product was collected by centrifugation at 8000 rpm for 10 min, and the precipitate was washed with water and ethanol three times each. The final precipitate was dried at 60 °C and stored in a desiccator before use. In contrast, Zn–hemin MOFs were obtained in a similar way by replacing CuCl2·2H2O with Zn(NO3)2·6H2O (74.4 mg, 0.25 mmol).2.4 Preparation of Au@MOFs
Na3Cit stabilized gold nanoparticles (Na3Cit@AuNPs) were first prepared according to a previous report.39 Then, Cu–hemin MOFs were redispersed into an appropriate amount of deionized water with the addition of a certain volume of Na3Cit@AuNPs. The mixture was stirred homogeneously for 48 h at room temperature, and was later centrifuged at 10000 rpm for 10 min. The precipitate was washed three times with deionized water to obtain Au@MOFs (Scheme S1†).2.5 Preparation of Au@MOFs modified antibody (Ab2–Au@MOFs)
The prepared Au@MOFs were dispersed into PBS2, and the pH was adjusted to approximately 9.0 with 0.10 M NaOH. Later, 25 μL of 1.0 mg mL−1 anti-cTnI was added to 1.0 mL of Au@MOFs dispersion and gently mixed at 4 °C overnight. Subsequently, 250 μL of BSA (5.0%, w/w) was added, and mixed for 40 min. After centrifugation at 10![[thin space (1/6-em)]](https://www.rsc.org/images/entities/char_2009.gif) 000 rpm for 20 min, the precipitate was redispersed in PBS2 and stored at 4 °C for further use.
000 rpm for 20 min, the precipitate was redispersed in PBS2 and stored at 4 °C for further use.
2.6 Fabrication of ESCL immunosensors
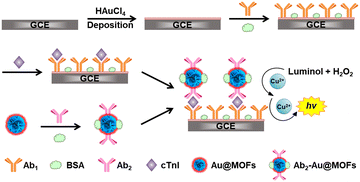
The fabrication of the ESCL immunosensor is shown in Scheme 1. The pretreated GCE was first placed in 0.50 M H2SO4 aqueous solution containing 2.0 mM HAuCl4, and double potential step chronoamperometry (1.1 V to 0 V, pulse width of 0.25 s, 300 steps) was performed to obtain Auplate/GCE. Then, 6.0 μL of anti-cTnI (1.0 mg mL−1, Ab1) was added to fully cover the surface of Auplate/GCE, followed by incubation at 4 °C overnight (Ab1/Auplate/GCE). Afterwards, 6.0 μL of BSA (3.0%, w/w) was rapidly added to the modified electrode surface at 4 °C over 1 h (BSA/Ab1/Auplate/GCE) to block the nonspecific binding sites. Subsequently, a droplet of 6.0 μL of PBS2 containing different concentrations of cTnI or serum samples was added and incubated at 37 °C for 1 h to fabricate cTnI/BSA/Ab1/Auplate/GCE. Finally, 6.0 μL of Ab2–Au@MOFs was added and incubated for 40 min at 37 °C (Ab2–Au@MOFs/cTnI/BSA/Ab1/Auplate/GCE). After each incubation step, the modified GCE was carefully rinsed with PBS2 three times.2.7 ECL measurements
ECL signals were measured in PBS1 containing 100 μM luminol and 10 mM H2O2. The CV was recorded from −1.0 V to 1.0 V with a scan rate of 0.1 V s−1. The photomultiplier tube (PMT) was set to 600 V.3. Results and discussion
3.1 Characterization of Cu–hemin MOFs and Au@MOFs
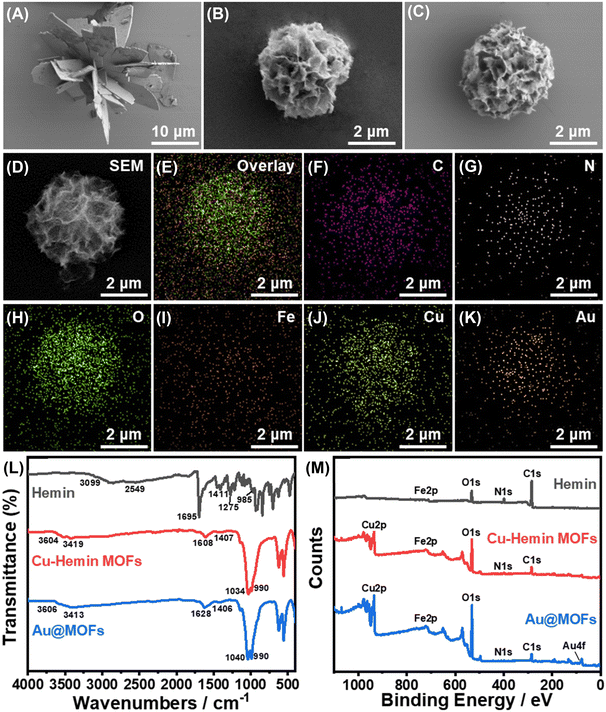
The synthetic principle of the Au@MOFs is shown in Scheme S1.† In neutral buffer, two-dimensional nanosheets were generated through the coordination between Cu2+ and the carboxyl groups of Hemin molecules, and further self-assembled to form the three-dimensional structure of Cu–hemin MOFs.38 Since Hemin has an Fe atomic active center, the surface of Cu–hemin MOFs is abundant in positive charge. Subsequently, a large number of negatively charged AuNPs were loaded into the open pores of Cu–hemin MOFs through electrostatic interaction, which effectively prevented the aggregation of AuNPs and significantly improved the electron mass transfer capacity of MOFs.The morphology and element distribution of the synthesized materials were observed by SEM and EDAX, as shown in Fig. 1. Fig. 1A shows the SEM image of Zn–hemin MOFs with an irregular three-dimensional flower-like structure, the particle size of which is about 25 μm. Fig. 1B displays the SEM image of Cu–hemin MOFs, which generally exhibit a three-dimensional nanoflower spherical structure (about 4 μm in diameter) with abundant pores and a pore diameter of about 200 nm, consistent with the literature report.38 Compared with Cu–hemin MOFs, the overall morphology of the Au@MOFs (Fig. 1C) is basically unchanged, but the content of element Au increases significantly (Table S1†). In addition, Fig. 1D–K confirm that C, N, O, Fe, Cu and Au elements are uniformly dispersed in the Au@MOFs, indicating the successful assembly of AuNPs.
UV-vis absorption spectra were first used to analyze the composition of the synthesized composites (Fig. S1†). In Cu–Hemin MOFs, the characteristic absorption peak of Cu2+ disappears, and only weak B band absorption of hemin can be observed (410 nm),38 which demonstrates that Cu2+ was inserted to hemin molecules.30 In the mixture of Cu–Hemin MOFs and AuNPs, the absorption peaks of the B band (404 nm) and AuNPs (524 nm) can be observed at the same time with no significant peak shift, while in Au@MOFs, the absorption peak of AuNPs disappears, indicating that AuNPs were successfully loaded into Cu–hemin MOFs.
XRD spectra were later used to characterize the chemical composition and crystal phase purity of the synthesized materials (Fig. S2†). In the XRD spectrum of Cu–hemin MOFs, significant diffraction peaks can be observed around 8.1°, 12.8°, 20.8°, 29.9°, 33.5°, 40.1°, and 53.2°, indicating its good crystallinity.31,38 In the XRD spectra of Au@MOFs, the diffraction peaks of Cu–hemin MOFs are basically unchanged, and new diffraction peaks appear around 38.2° and 44.3°, representing the (111) and (200) lattice facets of Au, which suggests the successful loading of AuNPs with the retained nanoflower spherical structure of MOFs.
The structural and compositional changes of the synthesized composites were further characterized by FT-IR and XPS, as shown in Fig. 1L and M. In the FT-IR spectrum of Hemin, the absorption peaks of associated O–H (3099–2549 cm−1 and 1275 cm−1), C![[double bond, length as m-dash]](https://www.rsc.org/images/entities/char_e001.gif) O (1695 cm−1) and C–O (1411 cm−1) in the carboxyl groups can be clearly observed.38 Meanwhile in Cu–hemin MOFs, owing to the coordination between carboxyl groups and Cu2+, only the symmetric and antisymmetric absorption peaks of COO− can be observed (1608 cm−1 and 1407 cm−1). Notably, the absorption peak at 990 cm−1 in Cu–hemin MOFs is stronger than that in hemin (985 cm−1), which may be related to the ordered assembly of hemin in MOFs.32 Compared with Cu–hemin MOFs, the FT-IR spectrum of Au@MOFs has no significant change, but the Au4f peak appears in the XPS spectrum of Au@MOFs (Fig. 1M), confirming the successful assembly of AuNPs. Besides, in the C1s spectrum of Cu–hemin MOFs (Fig. S3B†), the newly emerged π–π* satellite bonds indicate that the formation of the three-dimensional ordered structure of MOFs may be driven by the π–π stacking of hemin. In the O1s spectrum of Cu–hemin MOFs (Fig. S3E†), C
O (1695 cm−1) and C–O (1411 cm−1) in the carboxyl groups can be clearly observed.38 Meanwhile in Cu–hemin MOFs, owing to the coordination between carboxyl groups and Cu2+, only the symmetric and antisymmetric absorption peaks of COO− can be observed (1608 cm−1 and 1407 cm−1). Notably, the absorption peak at 990 cm−1 in Cu–hemin MOFs is stronger than that in hemin (985 cm−1), which may be related to the ordered assembly of hemin in MOFs.32 Compared with Cu–hemin MOFs, the FT-IR spectrum of Au@MOFs has no significant change, but the Au4f peak appears in the XPS spectrum of Au@MOFs (Fig. 1M), confirming the successful assembly of AuNPs. Besides, in the C1s spectrum of Cu–hemin MOFs (Fig. S3B†), the newly emerged π–π* satellite bonds indicate that the formation of the three-dimensional ordered structure of MOFs may be driven by the π–π stacking of hemin. In the O1s spectrum of Cu–hemin MOFs (Fig. S3E†), C![[double bond, length as m-dash]](https://www.rsc.org/images/entities/char_e001.gif) O and C–OH are shifted by 0.7 eV and 1.2 eV, respectively, in the direction of reducing binding energy, which may be caused by the coordination between carboxyl groups and Cu2+. Meanwhile, the Cu2p spectra of Cu–hemin MOFs and Au@MOFs (Fig. S3G and H†) further confirmed the existence of Cu(II). The above results prove the successful preparation of Cu–hemin MOFs and Au@MOFs.
O and C–OH are shifted by 0.7 eV and 1.2 eV, respectively, in the direction of reducing binding energy, which may be caused by the coordination between carboxyl groups and Cu2+. Meanwhile, the Cu2p spectra of Cu–hemin MOFs and Au@MOFs (Fig. S3G and H†) further confirmed the existence of Cu(II). The above results prove the successful preparation of Cu–hemin MOFs and Au@MOFs.
3.2 ECL properties
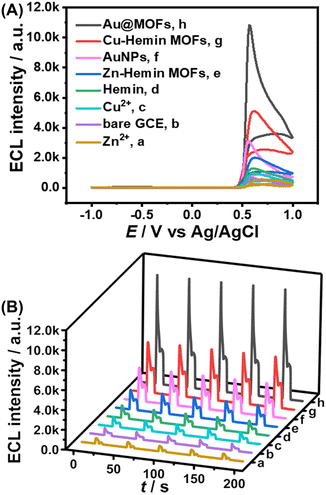
After the synthesized Au@MOFs were modified on the electrode surface and a certain potential range was applied (−1.0 to 1.0 V), Cu2+ gradually dissolved from the electrode surface, and then cooperated with Hemin and AuNPs in the MOF composites to accelerate the ECL reaction, resulting in a triple amplified ESCL process, as shown in Scheme S2.Specifically, the ECL intensity of the bare GCE was set to 1-fold as the standard for the quantification of the enhancement by other catalysts. Compared to the single-component catalysts (1.5-fold for Cu2+, 2-fold for Hemin, and 4.5-fold for AuNPs), Cu–hemin MOFs (7-fold) and Au@MOFs (16-fold) show stronger ECL response and better stability (Fig. 2), while the ECL signal of Au@MOFs is much higher than the total ECL signals of the three components (8-fold), indicating that all the three structural units can not only enhance the ECL launch of the luminol–H2O2 system separately, but also further amplify the ECL signal though the synergistic effect. In addition, compared to Zn2+ (0.8-fold) or Hemin, Zn–hemin MOFs (3-fold) exhibit a better catalytic effect on the luminol–H2O2 system due to the formation of the three-dimensional flower-like structure of MOFs, which exposes more active sites, thereby amplifying the ECL signal.32
Representative catalysts were selected for the electrode modification and CV scanning to explore the catalytic amplification mechanism towards the ECL intensity of the luminol–H2O2 system (Fig. S4†). The results demonstrate that the ordered assembly of multiple catalysts can significantly improve the electron transport efficiency and accelerate the conversion of H2O2 to reactive oxygen species (ROS), so that the electrooxidized luminol anions can be rapidly converted into high-energy excited states to produce stronger ECL emission.
The excellent catalytic performance of the Au@MOFs towards the luminol–H2O2 system can be attributed to four factors. First, the organic ligand (hemin), with an active center of Fe atom, has good electron transport ability and can greatly accelerate the decomposition of H2O2, thereby enhancing the ECL emission.40 Second, the formation of the three-dimensional structure of MOFs can effectively aggregate Hemin molecules, while the open pore structure allows the free diffusion, entry and exit of small molecules, which greatly increases the contact area between the active center and the luminol–H2O2 system,32 leading to an increased ECL signal. Third, the metal center (Cu2+) gradually dissolves under the applied potential and accelerates the ECL reaction process as the efficient catalyst.35 Fourth, the porous structure of MOFs allows the loading of a large number of guest molecules (AuNPs), which can significantly improve the conductivity of the composites and provide more reactive sites, thereby significantly amplifying the ECL intensity. As a result, Au@MOFs are expected to be used as sensitive labels or catalytic amplification interfaces for ESCL analysis and detection.
3.3 Characterization of the ESCL immunosensor
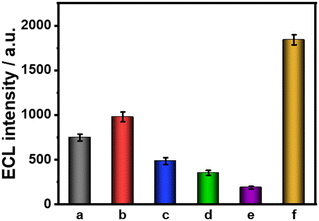
Each modification step of the constructed ESCL immunosensor was characterized using ECL, CV, and EIS, as shown in Fig. 3 and S6.† Compared with the bare GCE (a), the ECL signal of Auplate/GCE (b) slightly increased due to the electrodeposition of AuNPs, which could accelerate the electron transfer rate and the electroexcitation process of ECL. Subsequently, a large number of anti-cTnI were adsorbed and fixed onto the surface of Auplate/GCE through Au–N or Au–S bonds, which significantly hindered the electron transport, resulting in decreased ECL signals (c). Similarly, the assembly of BSA (d) and cTnI (e) also led to a decreased ECL signal. Finally, anti-cTnI–Au@MOFs were captured (f) through a specific interaction. The catalytic amplification of labels (Au@MOFs) towards the luminol–H2O2 system dominated, resulting in a significant increase of the ECL signal (Fig. 3).The bare GCE (a) and Auplate/GCE (b) have nice voltammograms and impedances, indicating their good electric conductivity (Fig. S6A†). When the non-conductive proteins were assembled to the electrode surface stepwise (c–e), the electrical activity of the modified electrode gradually decreased, along with the decreased peak current and the increased potential difference between the anodic and the cathodic peak (Fig. S6A†). Finally, anti-cTnI–Au@MOFs were captured on the electrode surface to form “sandwich-type” immune complexes. Trace amounts of Cu2+ dissolved from the electrode surface led to the formation of insoluble Cu2+–Fe(CN)63−/4− salts, resulting in a significant decrease in electrode activity.41 During the whole assembly process, the experimental results of EIS are consistent with the CV results, as shown in Fig. S6B.† The above results demonstrate the successful construction of the ESCL immunosensor, which is expected to be used for accurate and sensitive detection of cTnI.
3.4 ESCL immunosensor for cTnI detection
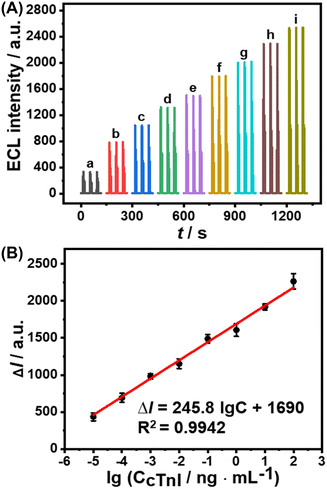
An ESCL immunosensor was constructed to detect cTnI under optimized conditions, as shown in Scheme 1. As the concentration of cTnI increased, the specific recognition of anti-cTnI increased, and the Au@MOFs bound to the modified electrode increased accordingly, ultimately leading to the enhancement of ECL signals. A good linear relationship between the increase of ECL intensity (ΔI) and the logarithmic concentration of cTnI (lgC) was obtained (Fig. 4). The linear range is 1.0 × 10⁻⁵–1.0 × 10² ng mL−1, and the limit of detection is 0.78 fg mL−1. In addition, seven replicates of 10 pg mL−1 and 0.10 ng mL−1 cTnI immunoelectrodes were detected, of which the relative standard deviations (RSDs) were 6.4% and 4.3%, respectively, revealing the good repeatability.A comparison of the constructed ESCL sensor with other immunoassay methods for the determination of cTnI is listed in Table S2.† The results exhibit that the limit of detection of the proposed method is at least one order of magnitude lower than previous reports, indicating its outstanding advantages in detecting ultra-trace proteins. In addition, the proposed ESCL immunosensor does not require the pre-enrichment of the electrochemically dissolved metal ions compared with other ESCL methods, which greatly simplified the experimental operation processes and shortened the analysis time. More importantly, it provides a new idea for the detection of biomarkers like cTnI, and greatly broadens the application scope of functionalized MOFs and ESCL methods in the field of immunoanalysis.
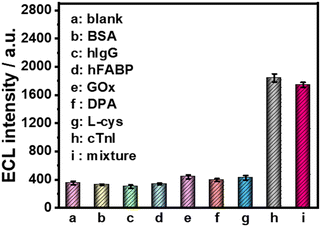
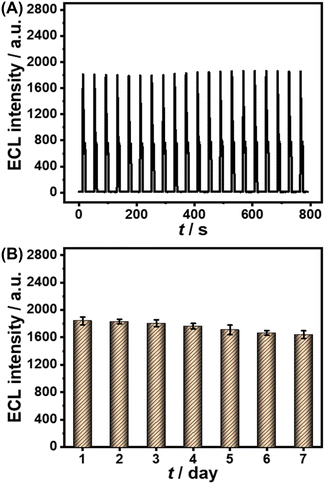
Furthermore, several common interfering substances were selected to confirm the specificity and selectivity of the constructed ESCL sensor (Fig. 5). Only in the presence of cTnI could the ECL response be increased significantly, revealing the good selectivity of the fabricated immunosensor. The stability of the ESCL immunosensor was also monitored, as shown in Fig. 6. The ECL signal remained basically unchanged under 20 continuous CV scans and the RSD is 1.5%, indicating the excellent ECL stability of the ESCL sensor. Subsequently, the immunoelectrodes were stored at 4 °C and tested for 7 consecutive days, and 89% of the original ECL intensity was still maintained, which demonstrated that the constructed ESCL sensor was expected to be applied in clinical practice.
To evaluate the utility of ESCL immunosensors, several clinical serum samples were measured by the standard addition method. As shown in Table 1, the acceptable recoveries (88–104%) and satisfactory RSDs (less than 12%) revealed the great potential of the constructed ESCL sensor in the accurate and sensitive detection of cTnI.
| Serum samples | Detected (pg mL−1) | Added (pg mL−1) | Total measured (n = 3, pg mL−1) | Recovery (%) |
|---|---|---|---|---|
| a Human serum samples were diluted 10 times using 0.01 M PBS (pH = 7.4). | ||||
| 1 | 1.0 | 5.0 × 10 | (4.8 ± 0.3) × 10 | 94 |
| 1.0 × 10² | (9 ± 1) × 10 | 93 | ||
| 2 | 1.2 | 5.0 × 10² | (4.4 ± 0.2) × 102 | 88 |
| 1.0 × 10³ | 9 × 10² | 90 | ||
| 3 | 1.9 ± 0.1 | 5.0 × 10³ | (5.2 ± 0.3) × 103 | 104 |
| 1.0 × 10⁴ | 1.0 × 10⁴ | 101 | ||
4. Conclusions
In summary, this work demonstrated that it was feasible to construct functionalized MOFs using multiple catalysts as building blocks. Cu–hemin MOFs and Au@MOFs were first applied to amplify the ECL signal of the luminol–H2O2 system, and an ESCL immunoassay method was developed for the sensitive detection of cTnI. The orderly assembly of the three catalysts and the open three-dimensional pore structure endowed Au @MOFs with extremely powerful catalytic properties, and the electrochemical stripping of Cu2+ further improved the sensitivity of the luminol–H2O2 system, resulting in a triple amplified ESCL process. In addition, AuNPs could act as the “bridge” for loading a large number of antibodies into Au@MOFs, which were subsequently used as labels for the specific identification of the target antigen, constructing a “sandwich-type” ESCL immunosensor. The proposed ESCL immunosensor was easy to prepare with excellent sensitivity and stability, exhibiting certain application potential in the detection of real samples. In short, this method provides a new idea for the synthesis of functionalized MOFs, greatly broadens the application range of ESCL, and offers a new direction for the development of ECL analysis based on biological affinity reactions.Conflicts of interest
The authors declare that they have no conflict of interest.Acknowledgements
This work was supported by the National Key Research and Development Program of China (2016YFA0201300), National Science Foundation of China (22034001), and the Beijing National Laboratory for Molecular Sciences (BNLMS- CXXM-202008).Notes and references
- J. Zhou, Y. Li, W. Wang, X. Tan, Z. Lu and H. Han, Biosens. Bioelectron., 2020, 164, 112332 CrossRef CAS PubMed.
- P. Cheng, C. Wang, Y. V. Kaneti, M. Eguchi, J. Lin, Y. Yamauchi and J. Na, Langmuir, 2020, 36, 4231–4249 CrossRef CAS PubMed.
- C. P. Kanti and S. N. Ranjan, Coord. Chem. Rev., 2021, 446, 214125 CrossRef.
- H. Liang, X. Jiao, C. Li and D. Chen, J. Mater. Chem. A, 2018, 6, 334–341 RSC.
- J. Su, P. Jing, K. Jiang and J. Du, Dalton Trans., 2022, 51, 8938–8944 RSC.
- H. Liu, Y. Zhao, C. Zhou, B. Mu and L. Chen, Chem. Phys. Lett., 2021, 780, 138906 CrossRef CAS.
- N. R. Habib, N. E. Asedegbega, A. M. Taddesse and I. Diaz, Dalton Trans., 2021, 50, 10340–10353 RSC.
- J. Feng, T. Yao and Z. Ma, Sens. Diagn., 2023, 2, 781–791 RSC.
- N. Makhanya, B. Oboirien, J. Ren, N. Musyoka and A. Sciacovelli, J. Energy Storage, 2021, 34, 102179 CrossRef.
- L. I. Abánades and R. S. Forgan, Coord. Chem. Rev., 2019, 380, 230–259 Search PubMed.
- I. Ahmed, M. M. H. Mondol, M. J. Jung, G. H. Lee and S. H. Jhung, Coord. Chem. Rev., 2023, 475, 214912 CAS.
- T. Iizuka, N. Hosono and T. Uemura, Dalton Trans., 2022, 51, 13204–13209 RSC.
- J. J. Liu, J. J. Fu, T. Liu, X. Shen and F. X. Cheng, Dyes Pigm., 2022, 205, 110542 CrossRef CAS.
- X. Qin, X. Zhang, M. Wang, Y. Dong, J. Liu, Z. Zhu, M. Li, D. Yang and Y. Shao, Anal. Chem., 2018, 90, 11622–11628 CAS.
- G. Y. Zhang, C. Cai, S. Cosnier, H. B. Zeng, X. J. Zhang and D. Shan, Nanoscale, 2016, 8, 11649–11657 CAS.
- C. V. Uliana and H. Yamanaka, J. Solid State Electrochem., 2020, 24, 1927–1933 CAS.
- Y. Qiao, Y. Li, W. Fu, Z. Guo and X. Zheng, Anal. Chem., 2018, 90, 9629–9636 CAS.
- X. Zheng, D. Qin, S. Hu, W. Mo and B. Deng, Sens. Diagn., 2023, 2, 427–437 RSC.
- L. Zhang, J. Zhou, Y. Hao, P. He and Y. Fang, Electrochim. Acta, 2005, 50, 3414–3419 CrossRef CAS.
- Z. Lin, J. Chen, Y. Chi, B. Qui, J. Lin and G. Chen, Electrochim. Acta, 2008, 53, 6464–6468 CAS.
- Y. Yang, Y. Zhang, L. Wei, G. Li, M. Guan and S. Tian, Electroanalysis, 2019, 31, 624–631 CrossRef CAS.
- B. Haghighi, A. Tavakoli and S. Bozorgzadeh, J. Electroanal. Chem., 2016, 762, 80–86 CrossRef CAS.
- Z. Yu, X. Wei, J. Yan and Y. Tu, Analyst, 2012, 137, 1922–1929 RSC.
- Y. Hu, C. Chen, Y. Liu, S. Wang, Z. Guo and Y. Hu, J. Electroanal. Chem., 2018, 815, 61–67 CrossRef CAS.
- H. Li, H. Zhou, T. Zhang, Z. Zhang, G. Zhao and C. Wang, ACS Sustainable Chem. Eng., 2022, 10, 10361–10368 CrossRef CAS.
- S. Zhang, Y. Huang, Y. Chen, S. Yan, H. Dai and J. Zhao, Sens. Diagn., 2023, 2, 140–146 RSC.
- X. Lin, S. Zhu, Q. Xia, J. Ma and Y. Fu, Anal. Methods, 2018, 10, 84–90 RSC.
- G. Liu, X. Guan, B. Li, H. Zhou, N. Kong and H. Wang, Microchim. Acta, 2022, 189, 297 CrossRef CAS PubMed.
- Q. Ke, Y. Shi, Y. Liu, F. Chen, H. Wang, X. Wu, H. Lin and J. Chen, Sep. Purif. Technol., 2019, 229, 115822 CrossRef CAS.
- H. S. Choi, X. Yang, G. Liu, D. S. Kim, J. H. Yang, J. H. Lee, S. O. Han, J. Lee and S. W. Kim, J. Taiwan Inst. Chem. Eng., 2020, 113, 1–7 CrossRef CAS.
- X. Chen, X. Wang, G. Cao, Y. Wu, H. Luo, Z. Ji, C. Shen, D. Huo and C. Hou, Microchim. Acta, 2020, 187, 601 CrossRef CAS PubMed.
- L. Mi, Y. Sun, L. Shi and T. Li, ACS Appl. Mater. Interfaces, 2020, 12, 7879–7887 CrossRef CAS PubMed.
- C. Zhang, Analyst, 1998, 123, 1383–1386 RSC.
- W. Qin, Z. Zhang and H. Liu, Anal. Chem., 1998, 70, 3579–3584 CrossRef CAS PubMed.
- Y. Dong, X. Qin, M. Wang, C. Gu, Z. Zhu, D. Yang and Y. Shao, Anal. Chem., 2020, 92, 1890–1897 CrossRef CAS PubMed.
- B. J. Shi, L. Shang, W. Zhang, L. P. Jia, R. N. Ma, Q. W. Xue and H. S. Wang, Sens. Actuators, B, 2021, 344, 130291 CrossRef CAS.
- L. Shang, B. J. Shi, W. Zhang, L. P. Jia, R. N. Ma, Q. W. Xue, H. S. Wang and W. Yan, Sens. Actuators, B, 2022, 368, 132191 CrossRef CAS.
- J. He, H. Yang, Y. Zhang, J. Yu, L. Miao, Y. Song and L. Wang, Sci. Rep., 2016, 6, 36637 CrossRef CAS PubMed.
- M. F. Huang, Y. C. Kuo, C. C. Huang and H. T. Chang, Anal. Chem., 2004, 76, 192–196 CrossRef CAS PubMed.
- Y. Jiang, R. Li, W. He, Q. Li, X. Yang, S. Li, W. Bai and Y. Li, Microchim. Acta, 2022, 189, 129 CrossRef CAS PubMed.
- T. Liu, R. Hu, X. Zhang, K. Zhang, Y. Liu, X. Zhang, R. Bai, D. Li and Y. Yang, Anal. Chem., 2016, 88, 12516–12523 CrossRef CAS PubMed.
Footnote |
| † Electronic supplementary information (ESI) available. See DOI: https://doi.org/10.1039/d3sd00139c |
| This journal is © The Royal Society of Chemistry 2023 |

