
 Open Access Article
 This Open Access Article is licensed under a Creative Commons Attribution-Non Commercial 3.0 Unported Licence
Self-powered sensors for biomarker detection
Jiaxuan
Li†
a,
Lingling
Xu†
b,
Yang
Zou
c and
Zhou
Li
 *ad
*ad
aBeijing Key Laboratory of Micro-nano Energy and Sensor, Beijing Institute of Nanoenergy and Nanosystems, Chinese Academy of Sciences, Beijing 101400, China. E-mail: zli@binn.cas.cn
bCAS Key Laboratory for Biomedical Effects of Nanomaterials and Nanosafety & CAS Center for Excellence in Nanoscience, National Center for Nanoscience and Technology of China, Beijing 100190, P.R. China
cSchool of Life Science, Beijing Institute of Technology, Beijing 100081, China
dSchool of Nanoscience and Technology, University of Chinese Academy of Sciences, Beijing 100049, China
First published on 6th June 2023
Abstract
Patient-friendly wearable and implantable sensors based on biomarkers play an important role in health monitoring and disease diagnosis with telemedicine and personalized medicine. However, due to the limited life of batteries, the long-term real-time detection of these biomarkers for a general sensor remains a huge challenge. The introduction of self-powered electronic devices is a possible approach to solve the problem of long-term wearability. This approach can convert energy from the sunlight, environmental heat, and mechanical motion or chemical energy of the wearer into electrical energy and supply it to the sensor unit to detect biochemical signals. This strategy can develop advanced functions for sensors, such as extended life, miniaturization, and flexibility to improve comfort and wearability, and functions combined with wireless data transmission and mobile data processing. In this review, we summarized the existing self-powered technology and the mechanism of biosensors. We reviewed recent progress of self-powered biomarker sensors including exocrine fluid sensors and extracellular fluid sensors from the working principle, output properties and detection performance index. And the challenges and outlooks of self-powered biomarker sensors are also presented.
 Jiaxuan Li | Jiaxuan Li received her Bachelor's degree from the University of Science and Technology Beijing in 2021 and Master's degrees from the University of Dundee in 2022. She is now a research assistant fellow at the Beijing Institute of Nanoenergy and Nanosystems. Her research interests are the biomedical applications of electrical stimulation. |
 Lingling Xu | Lingling Xu received her Bachelor and Master's degrees from Sichuan University in 2015 and 2018, respectively, and her Ph.D. degree from the University of Chinese Academy of Sciences in 2021. She is now a postdoctoral research fellow at the National Center for Nanoscience and Technology of China. Her research interests include stimulus-responsive drug delivery systems and biomedical systems. |
 Yang Zou | Yang Zou received his Bachelor's degree from Beihang University in 2016 and Doctor's degree in Nanoscience and Technology from the University of Chinese Academy of Sciences in 2021. He is now a postdoctoral fellow at the Beijing Institute of Technology. His research interests mainly focus on soft energy harvesters and biosensors, nanogenerators and bionic electronics |
 Zhou Li | Zhou Li received his Bachelor's degree from Wuhan University in 2004 and Doctor's Degree from Peking University in 2010. He joined the School of Biological Science and Medical Engineering of Beihang University in 2010 as an associate professor. Currently, he is the principal investigator and group leader of the Nanoenergy and Biosystem Lab (NBL) at the Beijing Institute of Nanoenergy and Nanosystems, Chinese Academy of Sciences. He is supported by the National Youth Talent Support Program and the National Science Fund for Distinguished Young Scholars. His research interests include nanogenerators, in vivo energy harvesters and self-powered medical devices, and biosensors. |
1. Introduction
As people's quality of life improves, more and more people are becoming concerned about their health. However, the inaccurate early screening of diseases leads to untimely disease intervention and increased medical expenses, increasing the economic burden on patients and society. Therefore the concept of personalised medicine was introduced.1 With the advent of personalised medicine, the emphasis of doctors' healthcare is changing from treatment to prevention. This new approach allows for greater accuracy and predictability in both diagnosis and treatment, which ultimately enables early intervention and reduces the risk of overtreatment.1,2 To achieve this purpose, wearable and implantable medical sensors are therefore being developed at a rapid pace. These sensors collect patient information in various environments to aid in diagnosis, while also overcoming the heavy and bulky characteristics of traditional instruments to create a more comfortable diagnostic process for patients. Furthermore, to overcome the contamination3 caused by the batteries used for biomedical sensors, nanogenerators were invented in 2006,4 and self-powered sensors then attracted the attention of scientists.5Compared to conventional medical devices, nanogenerators can obtain green and cleaner energy through piezoelectric,6 triboelectric,7–9 thermoelectric,10 and other processes. And they are longer-lived, lighter, smaller, and cheaper to make, and can respond to varying mechanical excitation with great sensitivity.11 Based on these characteristics, nanogenerators can be used as a stable power source to provide energy for biomedical sensors. In addition, the design of devices with high flexibility, sensitivity, and mechanical stability to meet the needs of wearable medical sensors12,13 or with high biocompatibility, mechanical strength, and durability to meet the needs of implantable devices14 has become a major research field for nanogenerators in biomedical applications.15
Currently for self-powered biomedical sensors, in addition to applications in the detection of vital signs, such as human movement,16–20 temperature,21 respiratory22–24 and cardiovascular systems,25–29 neural electric impulse,30 intracranial monitoring,31etc., self-powered biomedical sensors have great potential in the detection of biomarkers to dynamically monitor the health status of patients, identify possible pathologies, accurately define the mechanistic basis of diseases and to help the development of targeted drugs.32 For instance, the detection of the composition of body fluids and secretory fluids (sweat, urine, etc.) is widely used in the diagnosis of tumours,33 cancer,34,35 Alzheimer's disease,36etc.
Body fluids, secretory fluids (sweat, saliva, tears, etc.) and molecules in exhaled gases are commonly used biofluids for biomarker detection. These analytes contain rich physiological information, including metabolites, electrolyte content, enzyme activity, and more, making them ideal for non-invasive detection. Enzyme and ion-selective electrochemical sensors and voltammetric sensors are commonly used for biomarker detection. Methods of electrical energy conversion for these sensors include energy conversion based on mechanical movement of the body (triboelectric nanogenerators and piezoelectric nanogenerators), energy harvesting from the external environment (thermoelectric/pyroelectric nanogenerators, solar cells) and energy harvesting through conversion of the body's chemical energy (biofuel cells).37 In addition, as a result of the establishment of the Internet of Things, these sensors can be integrated into health platforms and simplify telemedicine processes through methods such as RFID or Bluetooth.38,39 Therefore, although there are numerous reviews about wearable self-powered sensors, reviews summarizing current applications of self-powered sensors for chemical biomarker detection are still lacking.
This paper aims to provide an overview of the development of self-powered biomarker sensors in terms of the device type, output performance and detection sensitivity, and introduce potential applications that can be used as marker sensors. Additionally, it will explore potential applications for these sensors as biomarker sensors and discuss some of the challenges and future directions for biomarker-based sensing (Fig. 1).
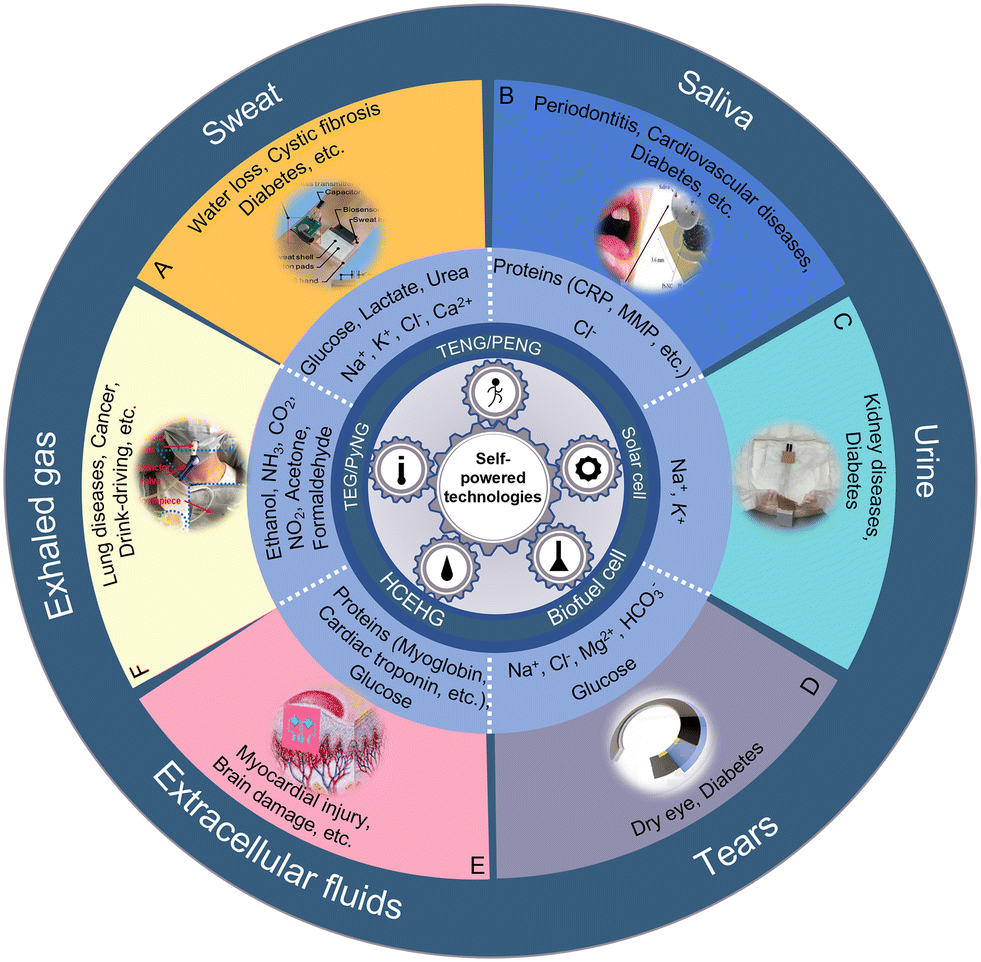 | ||
| Fig. 1 Design strategies of biochemical sensor systems. (A) The sweat application reproduced from ref. 40 with permission from Elsevier, copyright 2019. (B) The saliva application reproduced from ref. 41 with permission from the MDPI, copyright 2020. (C) The urine application reproduced from ref. 42 with permission from the American Chemical Society, copyright 2021. (D) The tear application reproduced from ref. 43 with permission from the American Chemical Society, copyright 2022. (E) The extracellular fluid application reproduced from ref. 44 with permission from The Royal Society of Chemistry, copyright 2018. (F) The exhaled gas application reproduced from ref. 45 with permission from Elsevier, copyright 2019. | ||
2. Principle and classification of self-powered technology
To overcome the limitation of the lifetime of mobile sensors' energy storage units, the concept of self-powered was first proposed by Zhong Lin Wang in 2006.4 His group designed an extremely small energy harvester that can harvest energy from the body, including chemical and mechanical energy, and the ambient environment,46 such as sunlight and thermal energy. Here in this section, we summarised six types of energy harvesters, including triboelectric nanogenerators (TENGs) and piezoelectric nanogenerators (PENGs) which are mainly used to harvest mechanical energy, to harvest sunlight and heat energy, solar cells and thermal/pyroelectric nanogenerators are put into service, biofuel cells convert chemical energy into electrical energy, and hydrovoltaic generators convert environmental thermal energy into electrical energy by interaction at the solid–liquid interface.2.1 Triboelectric nanogenerators (TENGs)
In 2012, TENGs were first reported by Wang et al.47 and showed their superior ability to harvest ambient mechanical energy which can output power density up to 500 W m−2. The energy harvesting principle of tribological electricity is based on the frictional electrical effect between friction layers and electrostatic induction.47–49 As the friction layers consist of materials with different electrostatic attractions, opposite charges are generated on the surface of the materials when they come into contact with each other. When they are separated due to an external force to balance the potential difference, free electrons flow back and forth in the connected external circuit, forming an alternating current.Depending on different configurations, there are four working mechanisms of TENGs: vertical contact–separation mode, lateral sliding mode, single-electrode mode and free-standing triboelectric-layer mode; the structure is shown in Fig. 2A. With the different contact modes, TENGs can be applied to a very wide range of circumstances. Currently, TENGs are widely used as an energy harvester to provide energy for both wearable and implantable biosensors, like human–machine interfaces that recognize physiological or physical parameters and feedback them into readable electrical signals,50 or e-skins to detect biomarkers in sweat, body fluids and molecules in respiration, and they can develop as a power-sensing integrated device by the modified electrode.
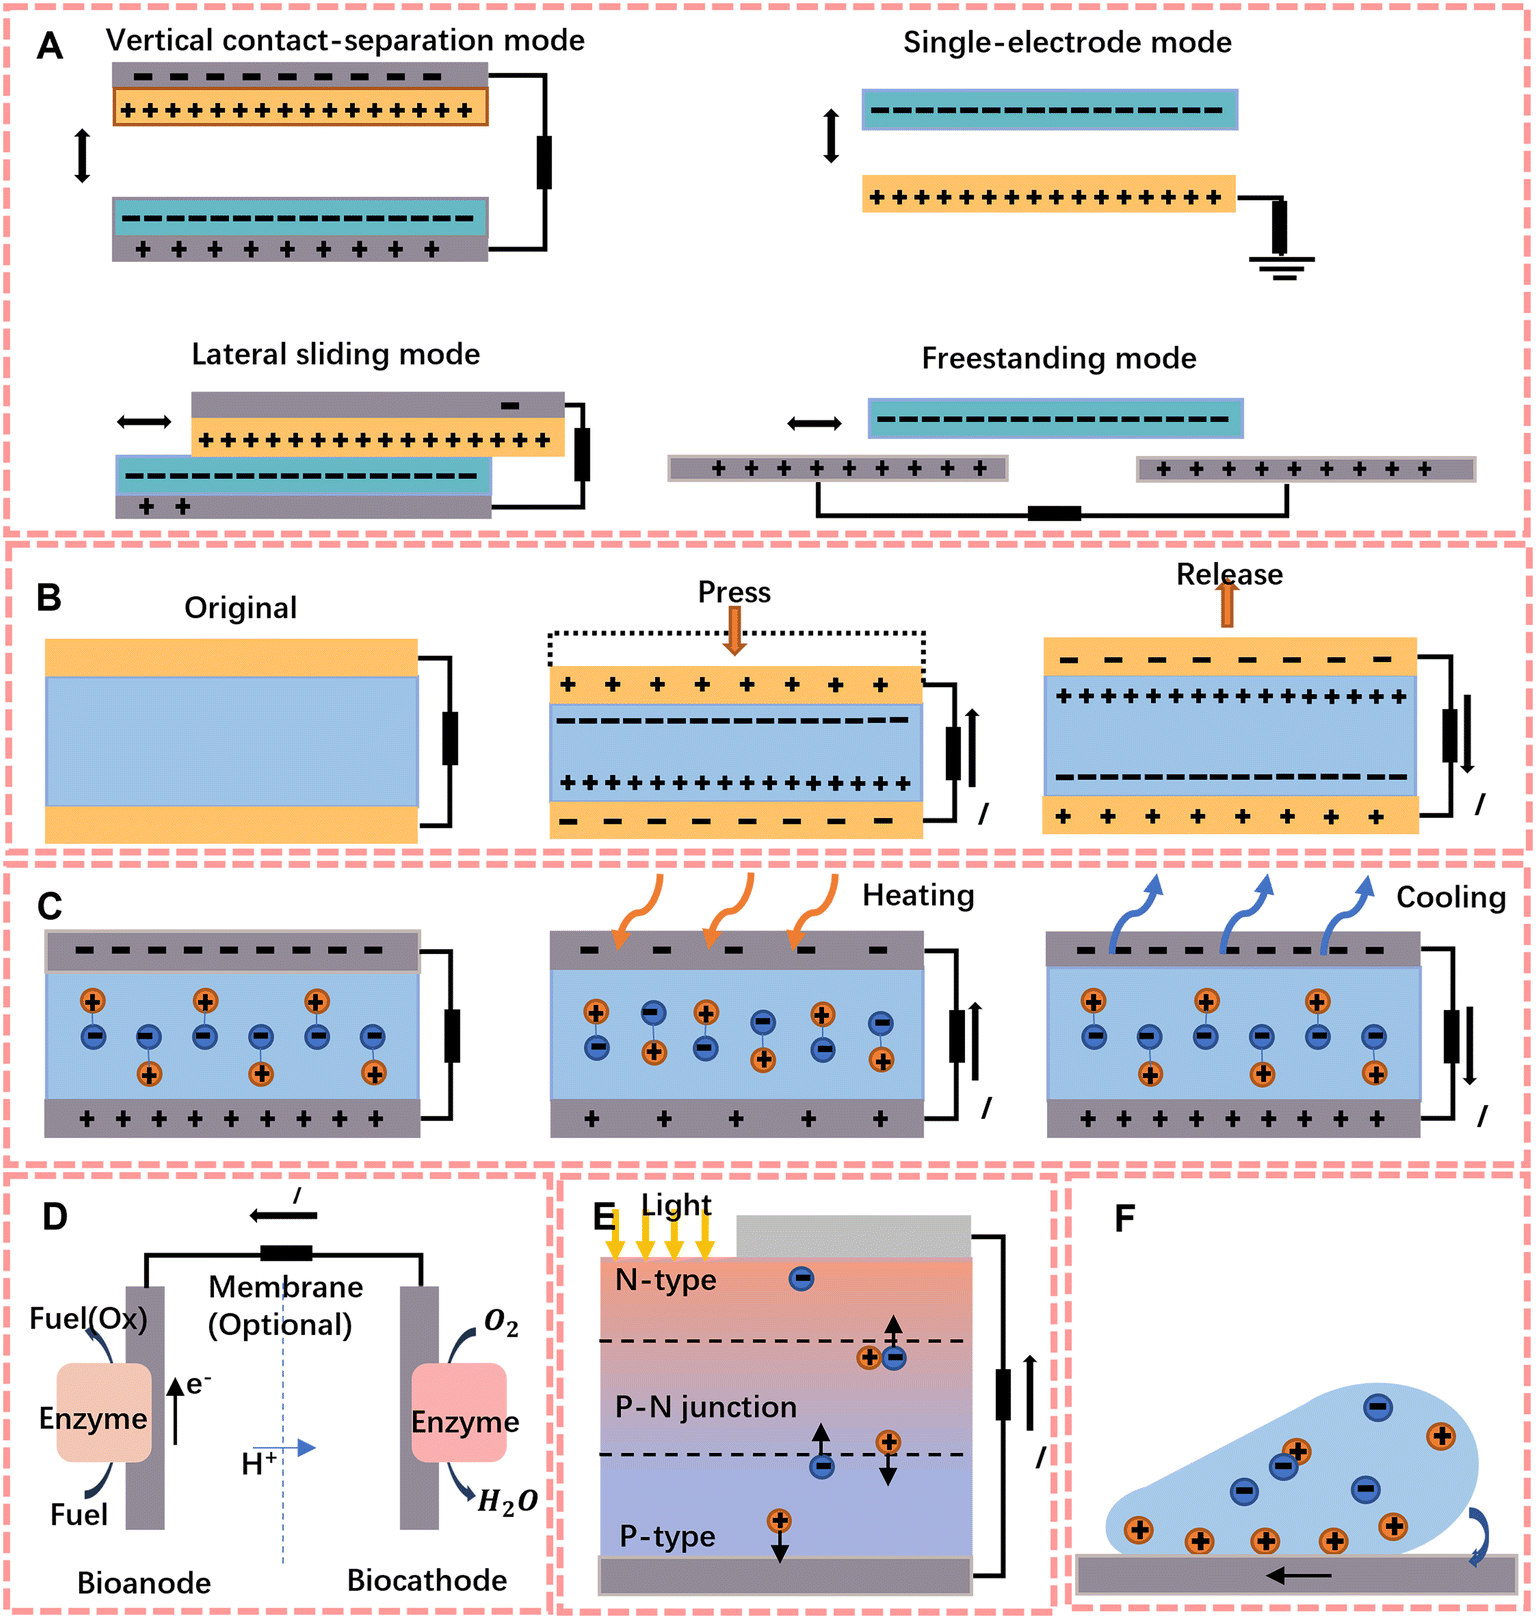 | ||
| Fig. 2 The working mechanism of self-powered sensors. (A) Four working modes of a TENG. (B) Schematic diagram of the piezoelectric effect. (C) Working principle of the pyroelectric effect. (D) Schematic diagram of a typical biofuel cell. (E) Working principle of the photovoltaic effect. (F) Schematic diagram of the hydrovoltaic effect. | ||
2.2 Piezoelectric nanogenerators (PENGs)
The principle of piezoelectric energy harvesting is the piezoelectric effect of the material. This means that an electric dipole moment will be generated inside the material by applying an external force, and a pulsed current can be formed in the external circuit (Fig. 2B). Since the first PENG with arrays of ZnO and nanowires was proposed by Wang and Song,4 researchers have begun to focus on the development of flexible electronics to increase the output performance of piezoelectric generators.Compared to conventional piezoelectric ceramics, organic polymers exhibit better mechanical flexibility, easy production, good stability and biocompatiblility.58 Currently, the most representative material is polyvinylidene fluoride (PVDF),59,60 which can be used as a material for piezoelectric scaffolds obtained by electrospinning61 and has been shown to have the ability to increase cell adhesion to aid wound healing.62 Because of its simple structure, it is widely used to harvest mechanical energy (joint motion, vascular pulsation, etc.) from the human body to power biochemical sensors.
2.3 Solar cells
Solar energy is one of the most popularly used renewable and green energy sources.63 Solar cells work on the principle of the photovoltaic effect, on which Bell Labs based the first battery that could run electronic devices using sunlight in 1950.64 The energy harvesting ability of solar cells comes from the structure of the PN junction, where photons with enough energy will result in interruption of electrical balance via exciting electrons from the P side to the N side (shown in Fig. 2E). In addition, to improve the photovoltaic conversion efficiency, researchers have developed solar cells with a more multilayer structure.65–68 However, multi-layer structures often lead to expensive costs. To reduce the costs, the third generation (organic photovoltaics (OPVs), perovskite solar cells (PSCs) and dye sensitized solar cells (DSSCs)) has developed fast and has significant benefits like stability, simplicity and flexibility.69 According to these studies, researchers found that the output effect of perovskite solar cells can be improved by fabricating honeycomb nanoscaffolds by nano-assembly-printing, and they have excellent flexural resistance and can be used in flexible solar cell modules to be assembled with common fabric cloth to power sensors.2.4 Thermal nanogenerators (TEGs)
The principle of TEGs is based on the Seebeck effect,70 which is the electric potential that forms across a temperature gradient, whereby carriers diffuse from the hot side to the cold side. Both conductors and semiconductors produce a Seebeck effect, but in contrast to semiconductors, the concentration and position of carriers in metals do not change with temperature and therefore their Seebeck effect is much smaller.10,71Electric heating devices are generally direct current generators made of semiconductor materials. Each thermocouple consists of an n-type semiconductor and a p-type semiconductor connected in series. The connected end of the two semiconductors is in contact with the heat source, while the unconnected end is connected to the heat sink via a wire. When the end of the semiconductors connected to the heat source gets hot, the cold end of the n-type will accumulate negative charge and the cold end of the p-type will accumulate positive charge, resulting in potential difference.72 The current problem of sensor-based TEGs is the efficiency of energy harvesting. The thermal resistance of the skin and material, and the natural heat dissipation all have a serious impact on the efficiency of thermoelectric based self-powered generation.73 Another issue is that due to the fragility of the material, the flexibility of wearable devices is a huge challenge. It is necessary to balance flexibility with energy harvesting efficiency and costs of devices.74
2.5 Pyroelectric nanogenerators (PyNGs)
The principle of pyroelectric nanogenerators is based on the pyroelectric effect; they overcome the need for thermoelectric materials to maintain a stable thermal gradient for electricity generation, with the pyroelectric effect requiring a temperature gradient that is in time.75 As the temperature changes, the polarisation of the material will change with the temperature. The charged particles subsequently exhibit charge release depending on whether they are pushed or attracted (Fig. 2C).Most PyNG based devices are designed to be wearable, using human movement and self-heating energy for energy recovery and converting thermal energy into usable electrical energy. For the recovery of natural waste heat, special auxiliary devices are generally required to achieve alternating hot and cold contact to achieve the thermal effect, but the complexity of the auxiliary devices often reduces the versatility of the device. In addition, the polarisation of the material is limited by its characteristics, the recovery of energy is weak and different researchers calculate the standard of energy recovery differently, which affect the judgement of the quality of the pyroelectric device. Therefore, in 2021, Kang et al.76 reported an efficient pyroelectric generator without an auxiliary device. They made nanocomposites by using P(VDF-TrFE-CFE) as the substrate with barium strontium titanate (BST) nanoparticles and boron nitride (BN) nanosheets, which have high polarizability and high thermal conductivity. And the conversion efficiency between the power density and heat flux was proposed as the standard for pyroelectric efficiency. Because it responds better to the behaviour of continuous heat production through the conversion of thermal energy into electrical energy, it is widely used for sweating sensors and respiration sensors as sport and natural breathing will release heat.
2.6 Biofuel cells
Biofuel cells are devices that use the energy of biological materials according to the principles of fuel cells. Generally, enzymes or microorganisms are used as catalysts to convert the chemical energy of biomass into electrical energy through bioelectrochemical pathways.77,78 Implantable enzyme-based biofuel cells use enzymes as biocatalysts in both poles of the cell or one pole, and the output power, voltage and current are all influenced by the enzyme activity. Cells can therefore be constructed with different parameters depending on the enzyme inhibitor.79 The structure of a typical biofuel cell is shown in Fig. 2D, which consists of a cathode, an anode, a semi-permeable membrane and the solution. Microbial species or enzymes can be in solution (or as a suspension) within the cell's anode compartment, but current researchers generally fix them to the electrodes to increase cell efficiency;80 for instance, Wang et al.81 developed a DNA sensor with a Pt-paper cathode with a detection limit of 6.3 fM. Once a suitable fuel is in place, it is partially or fully oxidised at the anode and the electrons released by this process are used to reduce oxygen from the cathode.In recent years, applications for biofuel cells have focused on tumour diagnostics82 and development of microchip-sized devices.83,84 The reason for this is that biofuel cell reactions are catalysed by specific enzymes (or microorganisms), avoiding the interference of small active molecules85 and converting the chemical energy which is stored in the biomolecules into electrical energy in situ under mild conditions. They also have lower requirements for test instrumentation compared to fluorescence signals, polymerase chain reactions, etc. and can produce continuous and accurate online signals. Due to these characteristics, biofuel cells are still one of the effective methods for detecting biomarkers in the human body.
2.7 Hydrovoltaic power generators (HCEHGs)
Hydrovoltaic generators are generators which can convert mechanical energy from water into electrical energy. The working principle of hydrovoltaic generators is the hydrovoltaic effect; it means that when the solution is in contact with a solid with surface charge, the electric double layer will dominate the interfacial interaction, and the properties of nanomaterials will lead to strong coupling to water molecules.86,87 At this time, the steady voltage will be formed because of the overlap of the electric double layer during relative movement, which includes steaming, drawing and waving.86Fig. 2F shows the hygroelectric effect produced by drawing a droplet on graphene.Since hydrovoltaic generators can overcome the environmental restrictions via thermal energy (from nature or the body of the device wearer), they can provide continuous and long-term electric power. As a novel green environmental energy harvesting technology, current research is focused on how to improve the power generation performance by treating nanomaterials.88
3. Biosensor mechanism
In 1962, Clark et al.89 developed a hypothesis for combining biomolecules and sensors that allowed specific detection for molecules in human bodies, and according to this hypothesis, biochemical sensors have become one of the most important areas of research in modern biotechnology. Compared with the wearable biophysical sensors that only monitor physical activities via the mechanism of nanogenerators, biochemical sensors are generally used for specific detection of biomarkers by modifying the electrodes. Enzymes, antibodies or ion-selective membranes can therefore be fixed to the electrodes to allow continuous monitoring of biomarker levels in liquids based on the output signal. Currently, the main self-powered wearable biomarker sensors include electrochemical and chemical-based enzymatic amperometric sensors, ion-selective electrode sensors, voltammetric sensors and electrophotometric colorimetric sensors based on optoelectronics.3.1 Enzymatic amperometric sensors
Metabolites in biological fluids are great indices of health status. For instance, glucose is often used as a non-invasive predictor of diabetes in sweat, saliva, and tears, lactate can be used to detect hypoxia or liver disease, and urea can be used to detect kidney disease.90–92 The metabolite specific enzymes need to be immobilised to the electrode (generally Ag/AgCl electrode93) by entrapment, covalent cross-linking or bonding94 methods and the strength of the fixation directly affects the stability of the electrode and its output, and the immobilised enzyme drives electron transfer within the system through the redox reaction. Therefore, the selectivity of the enzyme allows the sensor to specifically detect the substrate, and based on the various concentrations of the substrate, the amount of biochemical reaction produced or consumed can be converted into a readable electrical signal by an electrochemical device to analyse the concentration. In addition, as H2O2 is one of the products of enzymatic reactions, it is also possible to measure the concentration of H2O2 to calculate the metabolite content, as well as measuring the quantity of charge in the system to quantify the metabolites in the detection solution.Currently, enzymatic amperometric biosensors are widely used in medical diagnostics,95 environmental monitoring96 and food analysis.97 For instance, they are widely used in the design of the e-tongue system due to the high selectivity and high signal-to-noise ratio caused by oxidase modified electrodes.98
3.2 Ion-selective electrode sensors
The first ion selective membrane (ISM) was reported by Ross and Frant in the 1960s, to research iron activities by measuring potential.99,100 The reason for the selectivity is that the diffusion and migration of ions in the nanochannels of selective membranes and the movement of ions depend on the ion size, functional groups, interactions, etc.101 These membranes are simple, cheap and widely used. ISMs can be classified into natural and synthetic ion carriers and ion chelates based on their chemical properties. The majority of ISMs' supporting material is made of polyvinyl chloride because of its chemical inertness to avoid interference of electrolyte ions and stability of their concentration fluctuations.99 After modifying the base electrode by ISM, the ion-selective electrode sensors will perform selectively, allowing specific ions to pass through and generating electrical potential. The magnitude of the output depends on the concentration of target ions in the solution, which will illustrate the signal that can be read and analyzed.Although this type of chemical-based sensor has a really simple structure and selectivity in the analysis of complex samples (i.e., whole blood) for trace analytes is still a challenge,99 it has been used in a variety of chemical wearable sensors, for instance, to detect the concentration of Na+ and K+ in sweat to determine the sport status of athletes,102 and the ionophores used for ISE sensors are monensin103 and valinomycin,93 respectively.
3.3 Voltammetric sensors
Voltammetry is a common detection technique used in analytical chemistry and is active in the field of electrochemical detection as a general method. The principle of voltametric detection is to record the current with applied potential variance to observe the reaction at the electrode, and the measured current can be directly related to the concentration of the analyte in reversible reactions,104 and for irreversible reactions, linear sweep voltammetry shows oxidation or reduction of the analytes by the peak current, and the height of the limiting current illustrates the concentration of the analytes. Furthermore, due to the recorded current before potential change, differential pulse voltammetry can minimise the background charging current and achieve high sensitivity, as well as the square wave voltametric method, which measures the forward and reverse current respectively.The major application of voltammetric sensors is to continuously monitor the heavy metals of human sweat.39,105 However, the redox reactions of different molecules in the solution may produced similar redox potentials, resulting in measurement errors and limited detectable substrates.
4. Recent progress in self-powered biosensors
Due to the rapid development of medical instruments and the increasing requirement for improving health standards in recent years, miniature devices are currently the focus of researchers. The self-powered technology of nano-generators can replace the traditional battery to provide safe energy and make the equipment more portable. Therefore, using self-powered devices as energy units or sensors to detect changes in biomarkers directly has become the focus of biological detection.4.1 Power source for biomedical systems
PENGs showed the ability to convert mechanical energy to electricity by muscle motion in 2009,106 and in 2014, TENGs were first used to power a medical device in vivo.107 As both nanogenerators generate electricity by mechanical deformation, more and more researchers are currently applying them to the detection of physical markers such as gait and blood pressure, in which energy is harvested from movement and organs are monitored by them. And nanogenerators which harvest energy (PyNGs, solar cells, etc.) have long been used as power sources. Aiming to improve the efficiency of electrical conversion, some researchers designed or encapsulated nanogenerators with hydrophobic materials to make them less susceptible to humidity, or integrated nanogenerators which have a different mechanism.108 Subsequently, different sensors can be connected in the circuit to detect biomarkers according to requirements.1094.2 Active sensing
According to the working principle of nanogenerators, some of them have the capability to monitor biophysics markers;28,110,111 however, aiming to monitor biochemical markers, it requires modification of the electrode. For instance, metabolites can be detected by modifying enzymes on the electrode surface, and then the concentration of the substrate can be measured by the current generated by the redox reaction. And the principle of self-powered biosensors is shown in Fig. 3A. In Fig. 3B, we summarised the development timeline in biosensors. In 2001, Katz et al.112 proposed two enzyme-based biosensors, and substrate specific detection can be performed by modifying different enzymes to the electrode surface. The first use of solar cells in biosensors was in 2007 to detect glucose by using multiwalled carbon nanotubes to improve sensitivities.113 Subsequently with the development of metal oxides, ZnO nanowires have been widely used in nanogenerators; TENGs,114 PENGs,115 PyNGs40 and HCEHGs116 were gradually applied to biomarker sensing.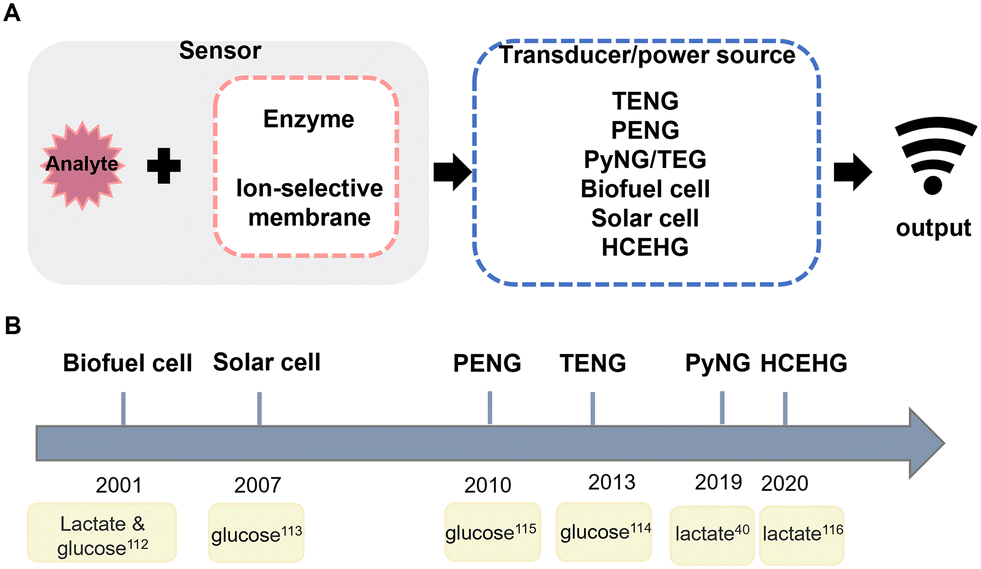 | ||
| Fig. 3 (A) Schematic representation of self-powered biosensors. (B) Development timeline of self-powered biomarker sensors. | ||
5. Applications of self-powered biosensors
To achieve reliable and wearable biochemical sensors, innovation in materials and the development of sensitive and accurate biosensing which can provide information are essential, and the table below shows the recent self-powered sensors for biomarker detection. In this section, the sensors will be introduced according to the table (Table 1).| Tested fluids | Monitoring components | Power source | Main materials | Size | Performance | Ref. |
|---|---|---|---|---|---|---|
| Sweat | Na+/K+ | TENG & EMG | PTFE, nylon | 3 × 3 cm2 | V oc = 60 V, Isc = 15 mA | 102 |
| PENG | PET | 4 × 8 cm2 | V oc = 95 V | 117 | ||
| TENG | PDMS, PANI | 2.8 × 3.4 cm2 | 5.275 nA (85 mM Na+), 6.849 nA (50 mM K+) | 118 | ||
| Ca2+ | TENG | PANI, PDMS, Cu | 2 × 5 cm2 | Response is up to 40.15% (0.22 g l−1) | 119 | |
| Glucose | Photoelectrochemical | MWNT/PDMS | 1.0 × 0.9 cm2 | Detection limit is 22.2 pM | 120 | |
| PENG | ZnO | 1.4 × 1.5 cm2 | Detection limit ∼0.02 mM, resolution is 0.02 mM | 121 | ||
| Biofuel cell | PtNPs@NPG | 5 × 3 × 1.2 mm3 | 62.33 mV m−1 | 122 | ||
| Biofuel cell | PEDOT:PSS, PET | 2 × 3 cm2 | Sensitivity is 2.35 nA μM−1 (0–200 μM) | 93 | ||
| Lactate | TENG | PDMS and gelatin covered PET/Al | 7 × 8 cm2 | V max and J is 500 V and 14 mA m−2, responses is 0.8 to 10.2 μA (10 μM to 10 mM) | 109 | |
| Biofuel cell | PEDOT:PSS, PET | 2 × 3 cm2 | Sensitivity is 220 nA μM−1 (0–30 μM) | 93 | ||
| Hydrovoltaic effect | ZnO | 78.5 cm2, thickness 0.5 mm | V out without lactate is 0.11 V | 116 | ||
| PyNG | Carbon film, PDMS | 5 × 5 cm2 | Responses of lactate is 9.71% (1 mM) | 40 | ||
| PENG | ZnO | 1.4 × 1.5 cm2 | Detection limit ∼0.10 mM, resolution is 0.01 ± 0.05 mM | 121 | ||
| Urea | PENG | ZnO | 1.4 × 1.5 cm2 | Detection limit ∼0.50 mM, resolution is 0.5 ± 0.2 mM | 121 | |
| Uric acid | PENG | ZnO | 1.4 × 1.5 cm2 | Detection limit ∼0.01 mM, resolution is 0.01 ± 0.005 mM | 121 | |
| Biofuel cell | PI, PET | 4 × 3 cm2 | Detection limit is 0.74 μM, sensitivity is 3.50 μA μM−1 cm−2 | 123 | ||
| Tyrosine | Biofuel cell | PI, PET | 4 × 3 cm2 | Detection limit is 3.6 μM and sensitivity is 0.61 μA μM−1 cm−2 | 123 | |
| Saliva | Glucose | Biofuel cell | NDI-T2 copolymer | — | Detection range of six orders of magnitude | 94 |
| Biofuel cell | PEM treated with PEDOT:PSS | Macro-sized | J max is 10.5 μA cm−2 and power density is 1.1 μW cm−2 (19.4 mg dl−1) | 124 | ||
| Urine | Glucose | Biofuel cell | Porous carbon | 10 × 10 mm2 | V oc of the six BFC array in series is 3.2 V | 125 |
| Biofuel cell | Porous carbon | 1.3 × 2.5 cm2 | Sensitivity is 0.0071 mW cm−2 (mmol dm−3) the errormax is ±3.7% at 10 mmol dm−3 | 42 | ||
| Biofuel cell | PET, carbon nanotubes, Ag | 6 × 5 cm2 | 220 μW cm−2 (5 mM) | 126 | ||
| Cysteine | PENG | BaTiO3 | 0.5 × 1 cm2 | Detection limit ∼10 μM | 127 | |
| Bilirubin | Hydrovoltaic effect | ZnO | 20 × 30 mm2 | V out is 0.0361 V with 0.0% response at 8.0 mg l−1 bilirubin | 128 | |
| Tears | Glucose | Biofuel cell | Pt/Ir | 25 × 30 mm2 | Detection limit is 0.62 ± 0.03 μM and 0.38 ± 0.13 μM for the amperometric and coulometric designs | 129 |
| Solar cell | PEDOT:PSS | — | Detection result is 0.74 ± 0.03 mM, increasing to 0.97 ± 0.05 mM after breakfast | 38 | ||
| Biofuel cell | PtNW, CNT | 4.37 cm2 | P max is 4.4 μW cm−2 (0.05 mM) | 43 | ||
| Ca2+ | Solar cell | PEDOT:PSS | — | Detection result is 1.15 ± 0.01 mM, decreasing to 0.98 ± 0.01 mM after breakfast | 38 | |
| Extracellular fluids | Glucose | Biofuel cell | MWCNTs, Ag/AgCl | 0.04 cm2 | Sensitivity is 37.66 Hz mM−1 cm−2 and a linear range of 1 to 20 mM | 130 |
| Biofuel cell | FcMe2-LPEI | — | Detection limit is 0.48 mM and average OCP is 0.81 ± 0.021 V | 131 | ||
| Biofuel cell | CNT | — | V oc and power density is 302.1 mV and 15.98 μW cm−2 at 166.3 mV (5 mM) | 132 | ||
| PENG | GOx@ZnO | 0.6 × 0.6 cm2 | Detection range in blood is 0.86–2.33 g l−1 | 133 | ||
| PENG | GOx@ZnO | 0.4 × 1.3 cm2 | 0.49 V without glucose | 134 | ||
| Biofuel cell | GDH/MG/SWNT | 2.5 × 2 cm2 | V oc = 0.78 V, maximum power density is 48 μW cm−2 at 0.40 V | 135 | ||
| Ascorbic acid | Biofuel cell | MWCNTs | — | Detection limit is 400 μM, sensitivity is 5.9 mA M−1 | 136 | |
| Fructose | Biofuel cell | KB/PVDF, KB/PTFE | — | P max is 26.5 μW at 0.34 V | 137 | |
| Acetylcholine | Biofuel cell | AChE/hPG/Pt | — | Detection limit is 10 μM and Pmax is 4 nW at 260 mV (10 mM) | 138 | |
| Urea/uric acid | PENG | ZnO | 5 sensor units and each is 5 × 5 mm2 | Response in 80 mM urea and 0.6 mM uric acid is 587.3% and 122% | 44 | |
| O2 | TENG | PEDOT:PSS | 1.5 cm2 | 74.3 V and 17.9 μA with 100% tensile strain | 139 | |
| TENG | PDMS, Au | 1 × 1 cm2 | V oc = 75.3 V, I = 7.4 μA, and P = 0.2 mW cm−2 | 140 | ||
| Biofuel cell | GDH/MG/SWNT | 2.5 × 2 cm2 | V oc = 0.78 V, maximum power density is 48 μW cm−2 at 0.40 V | 135 | ||
| Cholesterol | Biofuel cell | PB, PTZ | — | Detection limit is 3.7 ± 0.2 μM and sensitivity is 26.0 mA M−1 cm−2 | 141 | |
| Ethanol | Biofuel cell | ADH/PVP-C6-TB/graphite, AOx/HRP/PBSE/MWCNT-SPGE | — | Linear behavior from 0.1 to 1.0 mM ethanol | 142 | |
| C-reactive protein (CRP) | PENG | GaN | 6 × 6 cm2 | V oc in pure water is 86.32 mV, sensitivity limit is 0.030 mg mL−1 | 143 | |
| CCRF-CEM | Biofuel cell | G/CNT/Au NPs | — | Detection limit is 3 cells | 144 | |
| MCF-7 | Biofuel cell | G/CNT/Au NPs | — | Detection limit is 2 cells | 144 | |
| Molecules in exhaled gas | Ethanol | TENG | PANI/PTFE/PANI | 5 × 4 × 2 cm3 | Detection limit is 30 ppm, response is 66.8% at 210 ppm | 145 |
| PENG | PANI/PVDF | 5 × 5 cm2 | Output current is 8–12 nA without alcohol | 146 | ||
| HENG | TiO2 | — | Detection limit is 50 ppm, Pmax = 0.7 μW cm−2 | 147 | ||
| NH3 | TENG | Ce-doped ZnO-PANI | 6 × 4 × 2 cm3 | Linearity and sensitivity is 0.9928 and 13.66 ppm−1 (0.1 to 1 ppm) | 148 | |
| TENG | Ce-doped ZnO, PDMS | 3 × 3 cm2 | Sensitivity is 20.13 ppm−1 (0.1–1 ppm) | 45 | ||
| TENG | PANI, PI | 1.5 × 1.5 × 0.1 mm3 | Responsivity is 147% (100 ppm) | 149 | ||
| CO2 | TENG | FEP, PEI | — | Error is ±2.43% and ±3.30% for upper and lower electrodes respectively | 150 | |
| NO2 | TENG | WO3/copper-coated acrylic | 4 × 4 cm2 | 452.44% sensitivity (50 ppm) and 20 times higher selectivity than other gases | 151 | |
| TENG | PANI, PI | 1.5 × 1.5 × 0.1 mm3 | Responsivity is 87% (0.5 ppm) | 149 | ||
| Acetone | TENG | PEI@SnO2 | — | Sensitivity and responsivity is 1.8575% ppm−1 and 16.26% (10 ppm) | 152 | |
| TENG | Na-doped ZnO, PVDF | 2.0 × 2.4 cm2 | Detection limit is 0.2 ppm and the gas response is 1.03 | 22 | ||
| Formaldehyde | TENG | MXene/NH2-MWCNTs | 5 × 2 × 1 cm3 | P = 27 μW and Voc = 136 V, response is 35% at 5 ppm | 153 | |
| TENG | bpy-PMA, PTZ/Ag NPs, PDMS | — | Responsivity is 38.5% | 154 |
5.1 Sweat monitoring
Sweat is as loaded with useful information as blood, and the chemical markers in it are more suitable for health monitoring than saliva or tears.155 In contrast to blood tests whose data can only be obtained at one point in time in a single test, sweat tests are not only non-invasive, but also provide continuous access to biomarker data over time. Due to the abundance of biomarkers in sweat and non-invasive detection, it has very important early warning and guiding significance in the monitoring of physical health during strenuous exercise. Sweat is a suitable biofluid for many clinical applications, for instance, the Na+ level in sweat monitors the electrolyte status of the athlete's body,156 the Ca2+ level in sweat monitors the risk of hypocalcaemia,157 the glucose level monitors diabetes,120 the lactate level monitors the hypoxia of tissues,109etc. Furthermore, sweat can also be used as an assessment criterion for autonomic neuropathy, as elevated body temperature can also be lost through the synergistic action of the hypothalamus and peripheral temperature receptors.158 The common disease monitors and principles used in sweat are shown in Table 2,159 where IL is interleukin, TNF is tumor necrosis factor, and TGF is transforming growth factor.| Type | Chemical component | Disease | Principle |
|---|---|---|---|
| Electrolyte | Na+ | Sports water loss, hyponatremia and hypoxia160 | Na+ is the electrolyte lost in the greatest quantities and has the greatest impact on hydration161 |
| Cl− | Cystic fibrosis | The chloride channels of the sweat gland epithelium are blocked and therefore cannot penetrate the skin162 | |
| K+ | Sports water loss | Ion transporter proteins maintain the N+/K+ balance161 | |
| Ca2+ | Myeloma, acid–base balance disorder, cirrhosis, renal failure, and normocalciuric hyperparathyroidism | Free Ca2+ correlates with body fluid pH and is used to evaluate kidney stone-forming salts, etc.163 | |
| Metabolite | Glucose | Diabetes | Islet dysfunction causes impaired glucose metabolism, and the glucose level in sweat is directly related to the glucose level in blood92 |
| Lactate | Ischemia | Lactate is the product of anaerobic cellular respiration90 | |
| Urea | Kidney disease | In kidney disease the kidney may lose its function of filtering urea when the body metabolises waste, and the concentration of urea in sweat is higher than in plasma164 |
Therefore, researchers suggest that sweat as a biomarker can provide non-invasive and continuous information about users' health and provide a powerful basis for disease diagnosis, drug abuse detection, etc.165 And with the development of wearable flexible and stretchable electronic devices, these allow doctors to monitor patients' exercise performance remotely, as opposed to heavy laboratory instruments. In addition to thermoelectric generators,166,167 biofuel cells77,78 and solar cells,168 which may be environmentally influenced in their efficiency or have uncontrollable capacity, scientists now propose to convert the mechanical energy of the human body into electrical energy for use in wearable devices. This section will introduce the application of self-powered sensors for sweat monitoring.
For nanogenerator-based sensors, the commonly used method for the specific detection of electrolytes in sweat is to modify the electrode of the sensor with an ion-selective membrane, and there is extensive interest which focuses on the use of nanogenerators as the power source to miniaturised sensors. For instance, Gai et al.102 reported a TENG driven self-powered wearable sweat analysis system consisting of a hybrid nanogenerator (containing a TENG with an electromagnetic generator, HNGM), a low-power integrated circuit board for energy management and a flexible sweat sensor (Na ion selective electrodes using a poly(3,4-ethylenedioxythiophene) polystyrene sulfonate layer and a Na ionophore X containing membrane, K ion selective membranes using valinomycin modified), as shown in Fig. 4A(i). By vibrating the magnet up and down, the nylon film rubs against the PTFE, generating an open-circuit voltage (Voc) and short-circuit current (Isc) about 60 V and 15 mA, respectively. However, considering that the released energy from human movement is often accompanied by a lot of joint movement which causes a watery environment, and TENGs will be hampered by the water shielding effect,169,170 Li et al.117 suggested using PENGs fixed on joints to convert mechanical energy into electrical energy to power sweat sensors with ion selective membranes on the electrodes (Na ion selective electrodes using a Na ionophore X containing membrane, K ion selective membranes using valinomycin modified, H+ sensitivity through a HAuCl4+ layer and a polyaniline layer modified electrode), the actual set up is shown in Fig. 4B(i), and in environment stimulated sweat, the output of PENGs is stable at 95 V. In 2020, Song et al.171 proposed a TENG powered sensor which allows continuous biosensing, with a power output up to 416 mW m−2. And compared with conventional TENGs, this system can reliably and efficiently harvest energy during vigorous exercises because of its flexible printed circuit board.
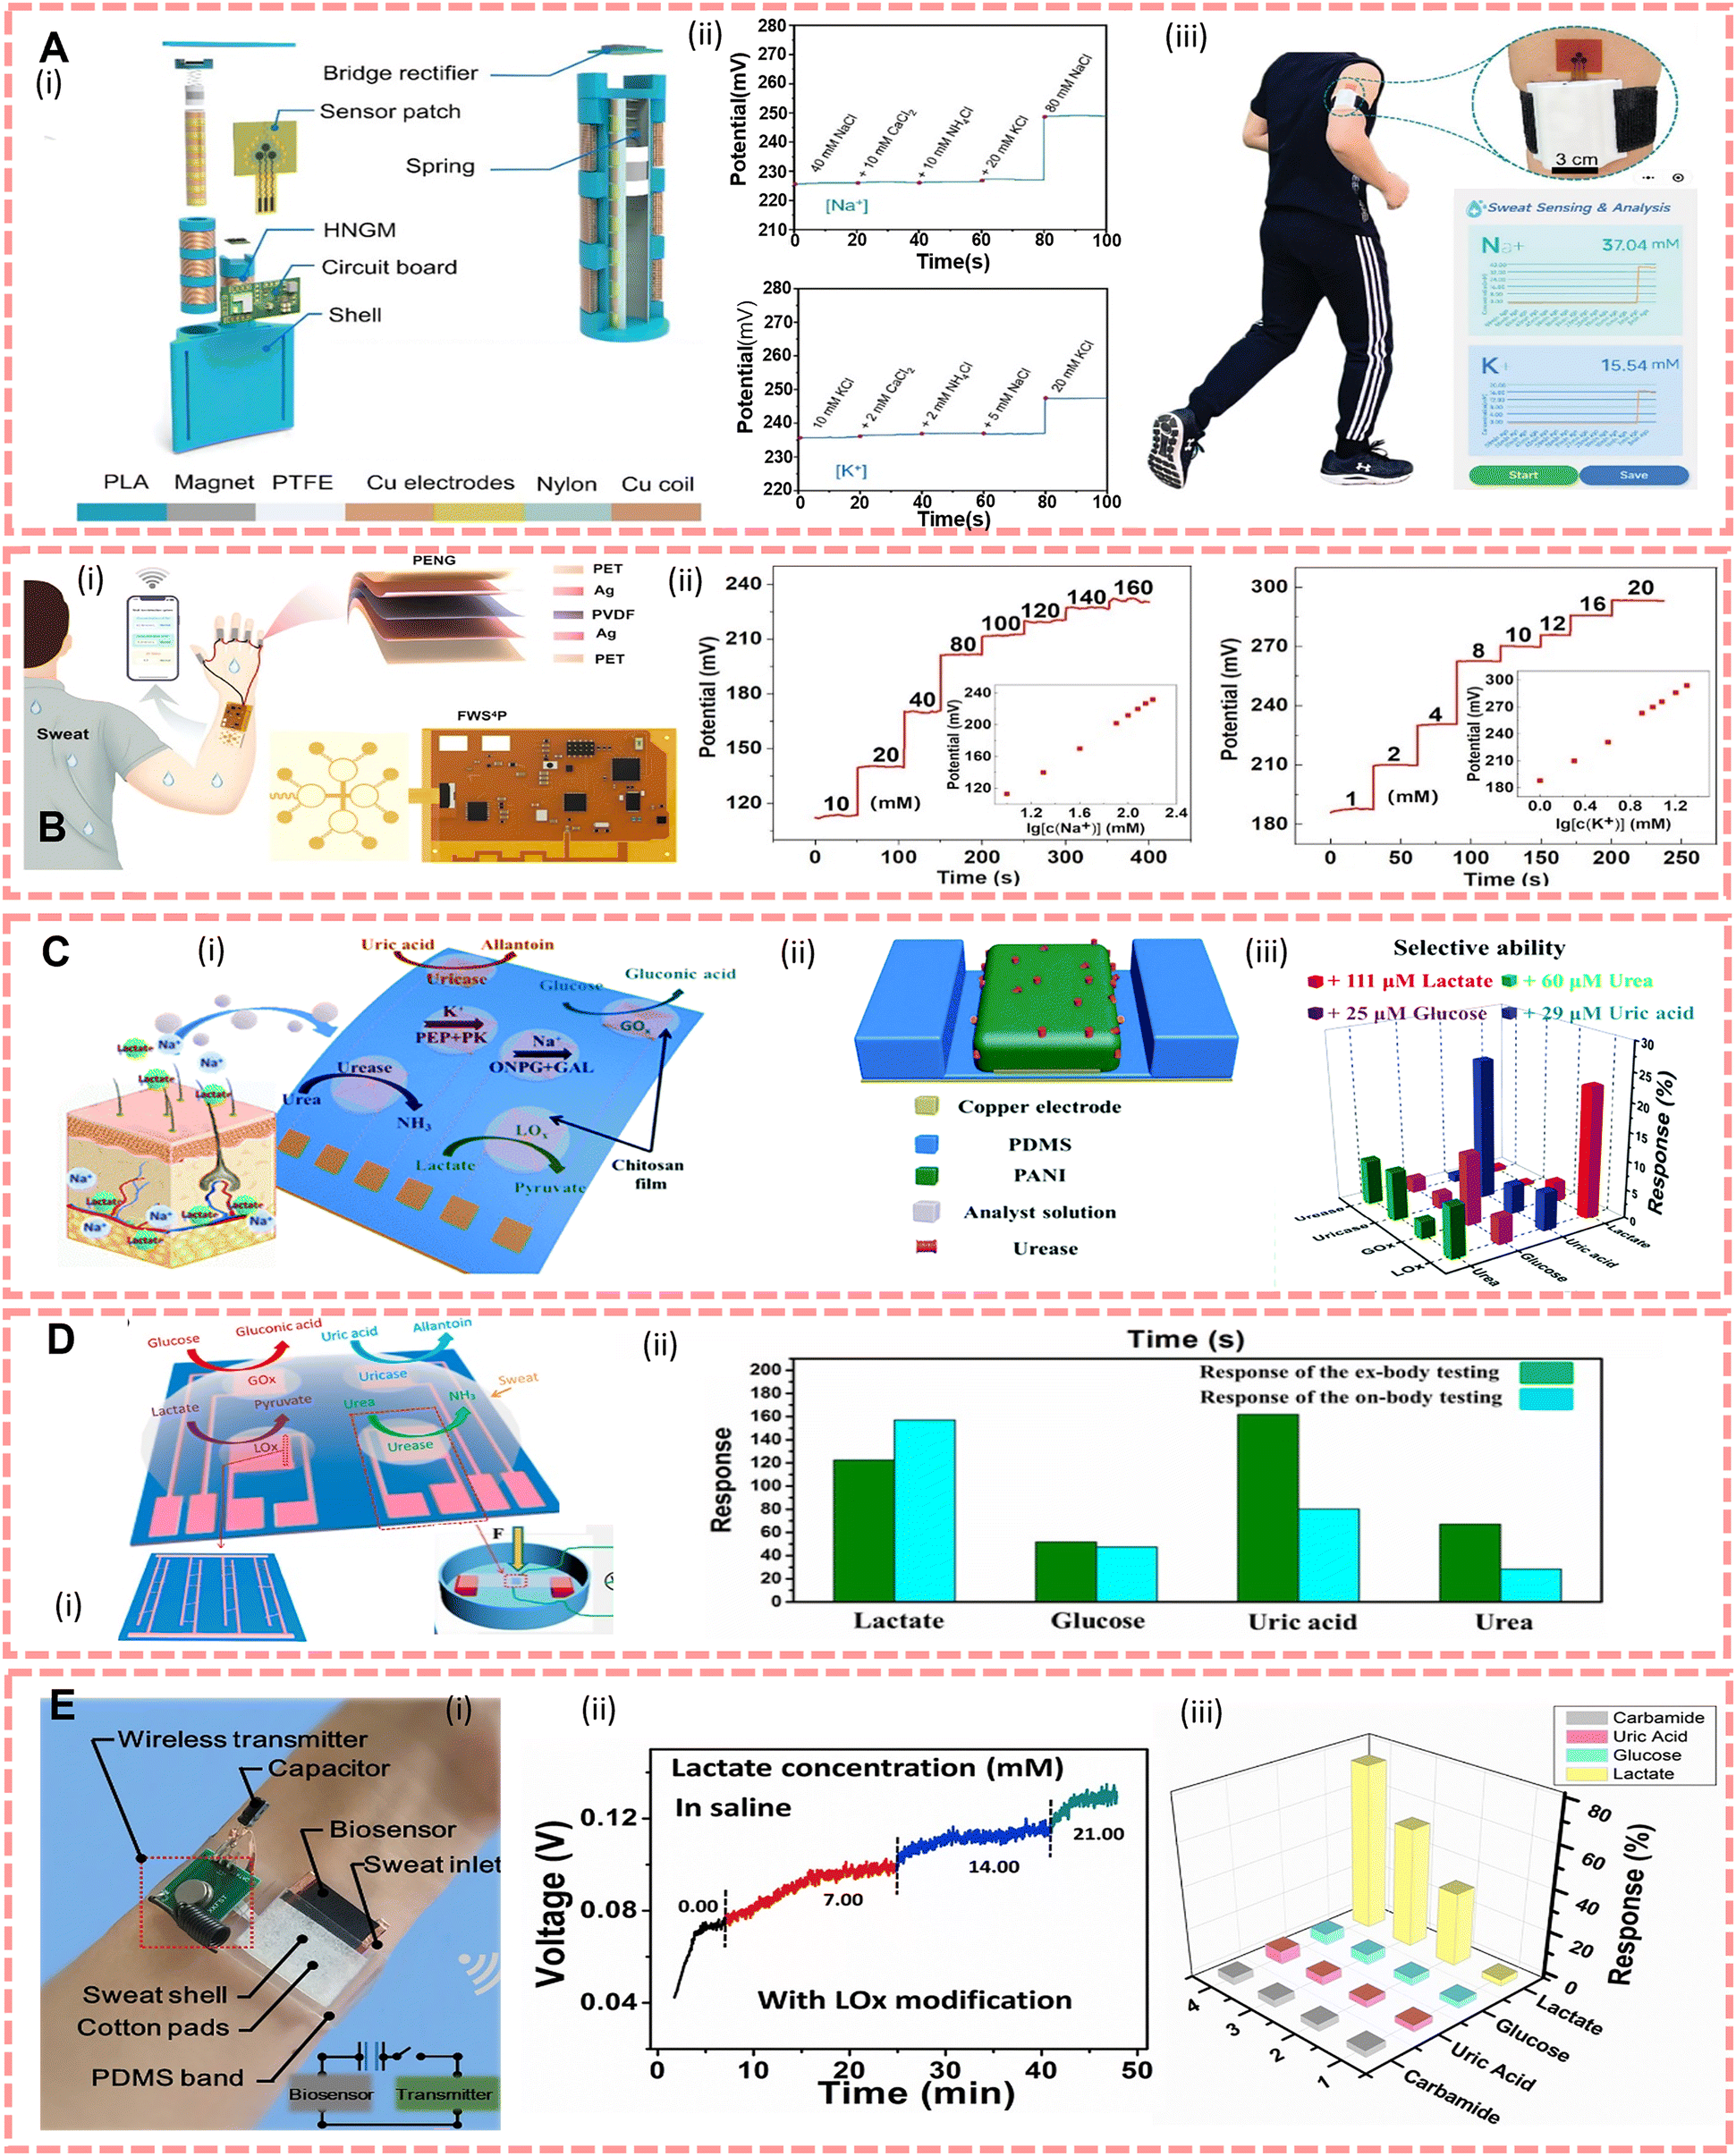 | ||
| Fig. 4 (A)(i) Structural design of a generator. (ii) Selective evaluation of Na+ sensors and K+ sensors. (iii) Actual demonstration set-up. Reproduced from ref. 102 with permission from John Wiley and Sons, copyright 2022. (B)(i) Finger-joint PENG and sweat sensor set up, and diagram of the PENG structure and wearable sensor patch. (ii) Open circuit potential of a Na sensor and K sensor in different concentrations. Reproduced from ref. 117 with permission from Elsevier, copyright 2022. (C)(i) The design of an e-skin. (ii) The structure of a sensor unit. (iii) e-skin's sensitivity to lactate, glucose, urea and uric acid. Reproduced from ref. 118 with permission from The Royal Society of Chemistry, copyright 2018. (D)(i) Design of an e-skin. (ii) The comparison of the response between on-body and ex-body testing. Reproduced from ref. 121 with permission from the American Chemical Society, copyright 2017. (E)(i) The actual demonstration of the system set up. (ii) The output voltage in different lactate concentrations. (iii) The response of the biosensor to different organics (simulated sweat saline). Reproduced from ref. 40 with permission from Elsevier, copyright 2019. | ||
To achieve specific analysis of metabolites such as glucose, lactate and urea, scientists generally use specific enzyme modified electrodes.109,120 In 2016, Gao et al.93designed a wearable flexible device which can simultaneously analyze Na+, K+, glucose and lactate in situ, and wirelessly transmit the data to a smartphone by Bluetooth. Guan et al.40 reported a wearable device and its structure as shown in Fig. 4E(i), which is made of a porous carbon film and modified with lactate oxidase. It can be powered by environment heat generated via sweat evaporation, and the output signal depends on the lactate content in sweat. In addition, biofuel cells are also an effective means of tracking metabolites. The construction of systems for the detection of biofuel cells usually requires enzymes as the cathode and anode catalysts.132 As conventional biofuel cells have limited output and limited constant power due to varying levels of markers in sweat, biofuel-based sensors have incorporated supercapacitors (SCs), and Yu et al.172 have reported an e-skin based on these that can be fully sweat-driven and stable, allowing long-term monitoring and analysis of metabolites in sweat (urea, NH4+, glucose and pH). Furthermore, to improve the capacitance and electrochemical stability, Lv et al.173 proposed a textile sensor with a SC made of MnO2/carbon nanotubes, and the maximum power density was 252 μW cm−2 at 0.28 V. To integrate different materials and layer accuracy, Yang et al.123 reported a wearable sweat sensor entirely engraved with a laser. It consists of a chemical sensor and a multiplexed physical sensor, so that it has capability to simultaneously monitor respiration, temperature, and low concentrations of tyrosine and uric acid in sweat.
Based on various flexible sensors, the concept of electronic skins (e-skins) has now been proposed to mimic skin functions or to monitor various markers. One of the advantages of the e-skin is its ability to extract complex information from sweat through an integrated multiplexed biosensor array.93Fig. 4C shows that the e-skin can detect four metabolites and two ions118 and Fig. 4D shows that Han et al.121 proposed an e-skin based on enzyme/ZnO nanoarrays for the analysis of components in sweat by modifying lactate oxidase, glucose oxidase, uricase, and urease in its piezoelectric sensing unit, where the piezoelectric output depends on the enzymatic reaction.
In addition to methods for converting mechanical, thermal, chemical and optical energy into electrical energy, devices based on the hydrovoltaic effect also have potential applications in the construction of big data on sports. Based on this effect, Zhang et al.116 developed a lactate sensor that supplies power via sweat flow. This device was made of flexible polydimethylsiloxane and ZnO nanowire arrays which modified lactate oxidase. The device demonstrates the feasibility of this biosensing behaviour through the coupling of the hydrovoltaic effect and the enzymatic reaction, and the output voltage is influenced by sweat flow, lactate content, humidity and temperature.
The primary problem of sweat sensors is the difficulty of guaranteeing sample quality. Currently, the sensor requires a high volume of sweat to be detected and thus cannot effectively detect people with less or no sweat or at rest. Secondly, interference from contaminants on the skin surface and in the environment also affects the accuracy of detection. Thirdly, because sweat is not secreted continuously over long periods of time, it is difficult to detect biomarkers in sweat continuously as in interstitial fluids. Currently, to address the issue of the sweat rate, researchers have induced sweat with iontophoresis or drugs, but this can cause potential injury to the patient. Therefore, one of the research directions for sweat sensors is how to make the sensor sensitive to the sample to remove contamination interference, while using only trace amounts of the liquid to be measured.
5.2 Saliva monitoring
Saliva is a complex oral fluid which plays an important role in early diagnosis and prevention of disease. It is produced by the parotid gland and contains enzymes, hormones, proteins, and antibodies as serum.174 The potential of saliva as a diagnostic tool is still being explored and the analysis of saliva is usually focused on metabolites, enzymes, proteins and various antibodies compared to sweat.175 Furthermore, there are obvious challenges in the use of saliva for biomarker detection compared with blood and sweat. The reason for this is that samples of saliva are more variable and heterogeneous with lower levels of biomarkers and amounts of protein hydrolases that can lead to sample contamination.176 Therefore, a high sensitivity is required for the detection of saliva, the common laboratory methods are electrophoretic immunoassay, ELISA etc. The diseases that can be screened using saliva as a diagnostic fluid via biomarkers are shown in Table 3.175| Disease | Chemical component | Principle |
|---|---|---|
| Cystic fibrosis | Cl− | As ref. 162 mentioned above |
| Sjogren's syndrome | IL-4, IL-5, FGF-4, clusterin, pappalysin-1, CRP, apolipoprotein A-II177 | Chronic autoimmune disease with increased levels of antibodies and cytokines due to salivary and lacrimal gland dysfunction178 |
| Cardiovascular diseases | CRP, cardiac troponin | Released in response to cardiac cell necrosis and related to the level in blood179 |
| Diabetes | 65 proteins that show higher levels in patients with type-2 diabetes180 | |
| Periodontitis | MMP-8, IL-4 | Their presence positively correlates with the development of inflammation175 |
The current identification of salivary biomarkers is based on colorimetric and electrochemical detection.181 The problem is that the colorimetric method requires the sample to be collected and submitted to the instrument for detection, and therefore it cannot be continuously monitored, while the electrochemical sensor supporting in situ detection, however, requires power support. The main transmission methods for oral wearable devices are currently radio frequency identification and Bluetooth whose signals are easily blocked by human bodies.39
To overcome the difficulties of power supply, researchers are continuously exploring the potential of self-powered instruments for saliva detection. Mohammadifar et al.124 invented a disposable hydrophilic paper-based microbial fuel cell in 2017, which achieves efficient electron transfer from bacteria by increasing the conductivity of the anode through conductive poly(3,4-ethylenedioxythiophene):polystyrene sulfonate (PEDOT:PSS) treatment, allowing the device to be driven by saliva, overcoming the disadvantages of the paper-based fuel cell's low performance and the potential unavailability of activation fluids. Its output was proportional to the concentration of glucose in the saliva and the recorded power and current density were 1.1 μW cm−2 and 10.5 μA cm−2 from diabetes patients' saliva (19.4 mg dl−1 glucose), respectively. In 2020, Ohayon et al.94 proposed a hydrophilic n-type organic semiconductor that improved the output of biofuel cells by a polymer film consisting of alternating naphthalene dicarboxamide (NDI) acceptor and bithiophene (T2) donor subunits that improved the energy level misalignment between the enzyme and the conducting material, and it improved the stability of the enzyme on the electrode with its exposed glycol side chain coupled to GOx. The device shows higher sensitivity to high glucose levels (micromolar to millimolar range) when the gate voltage is higher than or equal to the source–drain voltage and can detect differences in glucose levels in the saliva of diabetic patients compared to healthy volunteers. Jansod et al.182 designed an absorbance-based colourimetric sensor array via using ion-selective electrodes (ISEs) as a self-powered source, which visualises pH changes by generating colour changes through membrane potential changes to directly display ion changes from the sample. In addition, to improve the user facilitation, in 2018 Li183 filed a patent application that invented a multi-chamber toothbrush based on the piezoelectric effect, which enables saliva detection by storing the saliva detection device in the chamber, and he also proposed a denture saliva sensor with an approximate structure.
In addition to self-powered sensors, many saliva sensors are currently detecting saliva with powered-free devices (e.g., test strips), and the detection methods are usually expensive such as spectrophotometric methods and protein immunological methods such as ELISA,184 therefore self-powered electrochemical biosensors with low detection costs have great potential for saliva detection. The challenge is that saliva contains proteolytic enzymes that tend to significantly reduce the amount of biomarkers, therefore reducing the interference of complex content to achieve trace detection is a problem that needs to be addressed in the development of saliva sensors. Furthermore, the concentration of biomarkers is significantly affected by participants' daily activities, such as gargling and last meal.
5.3 Urine monitoring
Urine is a complex exocrine fluid that includes various cellular metabolites, and is often considered like the place and method of disposing of waste from blood. However, due to this characteristic, the concentration of metabolites contained in urine can be directly considered to be blood related. Blood tends to remain stable due to the regulatory effects of homeostasis, while urine lacks a similar mechanism. Therefore, biomarkers in urine can better reflect small changes in the body during the early stages of disease. Moreover, urine serves as a valuable resource for collecting larger volumes of fluid, enabling more extensive testing capabilities, which is the reason why urine is much easier and simple to characterise change in low abundance protein.185 Compared to plasma, it can be collected continuously and completely without injury or pain and stimulating secretions like tears and sweat is not required. In addition, the biomarkers in urine not only illustrate the overall health of the body through the metabolic waste in blood, but also reflect various kidney diseases, as the formation of urine requires filtration by the glomerulus and the wall of the renal capsule, and then reabsorption by the renal tubules. Currently, the biomarkers in urine sensors used to diagnose and monitor a variety of diseases and health conditions include electrolytes used to assess hydration status, creatinine, blood urea nitrogen and uric acid used to assess kidney disease,186 such as chronic kidney disease and acute kidney injury,187 and biomarkers such as prostate specific antigen can be used to screen prostate cancer.188 Furthermore, the most valuable biomarker of urine monitoring is glucose which is directly related to the detection and prediction of diabetes.Diabetes is a chronic disease caused by insufficient insulin secretion or ineffective response to insulin.189 In 2005, the Global Guidelines for Type 2 Diabetes from the International Diabetes Federation Diagnosis reported that about 30% to 90% type 2 diabetes patients suffered undiagnosed because of differences in the medical treatment level between countries.190 The other reasons why it is difficult to diagnose are the onset of diabetes is very long and as the commonly used test requires fasting before blood glucose measurements, the results are also subject to error. The golden standard of diabetes is known as the oral glucose tolerance test; although it shows high sensitivity, it is invasive and expensive with weak reproducibility,191 and repeated invasive diagnoses will make patients suffer from additional physical and financial burden. Therefore, the development of non-invasive sensors with higher repeatability, high sensitivity and lower cost is important. Hence self-powered small biochemical sensors have great potential for application in the field of specific detection of biomarkers in urine and disease tracking.
In 2019, Shitanda et al.125 reported a paper-based glucose biofuel cell manufactured by screen printing, whose structure is shown in Fig. 5B(i). This device is a disc-like array of six electrodes printed in series with porous carbon ink. The biofuel cells are connected to the fuel cell electrodes by printed silver wires after increasing the electrode conductivity through repeated printing 5 times, followed by a waterproofing process, and then treatment of the anode with glucose oxidase (GOx) and tetrathiafulvalene (TTF), and the cathode treated with bilirubin oxidase (BOD) and MgO-templated carbon immobilises the enzyme to improve the catalytic current density. The performance of a single glucose biofuel cell was evaluated in 100 mM glucose and at pH = 7.0, the electromotive force was 0.57 V, and the maximum current density was 0.47 mA cm−2, and the paper based disc-like biofuel cell array had an open circuit voltage of 3.2 V and the maximum output was 0.6 mW when the voltage reached 2.3 V. However, although urine is produced in greater quantities and is easier to collect than tears, sweat and saliva, the uneven distribution of urine needs to be taken into account when the fuel cell is loaded on a nappy, since the drive of the fuel cell is linearly related to the glucose concentration in the solution, an unevenly distributed solution can easily lead to diagnostic error of measurements. Therefore, Shitanda et al.42 attempted to create a new self-powered nappy biosensor to fulfil the need for a small amount of urine actuation in 2021 as shown in Fig. 5C. The new biofuel cell consists of a bioanode immobilized with azure A and flavin–adenine-dinucleotide-dependent glucose dehydrogenase (FAD-GDH) by covalent bonding on porous carbon and a biocathode modified with BOD.42 Compared with the biofuel cell whose anode is immobilised with GOx and TTF on MgO-templated carbon, the newly designed biofuel cell illustrates smaller power density but higher stability, and the sensitivity is 0.0071 ± 0.0002 mW cm−2 (mmol dm−3). In the same year, Zhang et al.126 developed an enzymatic biofuel cell array structure like that in Fig. 5A(iv). The substrate is a 6 × 5 cm2 PET flexible membrane; aiming to quickly generate energy and increase the effect of electrodes, they put the anode and cathode on the same side and designed a hexagonal electrode array structure imitating the honeycomb. Furthermore, to increase the output voltage of the enzymatic biofuel cell, they integrated a 1.5 × 2 cm2 power management system with the enzyme fuel cell and subsequently charged the capacitor to achieve the required output voltage, and it has a maximum output power density in 5 mM glucose of 220 μW cm−2, 0.3 V. As the glucose concentration in patients with early diabetes is usually below 5 mM, this glucose sensor can be used as an emerging sensor to detect the glucose level in the patient's urine and to alert the patient to seek treatment as soon as possible. In addition, diaper-based wearable sensors have great potential for clinical applications due to complications such as “polyuria” or urinary incontinence in diabetic patients.
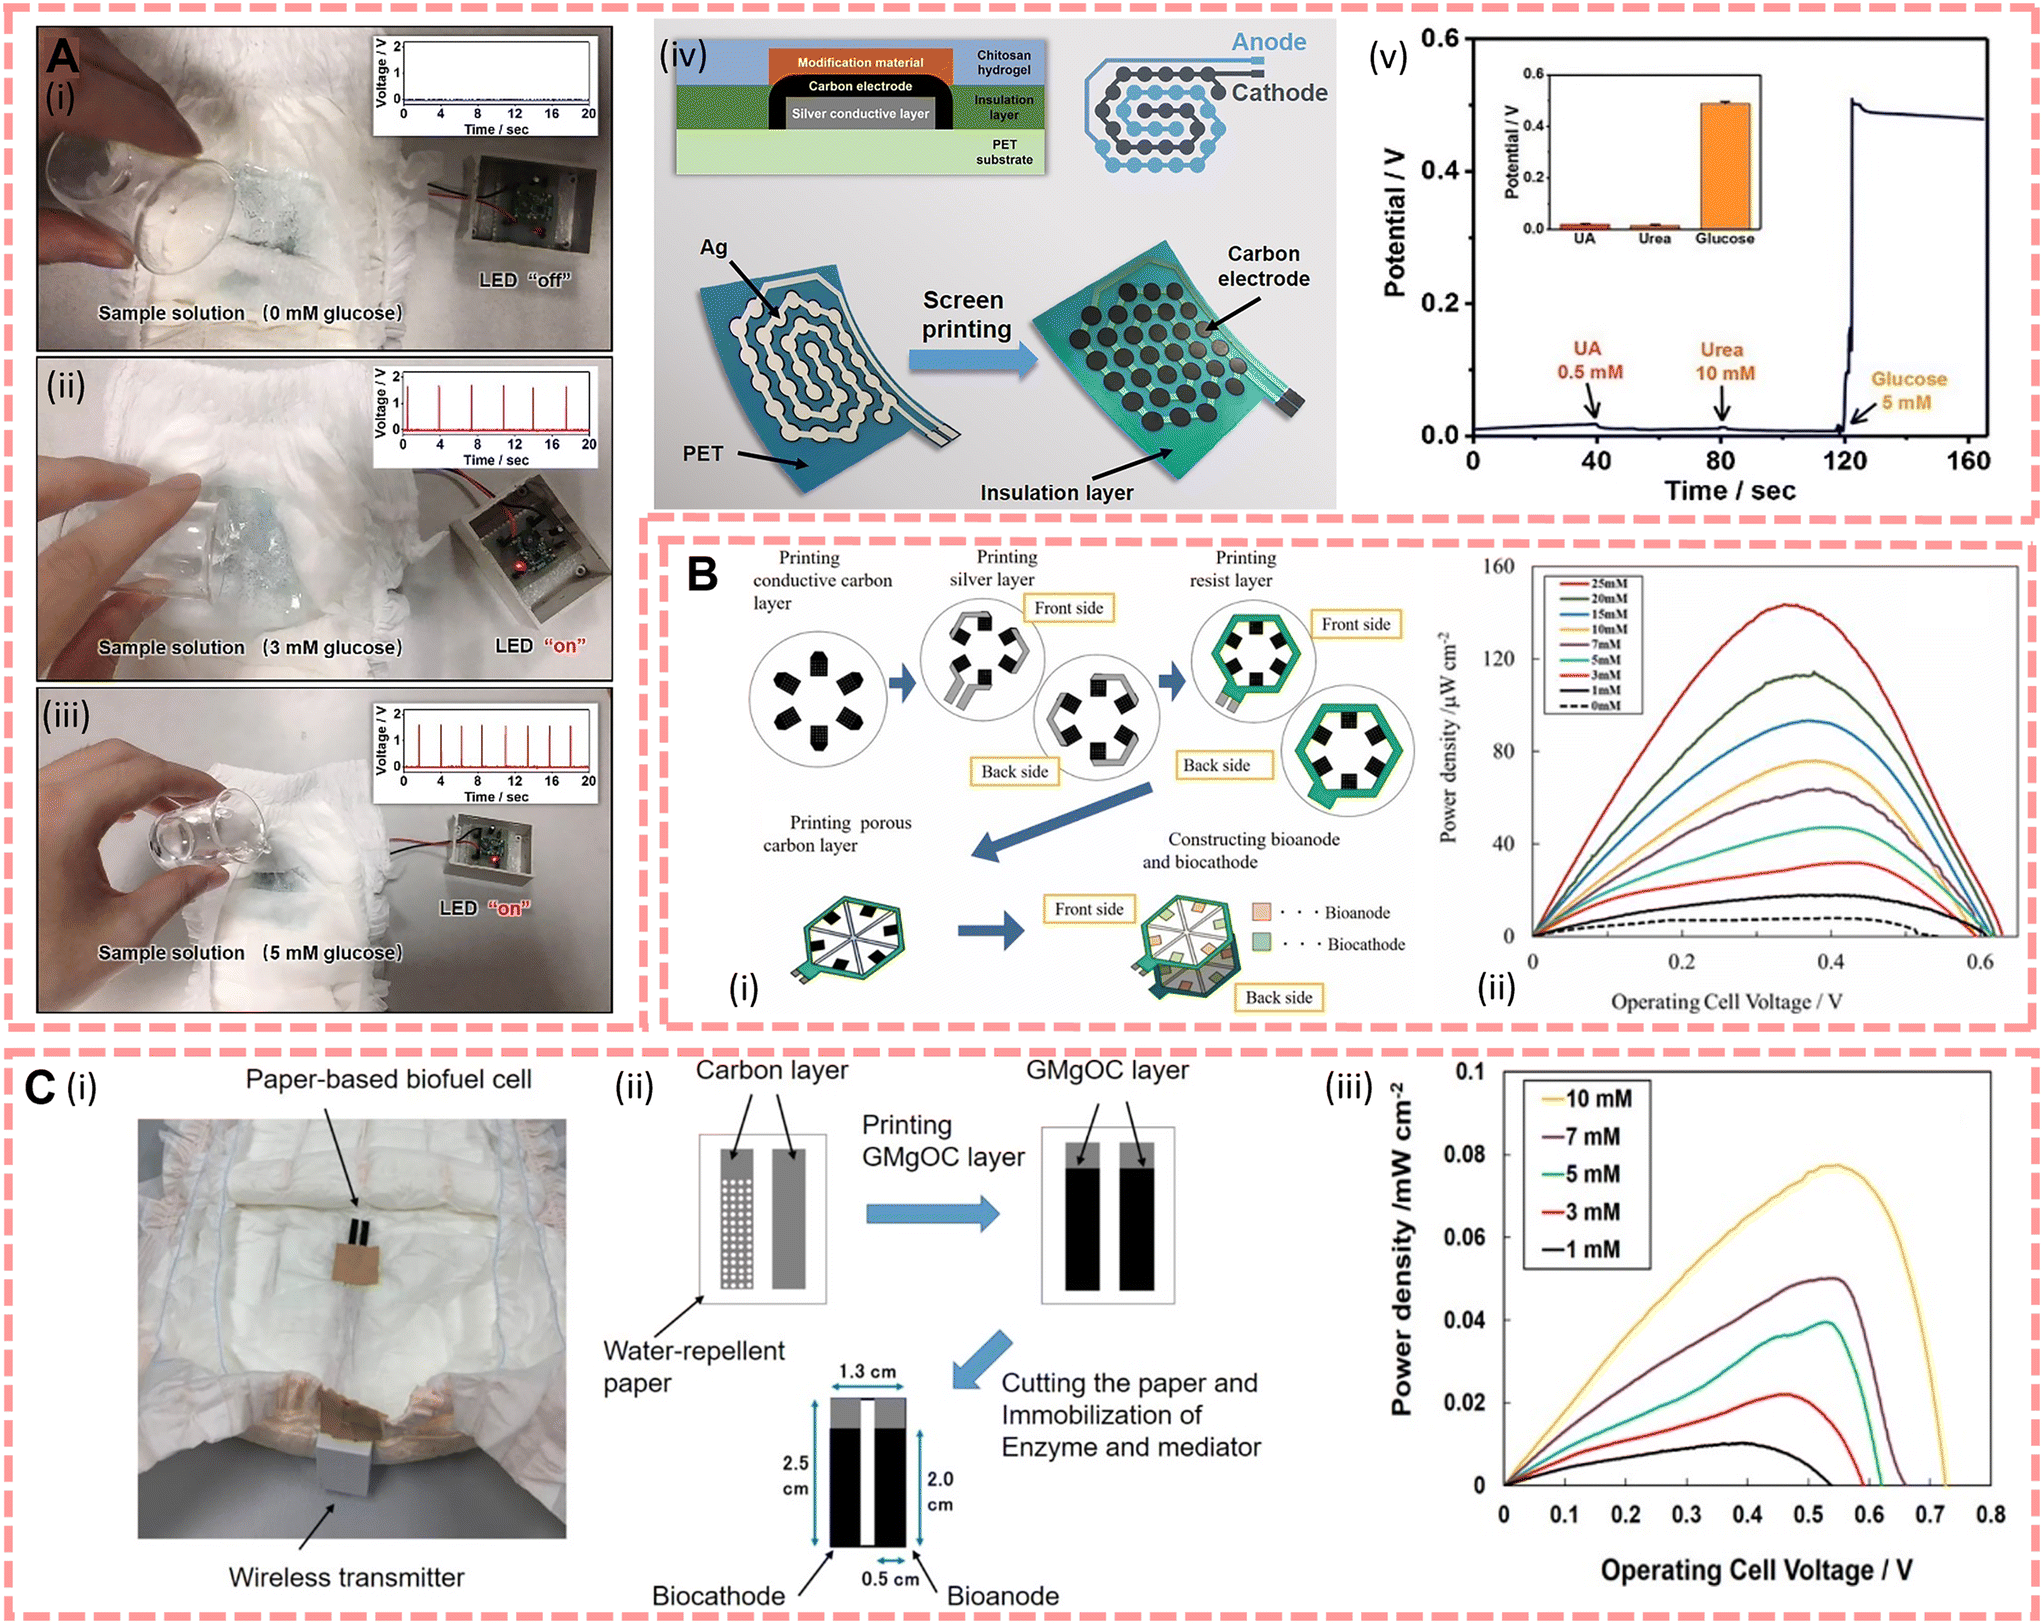 | ||
| Fig. 5 (A)(i)–(iii) Photographs demonstrating the operation of the LED indicator powered by the device with the concentration of glucose from 0 mM to 5 mM. (iv) Design of the biofuel cell. (v) Response of the sensor with UA, urea and glucose. Reproduced from ref. 126 with permission from The Royal Society of Chemistry, copyright 2021. (B)(i) Design and fabrication process of the hexagonal fuel cell. (ii) Power–current curve with different glucose concentrations. Reproduced from ref. 125 with permission from The Electrochemical Society, copyright 2019. (C)(i) Actual demonstration of the paper-based biofuel cell with a wireless transmitter. (ii) Fabrication process of the fuel cell. (iii) Power–current curve with different glucose concentrations. Reproduced from ref. 42 with permission from the American Chemical Society, copyright 2021. | ||
In addition to sensors for direct application in nappies, several researchers have attempted to develop biochemical sensors with high specificity and have chosen to use urine as the solution to be tested for the sensitivity of this sensor due to its multiple and complex compositions. For instance, Selvarajan et al.127 created a PENG-driven cysteine sensor by functionalizing BaTiO3 nanoparticles and agarose, which had a linear range of detection of ∼10 μM cysteine. Additionally, aiming to provide energy to biochemical sensors, Shitanda et al.192 developed a paper-based biofuel cell, which showed an output of about 0.84 mW when water was added and Voc is 2.1 V, which has potential applications in nappy BFC-type urine timing sensors for non-diabetic patients.
As most urine sensor applications are based on nappies, evenly collecting the fluid to be measured by the sensor is a problem that needs to be considered. Furthermore, due to the large number of complex components in urine, the simultaneous detection of multiple samples is one of the worthy fields of development.
5.4 Tear monitoring
Tears are the fluid secreted by the lacrimal glands that cover the eyes to function as their protective film. It consists of three layers, outer lipid, aqueous and inner mucin, from the exterior to the eye, and has a different composition depending on the source of secretion. The lipid layer is mainly composed of lipids, which prevent rapid evaporation of the aqueous layer and act as an immune barrier; the aqueous layer is a solution rich in small metabolites such as electrolytes, proteins/peptides, glucose or lactate secreted by the lacrimal gland; the mucin layer is mainly secreted by the goblet cells and usually contains large glycoproteins with O-linked carbohydrates and a protein core.193 Therefore body tear fluid is like a complex physiological fluid that contains 98% water with other chemical compounds such as electrolytes, small organic molecules, enzymes, etc.194 And these biomarkers are present through either cellular metabolism or passive leakage of low weight compounds from the plasma.195 Scientists therefore believe that tears are one of the physiological fluids that also reflect the composition of blood, as well as sweat and saliva.196It has been reported that some biomarkers in tears are directly related to blood, such as Na+, Cl−, Mg2+, HCO3−, lactate and urea, and their levels are similar to those in blood; however, the glucose and total protein concentrations in tears are significantly lower than those in blood,197 so a more sensitive sensor is required to detect diseases such as diabetes or dry eye from tear biomarkers. In addition, there are other problems with the analysis of tears, such as the smaller sample volume of tears compared to sweat and saliva, and the loss of the aqueous phase due to evaporation, which can lead to inaccurate results if the tears are collected and tested with an external device. In addition, tears usually require stimulation of the eye to stimulate lacrimal secretion, which may be unacceptable for the patient. Therefore, the development of wearable in situ tear biomarker sensors is very prospective.
In 2013, Peng et al.129 developed a needle electrochemical sensor for measuring glucose content in tears based on the amperometric method, which collects rabbit tears through a glass micro-capillary and subsequently detects the hydrogen peroxide released through the enzymatic reaction of glucose oxidase fixed on the Pt/Ir line of the sensor; meanwhile, the cation exchange that occurs in the Nafion underlayer during the working of the device can block anion interference such as ascorbic acid and uric acid, and due to the increased working area of the electrode (4.0 mm2), it allows only 3 μl of tear fluid to be taken for testing, addressing the problem of low sample volumes due to evaporation, etc. This device demonstrated a significant correlation between tear and blood glucose levels of 7–18 mM and detected as low as 0.6 mM (10.8 mg dL−1) glucose with 91.7% accuracy. The problem with this sensor is that the blood–tear glucose ratio varies from animals to animals and the function curve constructed at this point cannot be directly applied to humans but will require pre-calibration.
To enable the detection of human tears, more and more scientists are trying to explore the potential of contact lenses.194,197 Contact lenses have the potential to be used as a non-invasive medical device, as they can collect information about the biomarkers within them in continuous contact with tears during wear, while enhancing the vision of visually impaired people. Therefore, contact lenses are required to be flexible to be able to generate continuous power and to have excellent biocompatibility to ensure that there is no inflammation or damage to the eye. In 2022, Kang et al.43 proposed a self-powered smart contact lens with five functional layers as shown in Fig. 6B, powered by a glucose fuel cell with a maximum output power of 4.4–8.8 μW cm−2, and compared to commercial lenses (30–80 wt% water content and 10–40 Dk oxygen permeability), the reported smart lens has a water and oxygen permeability of 63 wt% and 22 Dk, respectively. Furthermore, the oxygen consumption of the cathode of this biofuel electrode is three times lower than that of the cornea, so they believe that the contact lens will not damage the cornea and will function by implanting a photonic crystal array that displays different colours according to the glucose fuel cell to diagnose diabetes. In the same year, Lin et al.38 invented an integrated device powered by organic solar energy to solve the problem of low fuel cell converting efficiency and energy instability and this device is shown in Fig. 6A. Considering the lower glucose content in tears and that the sensor requires high resolution, they improved the properties of poly(2,3-dihydrothienyl-1,4-dioxin)–poly(styrene sulfonate) (PEDOT:PSS) sensors to enhance the response to biomarkers in tears. To specifically identify Ca2+ and glucose in tears, they modified the PEDOT:PSS channel and platinum gate with a Ca2+ selective membrane and a mixture of chitosan and glucose oxidase, respectively. Under indoor illumination (illumination density = 500–2000 lux), the solar open circuit voltage V = 0.6 V, the drain current remains above 92% of the initial values and the detection levels for glucose and Ca are in the range of 0.1–0.6 mM and 0.4–1.1 mM, respectively.
 | ||
| Fig. 6 (A)(i) Design of the integrated device and contact lens. The insets on the right show the electrodes for Ca2+ and the glucose sensor. (ii) The normalised current response of the sensor. Reproduced from ref. 38 with permission from the npj Flexible Electronics, copyright 2022. (B)(i) Structure and characterisation of contact lenses. (ii) Photographs of bent contact lenses. (iii) Optical micrographs of the structure colours emitted by the PCgel-capacitor at different glucose concentration ratios by the optical detector with corresponding RGB colour ratios. Reproduced from ref. 43 with permission from the American Chemical Society, copyright 2022. | ||
For contact lens-based tear biomarker sensors, they should first have good flexibility and transparency. And as self-generating devices, although biofuel cells are well established, there is still great potential for the application of other self-generating methods by considering that fuel cells consume oxygen and may reduce the available oxygen to the corneal epithelium which can lead to abnormal swelling such as oedema.
5.5 Detection of extracellular fluids
There is a large amount of fluid in the body, and this fluid with all the substances dissolved in it is called body fluid. What can be found inside the cells is called intracellular fluid, which accounts for about 40% of body weight. What can be found outside the cells is called extracellular fluid. Extracellular fluids include interstitial fluid, plasma and lymphatic fluid, which can be transferred to each other through the internal environment. Therefore, due to the circulation of body fluids supporting the human body's daily life by transporting nutrients to the organs and excreting metabolic waste products from cellular metabolism, the chemicals they contain (e.g., proteins, DNA, RNA, electrolytes, etc.) are a direct reflection of a person's health status. This means that compared with biomarker detection from sweat, saliva and tears, tracing biomarkers in the extracellular fluid is much easier because the content of biomarkers is not filtered and reabsorbed by various organs; however, the detection of biomarkers in body fluids is generally performed by invasive sampling compared to exocrine fluids and requires a trained practitioner to draw them.198 As an invasive detection source, extracellular fluids are known as precise detection samples to detect and follow-up a variety of diseases. For instance, blood as the most widespread and basic clinical test sample, the National Academy of Clinical Biochemistry (NACB) reported that it has a significant number of biomarkers that can be used as a detection for cancer;199 myoglobin and cardiac troponin are used to detect the degree of myocardial injury,200 abnormal coagulation in patients with COVID-19,201etc. Interstitial fluid provides an interface between circulatory system and intracellular fluid via lymphatic system, it contains abundant biomarkers (proteins, peptides, metabolites, and nucleic acids, etc.), and current studies are focused on detection of tumour202 and brain disease, for instance, brain damage,31 neuroaxonal damage,203 and Alzheimer disease.204To improve the management of blood glucose in diabetic patients, realize highly sensitive and real-time blood glucose monitoring, and overcome the disadvantages of discrete blood glucose sampling, the direct detection of blood glucose from the body is currently showing great potential for clinical applications. For instance, Slaughter et al.130 first introduced a self-powered glucose sensor that allows continuous monitoring of blood glucose via glucose oxidation and then generates and accumulates electrical energy by a capacitor via a charge pump circuit. This device shows a high sensitivity towards glucose of 37.66 Hz mM−1 cm−2 and a linear range of 1 to 20 mM; furthermore, due to its capacitor structure, it overcomes the disadvantage of low power effects of traditional enzyme biofuel cells. Furthermore, for the development of flexible e-skins, researchers proposed an e-skin that harvests the mechanical energy of human motion, showing good potential for the integration with the human body, and the output of piezoelectric voltage is influenced by the glucose concentration directly, so that it would be helpful to monitor the diabetes process. In 2016, Xue et al.133 reported a new working mechanism based on the coupling of the surface enzymatic reaction and piezoelectric effect; according to this mechanism, they designed a 0.6 × 0.6 cm GOx@ZnO nanowire array based e-skin and the structure is shown in Fig. 7A(i). Fig. 7A(ii) shows good selectivity for glucose and has a glucose detection range of 0.86–2.33 g l−1 for blood; furthermore, the difference between fasting rabbits (glucose concentration of 1.02 g l−1) and sugar-fed rabbits (glucose concentration of 1.67 g l−1) can be clearly distinguished without any external power supply (the output voltage of the e-skin is ∼0.079 and ∼0.023 V, respectively), demonstrating that the e-skin can detect glucose concentrations in rabbit blood, showing potential applications for diabetic patients. In addition, they also verify the responsiveness of glucose from not only blood, but also in tears, saliva and urine (shown in Fig. 7A(iii)). In 2018, based on the piezo-enzymatic-reaction coupling effect of GOx@ZnO nanowires, Zhang et al.134 reported an e-skin for monitoring glucose concentration in vivo, the structure and the performance are shown in Fig. 7B. By implanting this e-skin in rats (Fig. 7B(iii)), they demonstrated that it can clearly distinguish the normal blood glucose level (0.756 g l−1) and the blood glucose level of glucose injected rats (0.792 g l−1) by its output voltage (0.16 V vs. 0.075 V).
 | ||
| Fig. 7 (A)(i) Structure of the e-skin, and the diagram below shows that the device can work in solution. (ii) The selectivity for detecting glucose. (iii) The response of the e-skin modified with different quantities of GOx. Reproduced from ref. 133 with permission from Elsevier, copyright 2016. (B)(i) Optical images of the device. (ii) Different output voltages and response of the e-skin under different glucose solution concentrations. (iii) Device implants in a mouse. (iv) Output voltage and glucose meter index of the device before and after glucose injection in vivo. Reproduced from ref. 134 with permission from Springer Nature, copyright 2018. (C)(i) The design of the e-skin includes urea and uric acid biosensor units. (ii) The response of urea (on the top) and uric acid (on the bottom). Reproduced from ref. 44 with permission from The Royal Society of Chemistry, copyright 2018. | ||
Oxygen saturation is an important physiological parameter that reflects the health status of respiratory and circulatory function. When the blood oxygen concentration is below 95%, it indicates that the patient may be suffering from hypoxia, while oversaturation is a risk of oxygen toxicity, so that monitoring oxygen saturation continuously and sensitivity is necessary. Chen et al.140 reported a 1 cm × 1 cm × 0.2 mm TENG-driven flexible blood oxygen monitoring system; by collecting and analysing the light emitted by its LEDs scattered through the epidermis, it can calculate the oxygen levels in blood, and the performance of output voltage, output current density, and power density was 75.3 V, 7.4 μA cm−2, and 0.2 mW cm−2. This work illustrates a novel method how self-powered machines can be used for oxyhemoglobin saturation tests without intense discomfort, and demonstrates the enlarged development potential of flexible self-powered sensors. Similarly, in 2022, Chen et al.139 reported an oxygen saturation test sensor based on a TENG made of PEDOT:PSS@porous carbon with an output voltage and current of 74.3 V and 17.9 μA when it is in 100% tensile strain.
The concentration of different biomarkers in human body fluids is an important pathological parameter for chronic disease prediction and diagnosis, and wearable biosensors that can monitor and analyse body fluids in situ have significant potential for therapeutic applications. For instance, Fig. 7C shows a subcutaneous implantable electronic skin based on ZnO nanowire arrays with a size of approximately 1 cm2 to detect urea and uric acid in situ designed by Yang et al.,44 and it showed responses in 80 mM urea and 0.6 mM uric acid of 587.3% and 122%, respectively. In addition, by injecting 0.6 mM uric acid solution at the site of the device, the output piezoelectric voltage decreases from ∼0.2 V to ∼0.05 V, illustrating the responsiveness of the device towards uric acid. To monitor the acute and chronic inflammation in real time, Lei et al.143 reported a 6 cm × 6 cm e-skin synthesised from GaN nanowire arrays; it performs sensing of CRP by modifying C-reactive protein antibodies on the surface of the nanowires. The output voltage of this device in pure water is 86.32 mV; when the CRP antigen concentration reaches 0.624 mg ml−1 it will decrease to 18.79 mV and the response at this point is 78.2%, and the sensitivity of this self-powered e-skin is about 0.030 mg ml−1.
Regular and effective continuous monitoring is important to assess the patient's physical condition and to formulate appropriate interventions and treatments. However, some systems at some times still have a huge gap between the intertissue biomarker test results and the amount of biomarkers in blood. Therefore it is a requirement to enhance the accuracy of the sensors and use big data simulation algorithms to minimize or eliminate the time lag between the intertissue fluid biomarker level and blood biomarker level changes. Furthermore, some sensors test body fluids by implantation, and minimizing foreign body reactions needs to be considered.
5.6 Detection of molecules in exhaled gases
Respiratory analysis has great potential for medical diagnosis as it allows specialists to non-invasively perform continuous sampling on demand and analyse in real time. This means that compared with blood and urine, the sampling process of breath does not affect next sampling, and the volume of sample also can be collected as high as possible and avoid injury of the human body because the sampling process does not require stimulation to promote secretion. It also has a more casual collection environment than other exocrine fluids, either during surgery or in normal wards.205 Since then more and more scientists try to develop trace analysis methods that allow rapid separation of breath samples, such as on mobility spectrometry (IMS). However, because similar mass spectra may appear in different compounds, this method cannot identify the compounds accurately all the time. Therefore, how to design a biochemical sensor that can sensitively separate and identify the components of the exhaled gas has become an important research direction in respiratory sensors.The earliest analysis of volatile compounds in exhaled gas was performed by gas chromatography206 although the compounds were not completely identified at that time, the early reports believed that some of the volatile chemicals in exhaled air may be associated with disease, such as acetonitrile which appears in blood, urine and breath of smokers, and smokers often suffer from lung diseases.207 Currently, more and more biomarkers of exhaled breath are being identified related to disease. For instance, dimethylamine and trimethylamine appear in patients suffering from end-stage renal disease,208 nitric oxide is a gas marker of asthma,209 acetone is connected with diabetes,210 ammonia is related to hepatitis,210etc. Furthermore, as a result of the spread of the pandemic, because of the time required for PCR testing and the potential for error in rapid antigen detection, many scientists have attempted to analyse and diagnose Covid-19 by breath samples,211,212 for example, Aldhaleei et al.213 indicated that patients with Covid-19 may have relatively higher levels of ammonia in their expiratory volumes. In addition to the diagnosis of the disease, the testing of alcohol content of breathed out gas also plays an important role in identifying drunk drivers in daily life.
To address the requirement for on-demand analysis of respiratory monitoring anytime and anywhere, self-powered wearable sensors have great application in this field, and there are usually two types of breathing sensors, capacitive and resistive modes, which identify compounds via the direct reaction between the gas molecules and materials. Their principle is that, for resistive self-powered sensors, which are modified with a specific gas sensing coating and integrated with a TENG, the gas molecules are chemisorbed with the probe of the sensor during respiration, and changing the carrier density of the gas sensing layer on the interdigital electrodes (IDEs), and the TENG subsequently acts as a power source to convert its characteristic fluctuations into a readable electrical output signal; for the capacitive mode, which results from the change in permittivity generated by the sensor during the sorption of the target electrons, due to the internal capacitor properties of the TENG, and by integrating the gas sensing material into the contact layer of the TENG, an integrated configuration consisting of an energy generator and sensing components can be obtained, thus enabling self-powered breathing gas analysis with a miniaturised design.214
Currently, many life-relevant gas molecules have been detected by scientists trying to set up self-powered sensors, like ethanol,145–147 NH3,45,148,149 CO2,150,215 NO2,151 acetone,152 formaldehyde,154etc. For instance, Fu et al.146 reported a 5 cm × 5 cm × 10 μm PENG-driven sensor array which is based on polyaniline/polyvinylidene fluoride (PANI/PVDF); it illustrated responses to acetone, ethanol, CO, NOx, and CH4 with a concentration from 0 to 600 ppm and the maximum response of each sensing unit to 600 ppm of gas markers is 68.2%, 56.9%, 47.1%, 105.1%, and 53.5%, respectively. This study demonstrates that piezoelectric effects induced via gas transport by a PVDF pipe can be coupled with the gas-sensitive properties of PANI electrodes, launching new working principles in the field of breath detection analysis. Xue et al.145 designed an e-skin based on the triboelectrification/gas-sensing coupling effect (Fig. 8A), this e-skin was made of polyaniline/polytetrafluoroethylene/polyaniline (PANI/PTFE/PANI), through forming a sandwich structure, and this e-skin can respond up to 66.8% against 210 ppm ethanol exposure with 0.41 μA, and the limit of detection is 30 ppm. To complete the trace analysis of gas, Wang et al.45,148 designed two different NH3 sensors and the structures are shown in Fig. 8C and D, respectively. These two sensors were designed using Ce doped ZnO–PANI nanocomposite films as substrates and modified PDMS in different structural contact with the substrate, respectively. And they illustrated that these integrated TENG and gas sensors can detect NH3 with a sensitivity of 0.1–1 ppm. Moreover, this sensor can be attached on the chest to monitor both the act of breathing and the NH3 concentration in the exhaled gas on the human chest during breathing (as shown in Fig. 8D(ii)).45 In addition, Su et al.151 developed a TENG-based wearable alveolus-inspired membrane sensor (AIMS) for human respiratory monitoring (structure shown in Fig. 8E) and detect NO2 concentration by simulating the structure and morphology of the alveoli. The target gas enters and exits the sensor resulting in a potential difference between the membrane and the sensing film, and experiments have shown that the sensor responds up to 340.24% when exposed to 80 ppm of NO2, which is over 20 times higher than other gas molecules.
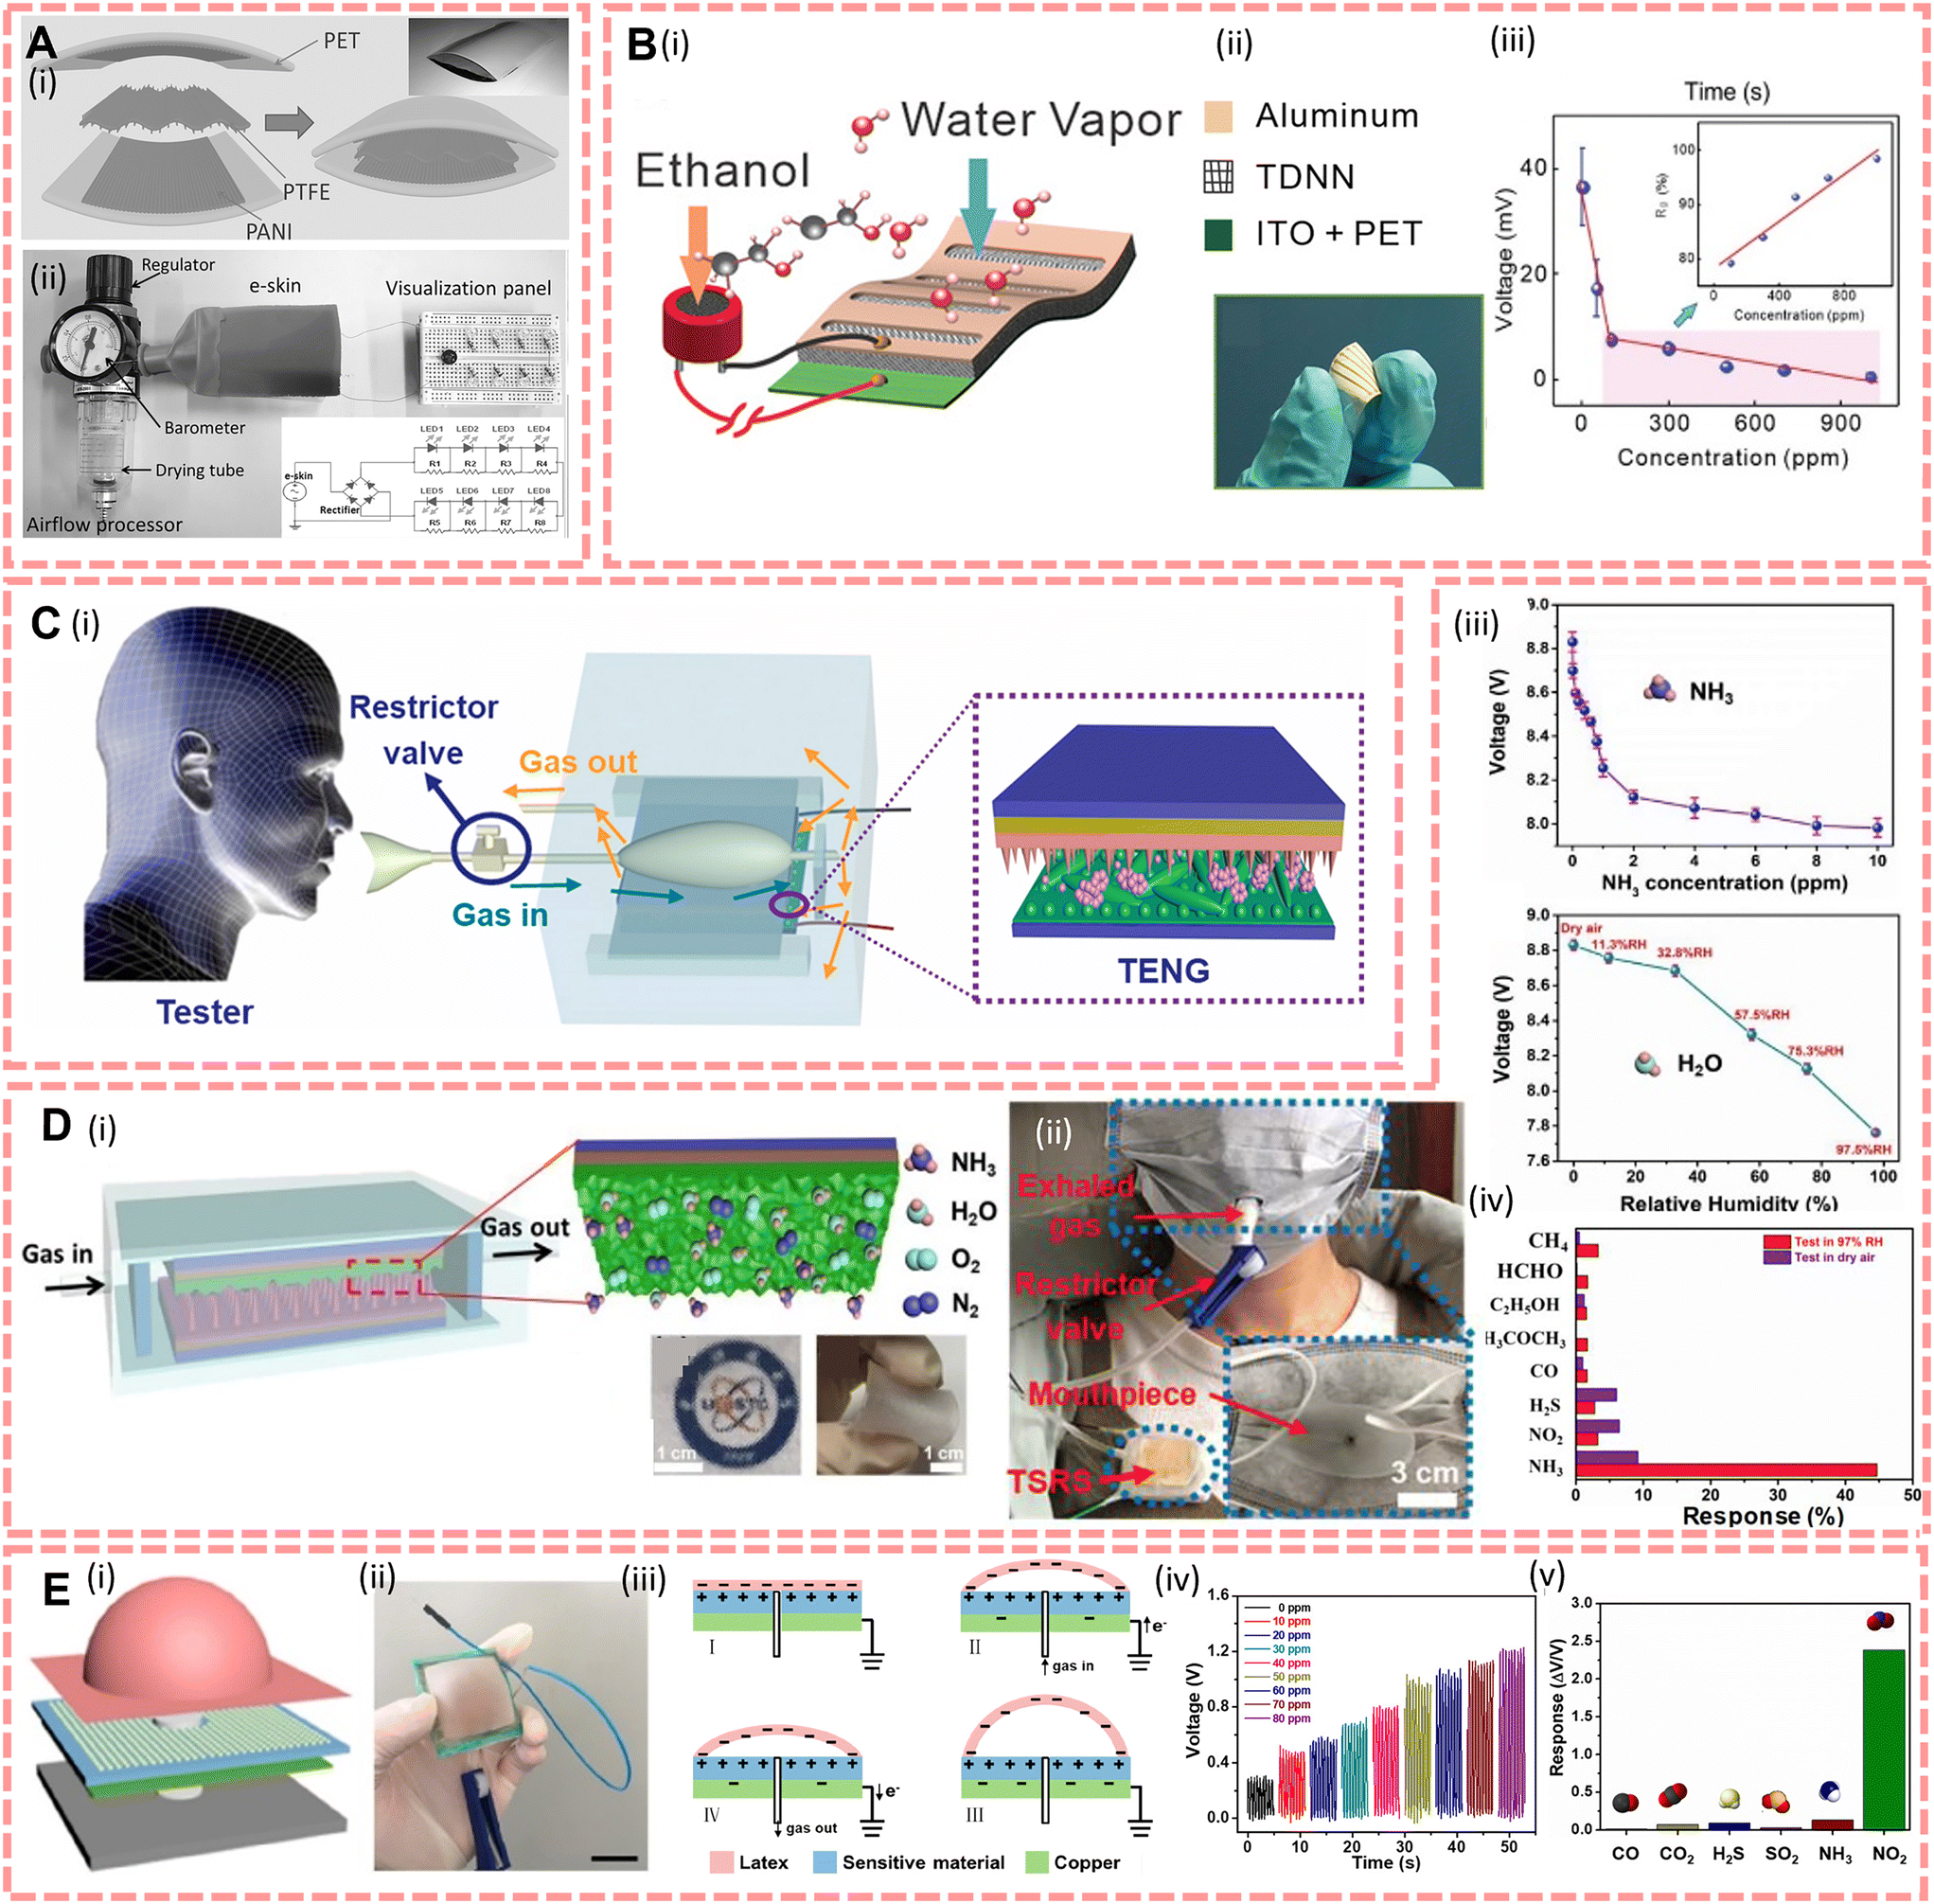 | ||
| Fig. 8 (A)(i) Structure of the smelling e-skin. (ii) Detecting system of the breath-alcohol sensor. Reproduced from ref. 145 with permission from John Wiley and Sons, copyright 2016. (B)(i) The design of the self-powered breath analyzer. (ii) Photograph of a HENG. (iii) Curve about sensor peak voltage versus ethanol concentration, the inset is the sensor's response to ethanol concentration. Reproduced from ref. 147 with permission from The Royal Society of Chemistry, copyright 2020. (C)(i) Respiration-driven system structure and set up. Reproduced from ref. 148 with permission from Elsevier, copyright 2019. D(i) The design of the triboelectric self-powered respiration sensor. (ii) Photograph of the wearable sensor driven by the chest. (iii) Output voltage under dry NH3 (top) and pure humidity conditions. (iv) Selectivity of the sensor under a dry and highly humid atmosphere, respectively. Reproduced from ref. 45 with permission from Elsevier, copyright 2019. E(i) Structure design of AIMS. (ii) Photograph of AIMS. (iii) The principle of AIMS generation. (iv) Dynamic response of AIMS with 0.02 g NaOH-treated WO3 at different NO2 concentrations. (v) Selectivity of AIMS. Reproduced from ref. 151 with permission from the American Chemical Society, copyright 2020. | ||
The other problem is about the exhalation and inhalation processes may have different gas contents, so Kim et al.150 designed a willow structured device to differentiate between inhalation and exhalation conditions and thus capture CO2.
Additionally, as breath often contains steam, this means that moisture resistance is also an issue that needs to be considered and addressed for the performance of self-powered respiratory bio-sensors, especially as the TENG has a water shielding effect as mentioned above,169,170 and it is currently the main method for providing energy for self-powered biochemical respiratory sensors. Aiming to address this problem, scientists have come up with many solutions based on materials and even power generation principles. For instance, Chang et al.154 in 2022 used novel 4,4′-bipyridyl (bpy)-functionalised phosphomolybdic acid (bpy-PMA) for moisture resistance to overcome the poor stability caused by the hygroscopicity of their design of a TENG with a design of novel polyoxometalate-based material phosphomolybdic acid (PMA) as both a triboelectric layer and a gas sensing active layer. And Wang et al.215 proposed a water–air triboelectric nanogenerator (WATENG) as a portable CO2 sensing device based on the different working principles, which consists of a top air layer and a bottom wetted sponge layer separated by a suspended PDMS film at the centre, and the contact electrification between the top electrode and the upper surface of PDMS has a constant contact area with the variable environmental humidity. Therefore, due to the multi-layered structure of the sensor, there will be two independent charge transfer mechanisms during operation: one unaffected by force and the other unaffected by humidity, and thus, humidity and force can be characterised independently. Furthermore, as shown in Fig. 8B, Shen et al.147 designed a breath sensor powered by a HENG, with a response to 100 ppm ethanol of up to 80%.
In addition, since TENGs are often used as the power supply principle for self-powered biochemical breathing sensors, the question of how to extend the life of the detector also needs to be addressed. For instance, Shrestha et al.216 proposed a tribological nanogenerator based siloxane/Ecoflex nanocomposite that increased the surface potential 4 times more, enhancing the output performance of the TENG. And due to its non-contact mechanism, it can effectively prevent wear and tear on the device.
Due to the development of various Internet of Things architectures, respiration sensors develop rapidly as integrated sensors that can monitor chemical indicators (exhaled gas molecules) and physical indicators (temperature, humidity, chest movement, respiratory rate) simultaneously. However, there are still some challenges. Firstly, the output of respiration sensors is still a limitation; although there are various self-powered principles suitable for powered respiration sensors, the efficiency of energy harvesting is not enough to support the consumption of energy in real time. Furthermore, how to enhance the coupling efficiency between chemisorption and energy conversion requires research because the functional layer of the sensor is used not only for gas sensing, but also for power generation in complex environments.
6. Challenges and outlook
In summary, while the development of nanogenerators and flexible materials has greatly advanced the use of sensors for disease tracking, there are still several challenges that need to be overcome. Firstly, there are still few effective, sensitive, and specific single biomarkers that can be used for disease diagnosis; combined biomarkers enhance the accuracy but also raise the complexity of the detection devices and require higher standards of specificity of sensing technology and data processing. Secondly, the continuous monitoring duration of the sensing units based on ion-selective membranes or enzyme-modified electrodes for detection is only available for a limited number of targets, and these devices usually have an expiry date due to limitations in enzyme activity. Furthermore, the cycling stability of the system in real time environmental applications can also be affected by various external factors such as humidity and wear and tear of the device due to joint movements resulting in decreased output performance, and the biosensor sensor with enzyme modified electrodes may be affected by temperature and the pH of the patient's secreted body fluids, resulting in decreased sensitivity. Finally, the high energy consumption of the sensor relative to the energy conversion efficiency of the self-powered device per unit area creates a mismatch, making it difficult for the device to achieve long-term stable operation of the sensor under conditions of high miniaturization and portability. Addressing these challenges will be crucial for improving the practical application of self-powered sensors for disease tracking.In order to overcome these problems, further development of self-powered sensors is necessary, mainly including the following aspects (Fig. 9). Firstly, it is crucial to develop biosensing components with high specificity and sensitivity. These components must exhibit high selectivity, which means that they can only recognize and detect target molecules. In addition, they need to have high sensitivity in order to react quickly and accurately to trace target molecules. Secondly, it is necessary to improve the stability and service life of each component as needed. Biosensing components are often affected by environmental factors such as temperature, humidity, and light, leading to deterioration or complete failure of their performance. Therefore, it is necessary to use appropriate materials and manufacturing processes to ensure the stability and lifespan of the components. The design and choice of material and its micro-structure are important because wearable sensors require to be flexible and stretchable enough to be worn directly on the user's skin. Currently, materials like metal nanowires, conductive polymers, and carbon nanotubes are widely used in fabrication of nanogenerators217–219via weaving or laminating processes. But the material's natural extensibility is its limitation. Besides, the micro-structure also plays an important role in improving the efficiency of generators,220 and integrated sensors can improve the response and sensitivity of flexible sensors; for instance, saw-toothed structures were reported to improve the responsiveness of equipment.221 However, the saw-tooth structure in the integrated sensor makes it difficult to collect and retain the liquid to be measured; therefore, the microstructure of the sensor for the biomarker requires a design that meets both the efficiency of the generator, the responsiveness of test liquid and the capability for liquid collection. Furthermore, miniaturization, integration and flexibility of the entire device should be considered to meet the needs of different users. This will make the device more portable and easier to operate while reducing resource and cost waste. For implantable devices, absorbability and degradability are also important research directions for future application. Such devices can automatically degrade after service without the need for secondary surgical removal, greatly enhancing the patient's experience, or they can decompose in the natural environment after use, avoiding environmental pollution. Additionally, wireless transmission realizes remote monitoring and management of data, which improves the efficiency and convenience of equipment use and greatly enhances the quality of life of patients who need to monitor biomarkers for a long time. However, in real-world settings, transmitting data to the terminal for analysis often results in high energy consumption. As a result, improving the efficiency of self-powered energy conversion and minimizing energy consumption are important research directions for the development of self-powered sensors.
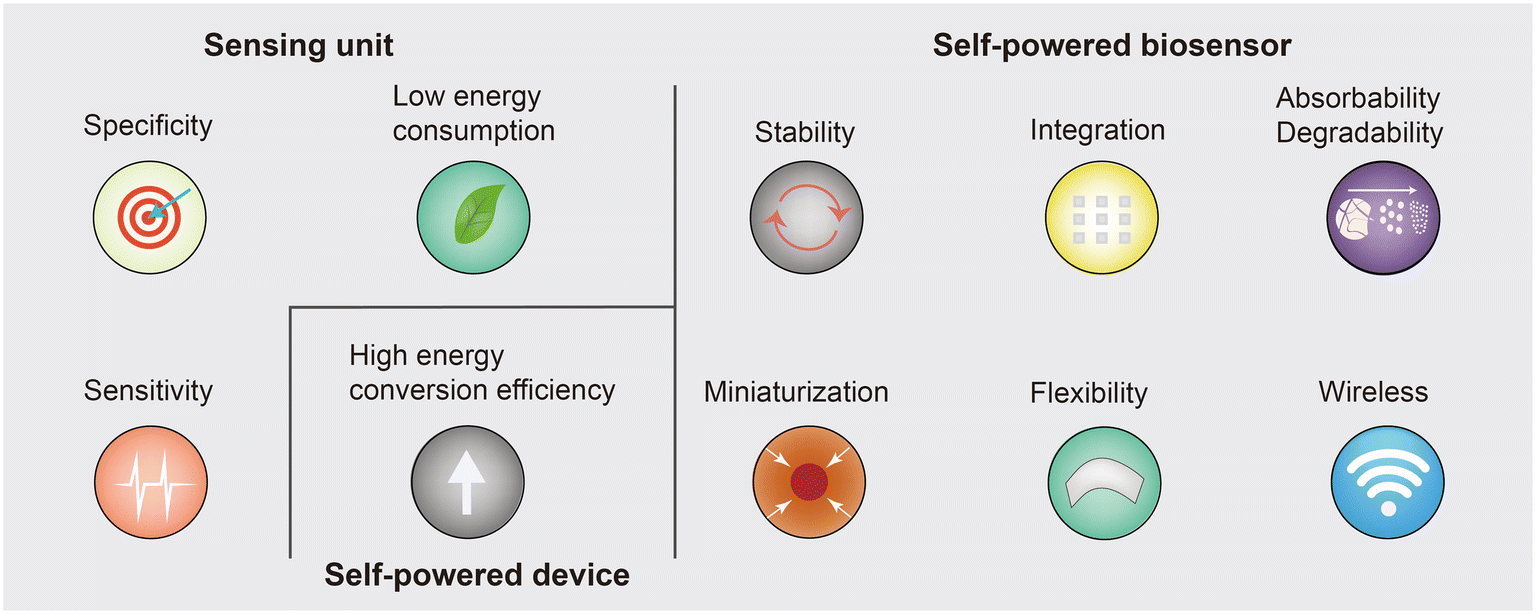 | ||
| Fig. 9 Future development direction of self-powered biosensors. | ||
In summary, research on self-powered biosensors is continually advancing, and in the future, it is expected to provide more comprehensive and efficient solutions for human health protection.
7. Conclusion
With increasing awareness of early detection and rapid screening of diseases, the biochemical sensor industry is expected to experience rapid growth. This work reviews recent advances in the application of self-powered sensors for the detection of biomarkers found in sweat, saliva, urine, tears, extracellular fluids, and exhaled gases. It can be concluded that self-powered sensors have great potential and speed of development in the biomedical field due to the development of wearable devices and flexible materials. Currently, there is a requirement for scientists to not only accelerate the development of biomarker sensors, but also to focus on their performance in real-time environmental applications, to enable faster clinical translation. In addition, self-powered biochemical sensors provide potential convenient power for data collection and analysis and data cloud storage using a smartphone, and are extremely helpful to build a big data platform for health. Furthermore, the high selectivity and sensitivity of the portable device's integrated biosensor will allow physicians to gain remote access to and follow up on patient prognosis, and also the low cost of production will allow affordable and reliable biofluid testing in more fields.Conflicts of interest
The authors declare no conflict of interest.Acknowledgements
J. X. Li and L. L. Xu contributed equally to this work. This work was supported by the National Key Research and Development Program of China (2021YFB3201204), the National Natural Science Foundation of China (T2125003), the Beijing Natural Science Foundation (JQ20038, L212010), and the Fundamental Research Funds for the Central Universities (E0EG6802X2).References
- U. A. Meyer, Clin. Pharmacol. Ther., 2012, 91, 373–375 CrossRef CAS PubMed.
- A. Harvey, A. Brand, S. T. Holgate, L. V. Kristiansen, H. Lehrach, A. Palotie and B. Prainsack, New Biotechnol., 2012, 29, 625–633 CrossRef CAS PubMed.
- E. Delgado-Alvarado, E. A. Elvira-Hernández, J. Hernández-Hernández, J. Huerta-Chua, H. Vázquez-Leal, J. Martínez-Castillo, P. J. García-Ramírez and A. L. Herrera-May, Nanomaterials, 2022, 12(12), 2549 CrossRef CAS PubMed.
- Z. L. Wang and J. Song, Science, 2006, 312, 242–246 CrossRef CAS PubMed.
- M. Sun, Z. Li, C. Yang, Y. Lv, L. Yuan, C. Shang, S. Liang, B. Guo, Y. Liu, Z. Li and D. Luo, Nano Energy, 2021, 89, 106461 CrossRef CAS.
- J. Briscoe and S. Dunn, Nano Energy, 2015, 14, 15–29 CrossRef CAS.
- S. Tremmel, X. Luo, B. Rothammer, A. Seynstahl, B. Wang, A. Rosenkranz, M. Marian and L. Zhu, Nano Energy, 2022, 97, 107185 CrossRef CAS.
- Q. Niu, H. Wei, B. S. Hsiao and Y. Zhang, Nano Energy, 2022, 96, 107101 CrossRef CAS.
- Y. Gao, G. Liu, T. Bu, Y. Liu, Y. Qi, Y. Xie, S. Xu, W. Deng, W. Yang and C. Zhang, Nano Res., 2021, 14, 4833–4840 CrossRef CAS.
- M. F. Sanad, A. E. Shalan, S. O. Abdellatif, E. S. A. Serea, M. S. Adly and M. A. Ahsan, Top. Curr. Chem., 2020, 378, 48 CrossRef CAS PubMed.
- H. Ouyang, D. Jiang, Y. Fan, Z. L. Wang and Z. Li, Chin. Sci. Bull., 2021, 1709–1712 CAS.
- S. Huang, Y. Liu, Y. Zhao, Z. Ren and C. Guo, Adv. Funct. Mater., 2019, 29, 1805924 CrossRef.
- Y. Hong, H. Jeong, K. W. Cho, N. Lu and D.-H. Kim, Adv. Funct. Mater., 2019, 29, 1808247 CrossRef.
- J. Sun, A. Yang, C. Zhao, F. Liu and Z. Li, Sci. Bull., 2019, 64, 1336–1347 CrossRef PubMed.
- X. Hu, Z. Huang, X. Zhou, P. Li, Y. Wang, Z. Huang, M. Su, W. Ren, F. Li, M. Li, Y. Chen and Y. Song, Adv. Mater., 2017, 29, 1703236 CrossRef PubMed.
- M. Du, Y. Cao, X. Qu, J. Xue, W. Zhang, X. Pu, B. Shi and Z. Li, Adv. Mater. Technol., 2022, 7, 2101332 CrossRef CAS.
- J. Luo, Y. Li, M. He, Z. Wang, C. Li, D. Liu, J. An, W. Xie, Y. He, W. Xiao, Z. Li, Z. L. Wang and W. Tang, Adv. Sci., 2022, 9, e2105219 CrossRef PubMed.
- C. Wang, X. Qu, Q. Zheng, Y. Liu, P. Tan, B. Shi, H. Ouyang, S. Chao, Y. Zou, C. Zhao, Z. Liu, Y. Li and Z. Li, ACS Nano, 2021, 15, 10130–10140 CrossRef CAS PubMed.
- Z. Liu, Q. Zheng, Y. Shi, L. Xu, Y. Zou, D. Jiang, B. Shi, X. Qu, H. Li, H. Ouyang, R. Liu, Y. Wu, Y. Fan and Z. Li, J. Mater. Chem. B, 2020, 8, 3647–3654 RSC.
- J. Liao, Y. Zou, D. Jiang, Z. Liu, X. Qu, Z. Li, R. Liu, Y. Fan, B. Shi, Z. Li and L. Zheng, Nano Energy, 2020, 69, 104417 CrossRef CAS.
- M. Feng, X. Kong, Y. Feng, X. Li, N. Luo, L. Zhang, C. Du and D. Wang, Small, 2022, 18, 2201442 CrossRef CAS PubMed.
- J. Dai, J. Meng, X. Zhao, W. Zhang, Y. Fan, B. Shi and Z. Li, Adv. Mater. Technol., 2023, 8(7), 2201535 CrossRef.
- Z. Liu, S. Zhang, Y. M. Jin, H. Ouyang, Y. Zou, X. X. Wang, L. X. Xie and Z. Li, Semicond. Sci. Technol., 2017, 32, 064004 CrossRef.
- X. Peng, K. Dong, C. Ning, R. Cheng, J. Yi, Y. Zhang, F. Sheng, Z. Wu and Z. L. Wang, Adv. Funct. Mater., 2021, 31, 2103559 CrossRef CAS.
- P. Tan, Y. Xi, S. Chao, D. Jiang, Z. Liu, Y. Fan and Z. Li, Biosensors, 2022, 12, 234 CrossRef CAS PubMed.
- Y. Zou, J. Liao, H. Ouyang, D. Jiang, C. Zhao, Z. Li, X. Qu, Z. Liu, Y. Fan, B. Shi, L. Zheng and Z. Li, Appl. Mater. Today, 2020, 20, 100699 CrossRef.
- Z. Liu, Y. Ma, H. Ouyang, B. Shi, N. Li, D. Jiang, F. Xie, D. Qu, Y. Zou, Y. Huang, H. Li, C. Zhao, P. Tan, M. Yu, Y. Fan, H. Zhang, Z. L. Wang and Z. Li, Adv. Funct. Mater., 2019, 29, 1807560 CrossRef.
- Y. Ma, Q. Zheng, Y. Liu, B. Shi, X. Xue, W. Ji, Z. Liu, Y. Jin, Y. Zou, Z. An, W. Zhang, X. Wang, W. Jiang, Z. Xu, Z. L. Wang, Z. Li and H. Zhang, Nano Lett., 2016, 16, 6042–6051 CrossRef CAS PubMed.
- Q. Zheng, H. Zhang, B. Shi, X. Xue, Z. Liu, Y. Jin, Y. Ma, Y. Zou, X. Wang, Z. An, W. Tang, W. Zhang, F. Yang, Y. Liu, X. Lang, Z. Xu, Z. Li and Z. L. Wang, ACS Nano, 2016, 10, 6510–6518 CrossRef CAS PubMed.
- L. Zhao, H. Li, J. Meng, A. C. Wang, P. Tan, Y. Zou, Z. Yuan, J. Lu, C. Pan, Y. Fan, Y. Zhang, Y. Zhang, Z. L. Wang and Z. Li, Adv. Funct. Mater., 2020, 30, 1907999 CrossRef CAS.
- T. Liu, P. Yao, Z. Li, H. Feng, Z. Chengyu, X. Sun, C. Liu and N. Xue, IEEE Sens. J., 2021, 21407429 Search PubMed.
- R. Snyderman, Biotechnol. J., 2012, 7, 973–979 CrossRef CAS PubMed.
- A. I. Vinik, M.-L. Nevoret and C. Casellini, Front. Endocrinol., 2015, 6, 94 Search PubMed.
- M. S. Pepe, R. Etzioni, Z. Feng, J. D. Potter, M. L. Thompson, M. Thornquist, M. Winget and Y. Yasui, JNCI, J. Natl. Cancer Inst., 2001, 93, 1054–1061 CrossRef CAS PubMed.
- M. Eswaran, B. Chokkiah, S. Pandit, S. Rahimi, R. Dhanusuraman, M. Aleem and I. Mijakovic, Small Methods, 2022, 6, 2200809 CrossRef CAS PubMed.
- S. E. Counts, M. D. Ikonomovic, N. Mercado, I. E. Vega and E. J. Mufson, Neurotherapeutics, 2017, 14, 35–53 CrossRef CAS PubMed.
- Y. Song, D. Mukasa, H. Zhang and W. Gao, Acc. Mater. Res., 2021, 2, 184–197 CrossRef CAS.
- B. Lin, M. Wang, C. Zhao, S. Wang, K. Chen, X. Li, Z. Long, C. Zhao, X. Song, S. Yan, L. Wang and W. Ma, npj Flexible Electron., 2022, 6, 77 CrossRef.
- J. Kim, S. Imani, W. R. de Araujo, J. Warchall, G. Valdés-Ramírez, T. R. L. C. Paixão, P. P. Mercier and J. Wang, Biosens. Bioelectron., 2015, 74, 1061–1068 CrossRef CAS PubMed.
- H. Guan, T. Zhong, H. He, T. Zhao, L. Xing, Y. Zhang and X. Xue, Nano Energy, 2019, 59, 754–761 CrossRef CAS.
- P. K. Dave, R. Rojas-Cessa, Z. Dong and V. Umpaichitra, Biosensors, 2020, 11(1), 14 CrossRef PubMed.
- I. Shitanda, Y. Fujimura, T. Takarada, R. Suzuki, T. Aikawa, M. Itagaki and S. Tsujimura, ACS Sens., 2021, 6, 3409–3415 CrossRef CAS PubMed.
- D. Kang, J. I. Lee, B. Maeng, S. Lee, Y. Kwon, M. S. Kang, J. Park and J. Kim, ACS Nano, 2022, 16, 15827–15836 CrossRef CAS PubMed.
- W. Yang, W. Han, H. Gao, L. Zhang, S. Wang, L. Xing, Y. Zhang and X. Xue, Nanoscale, 2018, 10, 2099–2107 RSC.
- S. Wang, Y. Jiang, H. Tai, B. Liu, Z. Duan, Z. Yuan, H. Pan, G. Xie, X. Du and Y. Su, Nano Energy, 2019, 63, 103829 CrossRef CAS.
- Y. Zou, L. Bo and Z. Li, Fundam. Res., 2021, 1, 364–382 CrossRef CAS.
- F. R. Fan, L. Lin, G. Zhu, W. Wu, R. Zhang and Z. L. Wang, Nano Lett., 2012, 12, 3109–3114 CrossRef CAS PubMed.
- Z. L. Wang, ACS Nano, 2013, 7, 9533–9557 CrossRef CAS PubMed.
- Z. L. Wang, J. Chen and L. Lin, Energy Environ. Sci., 2015, 8, 2250–2282 RSC.
- Y. Cao, Y. Yang, X. Qu, B. Shi, L. Xu, J. Xue, C. Wang, Y. Bai, Y. Gai, D. Luo and Z. Li, Small Methods, 2022, 6, 2101529 CrossRef PubMed.
- Z. L. Wang, Nano Energy, 2020, 68, 104272 CrossRef CAS.
- S. Niu, S. Wang, L. Lin, Y. Liu, Y. S. Zhou, Y. Hu and Z. L. Wang, Energy Environ. Sci., 2013, 6, 3576–3583 RSC.
- Z. Wu, T. Cheng and Z. L. Wang, Sensors, 2020, 20, 2925 CrossRef CAS PubMed.
- Y. Yang, Y. S. Zhou, H. Zhang, Y. Liu, S. Lee and Z. L. Wang, Adv. Mater., 2013, 25, 6594–6601 CrossRef CAS PubMed.
- S. Wang, Y. Xie, S. Niu, L. Lin and Z. L. Wang, Adv. Mater., 2014, 26, 2818–2824 CrossRef CAS PubMed.
- L. Zhang, C. Su, X. Cui, P. Li, Z. Wang, L. Gu and Z. Tang, ACS Appl. Electron. Mater., 2020, 2, 3366–3372 CrossRef CAS.
- C. Chen, H. Guo, L. Chen, Y.-C. Wang, X. Pu, W. Yu, F. Wang, Z. Du and Z. L. Wang, ACS Nano, 2020, 14, 4585–4594 CrossRef CAS PubMed.
- X. Chen, H. Tian, X. Li, J. Shao, Y. Ding, N. An and Y. Zhou, Nanoscale, 2015, 7, 11536–11544 RSC.
- S. B. Lang and S. Muensit, Appl. Phys. A: Mater. Sci. Process., 2006, 85, 125–134 CrossRef CAS.
- R. A. Surmenev, T. Orlova, R. V. Chernozem, A. A. Ivanova, A. Bartasyte, S. Mathur and M. A. Surmeneva, Nano Energy, 2019, 62, 475–506 CrossRef CAS.
- R. V. Chernozem, M. A. Surmeneva and R. A. Surmenev, Mater. Lett., 2018, 220, 257–260 CrossRef CAS.
- H.-F. Guo, Z.-S. Li, S.-W. Dong, W.-J. Chen, L. Deng, Y.-F. Wang and D.-J. Ying, Colloids Surf., B, 2012, 96, 29–36 CrossRef CAS PubMed.
- T. P. Yoon, M. A. Ischay and J. Du, Nat. Chem., 2010, 2, 527–532 CrossRef CAS PubMed.
- P. P. Kumavat, P. Sonar and D. S. Dalal, Renewable Sustainable Energy Rev., 2017, 78, 1262–1287 CrossRef.
- J.-H. Lee, T. Sagawa, M. Takafuji and H. Ihara, Org. Electron., 2016, 28, 59–66 CrossRef CAS.
- N. D. Eisenmenger, K. T. Delaney, V. Ganesan, G. H. Fredrickson and M. L. Chabinyc, J. Phys. Chem. C, 2015, 119, 19011–19021 CrossRef CAS.
- J. Seok, T. J. Shin, S. Park, C. Cho, J.-Y. Lee, D. Yeol Ryu, M. H. Kim and K. Kim, Sci. Rep., 2015, 5, 8373 CrossRef PubMed.
- D.-B. Li, S. S. Bista, R. A. Awni, S. Neupane, A. Abudulimu, X. Wang, K. K. Subedi, M. K. Jamarkattel, A. B. Phillips, M. J. Heben, J. D. Poplawsky, D. A. Cullen, R. J. Ellingson and Y. Yan, Nat. Commun., 2022, 13, 7849 CrossRef CAS PubMed.
- J. L. Prasanna, E. Goel, A. Kumar and A. Kumar, Opt. Quantum Electron., 2022, 54, 748 CrossRef.
- X. Wang, Z. L. Wang and Y. Yang, Nano Energy, 2016, 26, 164–171 CrossRef CAS.
- M. A. Zoui, S. Bentouba, J. G. Stocholm and M. Bourouis, Energies, 2020, 13, 3606 CrossRef CAS.
- Q. Zhang, X. Y. Huang, S. Bai, X. Shi, C. Uher and L. D. Chen, Adv. Eng. Mater., 2016, 18, 194–213 CrossRef CAS.
- A. R. M. Siddique, S. Mahmud and B. V. Heyst, Renewable Sustainable Energy Rev., 2017, 73, 730–744 CrossRef.
- K. Suemori, S. Hoshino and T. Kamata, Appl. Phys. Lett., 2013, 103, 153902 CrossRef.
- Y. Yang, W. Guo, K. C. Pradel, G. Zhu, Y. Zhou, Y. Zhang, Y. Hu, L. Lin and Z. L. Wang, Nano Lett., 2012, 12, 2833–2838 CrossRef CAS PubMed.
- X. Kang, S. Jia, R. Xu, S. Liu, J. Peng, H. Yu and X. Zhou, Nano Energy, 2021, 88, 106245 CrossRef CAS.
- A. Heller, Phys. Chem. Chem. Phys., 2004, 6, 209–216 RSC.
- S. C. Barton, J. Gallaway and P. Atanassov, Chem. Rev., 2004, 104, 4867–4886 CrossRef CAS PubMed.
- L. Z. Zhao, X. Q. Zhang, Y. Q. Miao, W. T. Deng and H. Hu, Xian Dai Hua Gong, 2014, 34, 57–60 CAS.
- F. Davis and S. P. J. Higson, Biosens. Bioelectron., 2007, 22, 1224–1235 CrossRef CAS PubMed.
- Y. Wang, L. Ge, C. Ma, Q. Kong, M. Yan, S. Ge and J. Yu, Chemistry, 2014, 20, 12453–12462 CrossRef CAS PubMed.
- L. Wang, J.-R. Zhang, X. Wu and J.-J. Zhu, TrAC, Trends Anal. Chem., 2022, 146, 116476 CrossRef CAS.
- C. M. Moore, S. D. Minteer and R. S. Martin, Lab Chip, 2005, 5, 218–225 RSC.
- N. L. Akers, C. M. Moore and S. D. Minteer, Electrochim. Acta, 2005, 50, 2521–2525 CrossRef CAS.
- X. Zhu, L. Gao, L. Tang, B. Peng, H. Huang, J. Wang, J. Yu, X. Ouyang and J. Tan, Biosens. Bioelectron., 2019, 146, 111756 CrossRef PubMed.
- Z. Zhang, X. Li, J. Yin, Y. Xu, W. Fei, M. Xue, Q. Wang, J. Zhou and W. Guo, Nat. Nanotechnol., 2018, 13, 1109–1119 CrossRef CAS PubMed.
- X. Wang, F. Lin, X. Wang, S. Fang, J. Tan, W. Chu, R. Rong, J. Yin, Z. Zhang, Y. Liu and W. Guo, Chem. Soc. Rev., 2022, 51, 4902–4927 RSC.
- L. Li, S. Feng, Y. Bai, X. Yang, M. Liu, M. Hao, S. Wang, Y. Wu, F. Sun, Z. Liu and T. Zhang, Nat. Commun., 2022, 13, 1043 CrossRef CAS PubMed.
- L. C. Clark, Jr. and C. Lyons, Ann. N. Y. Acad. Sci., 1962, 102, 29–45 CrossRef PubMed.
- S. Biagi, S. Ghimenti, M. Onor and E. Bramanti, Biomed. Chromatogr., 2012, 26, 1408–1415 CrossRef CAS PubMed.
- F. Gao, C. Liu, L. Zhang, T. Liu, Z. Wang, Z. Song, H. Cai, Z. Fang, J. Chen, J. Wang, M. Han, J. Wang, K. Lin, R. Wang, M. Li, Q. Mei, X. Ma, S. Liang, G. Gou and N. Xue, Microsyst. Nanoeng., 2023, 9, 1 CrossRef PubMed.
- J. Moyer, D. Wilson, I. Finkelshtein, B. Wong and R. Potts, Diabetes Technol. Ther., 2012, 14, 398–402 CrossRef CAS PubMed.
- W. Gao, S. Emaminejad, H. Y. Y. Nyein, S. Challa, K. Chen, A. Peck, H. M. Fahad, H. Ota, H. Shiraki, D. Kiriya, D.-H. Lien, G. A. Brooks, R. W. Davis and A. Javey, Nature, 2016, 529, 509–514 CrossRef CAS PubMed.
- D. Ohayon, G. Nikiforidis, A. Savva, A. Giugni, S. Wustoni, T. Palanisamy, X. Chen, I. P. Maria, E. Di Fabrizio, P. Costa, I. McCulloch and S. Inal, Nat. Mater., 2020, 19, 456–463 CrossRef CAS PubMed.
- W.-Z. Jia, K. Wang and X.-H. Xia, TrAC, Trends Anal. Chem., 2010, 29, 306–318 CrossRef CAS.
- I. Gul, W. Le, Z. Jie, F. Ruiqin, M. Bilal and L. Tang, TrAC, Trends Anal. Chem., 2021, 134, 116145 CrossRef CAS.
- L. D. Mello and L. T. Kubota, Food Chem., 2002, 77, 237–256 CrossRef CAS.
- E. Tønning, S. Sapelnikova, J. Christensen, C. Carlsson, M. Winther-Nielsen, E. Dock, R. Solna, P. Skladal, L. Nørgaard, T. Ruzgas and J. Emnéus, Biosens. Bioelectron., 2005, 21, 608–617 CrossRef PubMed.
- D. T. Jackson and P. N. Nelson, J. Mol. Struct., 2019, 1182, 241–259 CrossRef CAS.
- M. S. Frant and J. W. Ross, Jr., Science, 1966, 154, 1553–1555 CrossRef CAS PubMed.
- L. Hu, L. Gao, M. Di, X. Jiang, X. Wu, X. Yan, X. Li and G. He, Energy Storage Mater., 2021, 34, 648–668 CrossRef.
- Y. Gai, E. Wang, M. Liu, L. Xie, Y. Bai, Y. Yang, J. Xue, X. Qu, Y. Xi, L. Li and D. Luo, Small Methods, 2022, 6, 2200653 CrossRef CAS PubMed.
- S. Roy, M. David-Pur and Y. Hanein, ACS Appl. Mater. Interfaces, 2017, 9, 35169–35177 CrossRef CAS PubMed.
- H. Ryu, D. Thompson, Y. Huang, B. Li and Y. Lei, Sens. Actuators Rep., 2020, 2, 100022 CrossRef.
- W. Gao, H. Y. Y. Nyein, Z. Shahpar, H. M. Fahad, K. Chen, S. Emaminejad, Y. Gao, L.-C. Tai, H. Ota, E. Wu, J. Bullock, Y. Zeng, D.-H. Lien and A. Javey, ACS Sens., 2016, 1, 866–874 CrossRef CAS.
- R. Yang, Y. Qin, L. Dai and Z. L. Wang, Nat. Nanotechnol., 2009, 4, 34–39 CrossRef CAS PubMed.
- Q. Zheng, B. Shi, F. Fan, X. Wang, L. Yan, W. Yuan, S. Wang, H. Liu, Z. Li and Z. L. Wang, Adv. Mater., 2014, 26, 5851–5856 CrossRef CAS PubMed.
- M. Zhu, Q. Shi, T. He, Z. Yi, Y. Ma, B. Yang, T. Chen and C. Lee, ACS Nano, 2019, 13, 1940–1952 CAS.
- C.-H. Chen, P.-W. Lee, Y.-H. Tsao and Z.-H. Lin, Nano Energy, 2017, 42, 241–248 CrossRef CAS.
- D. Yu, Z. Li, W. Xie, D. Li, Z. Li and Y. Li, Nano Energy, 2022, 103, 107762 CrossRef CAS.
- Q. Zheng, B. Shi, Z. Li and Z. L. Wang, Adv. Sci., 2017, 4, 1700029 CrossRef PubMed.
- E. Katz, A. F. Bückmann and I. Willner, J. Am. Chem. Soc., 2001, 123, 10752–10753 CrossRef CAS PubMed.
- H. Lee, S. W. Yoon, E. J. Kim and J. Park, Nano Lett., 2007, 7, 778–784 CrossRef CAS PubMed.
- R. Yu, C. Pan, J. Chen, G. Zhu and Z. L. Wang, Adv. Funct. Mater., 2013, 23, 5868–5874 CrossRef CAS.
- B. J. Hansen, Y. Liu, R. Yang and Z. L. Wang, ACS Nano, 2010, 4, 3647–3652 CrossRef CAS PubMed.
- W. Zhang, H. Guan, T. Zhong, T. Zhao, L. Xing and X. Xue, Nanomicro Lett., 2020, 12, 105 CrossRef CAS PubMed.
- H. Li, T. Chang, Y. Gai, K. Liang, Y. Jiao, D. Li, X. Jiang, Y. Wang, X. Huang, H. Wu, Y. Liu, J. Li, Y. Bai, K. Geng, N. Zhang, H. Meng, D. Huang, Z. Li, X. Yu and L. Chang, Nano Energy, 2022, 92, 106786 CrossRef CAS.
- H. He, H. Zeng, Y. Fu, W. Han, Y. Dai, L. Xing, Y. Zhang and X. Xue, J. Mater. Chem. C, 2018, 6, 9624–9630 RSC.
- T. Zhao, C. Zheng, H. He, H. Guan, T. Zhong, L. Xing and X. Xue, Smart Mater. Struct., 2019, 28, 085015 CrossRef CAS.
- Y. Liu, L. Zhong, S. Zhang, J. Wang and Z. Liu, Sens. Actuators, B, 2022, 354, 131204 CrossRef CAS.
- W. Han, H. He, L. Zhang, C. Dong, H. Zeng, Y. Dai, L. Xing, Y. Zhang and X. Xue, ACS Appl. Mater. Interfaces, 2017, 9, 29526–29537 CrossRef CAS PubMed.
- C. W. Bae, M. V. Chinnamani, E. H. Lee and N.-E. Lee, Adv. Mater., 2022, 9, 2200492 CAS.
- Y. Yang, Y. Song, X. Bo, J. Min, O. S. Pak, L. Zhu, M. Wang, J. Tu, A. Kogan, H. Zhang, T. K. Hsiai, Z. Li and W. Gao, Nat. Biotechnol., 2020, 38, 217–224 CrossRef CAS PubMed.
- M. Mohammadifar, K. Zhang and S. Choi, IEEE, 2017, 16708099 Search PubMed.
- I. Shitanda, Y. Fujimura, S. Nohara, Y. Hoshi, M. Itagaki and S. Tsujimura, J. Electrochem. Soc., 2019, 166, B1063 CrossRef CAS.
- J. Zhang, J. Liu, H. Su, F. Sun, Z. Lu and A. Su, Sens. Actuators, B, 2021, 341, 130046 CrossRef CAS.
- S. Selvarajan, N. R. Alluri, A. Chandrasekhar and S.-J. Kim, Biosens. Bioelectron., 2017, 91, 203–210 CrossRef CAS PubMed.
- Z. Ning, Z. Long, G. Yang, L. Xing and X. Xue, Biosensors, 2022, 12, 164 CrossRef CAS PubMed.
- B. Peng, J. Lu, A. S. Balijepalli, T. C. Major, B. E. Cohan and M. E. Meyerhoff, Biosens. Bioelectron., 2013, 49, 204–209 CrossRef CAS PubMed.
- G. Slaughter and T. Kulkarni, Sci. Rep., 2017, 7, 1471 CrossRef PubMed.
- R. A. Escalona-Villalpando, A. Sandoval-García, J. R. Espinosa L, M. G. Miranda-Silva, L. G. Arriaga, S. D. Minteer and J. Ledesma-García, J. Power Sources, 2021, 515, 230631 CrossRef CAS.
- G. Slaughter and T. Kulkarni, Biosens. Bioelectron., 2016, 78, 45–50 CrossRef CAS PubMed.
- X. Xue, Z. Qu, Y. Fu, B. Yu, L. Xing and Y. Zhang, Nano Energy, 2016, 26, 148–156 CrossRef CAS.
- W. Zhang, L. Zhang, H. Gao, W. Yang, S. Wang, L. Xing and X. Xue, Nanomicro Lett., 2018, 10, 32 Search PubMed.
- H. Cheng, P. Yu, X. Lu, Y. Lin, T. Ohsaka and L. Mao, Analyst, 2013, 138, 179–185 RSC.
- A. Zloczewska, A. Celebanska, K. Szot, D. Tomaszewska, M. Opallo and M. Jönsson-Niedziolka, Biosens. Bioelectron., 2014, 54, 455–461 CrossRef CAS PubMed.
- T. Miyake, K. Haneda, N. Nagai, Y. Yatagawa, H. Onami, S. Yoshino, T. Abe and M. Nishizawa, Energy Environ. Sci., 2011, 4, 5008–5012 RSC.
- F. T. C. Moreira, M. G. F. Sale and M. Di Lorenzo, Biosens. Bioelectron., 2017, 87, 607–614 CrossRef CAS PubMed.
- H. Chen, W. Yang, C. Zhang, M. Wu, W. Li, Y. Zou, L. Lv, H. Yu, H. Ke, R. Liu, Y. Xu, J. Wang and Z. Li, Nano Res., 2022, 15, 2465–2471 CrossRef CAS.
- H. Chen, Y. Xu, J. Zhang, W. Wu and G. Song, Nanomaterials, 2019, 9, 778 CrossRef PubMed.
- A. N. Sekretaryova, V. Beni, M. Eriksson, A. A. Karyakin, A. P. F. Turner and M. Y. Vagin, Anal. Chem., 2014, 86, 9540–9547 CrossRef CAS PubMed.
- A. Ruff, P. Pinyou, M. Nolten, F. Conzuelo and W. Schuhmann, ChemElectroChem, 2017, 4, 890–897 CrossRef CAS.
- Y. Lei, T. Zhao, H. He, T. Zhong, H. Guan, L. Xing, B. Liu and X. Xue, Smart Mater. Struct., 2019, 28, 105001 CrossRef CAS.
- P. Gai, R. Song, C. Zhu, Y. Ji, W. Wang, J.-R. Zhang and J.-J. Zhu, Chem. Commun., 2015, 51, 16763–16766 RSC.
- X. Xue, Y. Fu, Q. Wang, L. Xing and Y. Zhang, Adv. Funct. Mater., 2016, 26, 3128–3138 CrossRef CAS.
- Y. Fu, H. He, T. Zhao, Y. Dai, W. Han, J. Ma, L. Xing, Y. Zhang and X. Xue, Nanomicro Lett., 2018, 10, 76 CAS.
- D. Shen, Y. Xiao, G. Zou, L. Liu, A. Wu, M. Xiao, J. Feng, Z. Hui, W. W. Duley and Y. N. Zhou, Adv. Mater. Technol., 2020, 5, 1900819 CrossRef CAS.
- S. Wang, H. Tai, B. Liu, Z. Duan, Z. Yuan, H. Pan, Y. Su, G. Xie, X. Du and Y. Jiang, Nano Energy, 2019, 58, 312–321 CrossRef CAS.
- Y. Su, S. Chen, B. Liu, H. Lu, X. Luo, C. Chen, W. Li, Y. Long, H. Tai, G. Xie and Y. Jiang, Mater. Today Phys., 2023, 30, 100951 CrossRef CAS.
- I. Kim, H. Roh and D. Kim, Nano Energy, 2019, 65, 103829 Search PubMed.
- Y. Su, J. Wang, B. Wang, T. Yang, B. Yang, G. Xie, Y. Zhou, S. Zhang, H. Tai, Z. Cai, G. Chen, Y. Jiang, L.-Q. Chen and J. Chen, ACS Nano, 2020, 14, 6067–6075 CrossRef CAS PubMed.
- B. Liu, A. Libanori, Y. Zhou, X. Xiao, G. Xie, X. Zhao, Y. Su, S. Wang, Z. Yuan, Z. Duan, J. Liang, Y. Jiang, H. Tai and J. Chen, ACS Appl. Mater. Interfaces, 2022, 14, 7301–7310 CrossRef CAS PubMed.
- D. Wang, D. Zhang, X. Chen, H. Zhang, M. Tang and J. Wang, Nano Energy, 2022, 102, 107711 CrossRef CAS.
- C.-Y. Chang, Y.-H. Cheng and C.-Y. Ho, J. Mater. Chem. A, 2022, 10, 22373–22389 RSC.
- M. Chung, G. Fortunato and N. Radacsi, J. R. Soc., Interface, 2019, 16, 20190217 CrossRef CAS PubMed.
- R. J. Maughan and S. M. Shirreffs, Int. J. Sport Nutr. Exercise Metab., 2008, 18, 457–472 Search PubMed.
- C. P. Coppola, A. P. Kennedy Jr and R. J. Scorpio, Pediatric Surgery, Springer, 2016 Search PubMed.
- B. M. W. Illigens and C. H. Gibbons, Clin. Auton. Res., 2009, 19, 79–87 CrossRef PubMed.
- L. Qiao, M. R. Benzigar, J. A. Subramony, N. H. Lovell and G. Liu, ACS Appl. Mater. Interfaces, 2020, 12, 34337–34361 CrossRef CAS PubMed.
- M. J. Turner and A. P. Avolio, Int. J. Sport Nutr. Exercise Metab., 2016, 26, 377–389 CAS.
- L. B. Baker, Sports Science Exchange, 2016, 28, 1–6 Search PubMed.
- M. Wilschanski, J. Zielenski, D. Markiewicz, L.-C. Tsui, M. Corey, H. Levison and P. R. Durie, J. Pediatr., 1995, 127, 705–710 CrossRef CAS PubMed.
- H. Y. Nyein, W. Gao, Z. Shahpar, S. Emaminejad, S. Challa, K. Chen, H. M. Fahad, L. C. Tai, H. Ota, R. W. Davis and A. Javey, ACS Nano, 2016, 10, 7216–7224 CrossRef CAS PubMed.
- I. L. Schwartz, J. H. Thaysen and V. P. Dole, J. Exp. Med., 1953, 97, 429–437 CrossRef CAS PubMed.
- Q. Han, J. Pang, Y. Li, B.-M. Sun, B. Ibarlucea, X. Liu, T. Gemming, Q. Cheng, S. Zhang, H. Liu, J. Wang, W. Zhou, G. Cuniberti and M. H. Rümmeli, ACS Sens., 2021, 6, 3841–3881 CrossRef CAS PubMed.
- Y. Wang, Y. Shi, D. Mei and Z. Chen, Appl. Energy, 2017, 205, 710–719 CrossRef.
- B. Lee, H. Cho, K. Park, J.-S. Kim, M. Park, H. Kim, Y. Hong and S. Chung, Nat. Commun., 2020, 11(1), 5948 CrossRef CAS PubMed.
- M. Hatamvand, E. Kamrani, M. Lira-Cantú, M. Madsen, B. R. Patil, P. Vivo, M. S. Mehmood, A. Numan, I. Ahmed and Y. Zhan, Nano Energy, 2020, 71, 104609 CrossRef CAS.
- C. Zhang, L. He, L. Zhou, O. Yang, W. Yuan, X. Wei, Y. Liu, L. Lu, J. Wang and Z. L. Wang, Joule, 2021, 5, 1613–1623 CrossRef.
- S. L. Zhang, M. Xu, C. Zhang, Y.-C. Wang, H. Zou, X. He, Z. Wang and Z. L. Wang, Nano Energy, 2018, 48, 421–429 CrossRef CAS.
- Y. Song, J. Min, Y. Yu, H. Wang, Y. Yang, H. Zhang and W. Gao, Sci. Adv., 2020, 6, eaay9842 CrossRef CAS PubMed.
- Y. Yu, J. Nassar, C. Xu, J. Min, Y. Yang, A. Dai, R. Doshi, A. Huang, Y. Song, R. Gehlhar, A. D. Ames and W. Gao, Sci. Robot., 2020, 5(41), eaaz7946 CrossRef PubMed.
- J. Lv, I. Jeerapan, F. Tehrani, L. Yin, C. A. Silva-Lopez, J.-H. Jang, D. Joshuia, R. Shah, Y. Liang, L. Xie, F. Soto, C. Chen, E. Karshalev, C. Kong, Z. Yang and J. Wang, Energy Environ. Sci., 2018, 11, 3431–3442 RSC.
- M. Gröschl, BioEssays, 2009, 31, 843–852 CrossRef PubMed.
- M. A. Javaid, A. S. Ahmed, R. Durand and S. D. Tran, J. Oral. Biol. Craniofac. Res., 2016, 6, 67–76 CrossRef PubMed.
- S. Campuzano, P. Yánez-Sedeño and J. M. Pingarrón, TrAC, Trends Anal. Chem., 2017, 86, 14–24 CrossRef CAS.
- A. G. Tzioufas and E. K. Kapsogeorgou, Nat. Rev. Rheumatol., 2015, 11, 202–203 CrossRef CAS PubMed.
- T. E. Daniels, Adv. Dent. Res., 1996, 10, 3–8 CrossRef CAS PubMed.
- J. T. Saunders, V. Nambi, J. A. de Lemos, L. E. Chambless, S. S. Virani, E. Boerwinkle, R. C. Hoogeveen, X. Liu, B. C. Astor, T. H. Mosley, A. R. Folsom, G. Heiss, J. Coresh and C. M. Ballantyne, Circulation, 2011, 123, 1367–1376 CrossRef CAS PubMed.
- P. V. Rao, A. P. Reddy, X. Lu, S. Dasari, A. Krishnaprasad, E. Biggs, C. T. Roberts, Jr. and S. R. Nagalla, J. Proteome Res., 2009, 8, 239–245 CrossRef CAS PubMed.
- Y. Li, H. Tang, Y. Liu, Y. Qiao, H. Xia and J. Zhou, Biosens. Bioelectron.: X, 2022, 10, 100135 CAS.
- S. Jansod and E. Bakker, Anal. Chem., 2021, 93, 4263–4269 CrossRef CAS PubMed.
- W. Li, CN Pat., CN109342502[P], 2021 Search PubMed.
- I. T. Gug, M. Tertis, O. Hosu and C. Cristea, TrAC, Trends Anal. Chem., 2019, 113, 301–316 CrossRef CAS.
- J. Jing and Y. Gao, Discov. Med., 2018, 25, 57–65 Search PubMed.
- R. J. Johnson, T. Nakagawa, D. Jalal, L. G. Sánchez-Lozada, D. H. Kang and E. Ritz, Nephrol., Dial., Transplant., 2013, 28, 2221–2228 CrossRef CAS PubMed.
- H. Y. Lu, X. Y. Ning, Y. Q. Chen, S. J. Han, P. Chi, S. N. Zhu and Y. Yue, China Med. J., 2018, 131, 1059–1066 CrossRef CAS PubMed.
- H. Lilja, D. Ulmert and A. J. Vickers, Nat. Rev. Cancer, 2008, 8, 268–278 CrossRef CAS PubMed.
- L. Guariguata, D. Whiting, C. Weil and N. Unwin, Diabetes Res. Clin. Pract., 2011, 94, 322–332 CrossRef PubMed.
- A. Matheson, M. D. P. Willcox, J. Flanagan and B. J. Walsh, Diabetes/Metab. Res. Rev., 2010, 26, 150–171 CrossRef CAS PubMed.
- R. G. Barr, D. M. Nathan, J. B. Meigs and D. E. Singer, Ann. Intern. Med., 2002, 137, 263–272 CrossRef PubMed.
- I. Shitanda, M. Momiyama, Y. Hoshi, M. Itagaki and S. Tsujimura, JPhys Energy, 2021, 3, 016001 CrossRef CAS.
- L. Zhou and R. W. Beuerman, Prog. Retinal Eye Res., 2012, 31, 527–550 CrossRef CAS PubMed.
- D. Pankratov, E. González-Arribas, Z. Blum and S. Shleev, Electroanalysis, 2016, 28, 1250–1266 CrossRef CAS.
- J. H. Thaysen and N. A. Thorn, Am. J. Physiol., 1954, 178, 160–164 CrossRef CAS PubMed.
- J. R. Sempionatto, L. C. Brazaca, L. García-Carmona, G. Bolat, A. S. Campbell, A. Martin, G. Tang, R. Shah, R. K. Mishra, J. Kim, V. Zucolotto, A. Escarpa and J. Wang, Biosens. Bioelectron., 2019, 137, 161–170 CrossRef CAS PubMed.
- N. M. Farandos, A. K. Yetisen, M. J. Monteiro, C. R. Lowe and S. H. Yun, Adv. Healthcare Mater., 2015, 4, 792–810 CrossRef CAS PubMed.
- B. Senf, W.-H. Yeo and J.-H. Kim, Biosensors, 2020, 10, 127 CrossRef CAS PubMed.
- C. M. Sturgeon, M. J. Duffy, U.-H. K. Stenman, H. Lilja, N. Brünner, D. W. Chan, R. Babaian, R. C. Bast, Jr., B. Dowell, F. J. Esteva, C. Haglund, N. Harbeck, D. F. Hayes, M. Holten-Andersen, G. G. Klee, R. Lamerz, L. H. Looijenga, R. Molina, H. J. Nielsen, H. Rittenhouse, A. Semjonow, I.-M. Shih, P. Sibley, G. R. Sölétormos, C. Stephan, L. Sokoll, B. R. Hoffman and E. P. Diamandis, Clin. Chem., 2008, 54, e11–e79 CrossRef CAS PubMed.
- R. V. John, T. Devasiya, N. V. R., S. Adigal, J. Lukose, V. B. Kartha and S. Chidangil, Biophys. Rev., 2022, 14, 1023–1050 CrossRef PubMed.
- M. Levi, J. Thachil, T. Iba and J. H. Levy, Lancet Haematol., 2020, 7, e438–e440 CrossRef PubMed.
- P. Gromov, I. Gromova, C. J. Olsen, V. Timmermans-Wielenga, M.-L. Talman, R. Serizawa and J. M. A. Moreira, Biochim. Biophys. Acta, 2013, 1834(11), 2259–2270 CrossRef CAS PubMed.
- M. Otto, J. Wiltfang, H. Tumani, I. Zerr, M. Lantsch, J. Kornhuber, T. Weber, H. A. Kretzschmar and S. Poser, Neurosci. Lett., 1997, 225, 210–212 CrossRef CAS PubMed.
- H. Hampel, S. E. O'Bryant, J. L. Molinuevo, H. Zetterberg, C. L. Masters, S. Lista, S. J. Kiddle, R. Batrla and K. Blennow, Nat. Rev. Neurol., 2018, 14, 639–652 CrossRef PubMed.
- A. Amann, W. Miekisch, J. Schubert, B. Buszewski, T. Ligor, T. Jezierski, J. Pleil and T. Risby, Annu. Rev. Anal. Chem., 2014, 7, 455–482 CrossRef CAS PubMed.
- R. Teranishi, T. R. Mon, A. B. Robinson, P. Cary and L. Pauling, Anal. Chem., 1972, 44, 18–20 CrossRef CAS PubMed.
- H. C. Mckee, J. W. Rhoades, J. Campbell and A. L. Gross, Public Health Rep., 1962, 77(7), 553–554 CrossRef CAS PubMed.
- M. L. Simenhoff, J. F. Burke, J. J. Saukkonen, A. T. Ordinario and R. Doty, N. Engl. J. Med., 1977, 297, 132–135 CrossRef CAS PubMed.
- P. J. Barnes, R. A. Dweik, A. F. Gelb, P. G. Gibson, S. C. George, H. Grasemann, I. D. Pavord, F. Ratjen, P. E. Silkoff, D. R. Taylor and N. Zamel, Chest, 2010, 138, 682–692 CrossRef CAS PubMed.
- F. J. Pasquel and G. E. Umpierrez, Diabetes Care, 2014, 37, 3124–3131 CrossRef CAS PubMed.
- Z.-C. Yuan and B. Hu, J. Anal. Test., 2021, 5, 287–297 CrossRef PubMed.
- A. Kwiatkowski, S. Borys, K. Sikorska, K. Drozdowska and J. M. Smulko, Sci. Rep., 2022, 12, 15990 CrossRef CAS PubMed.
- W. A. Aldhaleei, A. Alnuaimi and A. S. Bhagavathula, Cureus, 2020, 12, e8645 Search PubMed.
- Y. Su, G. Chen, C. Chen, Q. Gong, G. Xie, M. Yao, H. Tai, Y. Jiang and J. Chen, Adv. Mater., 2021, 33, e2101262 CrossRef PubMed.
- H. Wang, H. Wu, D. Hasan, T. He, Q. Shi and C. Lee, ACS Nano, 2017, 11, 10337–10346 CrossRef CAS PubMed.
- K. Shrestha, S. Sharma, G. B. Pradhan, T. Bhatta, P. Maharjan, S. S. Rana, S. Lee, S. Seonu, Y. Shin and J. Y. Park, Adv. Funct. Mater., 2022, 32, 2113005 CrossRef CAS.
- W. Zeng, L. Shu, Q. Li, S. Chen, F. Wang and X.-M. Tao, Adv. Mater., 2014, 26, 5310–5336 CrossRef CAS PubMed.
- R. Zeng, W. Wang, M. Chen, Q. Wan, C. Wang, D. Knopp and D. Tang, Nano Energy, 2021, 82, 105711 CrossRef CAS.
- J. Liu, X. Jiang, R. Zhang, Y. Zhang, L. Wu, W. Lu, J. Li, Y. Li and H. Zhang, Adv. Funct. Mater., 2019, 29, 1807326 CrossRef.
- X. Li, C. Xu, C. Wang, J. Shao, X. Chen, C. Wang, H. Tian, Y. Wang, Q. Yang, L. Wang and B. Lu, Nano Energy, 2017, 40, 646–654 CrossRef CAS.
- S. Lv, Z. Lin, K. Zhang, M. Lu and D. Tang, Anal. Chim. Acta, 2017, 964, 67–73 CrossRef CAS PubMed.
Footnote |
| † Co-first author. |
| This journal is © The Royal Society of Chemistry 2023 |